
The Bancorp Investor Presentation July 2026
Forward Looking Statements & Other Disclosures © The Bancorp | Investor Presentation, July 2026 2 Statements in this presentation regarding The Bancorp, Inc.’s (“The Bancorp”) business, that are not historical facts are “forward-looking statements.” These statements may be identified by the use of forward-looking terminology, including, but not limited to the words “estimate,” “project,” “plan,” “believe,” “expect,” “anticipate,” “intend,” “may,” “will,” “could,” “continue” or the negative thereof and similar terms or expressions. Forward-looking statements include, but are not limited to, statements regarding our anticipated 2026 and 2027 results, including earnings per share accretion, future growth, profitability, productivity and efficiency, the expansion, expected timelines, and implementation of our Fintech initiatives and revenue streams, the possible benefits of our platform restructuring and adoption of AI tools, and share repurchases. These forward-looking statements relate to our current assumptions, projections, and expectations about our business and future events, including current expectations about important economic and political factors, among other factors, and are subject to risks and uncertainties, which could cause the actual results, events, or achievements to differ materially from those set forth in or implied by the forward-looking statements and related assumptions. Factors that could cause results to differ from those expressed in the forward-looking statements also include, but are not limited to, the risks and uncertainties referenced or described in The Bancorp’s filings with the Securities and Exchange Commission, including the “Risk Factors” and “Management’s Discussion and Analysis of Financial Condition and Results of Operations” sections of the Company’s Annual Report on Form 10-K for the fiscal year ended December 31, 2025, and other documents that the Company files from time to time with the Securities and Exchange Commission. The Bancorp does not undertake any duty to publicly revise or update forward-looking statements in this presentation to reflect events or circumstances that arise after the date of this presentation., except as may be required under applicable law. This presentation contains information regarding financial results that is calculated and presented on the basis of methodologies other than in accordance with accounting principles generally accepted in the United States (“GAAP”), such as those identified in the Appendix. Any non-GAAP financial measures used in this presentation are in addition to, and should not be considered superior to, or a substitute for, financial statements prepared in accordance with GAAP. Non-GAAP financial measures are subject to significant inherent limitations. The non-GAAP measures presented herein may not be comparable to similar non-GAAP measures presented by other companies. This presentation includes market, industry and economic data that was obtained from various publicly available sources and other sources believed by the Company to be true. Although the Company believes it to be reliable, the Company has not independently verified any of the data from third party sources referred to in this presentation or analyzed or verified the underlying reports relied upon or referred to by such sources, or ascertained the underlying economic and other assumptions relied upon by such sources. The Company believes that its market, industry, and economic data is accurate and that its estimates and assumptions are reasonable, but there can be no assurance as to the accuracy or completeness thereof. Past performance is not indicative nor a guarantee of future results. Copies of the documents filed by The Bancorp with the SEC are available free of charge from the website of the SEC at www.sec.gov as well as on The Bancorp’s website at www.thebancorp.com..
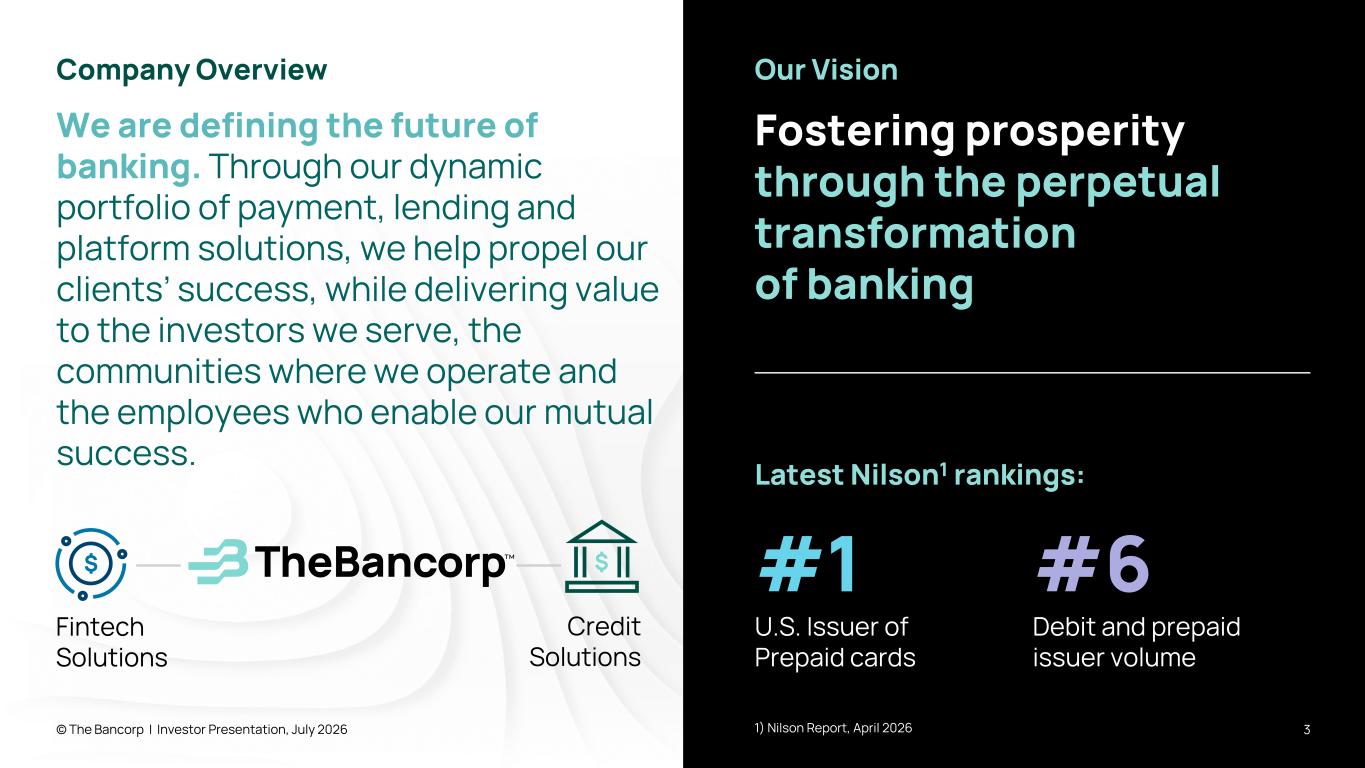
Company Overview 3 We are defining the future of banking. Through our dynamic portfolio of payment, lending and platform solutions, we help propel our clients’ success, while delivering value to the investors we serve, the communities where we operate and the employees who enable our mutual success. Our Vision Fostering prosperity through the perpetual transformation of banking #1 U.S. Issuer of Prepaid cards #6 Debit and prepaid issuer volume Latest Nilson1 rankings: 1) Nilson Report, April 2026 © The Bancorp | Investor Presentation, July 2026 Fintech Solutions Credit Solutions
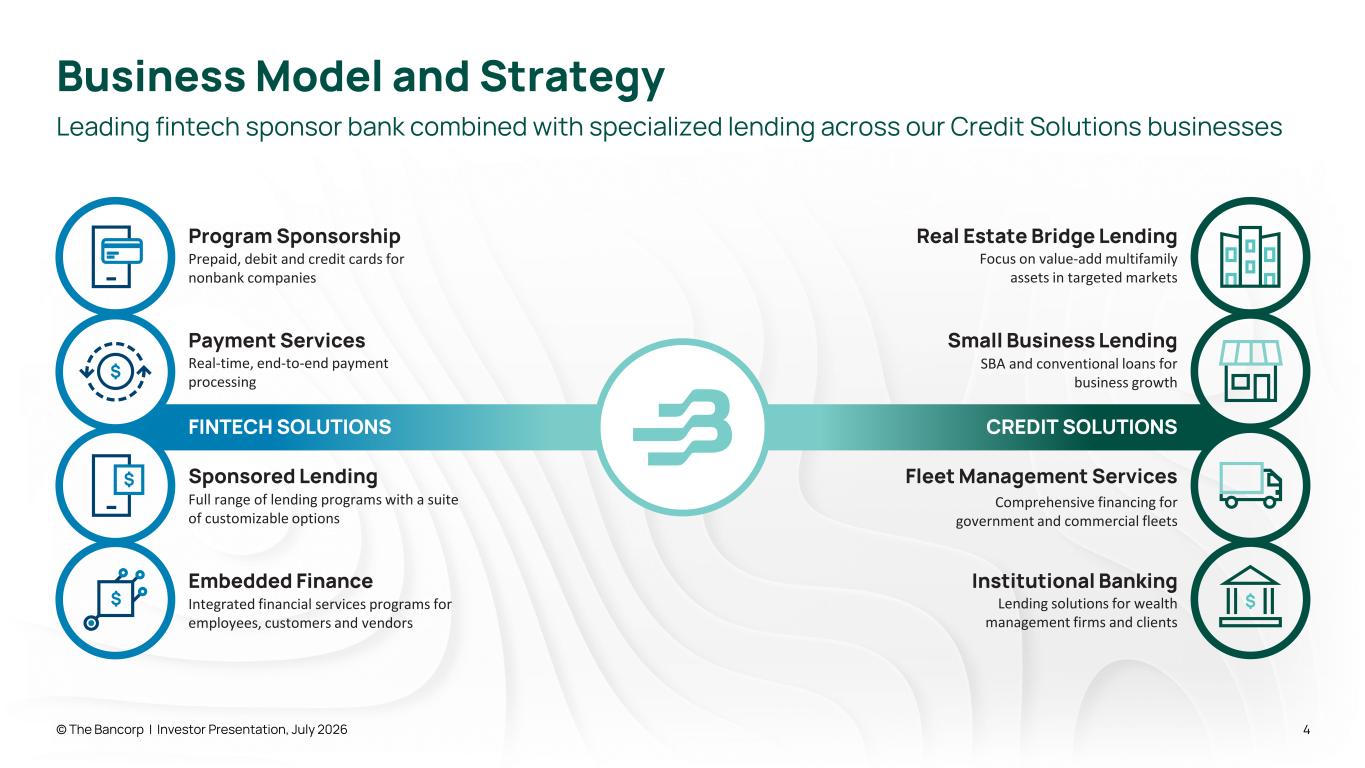
Business Model and Strategy © The Bancorp | Investor Presentation, July 2026 4 Leading fintech sponsor bank combined with specialized lending across our Credit Solutions businesses Real Estate Bridge Lending Focus on value-add multifamily assets in targeted markets Small Business Lending SBA and conventional loans for business growth Fleet Management Services Comprehensive financing for government and commercial fleets Institutional Banking Lending solutions for wealth management firms and clients Sponsored Lending Full range of lending programs with a suite of customizable options CREDIT SOLUTIONSFINTECH SOLUTIONS Payment Services Real-time, end-to-end payment processing Program Sponsorship Prepaid, debit and credit cards for nonbank companies Embedded Finance Integrated financial services programs for employees, customers and vendors
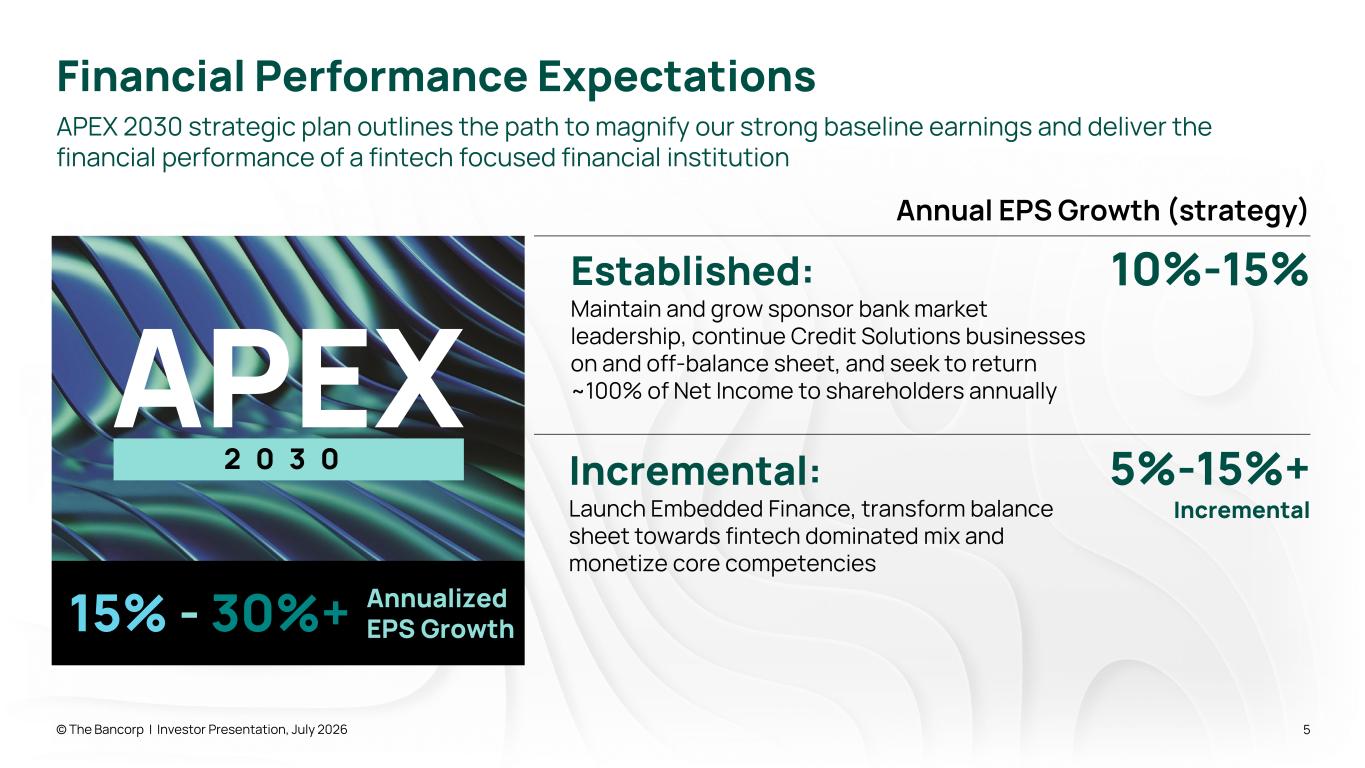
© The Bancorp | Investor Presentation, July 2026 5 Established: Maintain and grow sponsor bank market leadership, continue Credit Solutions businesses on and off-balance sheet, and seek to return ~100% of Net Income to shareholders annually Incremental: Launch Embedded Finance, transform balance sheet towards fintech dominated mix and monetize core competencies Annual EPS Growth (strategy) 10%-15% 5%-15%+ Incremental APEX 2 0 3 0 15% - 30%+ Annualized EPS Growth Financial Performance Expectations APEX 2030 strategic plan outlines the path to magnify our strong baseline earnings and deliver the financial performance of a fintech focused financial institution
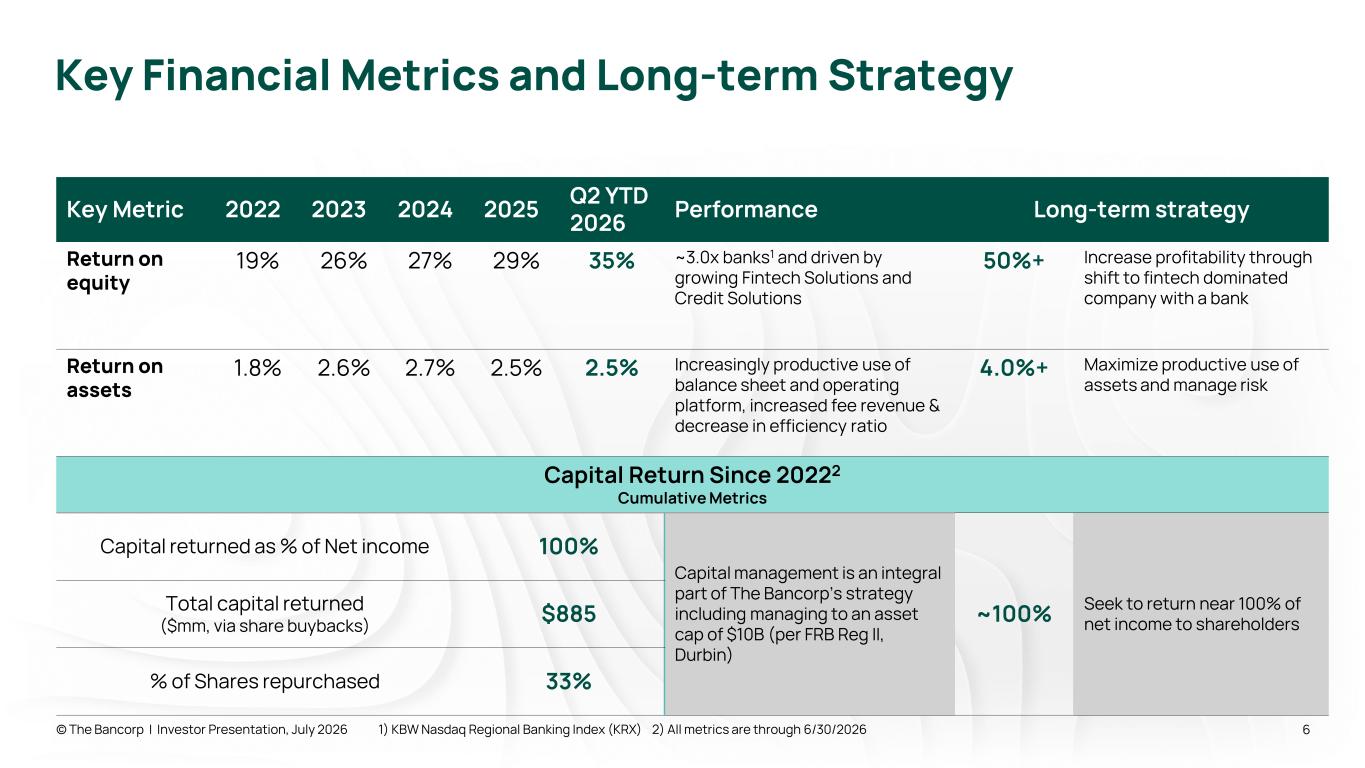
Key Financial Metrics and Long-term Strategy © The Bancorp | Investor Presentation, July 2026 6 Key Metric 2022 2023 2024 2025 Q2 YTD 2026 Performance Long-term strategy Return on equity 19% 26% 27% 29% 35% ~3.0x banks1 and driven by growing Fintech Solutions and Credit Solutions 50%+ Increase profitability through shift to fintech dominated company with a bank Return on assets 1.8% 2.6% 2.7% 2.5% 2.5% Increasingly productive use of balance sheet and operating platform, increased fee revenue & decrease in efficiency ratio 4.0%+ Maximize productive use of assets and manage risk Capital Return Since 20222 Cumulative Metrics Capital returned as % of Net income 100% Capital management is an integral part of The Bancorp’s strategy including managing to an asset cap of $10B (per FRB Reg II, Durbin) ~100% Seek to return near 100% of net income to shareholders Total capital returned ($mm, via share buybacks) $885 % of Shares repurchased 33% 1) KBW Nasdaq Regional Banking Index (KRX) 2) All metrics are through 6/30/2026
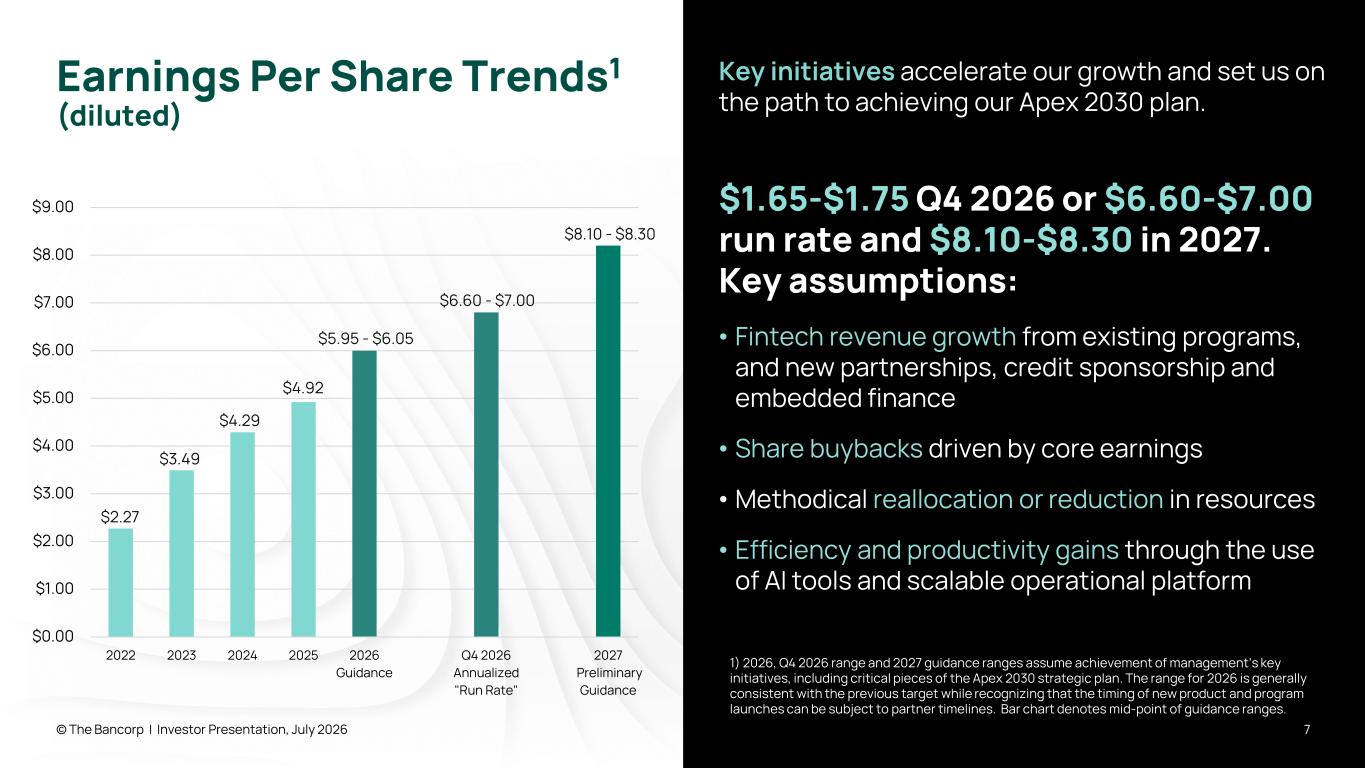
$0.00 $1.00 $2.00 $3.00 $4.00 $5.00 $6.00 $7.00 $8.00 $9.00 2022 2023 2024 2025 2026 Guidance Q4 2026 Annualized "Run Rate" 2027 Preliminary Guidance Earnings Per Share Trends1 (diluted) 7 Key initiatives accelerate our growth and set us on the path to achieving our Apex 2030 plan. $1.65-$1.75 Q4 2026 or $6.60-$7.00 run rate and $8.10-$8.30 in 2027. Key assumptions: • Fintech revenue growth from existing programs, and new partnerships, credit sponsorship and embedded finance • Share buybacks driven by core earnings • Methodical reallocation or reduction in resources • Efficiency and productivity gains through the use of AI tools and scalable operational platform $5.95 - $6.05 $6.60 - $7.00 $8.10 - $8.30 © The Bancorp | Investor Presentation, July 2026 1) 2026, Q4 2026 range and 2027 guidance ranges assume achievement of management’s key initiatives, including critical pieces of the Apex 2030 strategic plan. The range for 2026 is generally consistent with the previous target while recognizing that the timing of new product and program launches can be subject to partner timelines. Bar chart denotes mid-point of guidance ranges. $2.27 $3.49 $4.29 $4.92
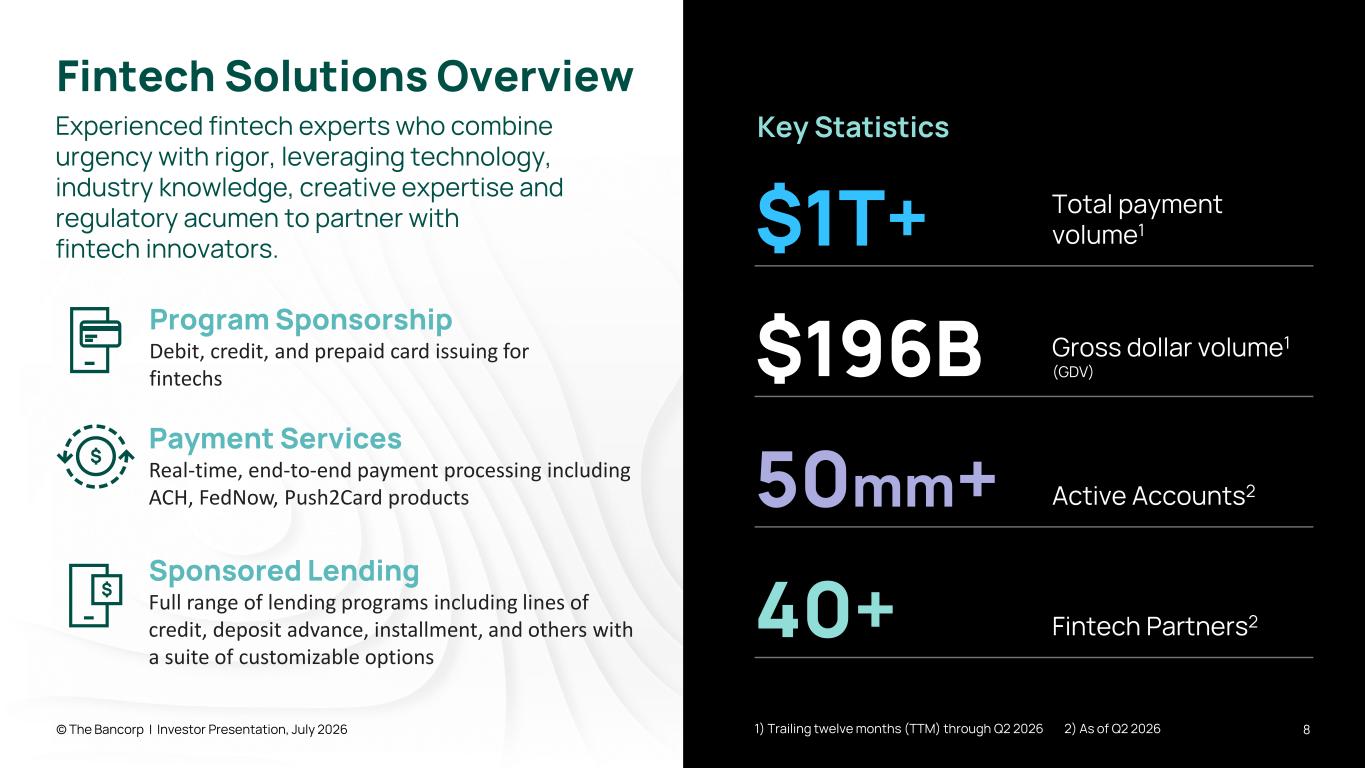
Fintech Solutions Overview © The Bancorp | Investor Presentation, July 2026 8 Key Statistics $1T+ Total payment volume1 $196B Gross dollar volume1 (GDV) 50mm+ Active Accounts2 40+ Fintech Partners2 1) Trailing twelve months (TTM) through Q2 2026 2) As of Q2 2026 Program Sponsorship Debit, credit, and prepaid card issuing for fintechs Sponsored Lending Full range of lending programs including lines of credit, deposit advance, installment, and others with a suite of customizable options Payment Services Real-time, end-to-end payment processing including ACH, FedNow, Push2Card products Experienced fintech experts who combine urgency with rigor, leveraging technology, industry knowledge, creative expertise and regulatory acumen to partner with fintech innovators.
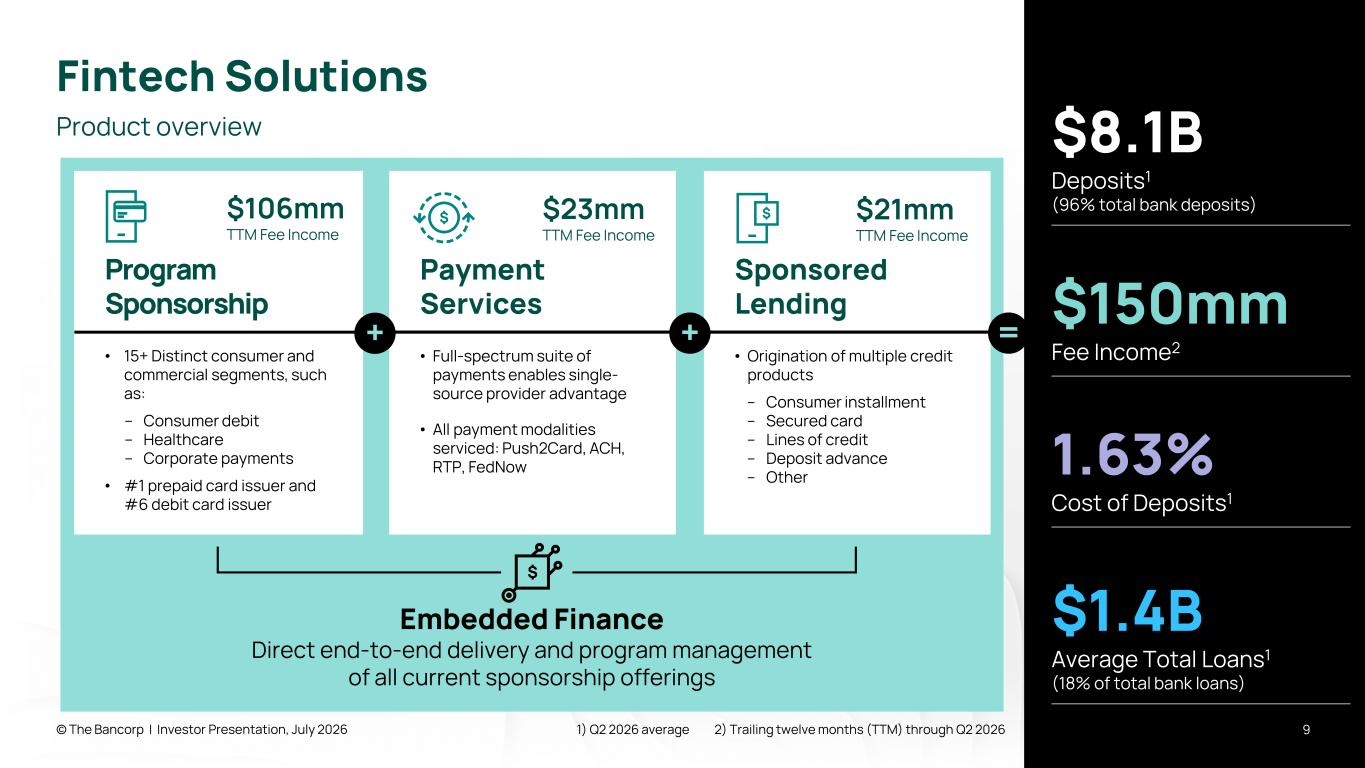
Embedded Finance Direct end-to-end delivery and program management of all current sponsorship offerings Fintech Solutions © The Bancorp | Investor Presentation, July 2026 9 Product overview $8.1B Deposits1 (96% total bank deposits) $150mm Fee Income2 1.63% Cost of Deposits1 $1.4B Average Total Loans1 (18% of total bank loans) Sponsored Lending • Origination of multiple credit products – Consumer installment – Secured card – Lines of credit – Deposit advance – Other $21mm TTM Fee Income 1) Q2 2026 average 2) Trailing twelve months (TTM) through Q2 2026 Payment Services • Full-spectrum suite of payments enables single- source provider advantage • All payment modalities serviced: Push2Card, ACH, RTP, FedNow $23mm TTM Fee Income Program Sponsorship • 15+ Distinct consumer and commercial segments, such as: – Consumer debit – Healthcare – Corporate payments • #1 prepaid card issuer and #6 debit card issuer $106mm TTM Fee Income + =+
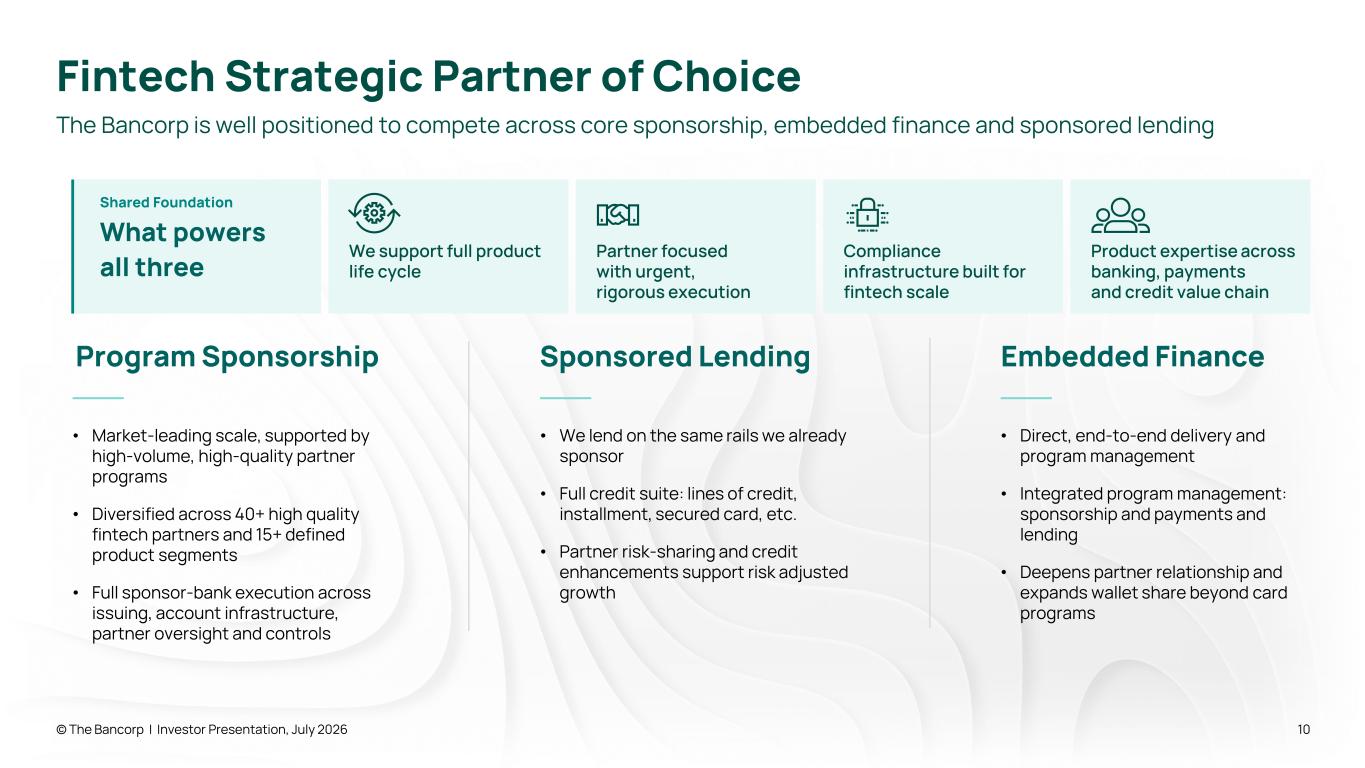
Fintech Strategic Partner of Choice © The Bancorp | Investor Presentation, July 2026 10 The Bancorp is well positioned to compete across core sponsorship, embedded finance and sponsored lending Shared Foundation What powers all three Program Sponsorship • Market-leading scale, supported by high-volume, high-quality partner programs • Diversified across 40+ high quality fintech partners and 15+ defined product segments • Full sponsor-bank execution across issuing, account infrastructure, partner oversight and controls Sponsored Lending • We lend on the same rails we already sponsor • Full credit suite: lines of credit, installment, secured card, etc. • Partner risk-sharing and credit enhancements support risk adjusted growth Embedded Finance • Direct, end-to-end delivery and program management • Integrated program management: sponsorship and payments and lending • Deepens partner relationship and expands wallet share beyond card programs We support full product life cycle Partner focused with urgent, rigorous execution Compliance infrastructure built for fintech scale Product expertise across banking, payments and credit value chain
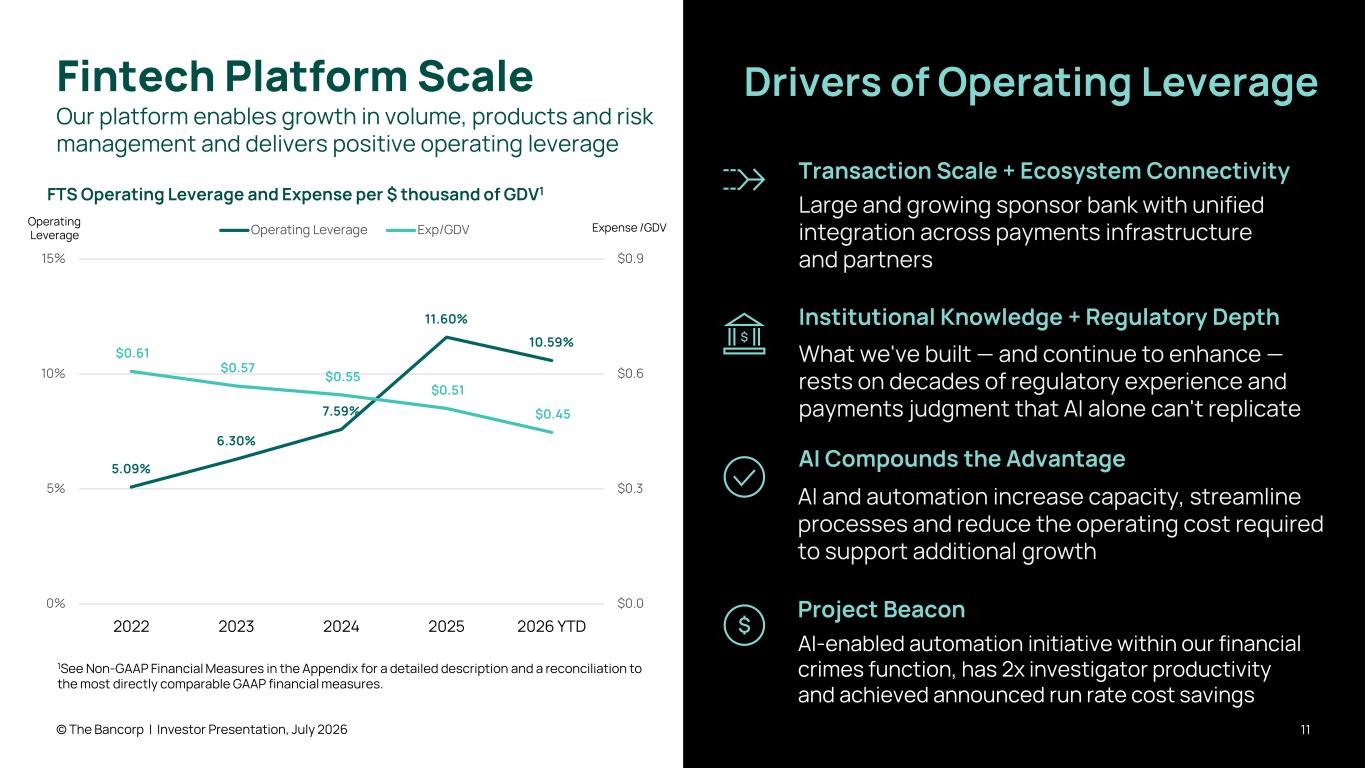
Fintech Platform Scale © The Bancorp | Investor Presentation, July 2026 11 Our platform enables growth in volume, products and risk management and delivers positive operating leverage Drivers of Operating Leverage Transaction Scale + Ecosystem Connectivity Large and growing sponsor bank with unified integration across payments infrastructure and partners AI Compounds the Advantage What we've built — and continue to enhance — rests on decades of regulatory experience and payments judgment that AI alone can't replicate Institutional Knowledge + Regulatory Depth AI and automation increase capacity, streamline processes and reduce the operating cost required to support additional growth 1See Non-GAAP Financial Measures in the Appendix for a detailed description and a reconciliation to the most directly comparable GAAP financial measures. Project Beacon AI-enabled automation initiative within our financial crimes function, has 2x investigator productivity and achieved announced run rate cost savings FTS Operating Leverage and Expense per $ thousand of GDV1 Operating Leverage Expense /GDV 5.09% 6.30% 7.59% 11.60% 10.59% $0.61 $0.57 $0.55 $0.51 $0.45 $0.0 $0.3 $0.6 $0.9 0% 5% 10% 15% 2022 2023 2024 2025 2026 YTD Operating Leverage Exp/GDV
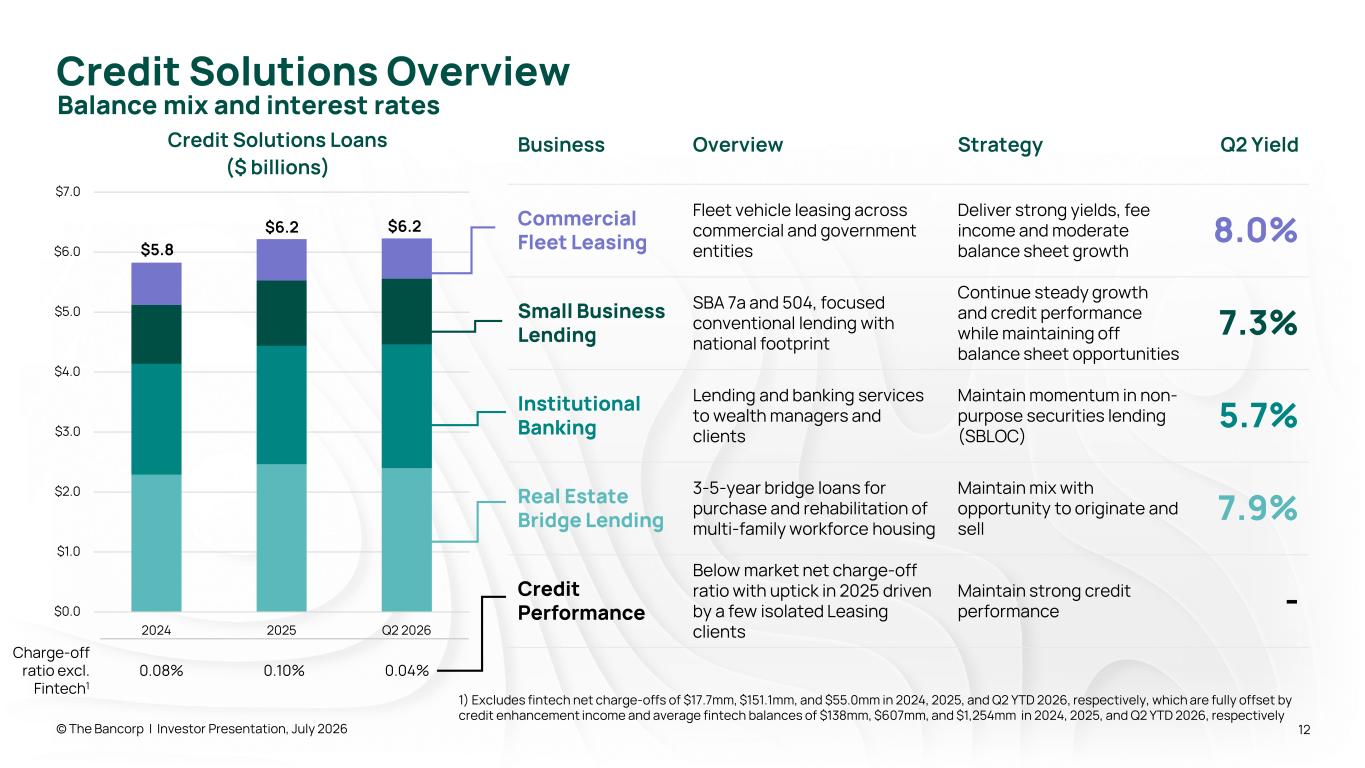
$0.0 $1.0 $2.0 $3.0 $4.0 $5.0 $6.0 $7.0 2024 2025 Q2 2026 Credit Solutions Loans ($ billions) © The Bancorp | Investor Presentation, July 2026 12 Business Overview Strategy Q2 Yield Commercial Fleet Leasing Fleet vehicle leasing across commercial and government entities Deliver strong yields, fee income and moderate balance sheet growth 8.0% Small Business Lending SBA 7a and 504, focused conventional lending with national footprint Continue steady growth and credit performance while maintaining off balance sheet opportunities 7.3% Institutional Banking Lending and banking services to wealth managers and clients Maintain momentum in non- purpose securities lending (SBLOC) 5.7% Real Estate Bridge Lending 3-5-year bridge loans for purchase and rehabilitation of multi-family workforce housing Maintain mix with opportunity to originate and sell 7.9% Credit Performance Below market net charge-off ratio with uptick in 2025 driven by a few isolated Leasing clients Maintain strong credit performance - Charge-off ratio excl. Fintech1 0.08% 0.10% 0.04% Balance mix and interest rates Credit Solutions Overview $6.2$6.2 $5.8 1) Excludes fintech net charge-offs of $17.7mm, $151.1mm, and $55.0mm in 2024, 2025, and Q2 YTD 2026, respectively, which are fully offset by credit enhancement income and average fintech balances of $138mm, $607mm, and $1,254mm in 2024, 2025, and Q2 YTD 2026, respectively
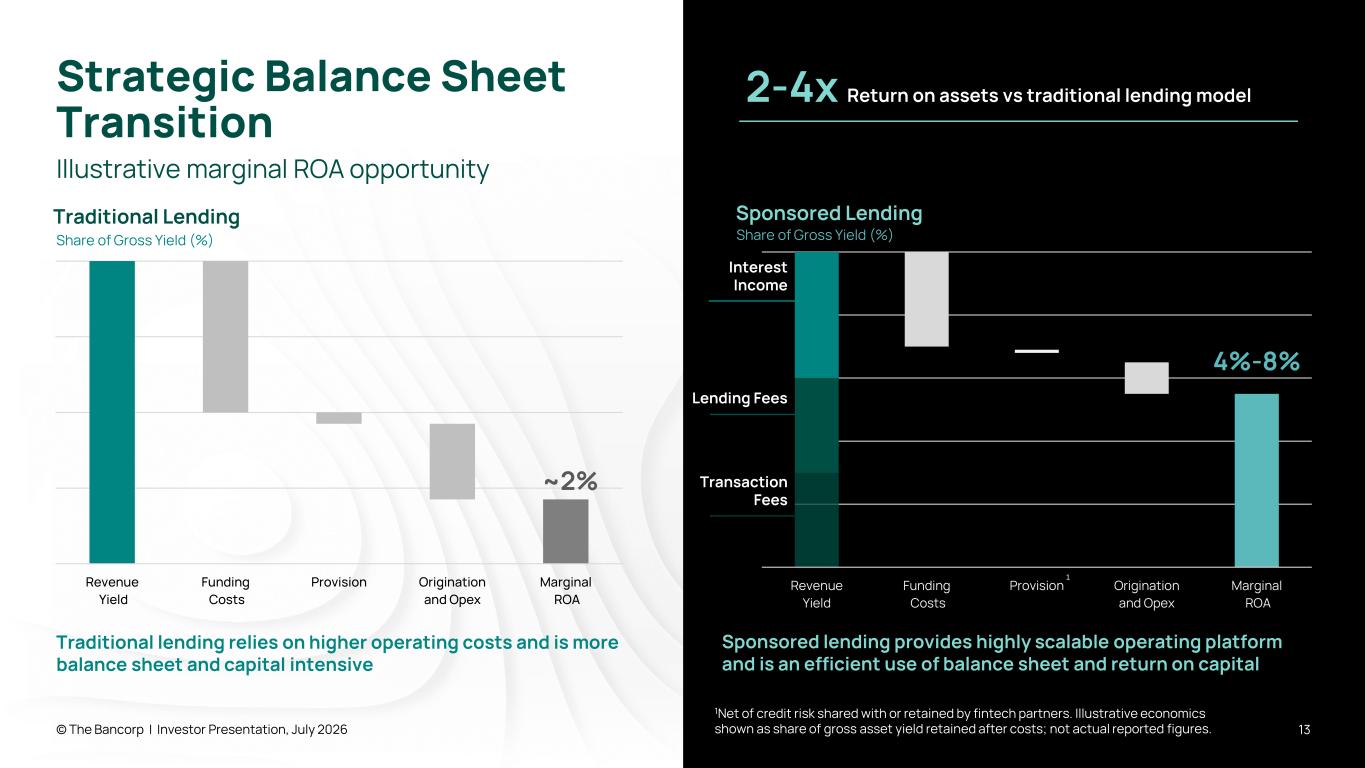
Revenue Yield Funding Costs Provision Origination and Opex Marginal ROA Sponsored Lending Strategic Balance Sheet Transition © The Bancorp | Investor Presentation, July 2026 13 Illustrative marginal ROA opportunity Revenue Yield Funding Costs Provision Origination and Opex Marginal ROA Traditional Lending Share of Gross Yield (%) 4%-8% Share of Gross Yield (%) ~2% Traditional lending relies on higher operating costs and is more balance sheet and capital intensive Sponsored lending provides highly scalable operating platform and is an efficient use of balance sheet and return on capital 1Net of credit risk shared with or retained by fintech partners. Illustrative economics shown as share of gross asset yield retained after costs; not actual reported figures. 1 2-4x Return on assets vs traditional lending model Lending Fees Interest Income Transaction Fees
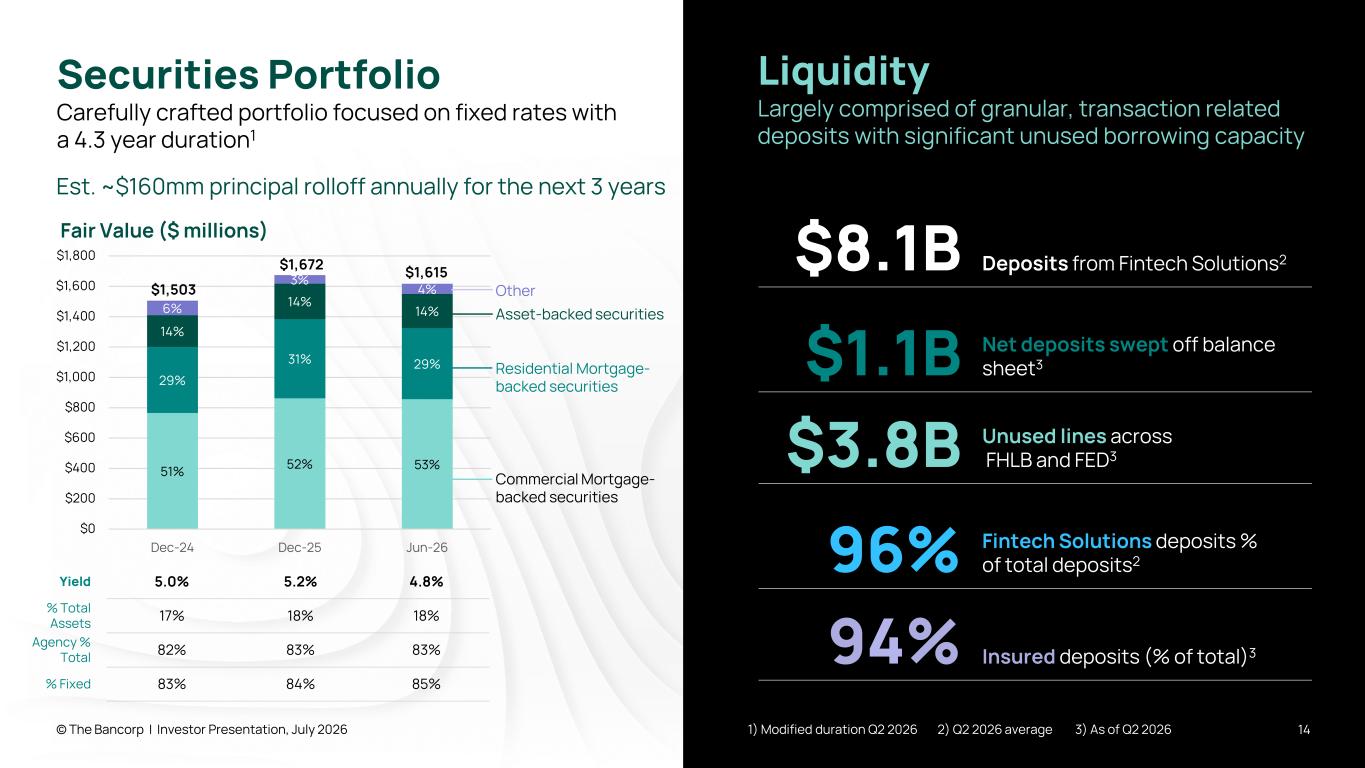
51% 52% 53% 29% 31% 29% 14% 14% 14%6% 3% 4% $0 $200 $400 $600 $800 $1,000 $1,200 $1,400 $1,600 $1,800 Dec-24 Dec-25 Jun-26 Fair Value ($ millions) © The Bancorp | Investor Presentation, July 2026 14 Securities Portfolio Carefully crafted portfolio focused on fixed rates with a 4.3 year duration1 Yield 5.0% 5.2% 4.8% % Total Assets 17% 18% 18% Agency % Total 82% 83% 83% % Fixed 83% 84% 85% Commercial Mortgage- backed securities Other Residential Mortgage- backed securities Asset-backed securities Liquidity Largely comprised of granular, transaction related deposits with significant unused borrowing capacity $8.1B Deposits from Fintech Solutions2 $1.1B Net deposits swept off balance sheet3 $3.8B Unused lines across FHLB and FED3 96% Fintech Solutions deposits % of total deposits2 94% Insured deposits (% of total)3 1) Modified duration Q2 2026 2) Q2 2026 average 3) As of Q2 2026 Est. ~$160mm principal rolloff annually for the next 3 years $1,615$1,672 $1,503
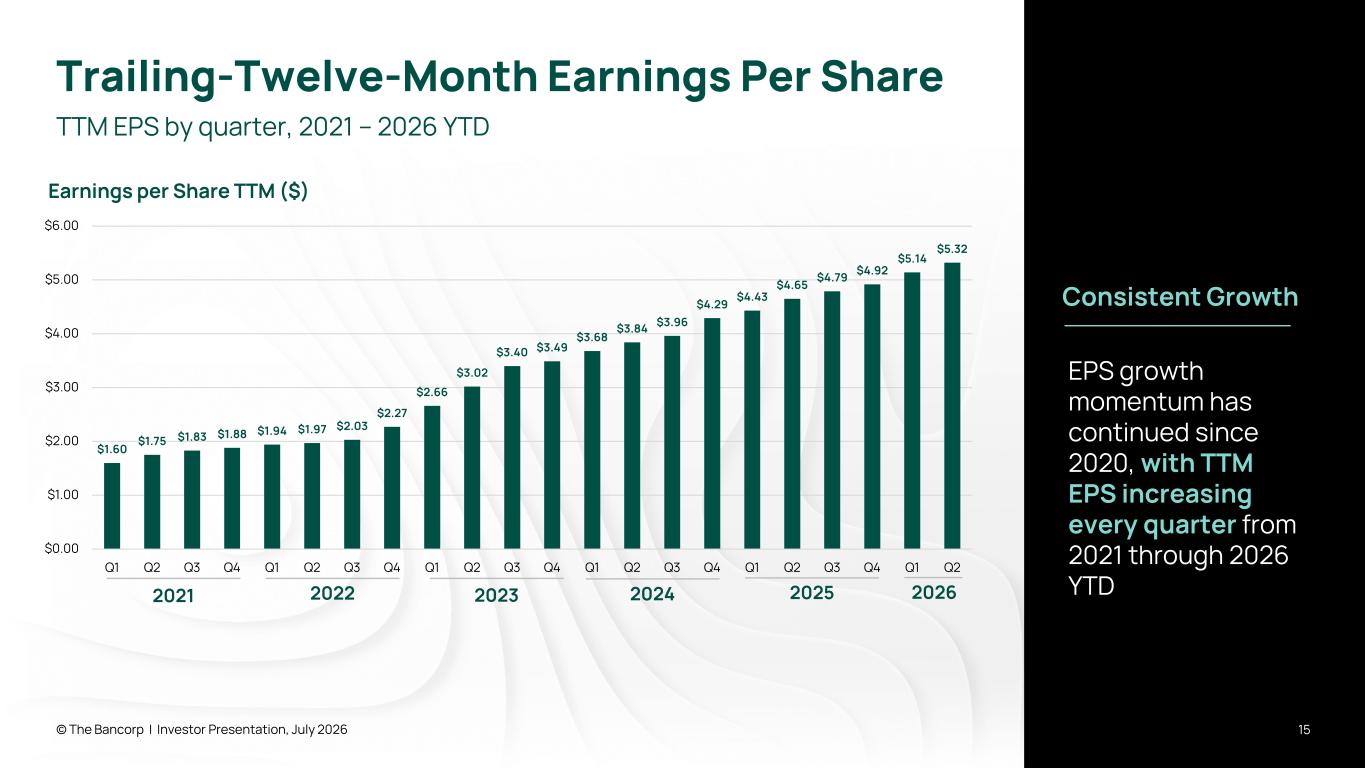
Trailing-Twelve-Month Earnings Per Share © The Bancorp | Investor Presentation, July 2026 15 TTM EPS by quarter, 2021 – 2026 YTD 2023 2024 202520222021 2026 EPS growth momentum has continued since 2020, with TTM EPS increasing every quarter from 2021 through 2026 YTD $1.60 $1.75 $1.83 $1.88 $1.94 $1.97 $2.03 $2.27 $2.66 $3.02 $3.40 $3.49 $3.68 $3.84 $3.96 $4.29 $4.43 $4.65 $4.79 $4.92 $5.14 $5.32 $0.00 $1.00 $2.00 $3.00 $4.00 $5.00 $6.00 Q1 Q2 Q3 Q4 Q1 Q2 Q3 Q4 Q1 Q2 Q3 Q4 Q1 Q2 Q3 Q4 Q1 Q2 Q3 Q4 Q1 Q2 Earnings per Share TTM ($) Consistent Growth
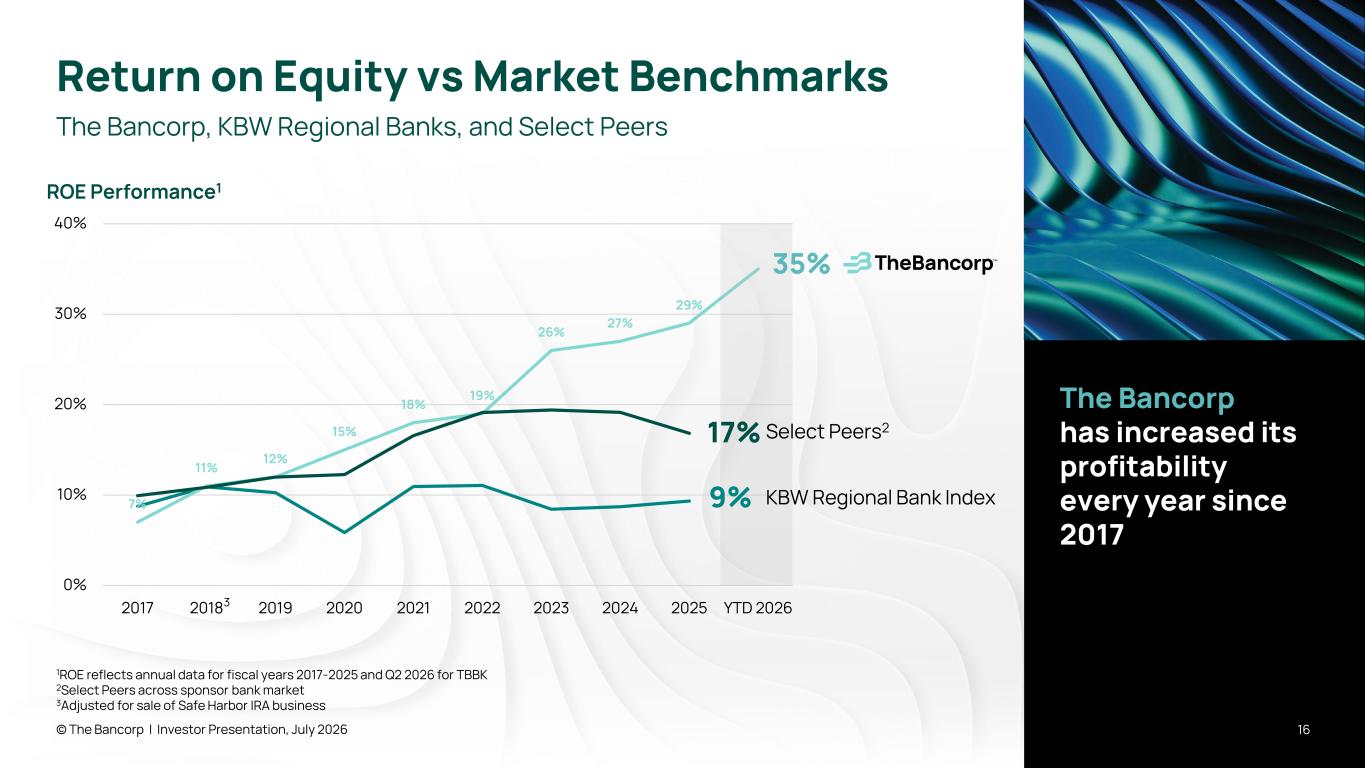
7% 11% 12% 15% 18% 19% 26% 27% 29% 0% 10% 20% 30% 40% 2017 2018 2019 2020 2021 2022 2023 2024 2025 YTD 2026 ROE Performance1 Return on Equity vs Market Benchmarks © The Bancorp | Investor Presentation, July 2026 16 The Bancorp, KBW Regional Banks, and Select Peers 3 35% KBW Regional Bank Index 17% Select Peers2 1ROE reflects annual data for fiscal years 2017-2025 and Q2 2026 for TBBK 2Select Peers across sponsor bank market 3Adjusted for sale of Safe Harbor IRA business The Bancorp has increased its profitability every year since 2017 9%
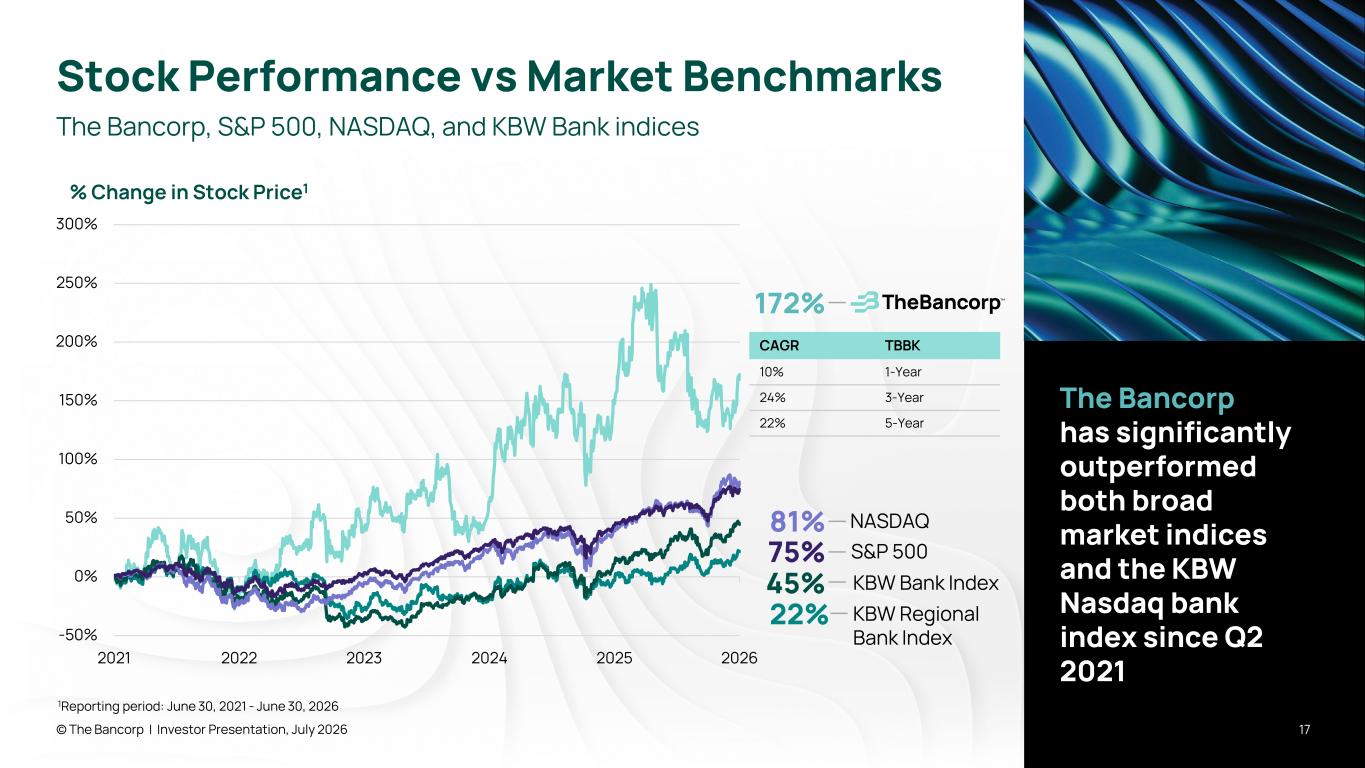
Stock Performance vs Market Benchmarks © The Bancorp | Investor Presentation, July 2026 17 The Bancorp, S&P 500, NASDAQ, and KBW Bank indices The Bancorp has significantly outperformed both broad market indices and the KBW Nasdaq bank index since Q2 2021 172% 75% 45% S&P 500 KBW Bank Index 81% NASDAQ CAGR TBBK 10% 1-Year 24% 3-Year 22% 5-Year KBW Regional Bank Index 22% 1Reporting period: June 30, 2021 - June 30, 2026 -50% 0% 50% 100% 150% 200% 250% 300% 2021 2022 2023 2024 2025 2026 % Change in Stock Price1

Appendix © The Bancorp | Investor Presentation, July 2026 18
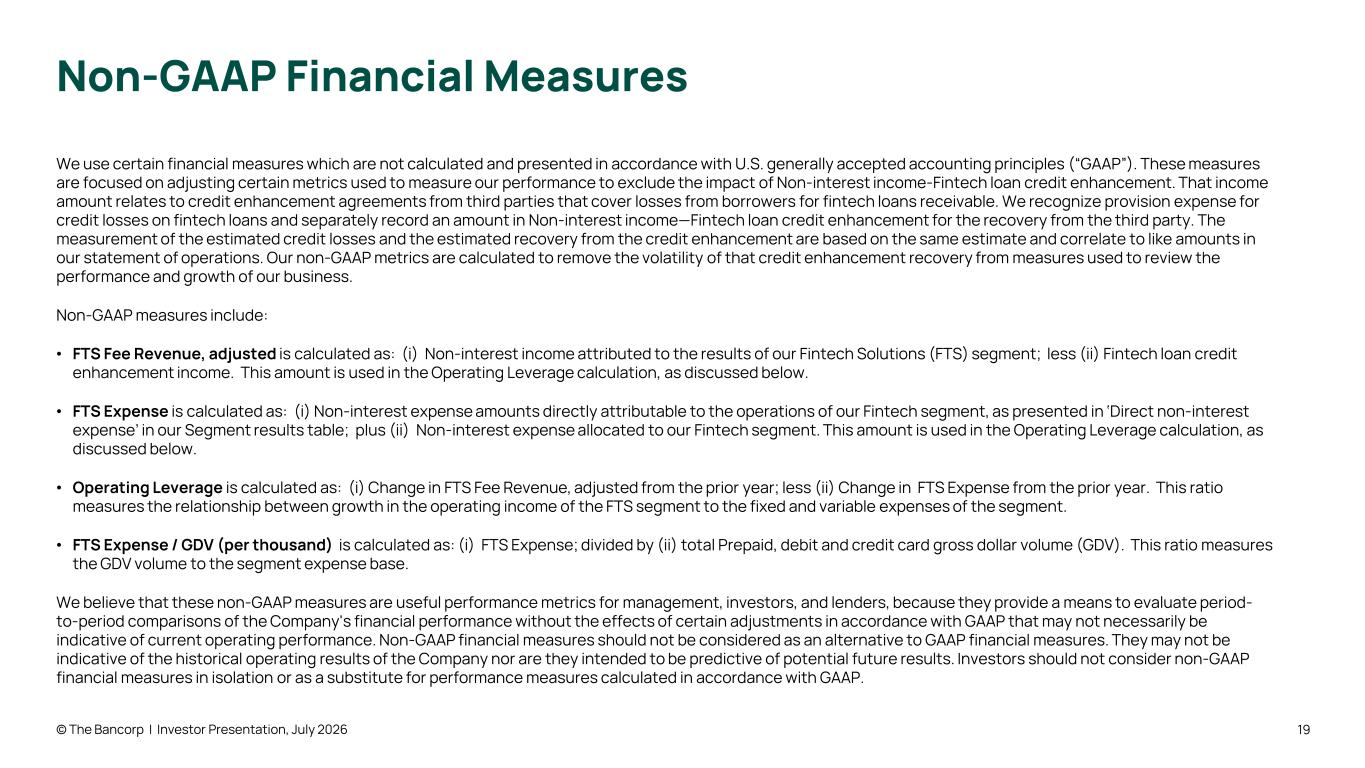
Non-GAAP Financial Measures We use certain financial measures which are not calculated and presented in accordance with U.S. generally accepted accounting principles (“GAAP”). These measures are focused on adjusting certain metrics used to measure our performance to exclude the impact of Non-interest income-Fintech loan credit enhancement. That income amount relates to credit enhancement agreements from third parties that cover losses from borrowers for fintech loans receivable. We recognize provision expense for credit losses on fintech loans and separately record an amount in Non-interest income—Fintech loan credit enhancement for the recovery from the third party. The measurement of the estimated credit losses and the estimated recovery from the credit enhancement are based on the same estimate and correlate to like amounts in our statement of operations. Our non-GAAP metrics are calculated to remove the volatility of that credit enhancement recovery from measures used to review the performance and growth of our business. Non-GAAP measures include: • FTS Fee Revenue, adjusted is calculated as: (i) Non-interest income attributed to the results of our Fintech Solutions (FTS) segment; less (ii) Fintech loan credit enhancement income. This amount is used in the Operating Leverage calculation, as discussed below. • FTS Expense is calculated as: (i) Non-interest expense amounts directly attributable to the operations of our Fintech segment, as presented in ‘Direct non-interest expense’ in our Segment results table; plus (ii) Non-interest expense allocated to our Fintech segment. This amount is used in the Operating Leverage calculation, as discussed below. • Operating Leverage is calculated as: (i) Change in FTS Fee Revenue, adjusted from the prior year; less (ii) Change in FTS Expense from the prior year. This ratio measures the relationship between growth in the operating income of the FTS segment to the fixed and variable expenses of the segment. • FTS Expense / GDV (per thousand) is calculated as: (i) FTS Expense; divided by (ii) total Prepaid, debit and credit card gross dollar volume (GDV). This ratio measures the GDV volume to the segment expense base. We believe that these non-GAAP measures are useful performance metrics for management, investors, and lenders, because they provide a means to evaluate period- to-period comparisons of the Company's financial performance without the effects of certain adjustments in accordance with GAAP that may not necessarily be indicative of current operating performance. Non-GAAP financial measures should not be considered as an alternative to GAAP financial measures. They may not be indicative of the historical operating results of the Company nor are they intended to be predictive of potential future results. Investors should not consider non-GAAP financial measures in isolation or as a substitute for performance measures calculated in accordance with GAAP. © The Bancorp | Investor Presentation, July 2026 19
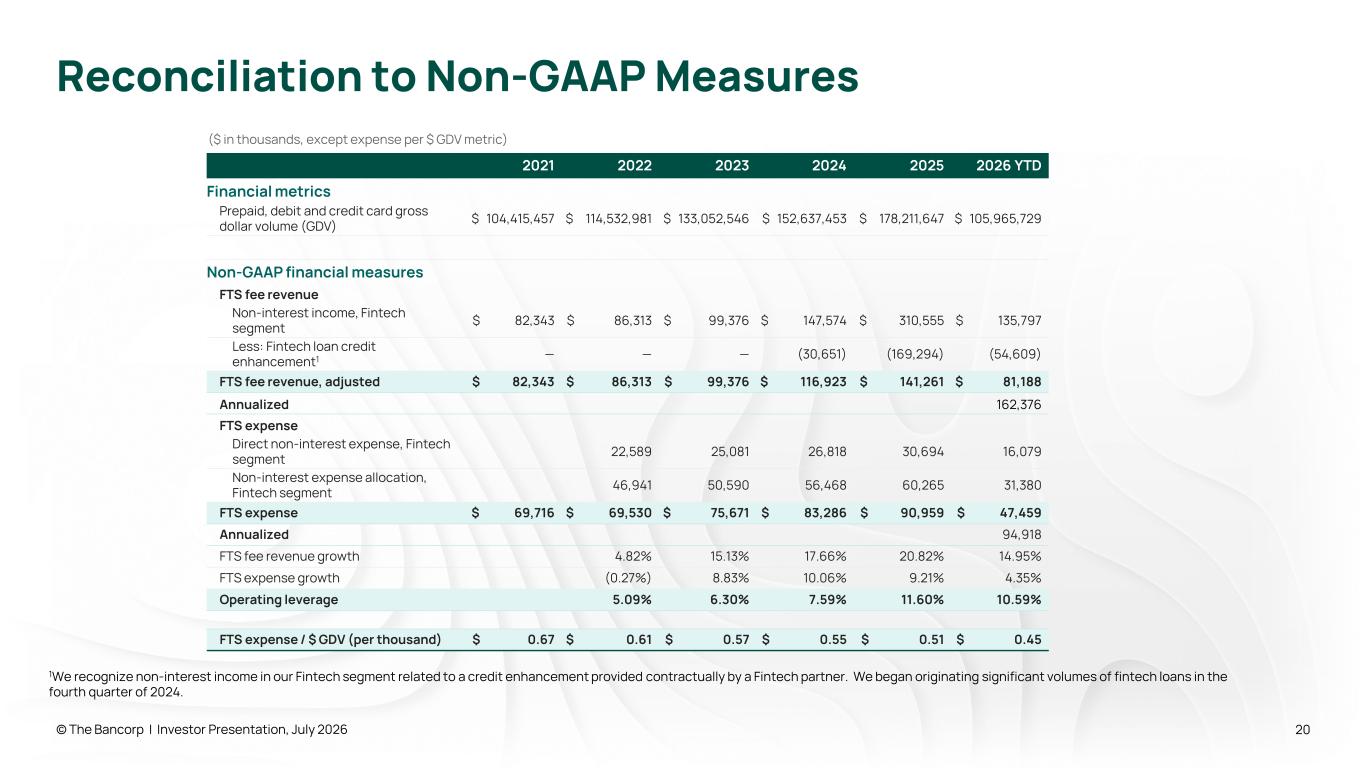
Reconciliation to Non-GAAP Measures © The Bancorp | Investor Presentation, July 2026 2021 2022 2023 2024 2025 2026 YTD Financial metrics Prepaid, debit and credit card gross dollar volume (GDV) $ 104,415,457 $ 114,532,981 $ 133,052,546 $ 152,637,453 $ 178,211,647 $ 105,965,729 Non-GAAP financial measures FTS fee revenue Non-interest income, Fintech segment $ 82,343 $ 86,313 $ 99,376 $ 147,574 $ 310,555 $ 135,797 Less: Fintech loan credit enhancement1 — — — (30,651) (169,294) (54,609) FTS fee revenue, adjusted $ 82,343 $ 86,313 $ 99,376 $ 116,923 $ 141,261 $ 81,188 Annualized 162,376 FTS expense Direct non-interest expense, Fintech segment 22,589 25,081 26,818 30,694 16,079 Non-interest expense allocation, Fintech segment 46,941 50,590 56,468 60,265 31,380 FTS expense $ 69,716 $ 69,530 $ 75,671 $ 83,286 $ 90,959 $ 47,459 Annualized 94,918 FTS fee revenue growth 4.82% 15.13% 17.66% 20.82% 14.95% FTS expense growth (0.27%) 8.83% 10.06% 9.21% 4.35% Operating leverage 5.09% 6.30% 7.59% 11.60% 10.59% FTS expense / $ GDV (per thousand) $ 0.67 $ 0.61 $ 0.57 $ 0.55 $ 0.51 $ 0.45 ($ in thousands, except expense per $ GDV metric) 1We recognize non-interest income in our Fintech segment related to a credit enhancement provided contractually by a Fintech partner. We began originating significant volumes of fintech loans in the fourth quarter of 2024. 20
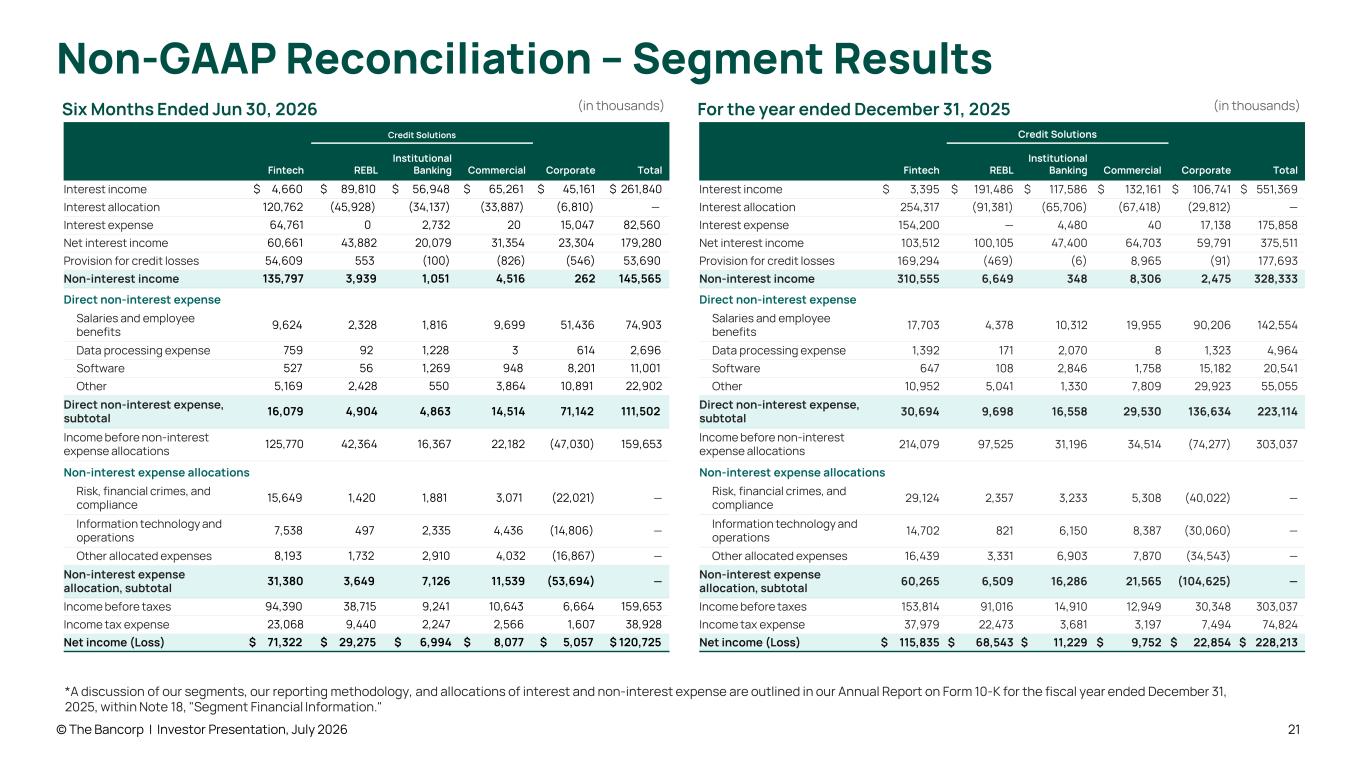
Six Months Ended Jun 30, 2026 Fintech Credit Solutions Corporate TotalREBL Institutional Banking Commercial Interest income $ 4,660 $ 89,810 $ 56,948 $ 65,261 $ 45,161 $ 261,840 Interest allocation 120,762 (45,928) (34,137) (33,887) (6,810) — Interest expense 64,761 0 2,732 20 15,047 82,560 Net interest income 60,661 43,882 20,079 31,354 23,304 179,280 Provision for credit losses 54,609 553 (100) (826) (546) 53,690 Non-interest income 135,797 3,939 1,051 4,516 262 145,565 Direct non-interest expense Salaries and employee benefits 9,624 2,328 1,816 9,699 51,436 74,903 Data processing expense 759 92 1,228 3 614 2,696 Software 527 56 1,269 948 8,201 11,001 Other 5,169 2,428 550 3,864 10,891 22,902 Direct non-interest expense, subtotal 16,079 4,904 4,863 14,514 71,142 111,502 Income before non-interest expense allocations 125,770 42,364 16,367 22,182 (47,030) 159,653 Non-interest expense allocations Risk, financial crimes, and compliance 15,649 1,420 1,881 3,071 (22,021) — Information technology and operations 7,538 497 2,335 4,436 (14,806) — Other allocated expenses 8,193 1,732 2,910 4,032 (16,867) — Non-interest expense allocation, subtotal 31,380 3,649 7,126 11,539 (53,694) — Income before taxes 94,390 38,715 9,241 10,643 6,664 159,653 Income tax expense 23,068 9,440 2,247 2,566 1,607 38,928 Net income (Loss) $ 71,322 $ 29,275 $ 6,994 $ 8,077 $ 5,057 $ 120,725 © The Bancorp | Investor Presentation, July 2026 (in thousands) For the year ended December 31, 2025 Fintech Credit Solutions Corporate TotalREBL Institutional Banking Commercial Interest income $ 3,395 $ 191,486 $ 117,586 $ 132,161 $ 106,741 $ 551,369 Interest allocation 254,317 (91,381) (65,706) (67,418) (29,812) — Interest expense 154,200 — 4,480 40 17,138 175,858 Net interest income 103,512 100,105 47,400 64,703 59,791 375,511 Provision for credit losses 169,294 (469) (6) 8,965 (91) 177,693 Non-interest income 310,555 6,649 348 8,306 2,475 328,333 Direct non-interest expense Salaries and employee benefits 17,703 4,378 10,312 19,955 90,206 142,554 Data processing expense 1,392 171 2,070 8 1,323 4,964 Software 647 108 2,846 1,758 15,182 20,541 Other 10,952 5,041 1,330 7,809 29,923 55,055 Direct non-interest expense, subtotal 30,694 9,698 16,558 29,530 136,634 223,114 Income before non-interest expense allocations 214,079 97,525 31,196 34,514 (74,277) 303,037 Non-interest expense allocations Risk, financial crimes, and compliance 29,124 2,357 3,233 5,308 (40,022) — Information technology and operations 14,702 821 6,150 8,387 (30,060) — Other allocated expenses 16,439 3,331 6,903 7,870 (34,543) — Non-interest expense allocation, subtotal 60,265 6,509 16,286 21,565 (104,625) — Income before taxes 153,814 91,016 14,910 12,949 30,348 303,037 Income tax expense 37,979 22,473 3,681 3,197 7,494 74,824 Net income (Loss) $ 115,835 $ 68,543 $ 11,229 $ 9,752 $ 22,854 $ 228,213 (in thousands) *A discussion of our segments, our reporting methodology, and allocations of interest and non-interest expense are outlined in our Annual Report on Form 10-K for the fiscal year ended December 31, 2025, within Note 18, "Segment Financial Information." 21 Non-GAAP Reconciliation – Segment Results
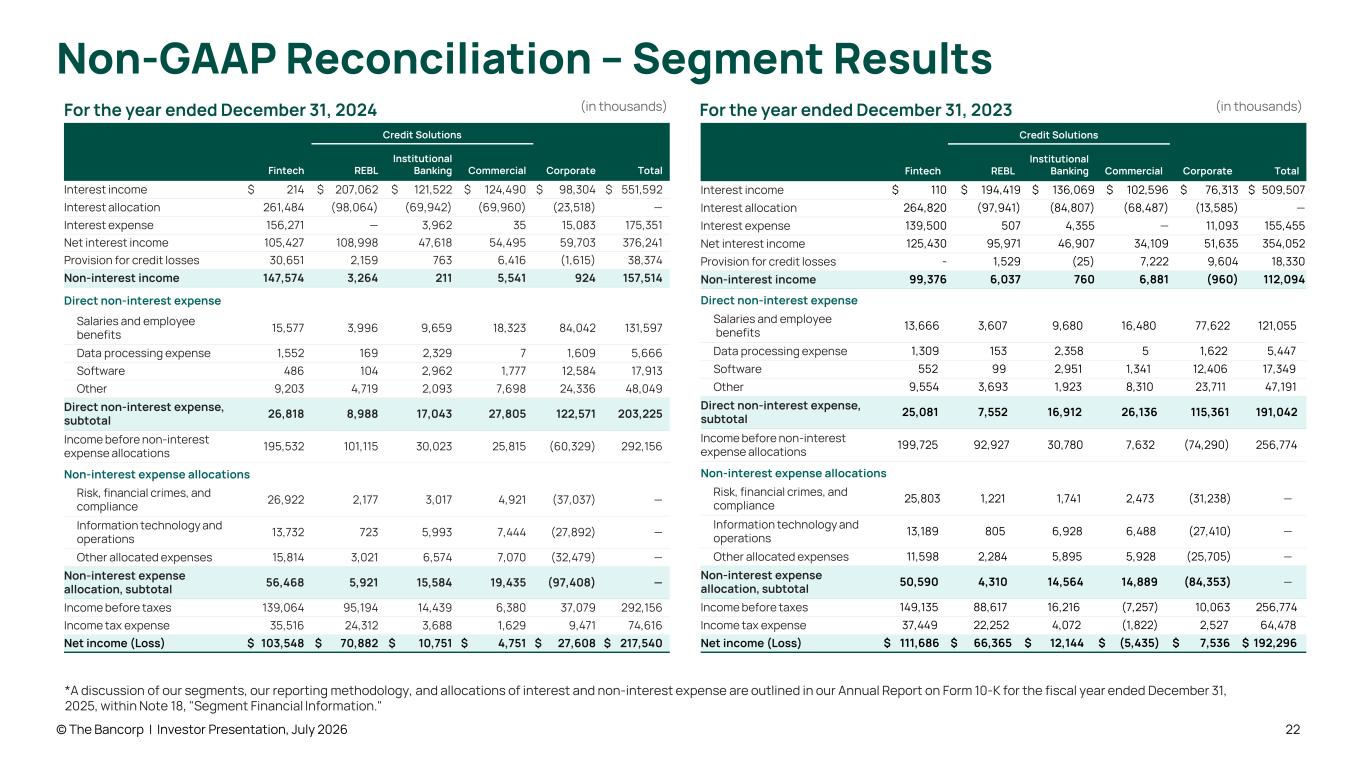
For the year ended December 31, 2024 Fintech Credit Solutions Corporate TotalREBL Institutional Banking Commercial Interest income $ 214 $ 207,062 $ 121,522 $ 124,490 $ 98,304 $ 551,592 Interest allocation 261,484 (98,064) (69,942) (69,960) (23,518) — Interest expense 156,271 — 3,962 35 15,083 175,351 Net interest income 105,427 108,998 47,618 54,495 59,703 376,241 Provision for credit losses 30,651 2,159 763 6,416 (1,615) 38,374 Non-interest income 147,574 3,264 211 5,541 924 157,514 Direct non-interest expense Salaries and employee benefits 15,577 3,996 9,659 18,323 84,042 131,597 Data processing expense 1,552 169 2,329 7 1,609 5,666 Software 486 104 2,962 1,777 12,584 17,913 Other 9,203 4,719 2,093 7,698 24,336 48,049 Direct non-interest expense, subtotal 26,818 8,988 17,043 27,805 122,571 203,225 Income before non-interest expense allocations 195,532 101,115 30,023 25,815 (60,329) 292,156 Non-interest expense allocations Risk, financial crimes, and compliance 26,922 2,177 3,017 4,921 (37,037) — Information technology and operations 13,732 723 5,993 7,444 (27,892) — Other allocated expenses 15,814 3,021 6,574 7,070 (32,479) — Non-interest expense allocation, subtotal 56,468 5,921 15,584 19,435 (97,408) — Income before taxes 139,064 95,194 14,439 6,380 37,079 292,156 Income tax expense 35,516 24,312 3,688 1,629 9,471 74,616 Net income (Loss) $ 103,548 $ 70,882 $ 10,751 $ 4,751 $ 27,608 $ 217,540 © The Bancorp | Investor Presentation, July 2026 (in thousands) *A discussion of our segments, our reporting methodology, and allocations of interest and non-interest expense are outlined in our Annual Report on Form 10-K for the fiscal year ended December 31, 2025, within Note 18, "Segment Financial Information." For the year ended December 31, 2023 Fintech Credit Solutions Corporate TotalREBL Institutional Banking Commercial Interest income $ 110 $ 194,419 $ 136,069 $ 102,596 $ 76,313 $ 509,507 Interest allocation 264,820 (97,941) (84,807) (68,487) (13,585) — Interest expense 139,500 507 4,355 — 11,093 155,455 Net interest income 125,430 95,971 46,907 34,109 51,635 354,052 Provision for credit losses - 1,529 (25) 7,222 9,604 18,330 Non-interest income 99,376 6,037 760 6,881 (960) 112,094 Direct non-interest expense Salaries and employee benefits 13,666 3,607 9,680 16,480 77,622 121,055 Data processing expense 1,309 153 2,358 5 1,622 5,447 Software 552 99 2,951 1,341 12,406 17,349 Other 9,554 3,693 1,923 8,310 23,711 47,191 Direct non-interest expense, subtotal 25,081 7,552 16,912 26,136 115,361 191,042 Income before non-interest expense allocations 199,725 92,927 30,780 7,632 (74,290) 256,774 Non-interest expense allocations Risk, financial crimes, and compliance 25,803 1,221 1,741 2,473 (31,238) — Information technology and operations 13,189 805 6,928 6,488 (27,410) — Other allocated expenses 11,598 2,284 5,895 5,928 (25,705) — Non-interest expense allocation, subtotal 50,590 4,310 14,564 14,889 (84,353) — Income before taxes 149,135 88,617 16,216 (7,257) 10,063 256,774 Income tax expense 37,449 22,252 4,072 (1,822) 2,527 64,478 Net income (Loss) $ 111,686 $ 66,365 $ 12,144 $ (5,435) $ 7,536 $ 192,296 (in thousands) 22 Non-GAAP Reconciliation – Segment Results
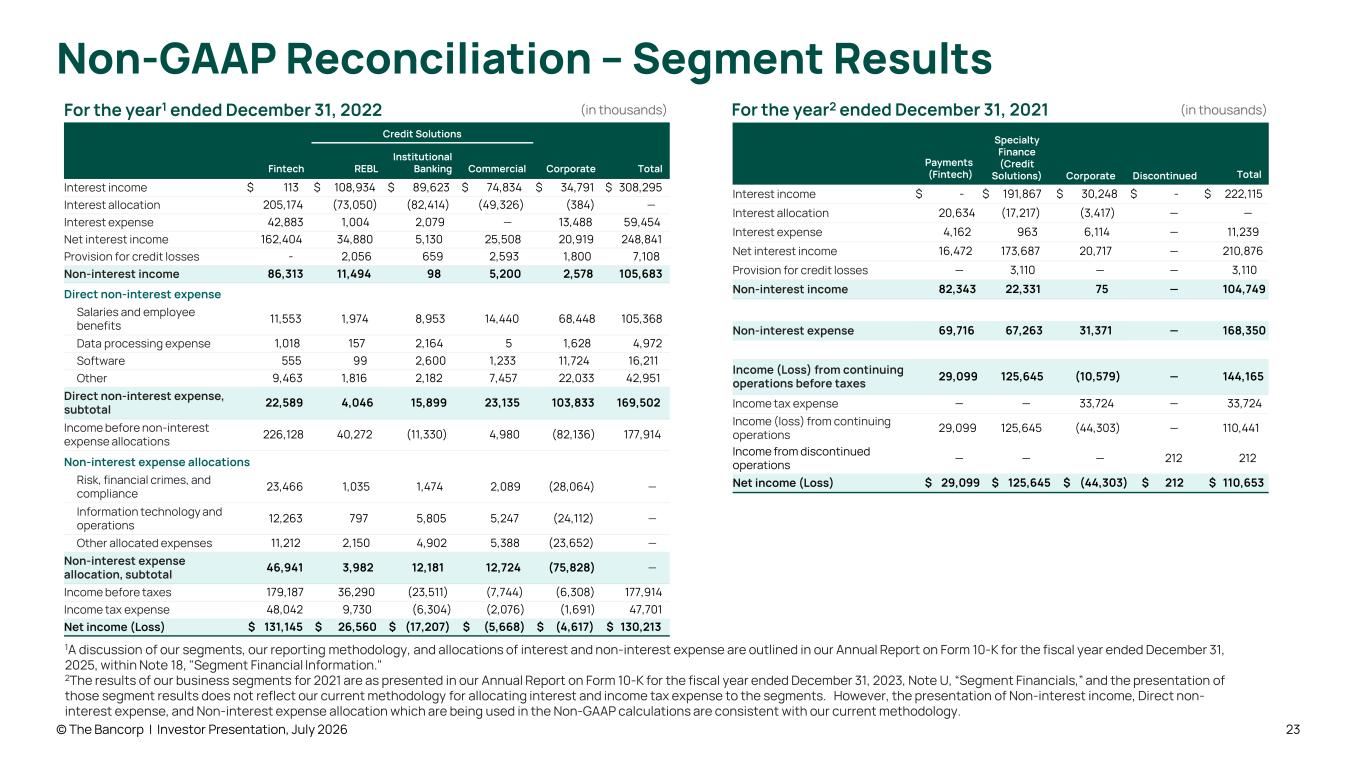
For the year1 ended December 31, 2022 Fintech Credit Solutions Corporate TotalREBL Institutional Banking Commercial Interest income $ 113 $ 108,934 $ 89,623 $ 74,834 $ 34,791 $ 308,295 Interest allocation 205,174 (73,050) (82,414) (49,326) (384) — Interest expense 42,883 1,004 2,079 — 13,488 59,454 Net interest income 162,404 34,880 5,130 25,508 20,919 248,841 Provision for credit losses - 2,056 659 2,593 1,800 7,108 Non-interest income 86,313 11,494 98 5,200 2,578 105,683 Direct non-interest expense Salaries and employee benefits 11,553 1,974 8,953 14,440 68,448 105,368 Data processing expense 1,018 157 2,164 5 1,628 4,972 Software 555 99 2,600 1,233 11,724 16,211 Other 9,463 1,816 2,182 7,457 22,033 42,951 Direct non-interest expense, subtotal 22,589 4,046 15,899 23,135 103,833 169,502 Income before non-interest expense allocations 226,128 40,272 (11,330) 4,980 (82,136) 177,914 Non-interest expense allocations Risk, financial crimes, and compliance 23,466 1,035 1,474 2,089 (28,064) — Information technology and operations 12,263 797 5,805 5,247 (24,112) — Other allocated expenses 11,212 2,150 4,902 5,388 (23,652) — Non-interest expense allocation, subtotal 46,941 3,982 12,181 12,724 (75,828) — Income before taxes 179,187 36,290 (23,511) (7,744) (6,308) 177,914 Income tax expense 48,042 9,730 (6,304) (2,076) (1,691) 47,701 Net income (Loss) $ 131,145 $ 26,560 $ (17,207) $ (5,668) $ (4,617) $ 130,213 © The Bancorp | Investor Presentation, July 2026 (in thousands) 1A discussion of our segments, our reporting methodology, and allocations of interest and non-interest expense are outlined in our Annual Report on Form 10-K for the fiscal year ended December 31, 2025, within Note 18, "Segment Financial Information." 2The results of our business segments for 2021 are as presented in our Annual Report on Form 10-K for the fiscal year ended December 31, 2023, Note U, “Segment Financials,” and the presentation of those segment results does not reflect our current methodology for allocating interest and income tax expense to the segments. However, the presentation of Non-interest income, Direct non- interest expense, and Non-interest expense allocation which are being used in the Non-GAAP calculations are consistent with our current methodology. For the year2 ended December 31, 2021 Payments (Fintech) Specialty Finance (Credit Solutions) Corporate Discontinued Total Interest income $ - $ 191,867 $ 30,248 $ - $ 222,115 Interest allocation 20,634 (17,217) (3,417) — — Interest expense 4,162 963 6,114 — 11,239 Net interest income 16,472 173,687 20,717 — 210,876 Provision for credit losses — 3,110 — — 3,110 Non-interest income 82,343 22,331 75 — 104,749 Non-interest expense 69,716 67,263 31,371 — 168,350 Income (Loss) from continuing operations before taxes 29,099 125,645 (10,579) — 144,165 Income tax expense — — 33,724 — 33,724 Income (loss) from continuing operations 29,099 125,645 (44,303) — 110,441 Income from discontinued operations — — — 212 212 Net income (Loss) $ 29,099 $ 125,645 $ (44,303) $ 212 $ 110,653 (in thousands) 23 Non-GAAP Reconciliation – Segment Results