Exhibit 99.1
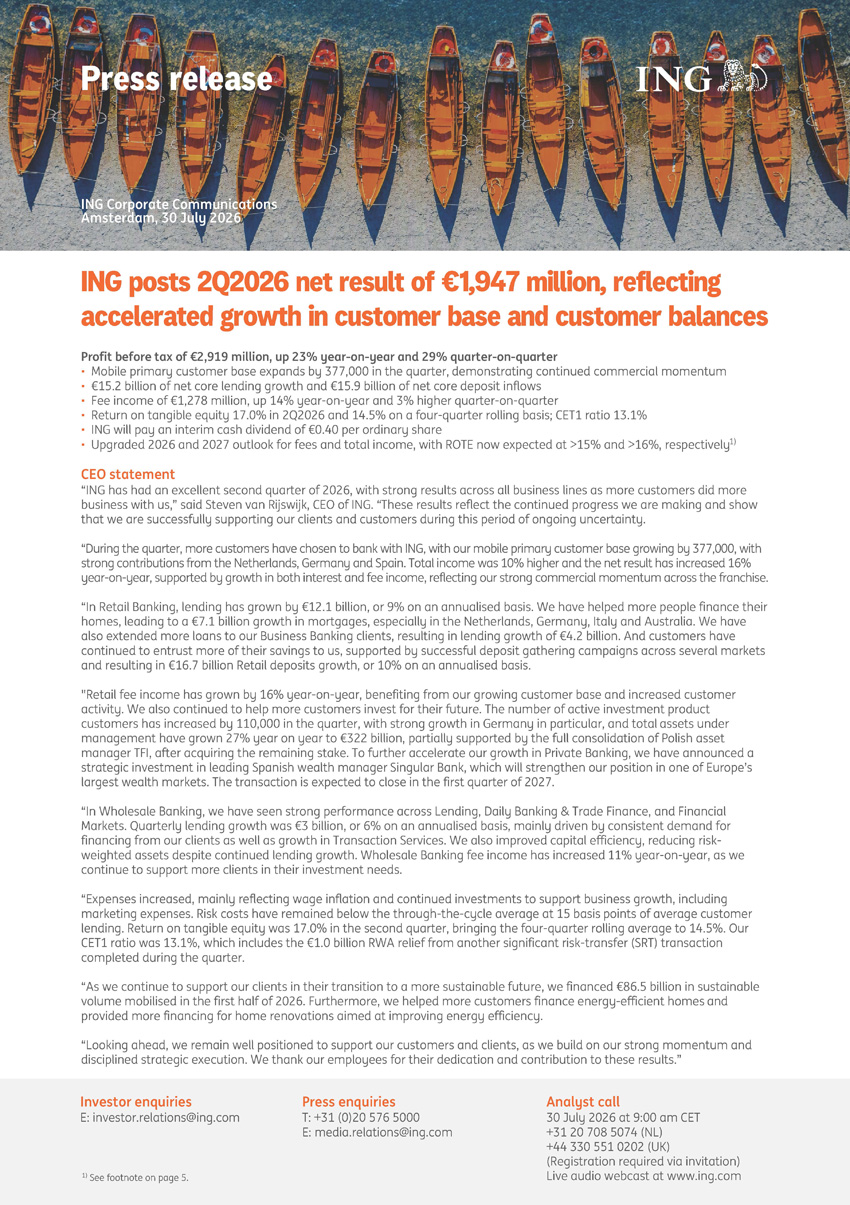
Press release ING Corporate Communications Amsterdam, 30 July 2026 ING posts 2Q2026 net result of €1,947 million, reflecting accelerated growth in customer base and customer balances Profit before tax of €2,919 million, up 23% year - on - year and 29% quarter - on - quarter • Mobile primary customer base expands by 377,000 in the quarter, demonstrating continued commercial momentum • €15.2 billion of net core lending growth and €15.9 billion of net core deposit inflows • Fee income of €1,278 million, up 14% year - on - year and 3% higher quarter - on - quarter • Return on tangible equity 17.0% in 2Q2026 and 14.5% on a four - quarter rolling basis; CET1 ratio 13.1% • ING will pay an interim cash dividend of €0.40 per ordinary share • Upgraded 2026 and 2027 outlook for fees and total income, with ROTE now expected at >15% and >16%, respectively 1) CEO statement “ING has had an excellent second quarter of 2026, with strong results across all business lines as more customers did more business with us,” said Steven van Rijswijk, CEO of ING. “These results reflect the continued progress we are making and show that we are successfully supporting our clients and customers during this period of ongoing uncertainty. “During the quarter, more customers have chosen to bank with ING, with our mobile primary customer base growing by 377,000, with strong contributions from the Netherlands, Germany and Spain. Total income was 10% higher and the net result has increased 16% year - on - year, supported by growth in both interest and fee income, reflecting our strong commercial momentum across the franchise. “In Retail Banking, lending has grown by €12.1 billion, or 9% on an annualised basis. We have helped more people finance their homes, leading to a €7.1 billion growth in mortgages, especially in the Netherlands, Germany, Italy and Australia. We have also extended more loans to our Business Banking clients, resulting in lending growth of €4.2 billion. And customers have continued to entrust more of their savings to us, supported by successful deposit gathering campaigns across several markets and resulting in €16.7 billion Retail deposits growth, or 10% on an annualised basis. "Retail fee income has grown by 16% year - on - year, benefiting from our growing customer base and increased customer activity. We also continued to help more customers invest for their future. The number of active investment product customers has increased by 110,000 in the quarter, with strong growth in Germany in particular, and total assets under management have grown 27% year on year to €322 billion, partially supported by the full consolidation of Polish asset manager TFI, after acquiring the remaining stake. To further accelerate our growth in Private Banking, we have announced a strategic investment in leading Spanish wealth manager Singular Bank, which will strengthen our position in one of Europe’s largest wealth markets. The transaction is expected to close in the first quarter of 2027. “In Wholesale Banking, we have seen strong performance across Lending, Daily Banking & Trade Finance, and Financial Markets. Quarterly lending growth was €3 billion, or 6% on an annualised basis, mainly driven by consistent demand for financing from our clients as well as growth in Transaction Services. We also improved capital efficiency, reducing risk - weighted assets despite continued lending growth. Wholesale Banking fee income has increased 11% year - on - year, as we continue to support more clients in their investment needs. “Expenses increased, mainly reflecting wage inflation and continued investments to support business growth, including marketing expenses. Risk costs have remained below the through - the - cycle average at 15 basis points of average customer lending. Return on tangible equity was 17.0% in the second quarter, bringing the four - quarter rolling average to 14.5%. Our CET1 ratio was 13.1%, which includes the €1.0 billion RWA relief from another significant risk - transfer (SRT) transaction completed during the quarter. “As we continue to support our clients in their transition to a more sustainable future, we financed €86.5 billion in sustainable volume mobilised in the first half of 2026. Furthermore, we helped more customers finance energy - efficient homes and provided more financing for home renovations aimed at improving energy efficiency. “Looking ahead, we remain well positioned to support our customers and clients, as we build on our strong momentum and disciplined strategic execution. We thank our employees for their dedication and contribution to these results.” Investor enquiries E: investor.relations@ing.com Press enquiries T: +31 (0)20 576 5000 E: media.relations@ing.com Analyst call 30 July 2026 at 9:00 am CET +31 20 708 5074 (NL) +44 330 551 0202 (UK) (Registration required via invitation) Live audio webcast at www.ing.com 1) See footnote on page 5.
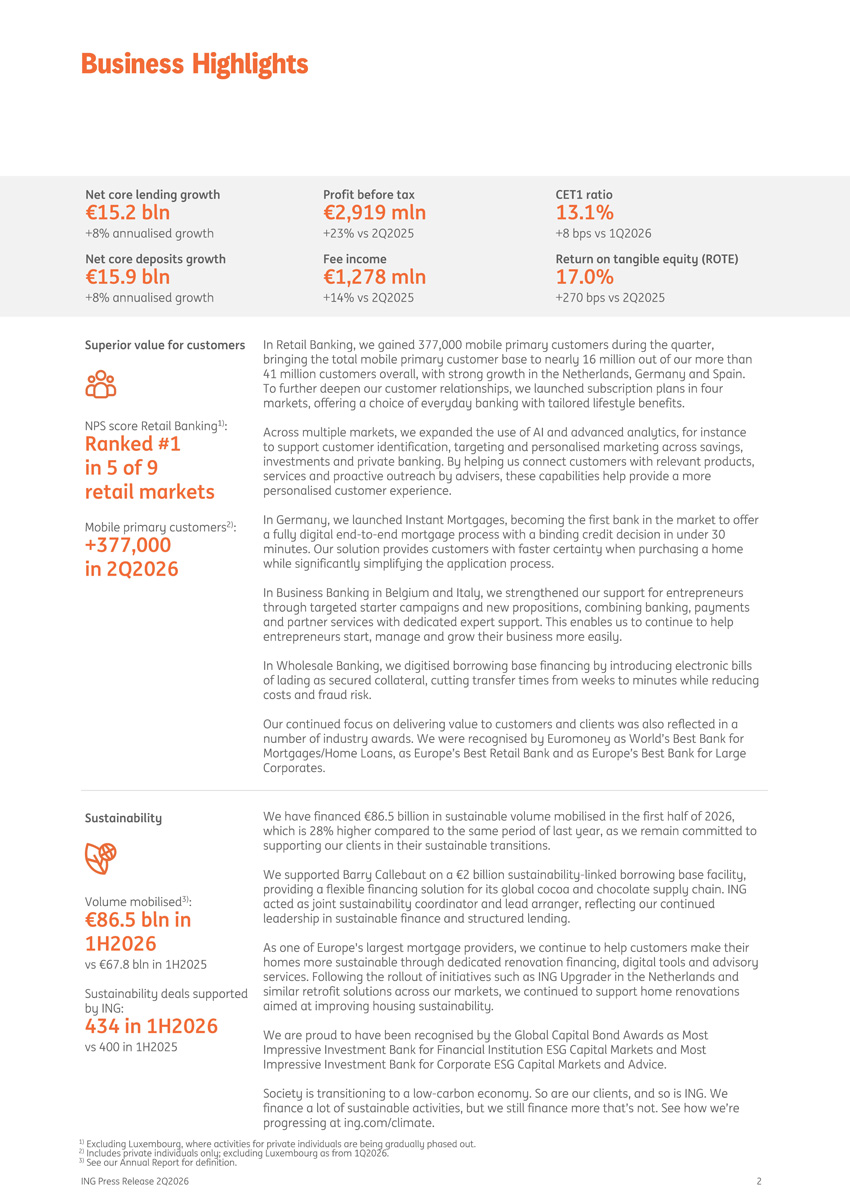
Net core lending growth €15.2 bln +8% annualised growth Net core deposits growth €15.9 bln +8% annualised growth Profit before tax €2,919 mln +23% vs 2Q2025 Fee income €1,278 mln +14% vs 2Q2025 CET1 ratio 13.1% +8 bps vs 1Q2026 Return on tangible equity (ROTE) 17.0% +270 bps vs 2Q2025 Superior value for customers NPS score Retail Banking 1) : Ranked #1 in 5 of 9 retail markets Mobile primary customers 2) : +377,000 in 2Q2026 Sustainability Volume mobilised 3) : €86.5 bln in 1H2026 vs €67.8 bln in 1H2025 Sustainability deals supported by ING: 434 in 1H2026 vs 400 in 1H2025 ING Press Release 2Q2026 2 Business Highlights In Retail Banking, we gained 377,000 mobile primary customers during the quarter, bringing the total mobile primary customer base to nearly 16 million out of our more than 41 million customers overall, with strong growth in the Netherlands, Germany and Spain. To further deepen our customer relationships, we launched subscription plans in four markets, offering a choice of everyday banking with tailored lifestyle benefits. Across multiple markets, we expanded the use of AI and advanced analytics, for instance to support customer identification, targeting and personalised marketing across savings, investments and private banking. By helping us connect customers with relevant products, services and proactive outreach by advisers, these capabilities help provide a more personalised customer experience. In Germany, we launched Instant Mortgages, becoming the first bank in the market to offer a fully digital end - to - end mortgage process with a binding credit decision in under 30 minutes. Our solution provides customers with faster certainty when purchasing a home while significantly simplifying the application process. In Business Banking in Belgium and Italy, we strengthened our support for entrepreneurs through targeted starter campaigns and new propositions, combining banking, payments and partner services with dedicated expert support. This enables us to continue to help entrepreneurs start, manage and grow their business more easily. In Wholesale Banking, we digitised borrowing base financing by introducing electronic bills of lading as secured collateral, cutting transfer times from weeks to minutes while reducing costs and fraud risk. Our continued focus on delivering value to customers and clients was also reflected in a number of industry awards. We were recognised by Euromoney as World’s Best Bank for Mortgages/Home Loans, as Europe’s Best Retail Bank and as Europe’s Best Bank for Large Corporates. We have financed €86.5 billion in sustainable volume mobilised in the first half of 2026, which is 28% higher compared to the same period of last year, as we remain committed to supporting our clients in their sustainable transitions. We supported Barry Callebaut on a €2 billion sustainability - linked borrowing base facility, providing a flexible financing solution for its global cocoa and chocolate supply chain. ING acted as joint sustainability coordinator and lead arranger, reflecting our continued leadership in sustainable finance and structured lending. As one of Europe's largest mortgage providers, we continue to help customers make their homes more sustainable through dedicated renovation financing, digital tools and advisory services. Following the rollout of initiatives such as ING Upgrader in the Netherlands and similar retrofit solutions across our markets, we continued to support home renovations aimed at improving housing sustainability. We are proud to have been recognised by the Global Capital Bond Awards as Most Impressive Investment Bank for Financial Institution ESG Capital Markets and Most Impressive Investment Bank for Corporate ESG Capital Markets and Advice . Society is transitioning to a low - carbon economy. So are our clients, and so is ING. We finance a lot of sustainable activities, but we still finance more that’s not. See how we’re progressing at ing.com/climate. 1) Excluding Luxembourg, where activities for private individuals are being gradually phased out. 2) Includes private individuals only; excluding Luxembourg as from 1Q2026. 3) See our Annual Report for definition.
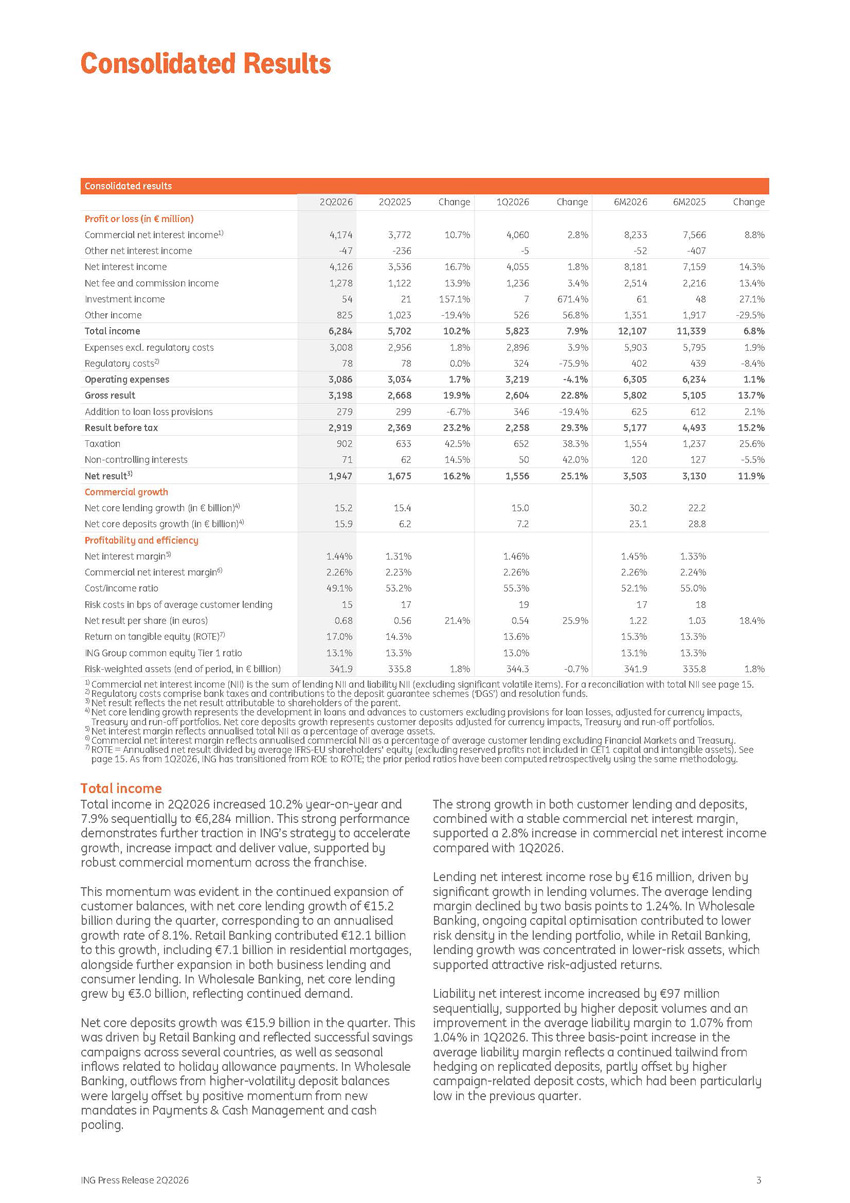
ING Press Release 2Q2026 3 Consolidated results Change 6M2025 6M2026 Change 1Q2026 Change 2Q2025 2Q2026 8.8% 7,566 - 407 8,233 - 52 2.8% 4,060 - 5 10.7% 3,772 - 236 4,174 - 47 Profit or loss (in € million) Commercial net interest income 1) Other net interest income 14.3% 7,159 8,181 1.8% 4,055 16.7% 3,536 4,126 Net interest income 13.4% 2,216 2,514 3.4% 1,236 13.9% 1,122 1,278 Net fee and commission income 27.1% 48 61 671.4% 7 157.1% 21 54 Investment income - 29.5% 1,917 1,351 56.8% 526 - 19.4% 1,023 825 Other income 6.8% 11,339 12,107 7.9% 5,823 10.2% 5,702 6,284 Total income 1.9% 5,795 5,903 3.9% 2,896 1.8% 2,956 3,008 Expenses excl. regulatory costs - 8.4% 439 402 - 75.9% 324 0.0% 78 78 Regulatory costs 2) 1.1% 6,234 6,305 - 4.1% 3,219 1.7% 3,034 3,086 Operating expenses 13.7% 5,105 5,802 22.8% 2,604 19.9% 2,668 3,198 Gross result 2.1% 612 625 - 19.4% 346 - 6.7% 299 279 Addition to loan loss provisions 15.2% 4,493 5,177 29.3% 2,258 23.2% 2,369 2,919 Result before tax 25.6% 1,237 1,554 38.3% 652 42.5% 633 902 Taxation - 5.5% 127 120 42.0% 50 14.5% 62 71 Non - controlling interests 11.9% 3,130 3,503 25.1% 1,556 16.2% 1,675 1,947 Net result 3) Commercial growth 22.2 30.2 15.0 15.4 15.2 Net core lending growth (in € billion) 4) 28.8 23.1 7.2 6.2 15.9 Net core deposits growth (in € billion) 4) Profitability and efficiency 1.33% 1.45% 1.46% 1.31% 1.44% Net interest margin 5) 2.24% 2.26% 2.26% 2.23% 2.26% Commercial net interest margin 6) 55.0% 52.1% 55.3% 53.2% 49.1% Cost/income ratio 18 17 19 17 15 Risk costs in bps of average customer lending 18.4% 1.03 1.22 25.9% 0.54 21.4% 0.56 0.68 Net result per share (in euros) 13.3% 15.3% 13.6% 14.3% 17.0% Return on tangible equity (ROTE) 7) 13.3% 13.1% 13.0% 13.3% 13.1% ING Group common equity Tier 1 ratio 1.8% 335.8 341.9 - 0.7% 344.3 1.8% 335.8 341.9 Risk - weighted assets (end of period, in € billion) 1) Commercial net interest income (NII) is the sum of lending NII and liability NII (excluding significant volatile items). For a reconciliation with total NII see page 15. 2) Regulatory costs comprise bank taxes and contributions to the deposit guarantee schemes (‘DGS’) and resolution funds. 3) Net result reflects the net result attributable to shareholders of the parent. 4) Net core lending growth represents the development in loans and advances to customers excluding provisions for loan losses, adjusted for currency impacts, Treasury and run - off portfolios. Net core deposits growth represents customer deposits adjusted for currency impacts, Treasury and run - off portfolios. 5) Net interest margin reflects annualised total NII as a percentage of average assets. 6) Commercial net interest margin reflects annualised commercial NII as a percentage of average customer lending excluding Financial Markets and Treasury. 7) ROTE = Annualised net result divided by average IFRS - EU shareholders' equity (excluding reserved profits not included in CET1 capital and intangible assets). See page 15. As from 1Q2026, ING has transitioned from ROE to ROTE; the prior period ratios have been computed retrospectively using the same methodology. Total income Total income in 2Q2026 increased 10.2% year - on - year and 7.9% sequentially to €6,284 million. This strong performance demonstrates further traction in ING’s strategy to accelerate growth, increase impact and deliver value, supported by robust commercial momentum across the franchise. This momentum was evident in the continued expansion of customer balances, with net core lending growth of €15.2 billion during the quarter, corresponding to an annualised growth rate of 8.1%. Retail Banking contributed €12.1 billion to this growth, including €7.1 billion in residential mortgages, alongside further expansion in both business lending and consumer lending. In Wholesale Banking, net core lending grew by €3.0 billion, reflecting continued demand. Net core deposits growth was €15.9 billion in the quarter. This was driven by Retail Banking and reflected successful savings campaigns across several countries, as well as seasonal inflows related to holiday allowance payments. In Wholesale Banking, outflows from higher - volatility deposit balances were largely offset by positive momentum from new mandates in Payments & Cash Management and cash pooling. The strong growth in both customer lending and deposits, combined with a stable commercial net interest margin, supported a 2.8% increase in commercial net interest income compared with 1Q2026. Lending net interest income rose by €16 million, driven by significant growth in lending volumes. The average lending margin declined by two basis points to 1.24%. In Wholesale Banking, ongoing capital optimisation contributed to lower risk density in the lending portfolio, while in Retail Banking, lending growth was concentrated in lower - risk assets, which supported attractive risk - adjusted returns. Liability net interest income increased by €97 million sequentially, supported by higher deposit volumes and an improvement in the average liability margin to 1.07% from 1.04% in 1Q2026. This three basis - point increase in the average liability margin reflects a continued tailwind from hedging on replicated deposits, partly offset by higher campaign - related deposit costs, which had been particularly low in the previous quarter. Consolidated Results
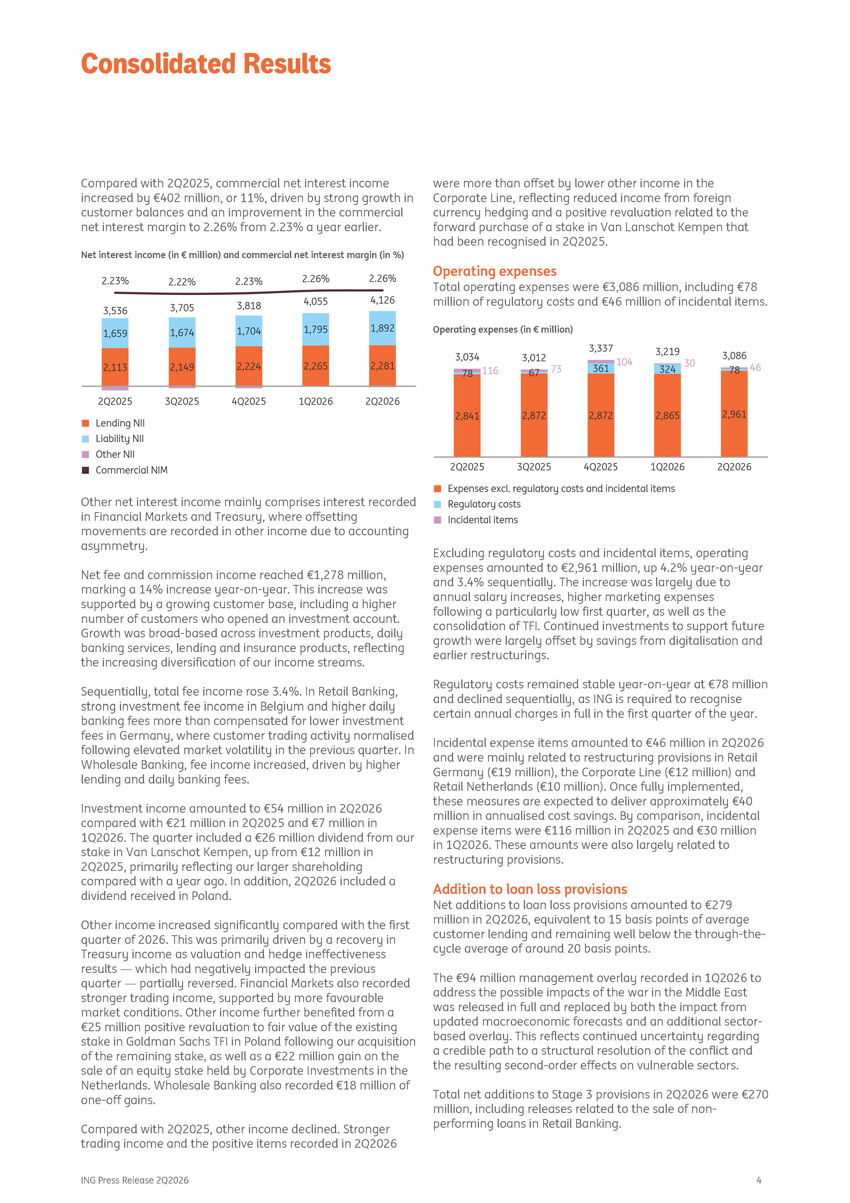
Compared with 2Q2025, commercial net interest income increased by €402 million, or 11%, driven by strong growth in customer balances and an improvement in the commercial net interest margin to 2.26% from 2.23% a year earlier. Other net interest income mainly comprises interest recorded in Financial Markets and Treasury, where offsetting movements are recorded in other income due to accounting asymmetry. Net fee and commission income reached €1,278 million, marking a 14% increase year - on - year. This increase was supported by a growing customer base, including a higher number of customers who opened an investment account. Growth was broad - based across investment products, daily banking services, lending and insurance products, reflecting the increasing diversification of our income streams. Sequentially, total fee income rose 3.4%. In Retail Banking, strong investment fee income in Belgium and higher daily banking fees more than compensated for lower investment fees in Germany, where customer trading activity normalised following elevated market volatility in the previous quarter. In Wholesale Banking, fee income increased, driven by higher lending and daily banking fees. Investment income amounted to €54 million in 2Q2026 compared with €21 million in 2Q2025 and €7 million in 1Q2026. The quarter included a €26 million dividend from our stake in Van Lanschot Kempen, up from €12 million in 2Q2025, primarily reflecting our larger shareholding compared with a year ago. In addition, 2Q2026 included a dividend received in Poland. Other income increased significantly compared with the first quarter of 2026. This was primarily driven by a recovery in Treasury income as valuation and hedge ineffectiveness results — which had negatively impacted the previous quarter — partially reversed. Financial Markets also recorded stronger trading income, supported by more favourable market conditions. Other income further benefited from a €25 million positive revaluation to fair value of the existing stake in Goldman Sachs TFI in Poland following our acquisition of the remaining stake, as well as a €22 million gain on the sale of an equity stake held by Corporate Investments in the Netherlands. Wholesale Banking also recorded €18 million of one - off gains. Compared with 2Q2025, other income declined. Stronger trading income and the positive items recorded in 2Q2026 were more than offset by lower other income in the Corporate Line, reflecting reduced income from foreign currency hedging and a positive revaluation related to the forward purchase of a stake in Van Lanschot Kempen that had been recognised in 2Q2025. Net interest income (in € million) and commercial net interest margin (in %) Operating expenses Total operating expenses were €3,086 million, including €78 million of regulatory costs and €46 million of incidental items. Operating expenses (in € million) Excluding regulatory costs and incidental items, operating expenses amounted to €2,961 million, up 4.2% year - on - year and 3.4% sequentially. The increase was largely due to annual salary increases, higher marketing expenses following a particularly low first quarter, as well as the consolidation of TFI. Continued investments to support future growth were largely offset by savings from digitalisation and earlier restructurings. Regulatory costs remained stable year - on - year at €78 million and declined sequentially, as ING is required to recognise certain annual charges in full in the first quarter of the year. ING Press Release 2Q2026 4 Incidental expense items amounted to €46 million in 2Q2026 and were mainly related to restructuring provisions in Retail Germany (€19 million), the Corporate Line (€12 million) and Retail Netherlands (€10 million). Once fully implemented, these measures are expected to deliver approximately €40 million in annualised cost savings. By comparison, incidental expense items were €116 million in 2Q2025 and €30 million in 1Q2026. These amounts were also largely related to restructuring provisions. Addition to loan loss provisions Net additions to loan loss provisions amounted to €279 million in 2Q2026, equivalent to 15 basis points of average customer lending and remaining well below the through - the - cycle average of around 20 basis points. The €94 million management overlay recorded in 1Q2026 to address the possible impacts of the war in the Middle East was released in full and replaced by both the impact from updated macroeconomic forecasts and an additional sector - based overlay. This reflects continued uncertainty regarding a credible path to a structural resolution of the conflict and the resulting second - order effects on vulnerable sectors. Total net additions to Stage 3 provisions in 2Q2026 were €270 million, including releases related to the sale of non - performing loans in Retail Banking. Consolidated Results
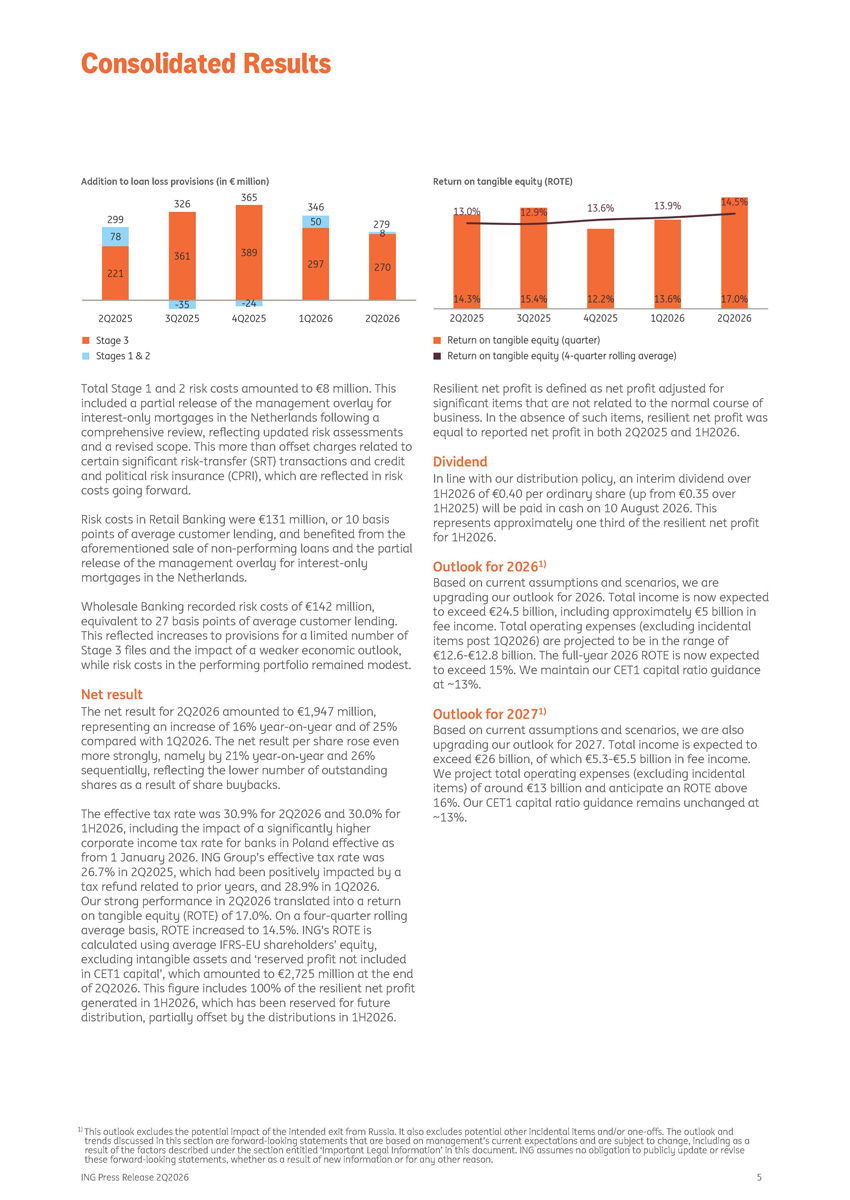
Addition to loan loss provisions (in € million) Total Stage 1 and 2 risk costs amounted to €8 million. This included a partial release of the management overlay for interest - only mortgages in the Netherlands following a comprehensive review, reflecting updated risk assessments and a revised scope. This more than offset charges related to certain significant risk - transfer (SRT) transactions and credit and political risk insurance (CPRI), which are reflected in risk costs going forward. Risk costs in Retail Banking were €131 million, or 10 basis points of average customer lending, and benefited from the aforementioned sale of non - performing loans and the partial release of the management overlay for interest - only mortgages in the Netherlands. Wholesale Banking recorded risk costs of €142 million, equivalent to 27 basis points of average customer lending. This reflected increases to provisions for a limited number of Stage 3 files and the impact of a weaker economic outlook, while risk costs in the performing portfolio remained modest. Net result The net result for 2Q2026 amounted to €1,947 million, representing an increase of 16% year - on - year and of 25% compared with 1Q2026. The net result per share rose even more strongly, namely by 21% year - on - year and 26% sequentially, reflecting the lower number of outstanding shares as a result of share buybacks. The effective tax rate was 30.9% for 2Q2026 and 30.0% for 1H2026, including the impact of a significantly higher corporate income tax rate for banks in Poland effective as from 1 January 2026. ING Group’s effective tax rate was 26.7% in 2Q2025, which had been positively impacted by a tax refund related to prior years, and 28.9% in 1Q2026. Our strong performance in 2Q2026 translated into a return on tangible equity (ROTE) of 17.0%. On a four - quarter rolling average basis, ROTE increased to 14.5%. ING’s ROTE is calculated using average IFRS - EU shareholders’ equity, excluding intangible assets and ‘reserved profit not included in CET1 capital’, which amounted to €2,725 million at the end of 2Q2026. This figure includes 100% of the resilient net profit generated in 1H2026, which has been reserved for future distribution, partially offset by the distributions in 1H2026. Return on tangible equity (ROTE) Resilient net profit is defined as net profit adjusted for significant items that are not related to the normal course of business. In the absence of such items, resilient net profit was equal to reported net profit in both 2Q2025 and 1H2026. ING Press Release 2Q2026 5 Dividend In line with our distribution policy, an interim dividend over 1H2026 of €0.40 per ordinary share (up from €0.35 over 1H2025) will be paid in cash on 10 August 2026. This represents approximately one third of the resilient net profit for 1H2026. Outlook for 2026 1) Based on current assumptions and scenarios, we are upgrading our outlook for 2026. Total income is now expected to exceed €24.5 billion, including approximately €5 billion in fee income. Total operating expenses (excluding incidental items post 1Q2026) are projected to be in the range of € 12 . 6 - € 12 . 8 billion . The full - year 2026 ROTE is now expected to exceed 15 % . We maintain our CET 1 capital ratio guidance at ~ 13 % . Outlook for 2027 1) Based on current assumptions and scenarios, we are also upgrading our outlook for 2027. Total income is expected to exceed €26 billion, of which €5.3 - €5.5 billion in fee income. We project total operating expenses (excluding incidental items) of around €13 billion and anticipate an ROTE above 16%. Our CET1 capital ratio guidance remains unchanged at ~13%. Consolidated Results 1) This outlook excludes the potential impact of the intended exit from Russia. It also excludes potential other incidental items and/or one - offs. The outlook and trends discussed in this section are forward - looking statements that are based on management’s current expectations and are subject to change, including as a result of the factors described under the section entitled ‘Important Legal Information’ in this document. ING assumes no obligation to publicly update or revise these forward - looking statements, whether as a result of new information or for any other reason.
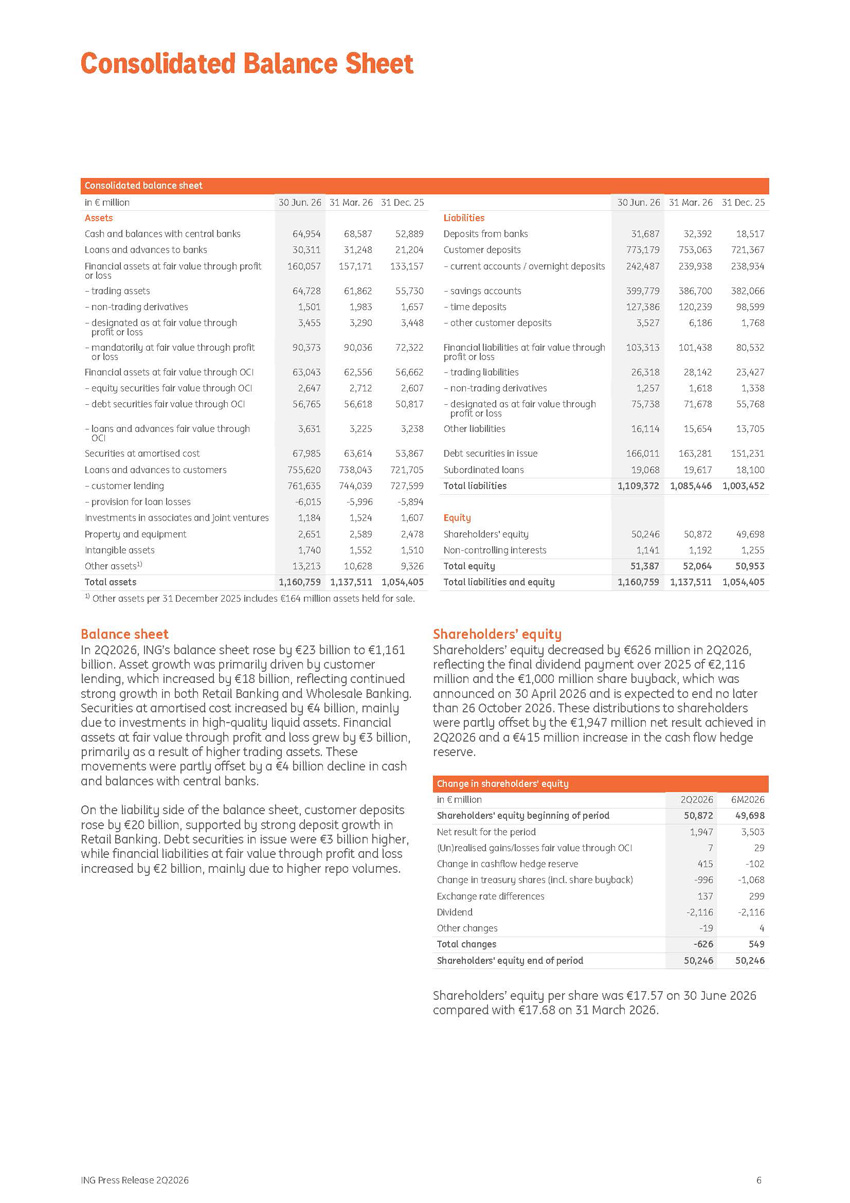
ING Press Release 2Q2026 6 Consolidated balance sheet 31 Dec. 25 31 Mar. 26 30 Jun. 26 31 Mar. 26 31 Dec. 25 30 Jun. 26 in € million 18,517 721,367 238,934 382,066 98,599 1,768 80,532 23,427 1,338 55,768 13,705 151,231 18,100 32,392 753,063 239,938 386,700 120,239 6,186 101,438 28,142 1,618 71,678 15,654 163,281 19,617 31,687 773,179 242,487 399,779 127,386 3,527 103,313 26,318 1,257 75,738 16,114 166,011 19,068 Liabilities Deposits from banks Customer deposits – current accounts / overnight deposits – savings accounts – time deposits – other customer deposits Financial liabilities at fair value through profit or loss – trading liabilities – non - trading derivatives – designated as at fair value through profit or loss Other liabilities Debt securities in issue Subordinated loans 68,587 52,889 31,248 21,204 157,171 133,157 61,862 55,730 1,983 1,657 3,290 3,448 90,036 72,322 62,556 56,662 2,712 2,607 56,618 50,817 3,225 3,238 63,614 53,867 738,043 721,705 744,039 727,599 - 5,996 - 5,894 1,524 1,607 2,589 2,478 1,552 1,510 10,628 9,326 64,954 30,311 160,057 64,728 1,501 3,455 90,373 63,043 2,647 56,765 3,631 67,985 755,620 761,635 - 6,015 1,184 2,651 1,740 13,213 Assets Cash and balances with central banks Loans and advances to banks Financial assets at fair value through profit or loss – trading assets – non - trading derivatives – designated as at fair value through profit or loss – mandatorily at fair value through profit or loss Financial assets at fair value through OCI – equity securities fair value through OCI – debt securities fair value through OCI – loans and advances fair value through OCI Securities at amortised cost Loans and advances to customers – customer lending – provision for loan losses Investments in associates and joint ventures Property and equipment Intangible assets Other assets 1) 1,003,452 1,085,446 1,109,372 Total liabilities 49,698 1,255 50,872 1,192 50,246 1,141 Equity Shareholders' equity Non - controlling interests 50,953 52,064 51,387 Total equity 1,054,405 1,137,511 1,160,759 Total liabilities and equity 1,137,511 1,054,405 1,160,759 Total assets 1) Other assets per 31 December 2025 includes €164 million assets held for sale. Balance sheet In 2Q2026, ING’s balance sheet rose by €23 billion to €1,161 billion. Asset growth was primarily driven by customer lending, which increased by €18 billion, reflecting continued strong growth in both Retail Banking and Wholesale Banking. Securities at amortised cost increased by €4 billion, mainly due to investments in high - quality liquid assets. Financial assets at fair value through profit and loss grew by €3 billion, primarily as a result of higher trading assets. These movements were partly offset by a €4 billion decline in cash and balances with central banks. On the liability side of the balance sheet, customer deposits rose by €20 billion, supported by strong deposit growth in Retail Banking. Debt securities in issue were €3 billion higher, while financial liabilities at fair value through profit and loss increased by €2 billion, mainly due to higher repo volumes. Shareholders’ equity Shareholders’ equity decreased by €626 million in 2Q2026, reflecting the final dividend payment over 2025 of €2,116 million and the €1,000 million share buyback, which was announced on 30 April 2026 and is expected to end no later than 26 October 2026. These distributions to shareholders were partly offset by the €1,947 million net result achieved in 2Q2026 and a €415 million increase in the cash flow hedge reserve. Change in shareholders’ equity 6M2026 2Q2026 in € million 49,698 50,872 Shareholders' equity beginning of period 3,503 1,947 Net result for the period 29 7 (Un)realised gains/losses fair value through OCI - 102 415 Change in cashflow hedge reserve - 1,068 - 996 Change in treasury shares (incl. share buyback) 299 137 Exchange rate differences - 2,116 - 2,116 Dividend 4 - 19 Other changes 549 - 626 Total changes 50,246 50,246 Shareholders' equity end of period Shareholders’ equity per share was €17.57 on 30 June 2026 compared with €17.68 on 31 March 2026. Consolidated Balance Sheet
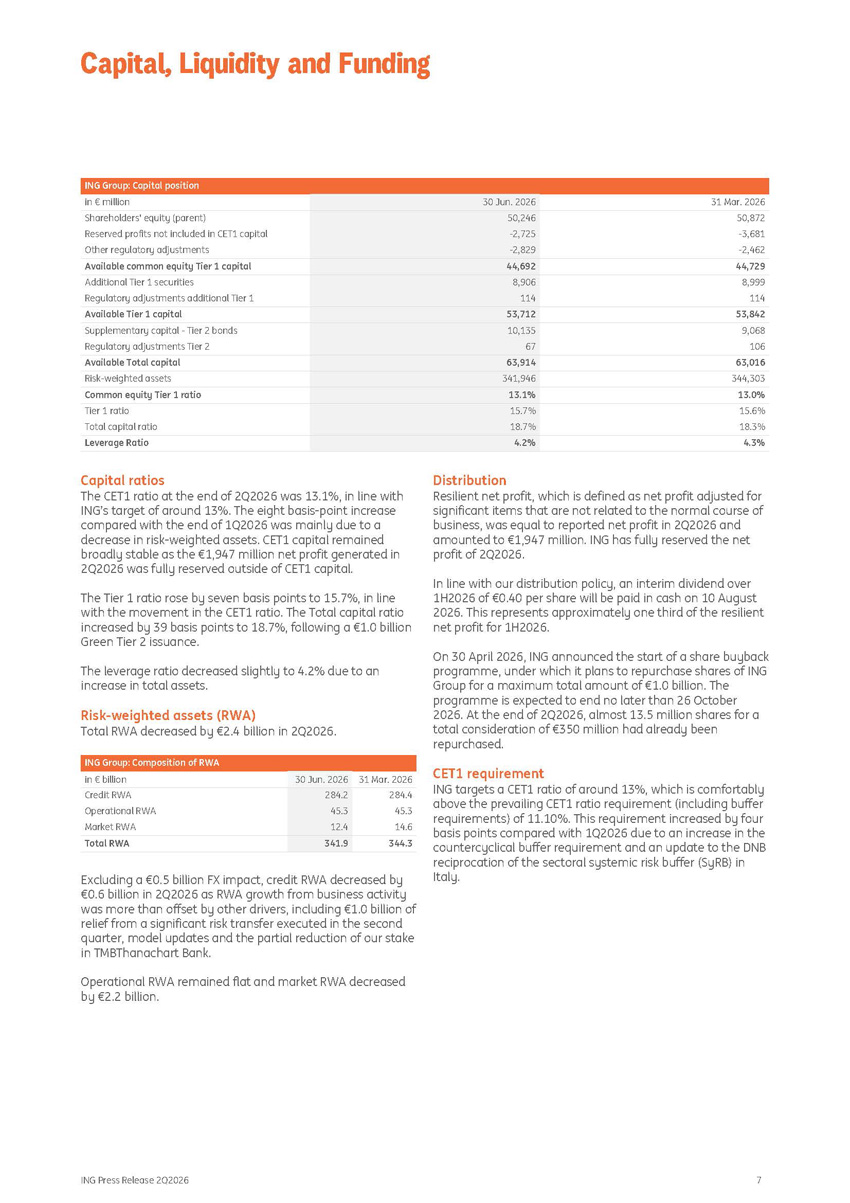
ING Press Release 2Q2026 7 ING Group: Capital position 31 Mar. 2026 30 Jun. 2026 in € million 50,872 50,246 Shareholders' equity (parent) - 3,681 - 2,725 Reserved profits not included in CET1 capital - 2,462 - 2,829 Other regulatory adjustments 44,729 44,692 Available common equity Tier 1 capital 8,999 8,906 Additional Tier 1 securities 114 114 Regulatory adjustments additional Tier 1 53,842 53,712 Available Tier 1 capital 9,068 10,135 Supplementary capital - Tier 2 bonds 106 67 Regulatory adjustments Tier 2 63,016 63,914 Available Total capital 344,303 341,946 Risk - weighted assets 13.0% 13.1% Common equity Tier 1 ratio 15.6% 15.7% Tier 1 ratio 18.3% 18.7% Total capital ratio 4.3% 4.2% Leverage Ratio Capital ratios The CET1 ratio at the end of 2Q2026 was 13.1%, in line with ING’s target of around 13%. The eight basis - point increase compared with the end of 1Q2026 was mainly due to a decrease in risk - weighted assets. CET1 capital remained broadly stable as the €1,947 million net profit generated in 2Q2026 was fully reserved outside of CET1 capital. The Tier 1 ratio rose by seven basis points to 15.7%, in line with the movement in the CET1 ratio. The Total capital ratio increased by 39 basis points to 18.7%, following a €1.0 billion Green Tier 2 issuance. The leverage ratio decreased slightly to 4.2% due to an increase in total assets. Risk - weighted assets (RWA) Total RWA decreased by €2.4 billion in 2Q2026. ING Group: Composition of RWA 31 Mar. 2026 30 Jun. 2026 in € billion 284.4 284.2 Credit RWA 45.3 45.3 Operational RWA 14.6 12.4 Market RWA 344.3 341.9 Total RWA Excluding a €0.5 billion FX impact, credit RWA decreased by €0.6 billion in 2Q2026 as RWA growth from business activity was more than offset by other drivers, including €1.0 billion of relief from a significant risk transfer executed in the second quarter, model updates and the partial reduction of our stake in TMBThanachart Bank. Operational RWA remained flat and market RWA decreased by €2.2 billion. Distribution Resilient net profit, which is defined as net profit adjusted for significant items that are not related to the normal course of business, was equal to reported net profit in 2Q2026 and amounted to €1,947 million. ING has fully reserved the net profit of 2Q2026. In line with our distribution policy, an interim dividend over 1H2026 of €0.40 per share will be paid in cash on 10 August 2026. This represents approximately one third of the resilient net profit for 1H2026. On 30 April 2026, ING announced the start of a share buyback programme, under which it plans to repurchase shares of ING Group for a maximum total amount of €1.0 billion. The programme is expected to end no later than 26 October 2026. At the end of 2Q2026, almost 13.5 million shares for a total consideration of €350 million had already been repurchased. CET1 requirement ING targets a CET1 ratio of around 13%, which is comfortably above the prevailing CET1 ratio requirement (including buffer requirements) of 11.10%. This requirement increased by four basis points compared with 1Q2026 due to an increase in the countercyclical buffer requirement and an update to the DNB reciprocation of the sectoral systemic risk buffer (SyRB) in Italy. Capital, Liquidity and Funding
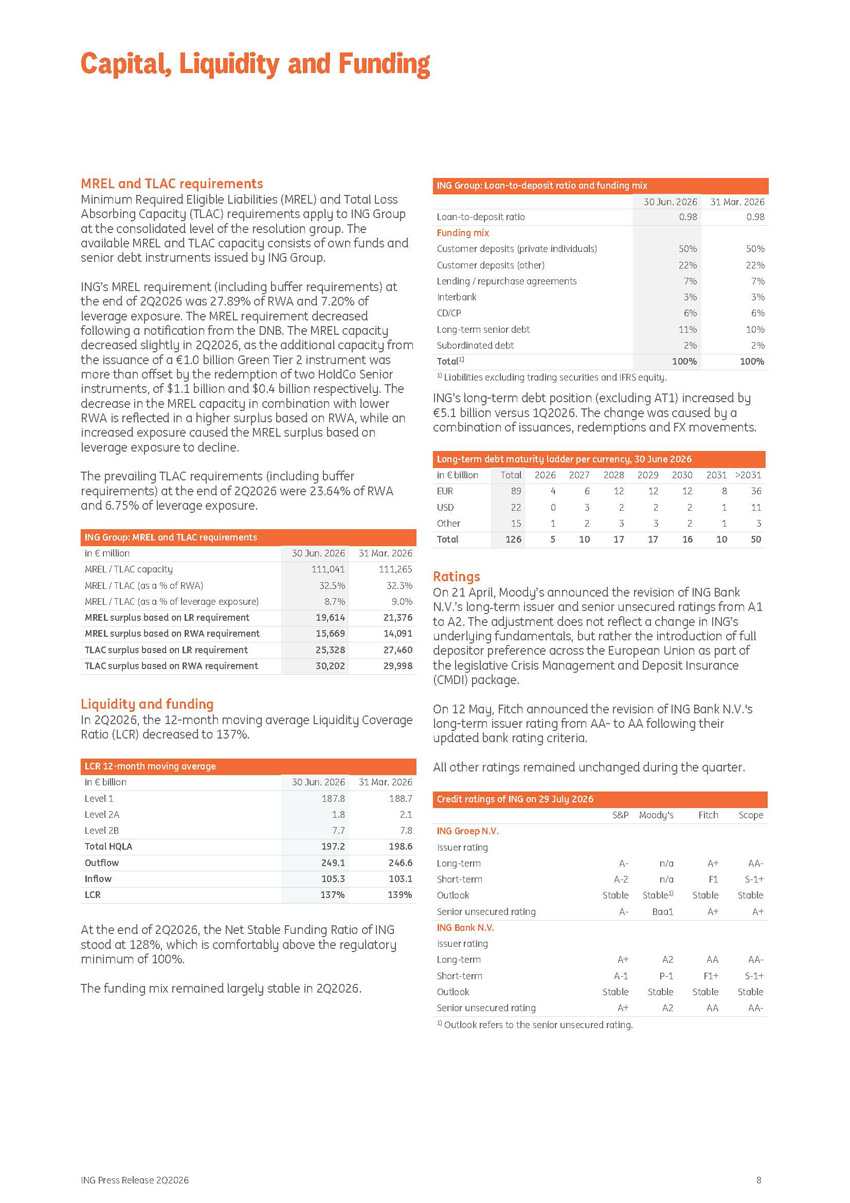
MREL and TLAC requirements Minimum Required Eligible Liabilities (MREL) and Total Loss Absorbing Capacity (TLAC) requirements apply to ING Group at the consolidated level of the resolution group. The available MREL and TLAC capacity consists of own funds and senior debt instruments issued by ING Group. ING’s MREL requirement (including buffer requirements) at the end of 2Q2026 was 27.89% of RWA and 7.20% of leverage exposure. The MREL requirement decreased following a notification from the DNB. The MREL capacity decreased slightly in 2Q2026, as the additional capacity from the issuance of a €1.0 billion Green Tier 2 instrument was more than offset by the redemption of two HoldCo Senior instruments, of $1.1 billion and $0.4 billion respectively. The decrease in the MREL capacity in combination with lower RWA is reflected in a higher surplus based on RWA, while an increased exposure caused the MREL surplus based on leverage exposure to decline. The prevailing TLAC requirements (including buffer requirements) at the end of 2Q2026 were 23.64% of RWA and 6.75% of leverage exposure. ING Group: MREL and TLAC requirements 31 Mar. 2026 30 Jun. 2026 in € million 111,265 111,041 MREL / TLAC capacity 32.3% 32.5% MREL / TLAC (as a % of RWA) 9.0% 8.7% MREL / TLAC (as a % of leverage exposure) 21,376 19,614 MREL surplus based on LR requirement 14,091 15,669 MREL surplus based on RWA requirement 27,460 25,328 TLAC surplus based on LR requirement 29,998 30,202 TLAC surplus based on RWA requirement Liquidity and funding In 2Q2026, the 12 - month moving average Liquidity Coverage Ratio (LCR) decreased to 137%. LCR 12 - month moving average 31 Mar. 2026 30 Jun. 2026 in € billion 188.7 187.8 Level 1 2.1 1.8 Level 2A 7.8 7.7 Level 2B 198.6 197.2 Total HQLA 246.6 249.1 Outflow 103.1 105.3 Inflow 139% 137% LCR At the end of 2 Q 2026 , the Net Stable Funding Ratio of ING stood at 128 % , which is comfortably above the regulatory minimum of 100 % . The funding mix remained largely stable in 2Q2026. ING Group: Loan - to - deposit ratio and funding mix 31 Mar. 2026 30 Jun. 2026 0.98 0.98 Loan - to - deposit ratio Funding mix 50% 50% Customer deposits (private individuals) 22% 22% Customer deposits (other) 7% 7% Lending / repurchase agreements 3% 3% Interbank 6% 6% CD/CP 10% 11% Long - term senior debt 2% 2% Subordinated debt 100% 100% Total 1) 1) Liabilities excluding trading securities and IFRS equity. ING’s long - term debt position (excluding AT1) increased by €5.1 billion versus 1Q2026. The change was caused by a combination of issuances, redemptions and FX movements. Long - term debt maturity ladder per currency, 30 June 2026 >2031 2031 2030 2029 2028 2027 2026 Total in € billion 36 8 12 12 12 6 4 89 EUR 11 1 2 2 2 3 0 22 USD 3 1 2 3 3 2 1 15 Other 50 10 16 17 17 10 5 126 Total Ratings On 21 April, Moody’s announced the revision of ING Bank N.V.’s long - term issuer and senior unsecured ratings from A1 to A2. The adjustment does not reflect a change in ING’s underlying fundamentals, but rather the introduction of full depositor preference across the European Union as part of the legislative Crisis Management and Deposit Insurance (CMDI) package. On 12 May, Fitch announced the revision of ING Bank N.V.'s long - term issuer rating from AA - to AA following their updated bank rating criteria. All other ratings remained unchanged during the quarter. Credit ratings of ING on 29 July 2026 S&P Moody's Fitch Scope ING Groep N.V. Issuer rating Long - term Short - term Outlook Senior unsecured rating A - n/a A - 2 n/a Stable Stable 1) A - Baa1 A+ AA - F1 S - 1+ Stable Stable A+ A+ ING Bank N.V. Issuer rating Long - term Short - term Outlook Senior unsecured rating A+ A2 AA AA - A - 1 P - 1 F1+ S - 1+ Stable Stable Stable Stable A+ A2 AA AA - 1) Outlook refers to the senior unsecured rating. Capital, Liquidity and Funding ING Press Release 2Q2026 8
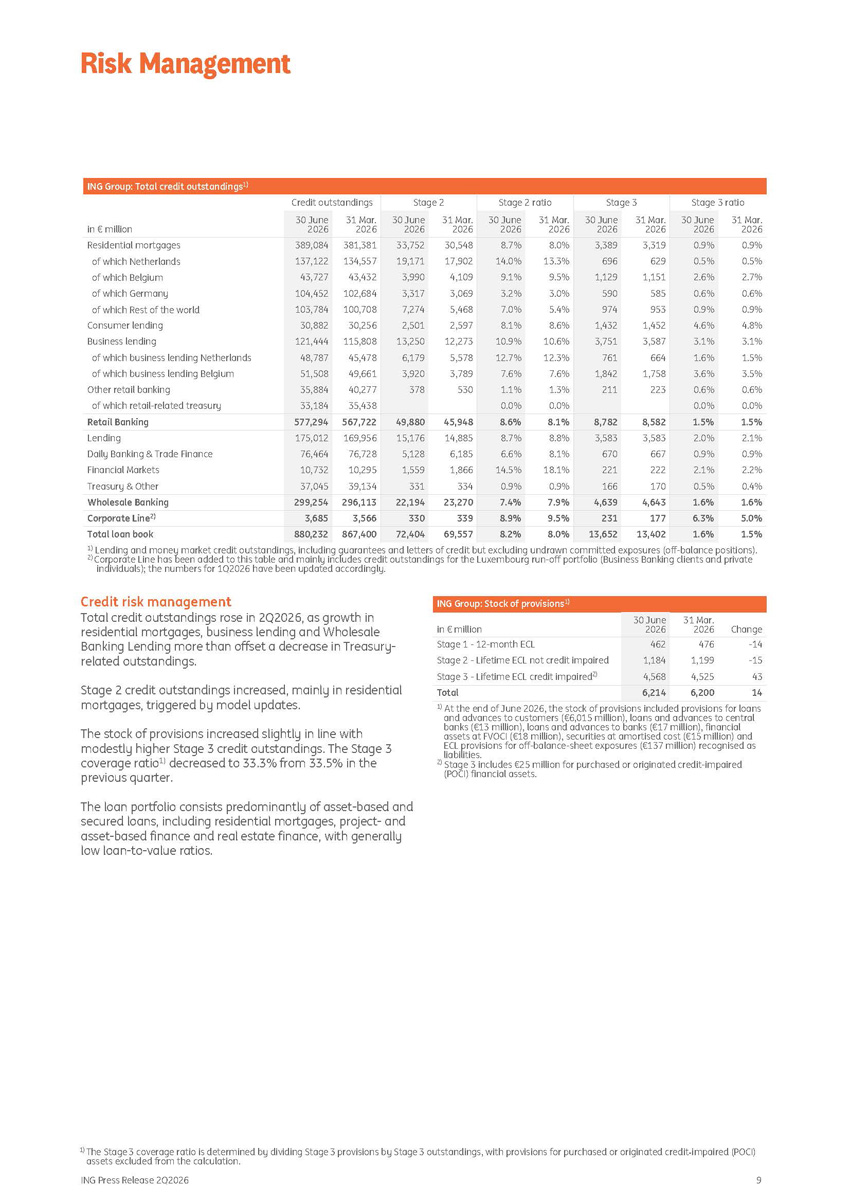
ING Group: Total credit outstandings 1) Credit outstandings Stage 2 Stage 2 ratio Stage 3 Stage 3 ratio in € million 30 June 2026 31 Mar. 2026 30 June 2026 31 Mar. 2026 30 June 2026 31 Mar. 2026 30 June 2026 31 Mar. 2026 30 June 2026 31 Mar. 2026 33,752 19,171 3,990 3,317 7,274 2,501 13,250 6,179 3,920 378 30,548 17,902 4,109 3,069 5,468 2,597 12,273 5,578 3,789 530 3,389 696 1,129 590 974 1,432 3,751 761 1,842 211 3,319 629 1,151 585 953 1,452 3,587 664 1,758 223 Residential mortgages of which Netherlands of which Belgium of which Germany of which Rest of the world Consumer lending Business lending of which business lending Netherlands of which business lending Belgium Other retail banking of which retail - related treasury 389,084 137,122 43,727 104,452 103,784 30,882 121,444 48,787 51,508 35,884 33,184 381,381 134,557 43,432 102,684 100,708 30,256 115,808 45,478 49,661 40,277 35,438 8.7% 14.0% 9.1% 3.2% 7.0% 8.1% 10.9% 12.7% 7.6% 1.1% 0.0% 8.0% 13.3% 9.5% 3.0% 5.4% 8.6% 10.6% 12.3% 7.6% 1.3% 0.0% 0.9% 0.5% 2.6% 0.6% 0.9% 4.6% 3.1% 1.6% 3.6% 0.6% 0.0% 0.9% 0.5% 2.7% 0.6% 0.9% 4.8% 3.1% 1.5% 3.5% 0.6% 0.0% Retail Banking 577,294 567,722 49,880 45,948 8.6% 8.1% 8,782 8,582 1.5% 1.5% Lending Daily Banking & Trade Finance Financial Markets Treasury & Other 175,012 76,464 10,732 37,045 169,956 76,728 10,295 39,134 15,176 5,128 1,559 331 14,885 6,185 1,866 334 8.7% 6.6% 14.5% 0.9% 8.8% 8.1% 18.1% 0.9% 3,583 670 221 166 3,583 667 222 170 2.0% 0.9% 2.1% 0.5% 2.1% 0.9% 2.2% 0.4% Wholesale Banking 299,254 296,113 22,194 23,270 7.4% 7.9% 4,639 4,643 1.6% 1.6% Corporate Line 2) 3,685 3,566 330 339 8.9% 9.5% 231 177 6.3% 5.0% Total loan book 880,232 867,400 72,404 69,557 8.2% 8.0% 13,652 13,402 1.6% 1.5% 1) Lending and money market credit outstandings, including guarantees and letters of credit but excluding undrawn committed exposures (off - balance positions). 2) Corporate Line has been added to this table and mainly includes credit outstandings for the Luxembourg run - off portfolio (Business Banking clients and private individuals); the numbers for 1Q2026 have been updated accordingly. Credit risk management Total credit outstandings rose in 2Q2026, as growth in residential mortgages, business lending and Wholesale Banking Lending more than offset a decrease in Treasury - related outstandings. ING Press Release 2Q2026 9 Stage 2 credit outstandings increased, mainly in residential mortgages, triggered by model updates. The stock of provisions increased slightly in line with modestly higher Stage 3 credit outstandings. The Stage 3 coverage ratio 1) decreased to 33.3% from 33.5% in the previous quarter. The loan portfolio consists predominantly of asset - based and secured loans, including residential mortgages, project - and asset - based finance and real estate finance, with generally low loan - to - value ratios. ING Group: Stock of provisions 1) Change 31 Mar. 2026 30 June 2026 in € million - 14 476 462 Stage 1 - 12 - month ECL - 15 1,199 1,184 Stage 2 - Lifetime ECL not credit impaired 43 4,525 4,568 Stage 3 - Lifetime ECL credit impaired 2) 14 6,200 6,214 Total liabilities. 2) 1) At the end of June 2026, the stock of provisions included provisions for loans and advances to customers (€6,015 million), loans and advances to central banks (€13 million), loans and advances to banks (€17 million), financial assets at FVOCI (€18 million), securities at amortised cost (€15 million) and ECL provisions for off - balance - sheet exposures (€137 million) recognised as Stage 3 includes €25 million for purchased or originated credit - impaired (POCI) financial assets. Risk Management 1) The Stage 3 coverage ratio is determined by dividing Stage 3 provisions by Stage 3 outstandings, with provisions for purchased or originated credit - impaired (POCI) assets excluded from the calculation.
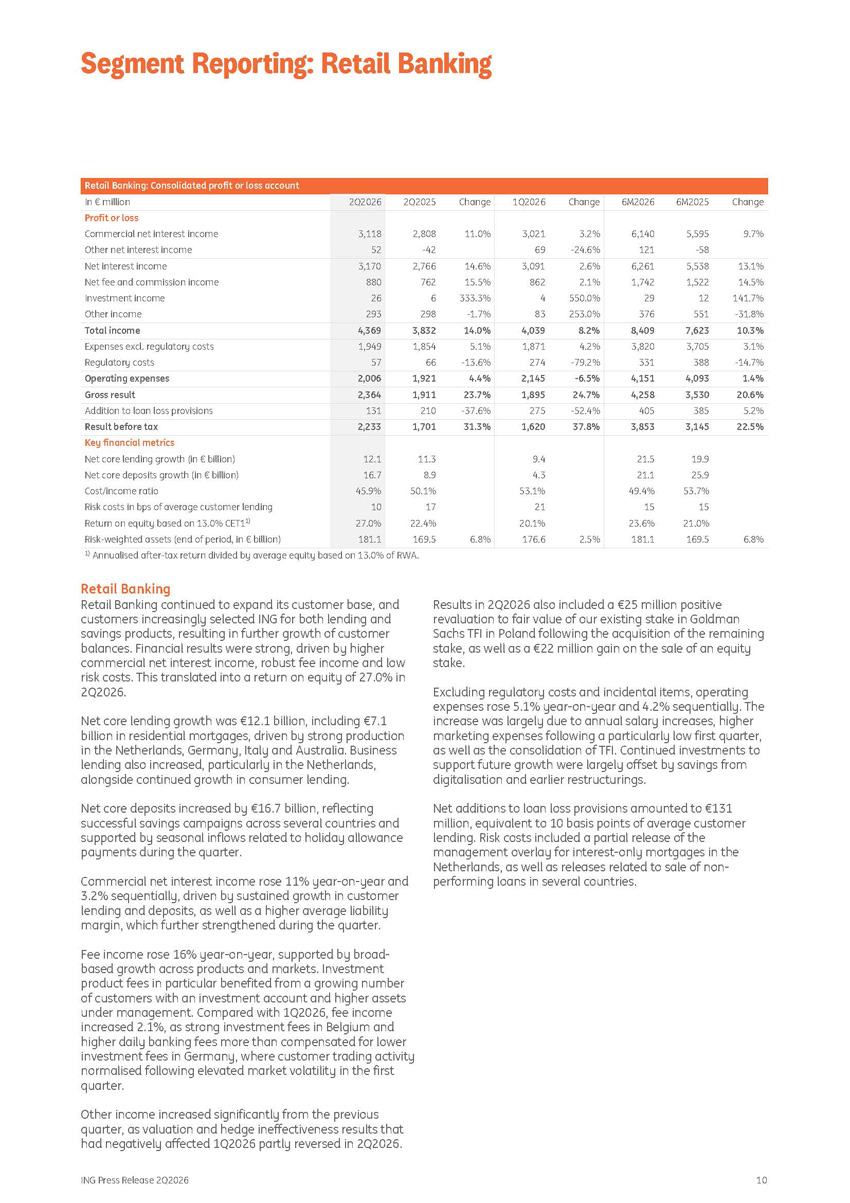
ING Press Release 2Q2026 10 Retail Banking: Consolidated profit or loss account Change 6M2025 6M2026 Change 1Q2026 Change 2Q2025 2Q2026 In € million 9.7% 5,595 - 58 6,140 121 3.2% - 24.6% 3,021 69 11.0% 2,808 - 42 3,118 52 Profit or loss Commercial net interest income Other net interest income 13.1% 5,538 6,261 2.6% 3,091 14.6% 2,766 3,170 Net interest income 14.5% 1,522 1,742 2.1% 862 15.5% 762 880 Net fee and commission income 141.7% 12 29 550.0% 4 333.3% 6 26 Investment income - 31.8% 551 376 253.0% 83 - 1.7% 298 293 Other income 10.3% 7,623 8,409 8.2% 4,039 14.0% 3,832 4,369 Total income 3.1% 3,705 3,820 4.2% 1,871 5.1% 1,854 1,949 Expenses excl. regulatory costs - 14.7% 388 331 - 79.2% 274 - 13.6% 66 57 Regulatory costs 1.4% 4,093 4,151 - 6.5% 2,145 4.4% 1,921 2,006 Operating expenses 20.6% 3,530 4,258 24.7% 1,895 23.7% 1,911 2,364 Gross result 5.2% 385 405 - 52.4% 275 - 37.6% 210 131 Addition to loan loss provisions 22.5% 3,145 3,853 37.8% 1,620 31.3% 1,701 2,233 Result before tax Key financial metrics 19.9 21.5 9.4 11.3 12.1 Net core lending growth (in € billion) 25.9 21.1 4.3 8.9 16.7 Net core deposits growth (in € billion) 53.7% 49.4% 53.1% 50.1% 45.9% Cost/income ratio 15 15 21 17 10 Risk costs in bps of average customer lending 21.0% 23.6% 20.1% 22.4% 27.0% Return on equity based on 13.0% CET1 1) 6.8% 169.5 181.1 2.5% 176.6 6.8% 169.5 181.1 Risk - weighted assets (end of period, in € billion) 1) Annualised after - tax return divided by average equity based on 13.0% of RWA. Retail Banking Retail Banking continued to expand its customer base, and customers increasingly selected ING for both lending and savings products, resulting in further growth of customer balances. Financial results were strong, driven by higher commercial net interest income, robust fee income and low risk costs. This translated into a return on equity of 27.0% in 2Q2026. Net core lending growth was €12.1 billion, including €7.1 billion in residential mortgages, driven by strong production in the Netherlands, Germany, Italy and Australia. Business lending also increased, particularly in the Netherlands, alongside continued growth in consumer lending. Net core deposits increased by €16.7 billion, reflecting successful savings campaigns across several countries and supported by seasonal inflows related to holiday allowance payments during the quarter. Commercial net interest income rose 11% year - on - year and 3.2% sequentially, driven by sustained growth in customer lending and deposits, as well as a higher average liability margin, which further strengthened during the quarter. Fee income rose 16% year - on - year, supported by broad - based growth across products and markets. Investment product fees in particular benefited from a growing number of customers with an investment account and higher assets under management. Compared with 1Q2026, fee income increased 2.1%, as strong investment fees in Belgium and higher daily banking fees more than compensated for lower investment fees in Germany, where customer trading activity normalised following elevated market volatility in the first quarter. Other income increased significantly from the previous quarter, as valuation and hedge ineffectiveness results that had negatively affected 1Q2026 partly reversed in 2Q2026. Results in 2Q2026 also included a €25 million positive revaluation to fair value of our existing stake in Goldman Sachs TFI in Poland following the acquisition of the remaining stake, as well as a €22 million gain on the sale of an equity stake. Excluding regulatory costs and incidental items, operating expenses rose 5.1% year - on - year and 4.2% sequentially. The increase was largely due to annual salary increases, higher marketing expenses following a particularly low first quarter, as well as the consolidation of TFI. Continued investments to support future growth were largely offset by savings from digitalisation and earlier restructurings. Net additions to loan loss provisions amounted to €131 million, equivalent to 10 basis points of average customer lending. Risk costs included a partial release of the management overlay for interest - only mortgages in the Netherlands, as well as releases related to sale of non - performing loans in several countries. Segment Reporting: Retail Banking
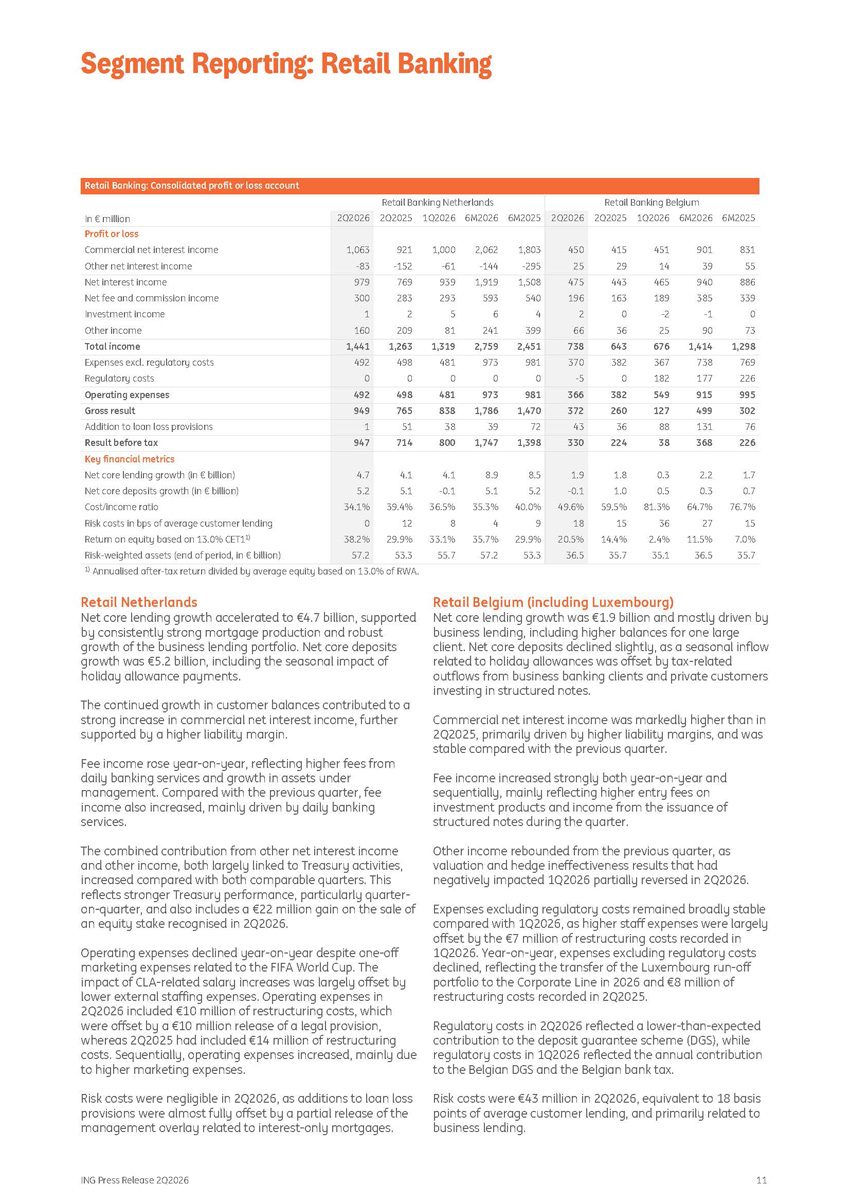
ING Press Release 2Q2026 11 Retail Banking: Consolidated profit or loss account Retail Banking Belgium Retail Banking Netherlands 2Q2025 1Q2026 6M2026 6M2025 2Q2026 2Q2025 1Q2026 6M2026 6M2025 2Q2026 In € million Profit or loss 415 451 901 831 450 921 1,000 2,062 1,803 1,063 Commercial net interest income 29 14 39 55 25 - 152 - 61 - 144 - 295 - 83 Other net interest income 443 465 940 886 475 769 939 1,919 1,508 979 Net interest income 163 189 385 339 196 283 293 593 540 300 Net fee and commission income 0 - 2 - 1 0 2 2 5 6 4 1 Investment income 36 25 90 73 66 209 81 241 399 160 Other income 643 676 1,414 1,298 738 1,263 1,319 2,759 2,451 1,441 Total income 382 367 738 769 370 498 481 973 981 492 Expenses excl. regulatory costs 0 182 177 226 - 5 0 0 0 0 0 Regulatory costs 382 549 915 995 366 498 481 973 981 492 Operating expenses 260 127 499 302 372 765 838 1,786 1,470 949 Gross result 36 88 131 76 43 51 38 39 72 1 Addition to loan loss provisions 224 38 368 226 330 714 800 1,747 1,398 947 Result before tax Key financial metrics 1.8 0.3 2.2 1.7 1.9 4.1 4.1 8.9 8.5 4.7 Net core lending growth (in € billion) 1.0 0.5 0.3 0.7 - 0.1 5.1 - 0.1 5.1 5.2 5.2 Net core deposits growth (in € billion) 59.5% 81.3% 64.7% 76.7% 49.6% 39.4% 36.5% 35.3% 40.0% 34.1% Cost/income ratio 15 36 27 15 18 12 8 4 9 0 Risk costs in bps of average customer lending 14.4% 2.4% 11.5% 7.0% 20.5% 29.9% 33.1% 35.7% 29.9% 38.2% Return on equity based on 13.0% CET1 1) 35.7 35.1 36.5 35.7 36.5 53.3 55.7 57.2 53.3 57.2 Risk - weighted assets (end of period, in € billion) 1) Annualised after - tax return divided by average equity based on 13.0% of RWA. Retail Netherlands Net core lending growth accelerated to €4.7 billion, supported by consistently strong mortgage production and robust growth of the business lending portfolio. Net core deposits growth was €5.2 billion, including the seasonal impact of holiday allowance payments. The continued growth in customer balances contributed to a strong increase in commercial net interest income, further supported by a higher liability margin. Fee income rose year - on - year, reflecting higher fees from daily banking services and growth in assets under management. Compared with the previous quarter, fee income also increased, mainly driven by daily banking services. The combined contribution from other net interest income and other income, both largely linked to Treasury activities, increased compared with both comparable quarters. This reflects stronger Treasury performance, particularly quarter - on - quarter, and also includes a €22 million gain on the sale of an equity stake recognised in 2Q2026. Operating expenses declined year - on - year despite one - off marketing expenses related to the FIFA World Cup. The impact of CLA - related salary increases was largely offset by lower external staffing expenses. Operating expenses in 2Q2026 included €10 million of restructuring costs, which were offset by a €10 million release of a legal provision, whereas 2Q2025 had included €14 million of restructuring costs. Sequentially, operating expenses increased, mainly due to higher marketing expenses. Risk costs were negligible in 2Q2026, as additions to loan loss provisions were almost fully offset by a partial release of the management overlay related to interest - only mortgages. Retail Belgium (including Luxembourg) Net core lending growth was €1.9 billion and mostly driven by business lending, including higher balances for one large client. Net core deposits declined slightly, as a seasonal inflow related to holiday allowances was offset by tax - related outflows from business banking clients and private customers investing in structured notes. Commercial net interest income was markedly higher than in 2 Q 2025 , primarily driven by higher liability margins, and was stable compared with the previous quarter . Fee income increased strongly both year - on - year and sequentially, mainly reflecting higher entry fees on investment products and income from the issuance of structured notes during the quarter. Other income rebounded from the previous quarter, as valuation and hedge ineffectiveness results that had negatively impacted 1Q2026 partially reversed in 2Q2026. Expenses excluding regulatory costs remained broadly stable compared with 1Q2026, as higher staff expenses were largely offset by the €7 million of restructuring costs recorded in 1Q2026. Year - on - year, expenses excluding regulatory costs declined, reflecting the transfer of the Luxembourg run - off portfolio to the Corporate Line in 2026 and €8 million of restructuring costs recorded in 2Q2025. Regulatory costs in 2Q2026 reflected a lower - than - expected contribution to the deposit guarantee scheme (DGS), while regulatory costs in 1Q2026 reflected the annual contribution to the Belgian DGS and the Belgian bank tax. Risk costs were € 43 million in 2 Q 2026 , equivalent to 18 basis points of average customer lending, and primarily related to business lending . Segment Reporting: Retail Banking
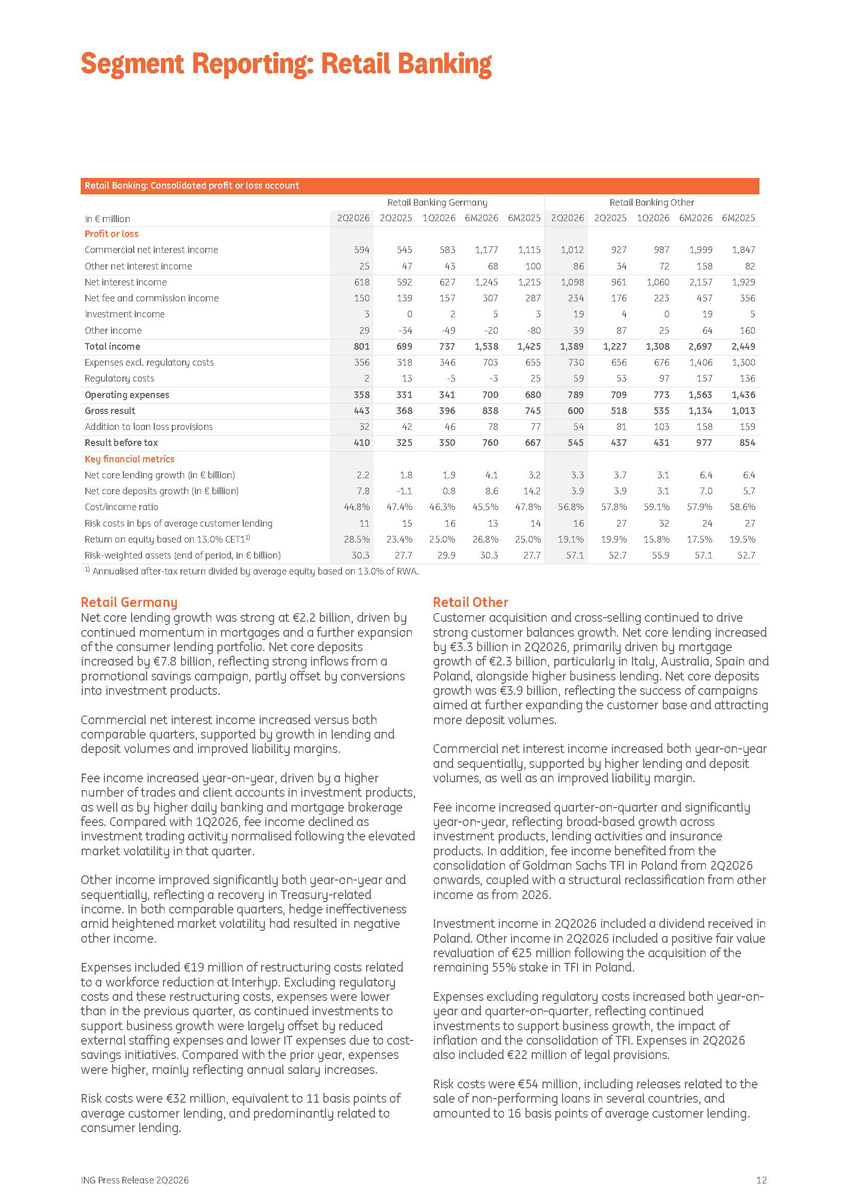
ING Press Release 2Q2026 12 Retail Banking: Consolidated profit or loss account Retail Banking Other Retail Banking Germany 2Q2025 1Q2026 6M2026 6M2025 2Q2026 2Q2025 1Q2026 6M2026 6M2025 2Q2026 In € million Profit or loss 927 987 1,999 1,847 1,012 545 583 1,177 1,115 594 Commercial net interest income 34 72 158 82 86 47 43 68 100 25 Other net interest income 961 1,060 2,157 1,929 1,098 592 627 1,245 1,215 618 Net interest income 176 223 457 356 234 139 157 307 287 150 Net fee and commission income 4 0 19 5 19 0 2 5 3 3 Investment income 87 25 64 160 39 - 34 - 49 - 20 - 80 29 Other income 1,227 1,308 2,697 2,449 1,389 699 737 1,538 1,425 801 Total income 656 676 1,406 1,300 730 318 346 703 655 356 Expenses excl. regulatory costs 53 97 157 136 59 13 - 5 - 3 25 2 Regulatory costs 709 773 1,563 1,436 789 331 341 700 680 358 Operating expenses 518 535 1,134 1,013 600 368 396 838 745 443 Gross result 81 103 158 159 54 42 46 78 77 32 Addition to loan loss provisions 437 431 977 854 545 325 350 760 667 410 Result before tax Key financial metrics 3.7 3.1 6.4 6.4 3.3 1.8 1.9 4.1 3.2 2.2 Net core lending growth (in € billion) 3.9 3.1 7.0 5.7 3.9 - 1.1 0.8 8.6 14.2 7.8 Net core deposits growth (in € billion) 57.8% 59.1% 57.9% 58.6% 56.8% 47.4% 46.3% 45.5% 47.8% 44.8% Cost/income ratio 27 32 24 27 16 15 16 13 14 11 Risk costs in bps of average customer lending 19.9% 15.8% 17.5% 19.5% 19.1% 23.4% 25.0% 26.8% 25.0% 28.5% Return on equity based on 13.0% CET1 1) 52.7 55.9 57.1 52.7 57.1 27.7 29.9 30.3 27.7 30.3 Risk - weighted assets (end of period, in € billion) 1) Annualised after - tax return divided by average equity based on 13.0% of RWA. Retail Germany Net core lending growth was strong at €2.2 billion, driven by continued momentum in mortgages and a further expansion of the consumer lending portfolio. Net core deposits increased by €7.8 billion, reflecting strong inflows from a promotional savings campaign, partly offset by conversions into investment products. Commercial net interest income increased versus both comparable quarters, supported by growth in lending and deposit volumes and improved liability margins. Fee income increased year - on - year, driven by a higher number of trades and client accounts in investment products, as well as by higher daily banking and mortgage brokerage fees. Compared with 1Q2026, fee income declined as investment trading activity normalised following the elevated market volatility in that quarter. Other income improved significantly both year - on - year and sequentially, reflecting a recovery in Treasury - related income. In both comparable quarters, hedge ineffectiveness amid heightened market volatility had resulted in negative other income. Expenses included €19 million of restructuring costs related to a workforce reduction at Interhyp. Excluding regulatory costs and these restructuring costs, expenses were lower than in the previous quarter, as continued investments to support business growth were largely offset by reduced external staffing expenses and lower IT expenses due to cost - savings initiatives. Compared with the prior year, expenses were higher, mainly reflecting annual salary increases. Risk costs were €32 million, equivalent to 11 basis points of average customer lending, and predominantly related to consumer lending. Retail Other Customer acquisition and cross - selling continued to drive strong customer balances growth. Net core lending increased by €3.3 billion in 2Q2026, primarily driven by mortgage growth of €2.3 billion, particularly in Italy, Australia, Spain and Poland, alongside higher business lending. Net core deposits growth was €3.9 billion, reflecting the success of campaigns aimed at further expanding the customer base and attracting more deposit volumes. Commercial net interest income increased both year - on - year and sequentially, supported by higher lending and deposit volumes, as well as an improved liability margin. Fee income increased quarter - on - quarter and significantly year - on - year, reflecting broad - based growth across investment products, lending activities and insurance products. In addition, fee income benefited from the consolidation of Goldman Sachs TFI in Poland from 2Q2026 onwards, coupled with a structural reclassification from other income as from 2026. Investment income in 2Q2026 included a dividend received in Poland. Other income in 2Q2026 included a positive fair value revaluation of €25 million following the acquisition of the remaining 55% stake in TFI in Poland. Expenses excluding regulatory costs increased both year - on - year and quarter - on - quarter, reflecting continued investments to support business growth, the impact of inflation and the consolidation of TFI. Expenses in 2Q2026 also included €22 million of legal provisions. Risk costs were €54 million, including releases related to the sale of non - performing loans in several countries, and amounted to 16 basis points of average customer lending. Segment Reporting: Retail Banking
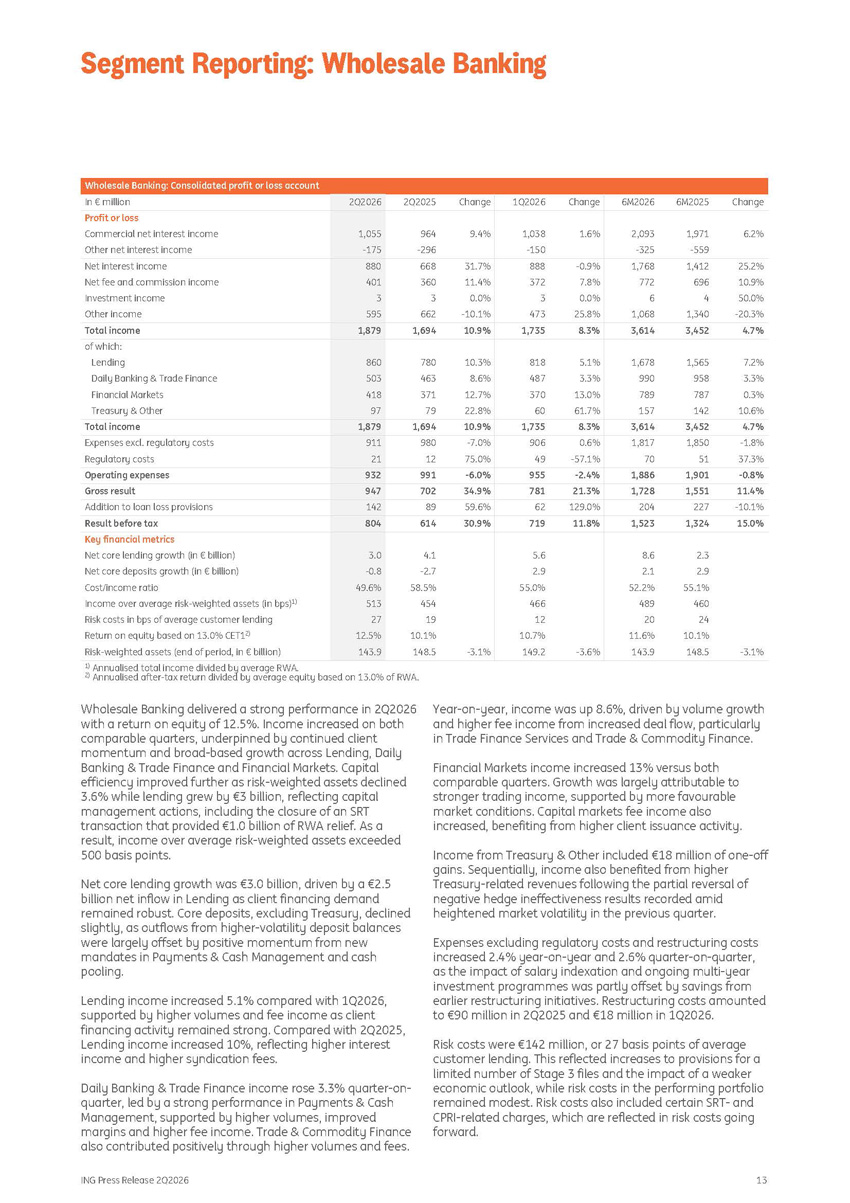
ING Press Release 2Q2026 13 Wholesale Banking: Consolidated profit or loss account Change 6M2025 6M2026 Change 1Q2026 Change 2Q2025 2Q2026 In € million 6.2% 1,971 - 559 2,093 - 325 1.6% 1,038 - 150 9.4% 964 - 296 1,055 - 175 Profit or loss Commercial net interest income Other net interest income 25.2% 1,412 1,768 - 0.9% 888 31.7% 668 880 Net interest income 10.9% 696 772 7.8% 372 11.4% 360 401 Net fee and commission income 50.0% 4 6 0.0% 3 0.0% 3 3 Investment income - 20.3% 1,340 1,068 25.8% 473 - 10.1% 662 595 Other income 4.7% 3,452 3,614 8.3% 1,735 10.9% 1,694 1,879 Total income of which: 7.2% 1,565 1,678 5.1% 818 10.3% 780 860 Lending 3.3% 958 990 3.3% 487 8.6% 463 503 Daily Banking & Trade Finance 0.3% 787 789 13.0% 370 12.7% 371 418 Financial Markets 10.6% 142 157 61.7% 60 22.8% 79 97 Treasury & Other 4.7% 3,452 3,614 8.3% 1,735 10.9% 1,694 1,879 Total income - 1.8% 1,850 1,817 0.6% 906 - 7.0% 980 911 Expenses excl. regulatory costs 37.3% 51 70 - 57.1% 49 75.0% 12 21 Regulatory costs - 0.8% 1,901 1,886 - 2.4% 955 - 6.0% 991 932 Operating expenses 11.4% 1,551 1,728 21.3% 781 34.9% 702 947 Gross result - 10.1% 227 204 129.0% 62 59.6% 89 142 Addition to loan loss provisions 15.0% 1,324 1,523 11.8% 719 30.9% 614 804 Result before tax Key financial metrics 2.3 8.6 5.6 4.1 3.0 Net core lending growth (in € billion) 2.9 2.1 2.9 - 2.7 - 0.8 Net core deposits growth (in € billion) 55.1% 52.2% 55.0% 58.5% 49.6% Cost/income ratio 460 489 466 454 513 Income over average risk - weighted assets (in bps) 1) 24 20 12 19 27 Risk costs in bps of average customer lending 10.1% 11.6% 10.7% 10.1% 12.5% Return on equity based on 13.0% CET1 2) - 3.1% 148.5 143.9 - 3.6% 149.2 - 3.1% 148.5 143.9 Risk - weighted assets (end of period, in € billion) 1) Annualised total income divided by average RWA. 2) Annualised after - tax return divided by average equity based on 13.0% of RWA. Wholesale Banking delivered a strong performance in 2Q2026 with a return on equity of 12.5%. Income increased on both comparable quarters, underpinned by continued client momentum and broad - based growth across Lending, Daily Banking & Trade Finance and Financial Markets. Capital efficiency improved further as risk - weighted assets declined 3.6% while lending grew by €3 billion, reflecting capital management actions, including the closure of an SRT transaction that provided €1.0 billion of RWA relief. As a result, income over average risk - weighted assets exceeded 500 basis points. Net core lending growth was €3.0 billion, driven by a €2.5 billion net inflow in Lending as client financing demand remained robust. Core deposits, excluding Treasury, declined slightly, as outflows from higher - volatility deposit balances were largely offset by positive momentum from new mandates in Payments & Cash Management and cash pooling. Lending income increased 5.1% compared with 1Q2026, supported by higher volumes and fee income as client financing activity remained strong. Compared with 2Q2025, Lending income increased 10%, reflecting higher interest income and higher syndication fees. Daily Banking & Trade Finance income rose 3.3% quarter - on - quarter, led by a strong performance in Payments & Cash Management, supported by higher volumes, improved margins and higher fee income. Trade & Commodity Finance also contributed positively through higher volumes and fees. Year - on - year, income was up 8.6%, driven by volume growth and higher fee income from increased deal flow, particularly in Trade Finance Services and Trade & Commodity Finance. Financial Markets income increased 13% versus both comparable quarters. Growth was largely attributable to stronger trading income, supported by more favourable market conditions. Capital markets fee income also increased, benefiting from higher client issuance activity. Income from Treasury & Other included €18 million of one - off gains. Sequentially, income also benefited from higher Treasury - related revenues following the partial reversal of negative hedge ineffectiveness results recorded amid heightened market volatility in the previous quarter. Expenses excluding regulatory costs and restructuring costs increased 2.4% year - on - year and 2.6% quarter - on - quarter, as the impact of salary indexation and ongoing multi - year investment programmes was partly offset by savings from earlier restructuring initiatives. Restructuring costs amounted to €90 million in 2Q2025 and €18 million in 1Q2026. Risk costs were €142 million, or 27 basis points of average customer lending. This reflected increases to provisions for a limited number of Stage 3 files and the impact of a weaker economic outlook, while risk costs in the performing portfolio remained modest. Risk costs also included certain SRT - and CPRI - related charges, which are reflected in risk costs going forward. Segment Reporting: Wholesale Banking
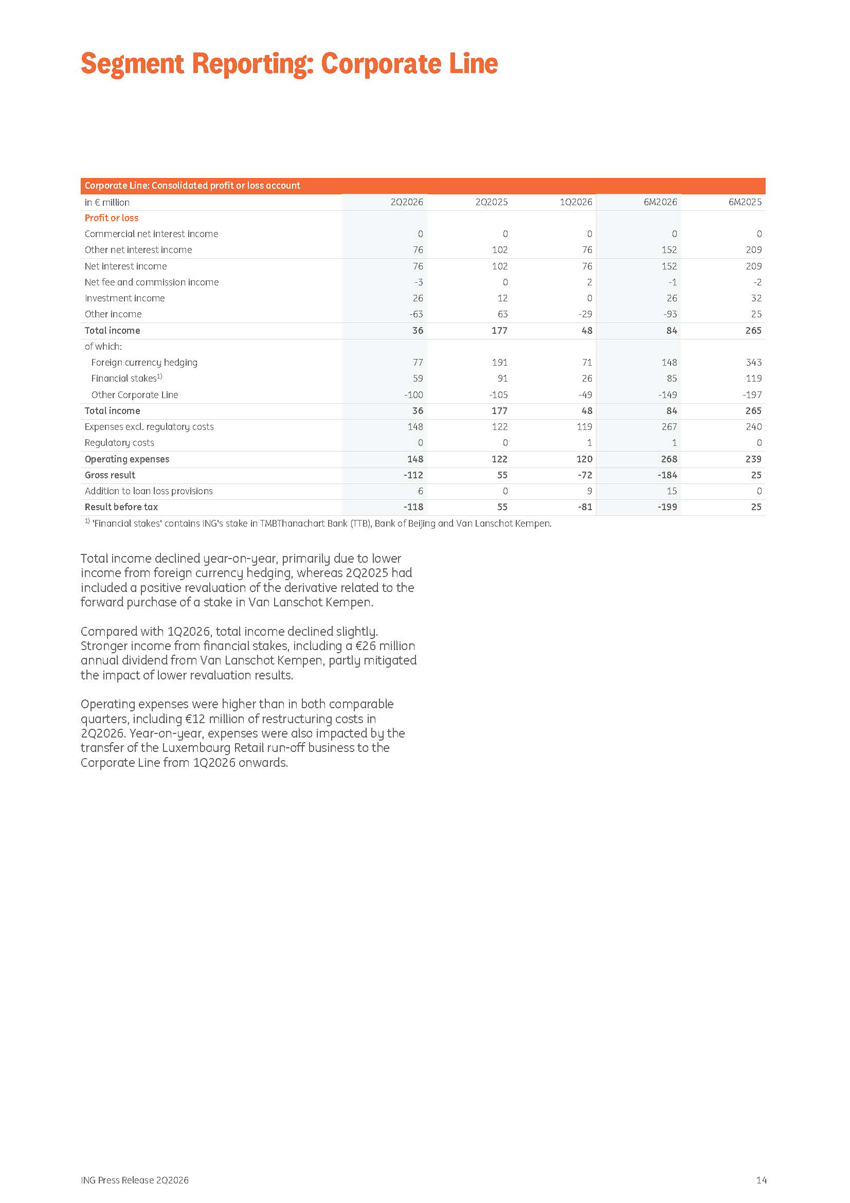
ING Press Release 2Q2026 14 Corporate Line: Consolidated profit or loss account 6M2025 6M2026 1Q2026 2Q2025 2Q2026 in € million 0 209 0 152 0 76 0 102 0 76 Profit or loss Commercial net interest income Other net interest income 209 152 76 102 76 Net interest income - 2 - 1 2 0 - 3 Net fee and commission income 32 26 0 12 26 Investment income 25 - 93 - 29 63 - 63 Other income 265 84 48 177 36 Total income of which: 343 148 71 191 77 Foreign currency hedging 119 85 26 91 59 Financial stakes 1) - 197 - 149 - 49 - 105 - 100 Other Corporate Line 265 84 48 177 36 Total income 240 267 119 122 148 Expenses excl. regulatory costs 0 1 1 0 0 Regulatory costs 239 268 120 122 148 Operating expenses 25 - 184 - 72 55 - 112 Gross result 0 15 9 0 6 Addition to loan loss provisions 25 - 199 - 81 55 - 118 Result before tax 1) 'Financial stakes' contains ING's stake in TMBThanachart Bank (TTB), Bank of Beijing and Van Lanschot Kempen. Total income declined year - on - year, primarily due to lower income from foreign currency hedging, whereas 2Q2025 had included a positive revaluation of the derivative related to the forward purchase of a stake in Van Lanschot Kempen. Compared with 1Q2026, total income declined slightly. Stronger income from financial stakes, including a €26 million annual dividend from Van Lanschot Kempen, partly mitigated the impact of lower revaluation results. Operating expenses were higher than in both comparable quarters, including €12 million of restructuring costs in 2Q2026. Year - on - year, expenses were also impacted by the transfer of the Luxembourg Retail run - off business to the Corporate Line from 1Q2026 onwards. Segment Reporting: Corporate Line
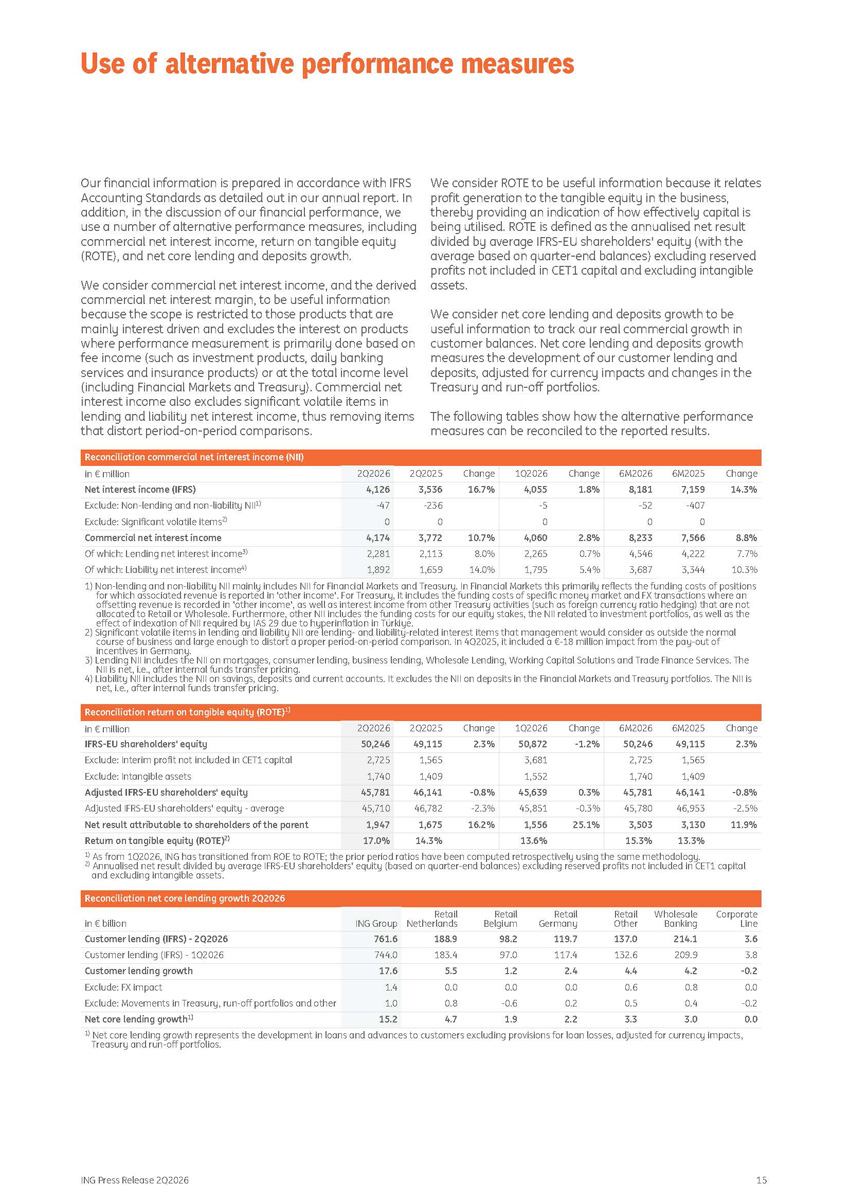
ING Press Release 2Q2026 15 Our financial information is prepared in accordance with IFRS Accounting Standards as detailed out in our annual report. In addition, in the discussion of our financial performance, we use a number of alternative performance measures, including commercial net interest income, return on tangible equity (ROTE), and net core lending and deposits growth. We consider commercial net interest income, and the derived commercial net interest margin, to be useful information because the scope is restricted to those products that are mainly interest driven and excludes the interest on products where performance measurement is primarily done based on fee income (such as investment products, daily banking services and insurance products) or at the total income level (including Financial Markets and Treasury). Commercial net interest income also excludes significant volatile items in lending and liability net interest income, thus removing items that distort period - on - period comparisons. We consider ROTE to be useful information because it relates profit generation to the tangible equity in the business, thereby providing an indication of how effectively capital is being utilised. ROTE is defined as the annualised net result divided by average IFRS - EU shareholders' equity (with the average based on quarter - end balances) excluding reserved profits not included in CET1 capital and excluding intangible assets. We consider net core lending and deposits growth to be useful information to track our real commercial growth in customer balances. Net core lending and deposits growth measures the development of our customer lending and deposits, adjusted for currency impacts and changes in the Treasury and run - off portfolios. The following tables show how the alternative performance measures can be reconciled to the reported results. Reconciliation commercial net interest income (NII) Change 6M2025 6M2026 Change 1Q2026 Change 2Q2025 2Q2026 in € million 14.3% 7,159 8,181 1.8% 4,055 16.7% 3,536 4,126 Net interest income (IFRS) - 407 - 52 - 5 - 236 - 47 Exclude: Non - lending and non - liability NII 1) 0 0 0 0 0 Exclude: Significant volatile items 2) 8.8% 7,566 8,233 2.8% 4,060 10.7% 3,772 4,174 Commercial net interest income 7.7% 4,222 4,546 0.7% 2,265 8.0% 2,113 2,281 Of which: Lending net interest income 3) 10.3% 3,344 3,687 5.4% 1,795 14.0% 1,659 1,892 Of which: Liability net interest income 4) 1) Non - lending and non - liability NII mainly includes NII for Financial Markets and Treasury. In Financial Markets this primarily reflects the funding costs of positions for which associated revenue is reported in 'other income'. For Treasury, it includes the funding costs of specific money market and FX transactions where an offsetting revenue is recorded in 'other income', as well as interest income from other Treasury activities (such as foreign currency ratio hedging) that are not allocated to Retail or Wholesale. Furthermore, other NII includes the funding costs for our equity stakes, the NII related to investment portfolios, as well as the effect of indexation of NII required by IAS 29 due to hyperinflation in Türkiye. 2) Significant volatile items in lending and liability NII are lending - and liability - related interest items that management would consider as outside the normal course of business and large enough to distort a proper period - on - period comparison. In 4Q2025, it included a € - 18 million impact from the pay - out of incentives in Germany. 3) Lending NII includes the NII on mortgages, consumer lending, business lending, Wholesale Lending, Working Capital Solutions and Trade Finance Services. The NII is net, i.e., after internal funds transfer pricing. 4) Liability NII includes the NII on savings, deposits and current accounts. It excludes the NII on deposits in the Financial Markets and Treasury portfolios. The NII is net, i.e., after internal funds transfer pricing. Reconciliation return on tangible equity (ROTE) 1) Change 6M2025 6M2026 Change 1Q2026 Change 2Q2025 2Q2026 in € million 2.3% 49,115 50,246 - 1.2% 50,872 2.3% 49,115 50,246 IFRS - EU shareholders' equity 1,565 2,725 3,681 1,565 2,725 Exclude: Interim profit not included in CET1 capital 1,409 1,740 1,552 1,409 1,740 Exclude: Intangible assets - 0.8% 46,141 45,781 0.3% 45,639 - 0.8% 46,141 45,781 Adjusted IFRS - EU shareholders' equity - 2.5% 46,953 45,780 - 0.3% 45,851 - 2.3% 46,782 45,710 Adjusted IFRS - EU shareholders' equity - average 11.9% 3,130 3,503 25.1% 1,556 16.2% 1,675 1,947 Net result attributable to shareholders of the parent 13.3% 15.3% 13.6% 14.3% 17.0% Return on tangible equity (ROTE) 2) 1) As from 1Q2026, ING has transitioned from ROE to ROTE; the prior period ratios have been computed retrospectively using the same methodology. 2) Annualised net result divided by average IFRS - EU shareholders' equity (based on quarter - end balances) excluding reserved profits not included in CET1 capital and excluding intangible assets. Reconciliation net core lending growth 2Q2026 Corporate Line Wholesale Banking Retail Other Retail Germany Retail Belgium Retail Netherlands ING Group in € billion 3.6 214.1 137.0 119.7 98.2 188.9 761.6 Customer lending (IFRS) - 2Q2026 3.8 209.9 132.6 117.4 97.0 183.4 744.0 Customer lending (IFRS) - 1Q2026 - 0.2 4.2 4.4 2.4 1.2 5.5 17.6 Customer lending growth 0.0 0.8 0.6 0.0 0.0 0.0 1.4 Exclude: FX impact - 0.2 0.4 0.5 0.2 - 0.6 0.8 1.0 Exclude: Movements in Treasury, run - off portfolios and other 0.0 3.0 3.3 2.2 1.9 4.7 15.2 Net core lending growth 1) 1) Net core lending growth represents the development in loans and advances to customers excluding provisions for loan losses, adjusted for currency impacts, Treasury and run - off portfolios. Use of alternative performance measures
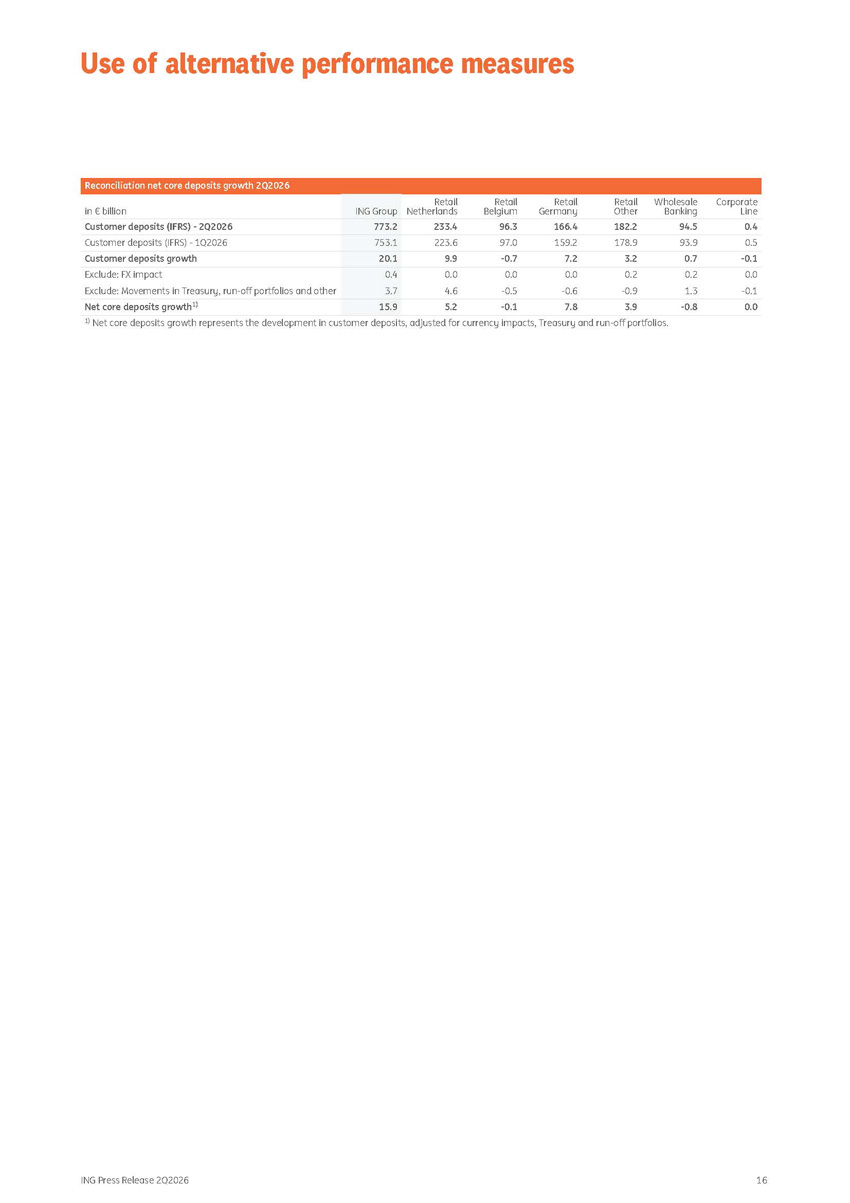
ING Press Release 2Q2026 16 Reconciliation net core deposits growth 2Q2026 Corporate Line Wholesale Banking Retail Other Retail Germany Retail Belgium Retail Netherlands ING Group in € billion 0.4 94.5 182.2 166.4 96.3 233.4 773.2 Customer deposits (IFRS) - 2Q2026 0.5 93.9 178.9 159.2 97.0 223.6 753.1 Customer deposits (IFRS) - 1Q2026 - 0.1 0.7 3.2 7.2 - 0.7 9.9 20.1 Customer deposits growth 0.0 0.2 0.2 0.0 0.0 0.0 0.4 Exclude: FX impact - 0.1 1.3 - 0.9 - 0.6 - 0.5 4.6 3.7 Exclude: Movements in Treasury, run - off portfolios and other 0.0 - 0.8 3.9 7.8 - 0.1 5.2 15.9 Net core deposits growth 1) 1) Net core deposits growth represents the development in customer deposits, adjusted for currency impacts, Treasury and run - off portfolios. Use of alternative performance measures
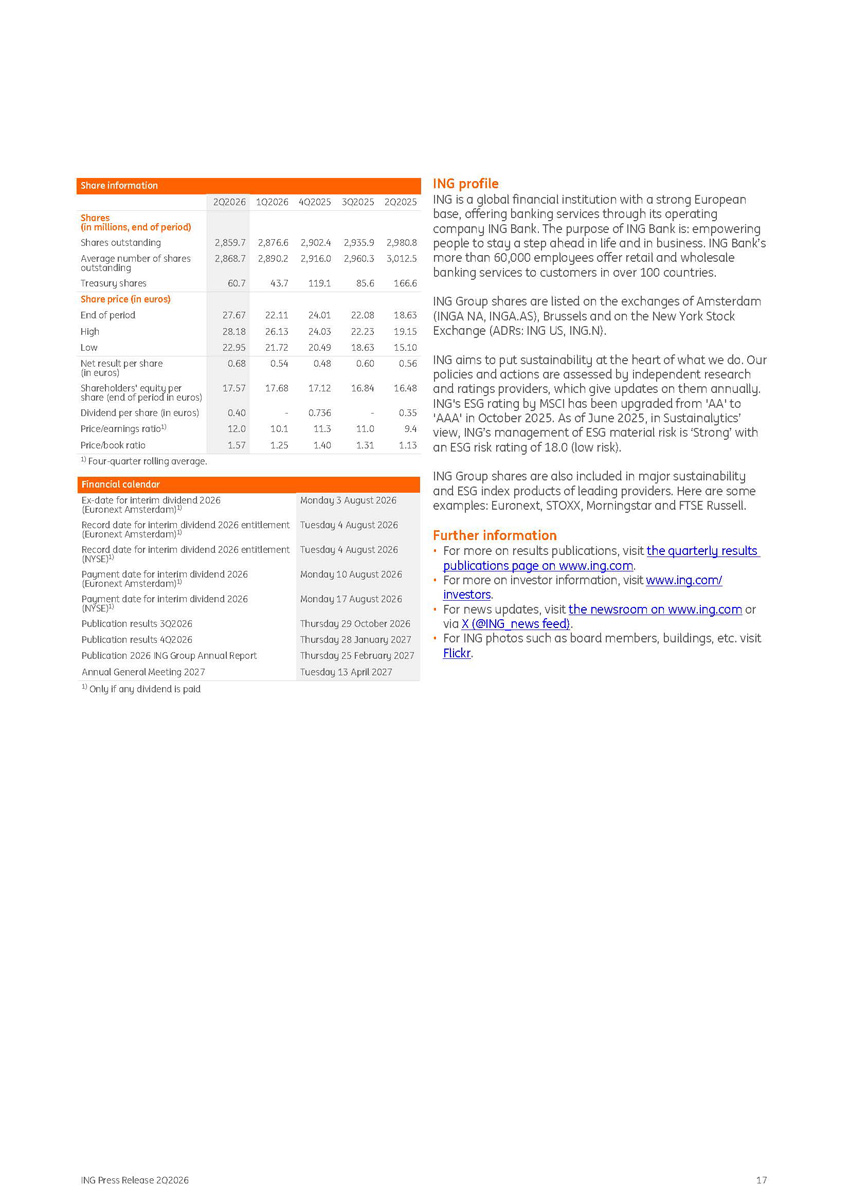
Share information 2Q2025 3Q2025 4Q2025 1Q2026 2Q2026 2,980.8 3,012.5 166.6 2,935.9 2,960.3 85.6 2,902.4 2,916.0 119.1 2,876.6 2,890.2 43.7 2,859.7 2,868.7 60.7 Shares (in millions, end of period) Shares outstanding Average number of shares outstanding Treasury shares Share price (in euros) 18.63 22.08 24.01 22.11 27.67 End of period 19.15 22.23 24.03 26.13 28.18 High 15.10 18.63 20.49 21.72 22.95 Low 0.56 0.60 0.48 0.54 0.68 Net result per share (in euros) 16.48 16.84 17.12 17.68 17.57 Shareholders' equity per share (end of period in euros) 0.35 - 0.736 - 0.40 Dividend per share (in euros) 9.4 11.0 11.3 10.1 12.0 Price/earnings ratio 1) 1.13 1.31 1.40 1.25 1.57 Price/book ratio 1) Four - quarter rolling average. Financial calendar Ex - date for interim dividend 2026 (Euronext Amsterdam) 1) Record date for interim dividend 2026 entitlement (Euronext Amsterdam) 1) Record date for interim dividend 2026 entitlement (NYSE) 1) Payment date for interim dividend 2026 (Euronext Amsterdam) 1) Payment date for interim dividend 2026 (NYSE) 1) Publication results 3Q2026 Publication results 4Q2026 Publication 2026 ING Group Annual Report Annual General Meeting 2027 Monday 3 August 2026 Tuesday 4 August 2026 Tuesday 4 August 2026 Monday 10 August 2026 Monday 17 August 2026 Thursday 29 October 2026 Thursday 28 January 2027 Thursday 25 February 2027 Tuesday 13 April 2027 1) Only if any dividend is paid ING profile ING is a global financial institution with a strong European base, offering banking services through its operating company ING Bank. The purpose of ING Bank is: empowering people to stay a step ahead in life and in business. ING Bank’s more than 60,000 employees offer retail and wholesale banking services to customers in over 100 countries. ING Group shares are listed on the exchanges of Amsterdam (INGA NA, INGA.AS), Brussels and on the New York Stock Exchange (ADRs: ING US, ING.N). ING aims to put sustainability at the heart of what we do. Our policies and actions are assessed by independent research and ratings providers, which give updates on them annually. ING's ESG rating by MSCI has been upgraded from 'AA' to 'AAA' in October 2025. As of June 2025, in Sustainalytics’ view, ING’s management of ESG material risk is ‘Strong’ with an ESG risk rating of 18.0 (low risk). ING Group shares are also included in major sustainability and ESG index products of leading providers. Here are some examples: Euronext, STOXX, Morningstar and FTSE Russell. Further information • For more on results publications, visit the quarterly results publications page on www.ing.com . • For more on investor information, visit www.ing.com/ investors . ING Press Release 2Q2026 17 • For news updates, visit the newsroom on www.ing.com or via X (@ING_news feed) . • For ING photos such as board members, buildings, etc. visit Flickr .
ING Press Release 2Q2026 18 Important legal information Elements of this press release contain or may contain information about ING Groep N.V. and/ or ING Bank N.V. within the meaning of Article 7(1) to (4) of EU Regulation No 596/2014 (‘Market Abuse Regulation’). ING Group’s financial statements are prepared in accordance with International Financial Reporting Standards as adopted by the European Union (‘IFRS - EU’). In preparing the financial information in this document, except as described otherwise, the same accounting principles are applied as in the 2025 ING Group consolidated financial statements. All figures in this document are unaudited. Small differences are possible in the tables due to rounding. Certain of the statements contained herein are not historical facts, including, without limitation, certain statements made of future expectations and other forward - looking statements that are based on management’s current views and assumptions and involve known and unknown risks and uncertainties that could cause actual results, performance or events to differ materially from those expressed or implied in such statements. Actual results, performance or events may differ materially from those in such statements due to a number of factors, including, without limitation: (1) changes in general economic conditions and customer behaviour, in particular economic conditions in ING’s core markets, including changes affecting currency exchange rates and the regional and global economic impact of the invasion of Russia into Ukraine and related international response measures (2) changes affecting interest rate levels (3) any default of a major market participant and related market disruption (4) changes in performance of financial markets, including in Europe and developing markets (5) fiscal uncertainty in Europe and the United States (6) discontinuation of or changes in ‘benchmark’ indices (7) inflation and deflation in our principal markets (8) changes in conditions in the credit and capital markets generally, including changes in borrower and counterparty creditworthiness (9) failures of banks falling under the scope of state compensation schemes (10) non - compliance with or changes in laws and regulations, including those concerning financial services, financial economic crimes and tax laws, and the interpretation and application thereof (11) geopolitical risks, political instabilities and policies and actions of governmental and regulatory authorities, including in connection with the invasion of Russia into Ukraine, other existing or emerging military conflicts, the risk of further military escalation, geopolitical tensions, trade restrictions and the related international response measures (12) legal and regulatory risks in certain countries with less developed legal and regulatory frameworks (13) prudential supervision and regulations, including in relation to stress tests and regulatory restrictions on dividends and distributions (also among members of the group) (14) ING’s ability to meet minimum capital and other prudential regulatory requirements (15) changes in regulation of US commodities and derivatives businesses of ING and its customers (16) application of bank recovery and resolution regimes, including write down and conversion powers in relation to our securities (17) outcome of current and future litigation, enforcement proceedings, investigations or other regulatory actions, including claims by customers or stakeholders who feel misled or treated unfairly, and other conduct issues (18) changes in tax laws and regulations and risks of non - compliance or investigation in connection with tax laws, including FATCA (19) operational and IT risks, such as system disruptions or failures, breaches of security, cyber - attacks, human error, changes in operational practices or inadequate controls including in respect of third parties with which we do business and including any risks as a result of incomplete, inaccurate, or otherwise flawed outputs from the algorithms and data sets utilized in artificial intelligence (20) risks and challenges related to cybercrime including the effects of cyberattacks and changes in legislation and regulation related to cybersecurity and data privacy, including such risks and challenges as a consequence of the use of emerging technologies, such as advanced forms of artificial intelligence and quantum computing (21) changes in general competitive factors, including ability to increase or maintain market share (22) inability to protect our intellectual property and infringement claims by third parties (23) inability of counterparties to meet financial obligations or ability to enforce rights against such counterparties (24) changes in credit ratings (25) business, operational, regulatory, reputation, transition and other risks and challenges in connection with climate change, diversity, equity and inclusion and other ESG - related matters, including data gathering and reporting and also including managing the conflicting laws and requirements of governments, regulators and authorities with respect to these topics (26) inability to attract and retain key personnel (27) future liabilities under defined benefit retirement plans (28) failure to manage business risks, including in connection with use of models, use of derivatives, or maintaining appropriate policies and guidelines (29) changes in capital and credit markets, including interbank funding, as well as customer deposits, which provide the liquidity and capital required to fund our operations, and (30) the other risks and uncertainties detailed in the most recent annual report of ING Groep N.V. (including the Risk Factors contained therein) and ING’s more recent disclosures, including press releases, which are available on www.ING.com. This document may contain ESG - related material that has been prepared by ING on the basis of publicly available information, internally developed data and other third - party sources believed to be reliable. ING has not sought to independently verify information obtained from public and third - party sources and makes no representations or warranties as to accuracy, completeness, reasonableness or reliability of such information. This document may also discuss one or more specific transactions and/or contain general statements about ING’s ESG approach. The approach and criteria referred to in this document are intended to be applied in accordance with applicable law. Due to the fact that there may be different or even conflicting laws, the approach, criteria or the application thereof, could be different. Materiality, as used in the context of ESG, is distinct from, and should not be confused with, such term as defined in the Market Abuse Regulation or as defined for Securities and Exchange Commission (‘SEC’) reporting purposes. Any issues identified as material for purposes of ESG in this document are therefore not necessarily material as defined in the Market Abuse Regulation or for SEC reporting purposes. In addition, there is currently no single, globally recognized set of accepted definitions in assessing whether activities are “green” or “sustainable.” Without limiting any of the statements contained herein, we make no representation or warranty as to whether any of our securities constitutes a green or sustainable security or conforms to present or future investor expectations or objectives for green or sustainable investing. For information on characteristics of a security, use of proceeds, a description of This document may contain inactive textual addresses to internet websites operated by us and third parties. Reference to such websites is made for information purposes only, and information found at such websites is not incorporated by reference into this document. ING does not make any representation or warranty with respect to the accuracy or completeness of, or take any responsibility for, any information found at any websites operated by third parties. ING specifically disclaims any liability with respect to any information found at websites operated by third parties. ING cannot guarantee that websites operated by third parties remain available following the publication of this document, or that any information found at such websites will not change following the filing of this document. Many of those factors are beyond ING’s control. Any forward - looking statements made by or on behalf of ING speak only as of the date they are made, and ING assumes no obligation to publicly update or revise any forward - looking statements, whether as a result of new information or for any other reason. This document does not constitute an offer to sell, or a solicitation of an offer to purchase, any securities in the United States or any other jurisdiction.