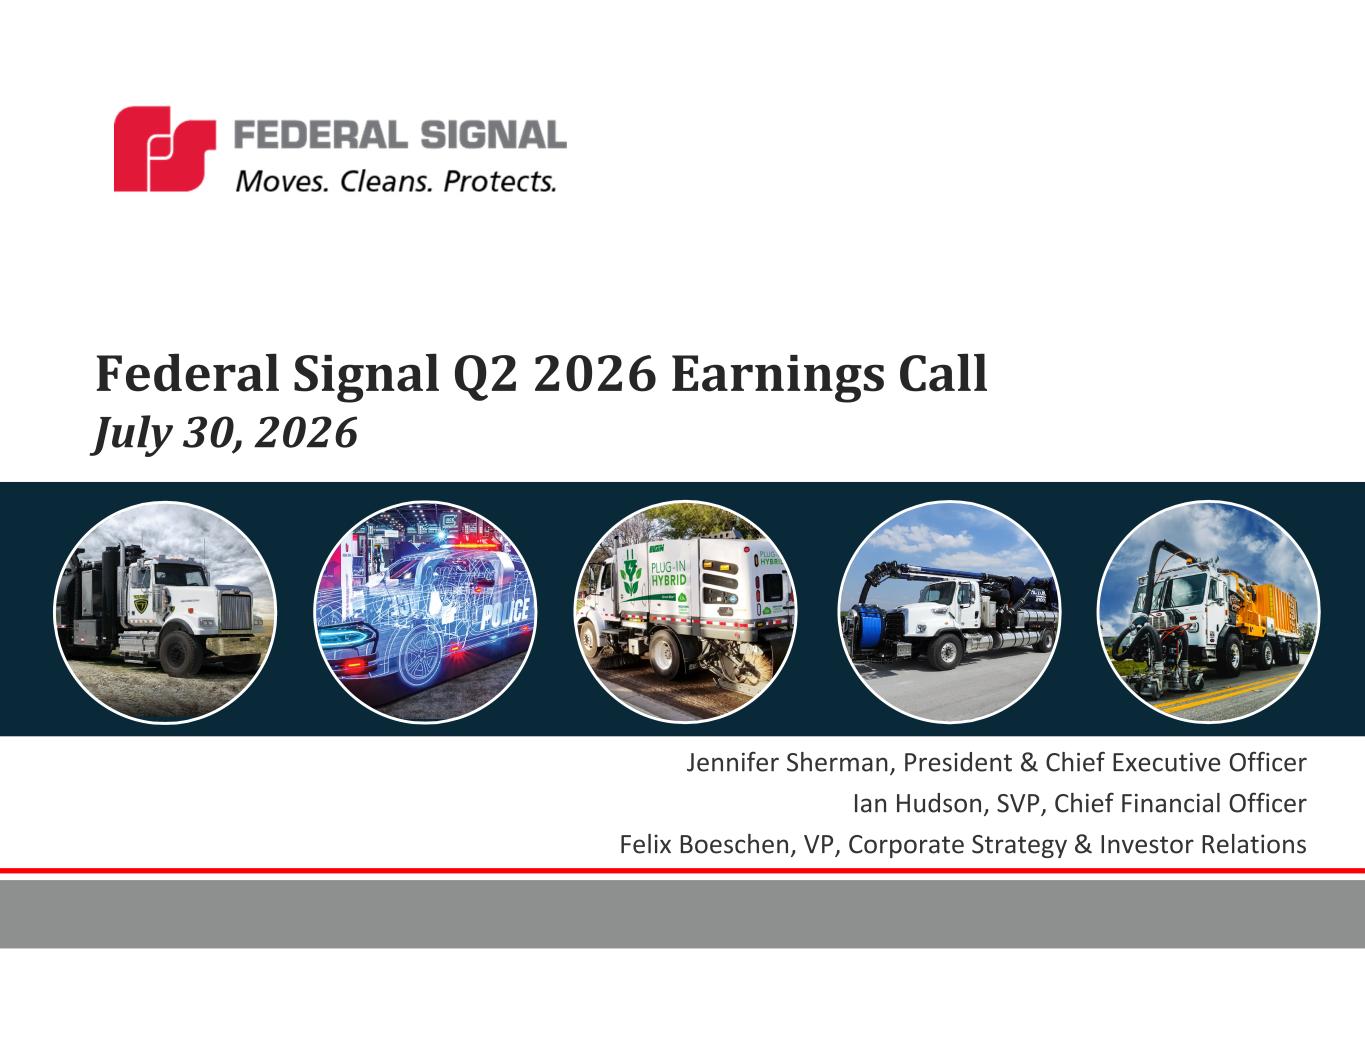
Federal Signal Q2 2026 Earnings Call July 30, 2026 Jennifer Sherman, President & Chief Executive Officer Ian Hudson, SVP, Chief Financial Officer Felix Boeschen, VP, Corporate Strategy & Investor Relations
Safe Harbor This presentation contains unaudited financial information and various forward-looking statements as of the date hereof and we undertake no obligation to update these forward- looking statements regardless of new developments or otherwise. Statements in this presentation that are not historical are forward-looking statements. Forward-looking statements should not be relied upon as a predictor of actual results. Such statements are subject to various risks and uncertainties that could cause actual results to vary materially from those stated. Such risks and uncertainties include but are not limited to: economic and political uncertainty, risks and adverse economic effects associated with geopolitical conflicts including tariffs and other trade conflicts, legal and regulatory developments, foreign currency exchange rate changes, inflationary pressures, product and price competition, supply chain disruptions, availability and pricing of raw materials, interest rate changes, risks associated with acquisitions such as integration of operations and achieving anticipated revenue and cost benefits, work stoppages, increases in pension funding requirements, cybersecurity risks, increased legal expenses and litigation results, and other risks and uncertainties described in filings with the Securities and Exchange Commission (SEC). This presentation also contains references to certain non-GAAP financial information. Such items are reconciled herein, in our earnings news release provided as of the date of this presentation, or in other investor materials filed with the SEC. 2
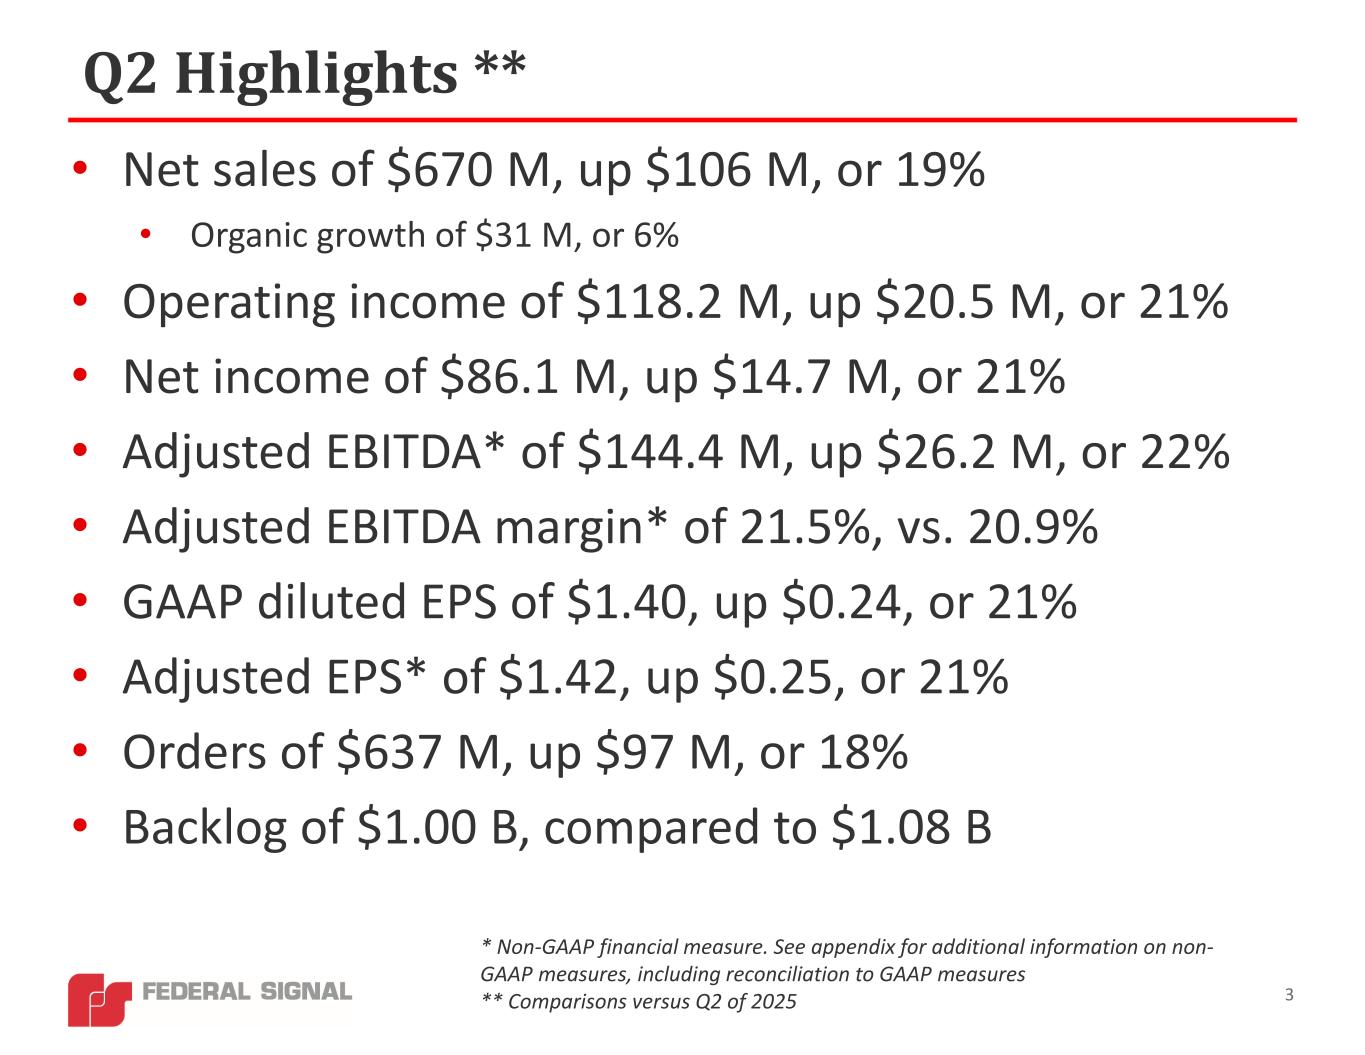
Q2 Highlights ** 3 • Net sales of $670 M, up $106 M, or 19% • Organic growth of $31 M, or 6% • Operating income of $118.2 M, up $20.5 M, or 21% • Net income of $86.1 M, up $14.7 M, or 21% • Adjusted EBITDA* of $144.4 M, up $26.2 M, or 22% • Adjusted EBITDA margin* of 21.5%, vs. 20.9% • GAAP diluted EPS of $1.40, up $0.24, or 21% • Adjusted EPS* of $1.42, up $0.25, or 21% • Orders of $637 M, up $97 M, or 18% • Backlog of $1.00 B, compared to $1.08 B * Non-GAAP financial measure. See appendix for additional information on non- GAAP measures, including reconciliation to GAAP measures ** Comparisons versus Q2 of 2025
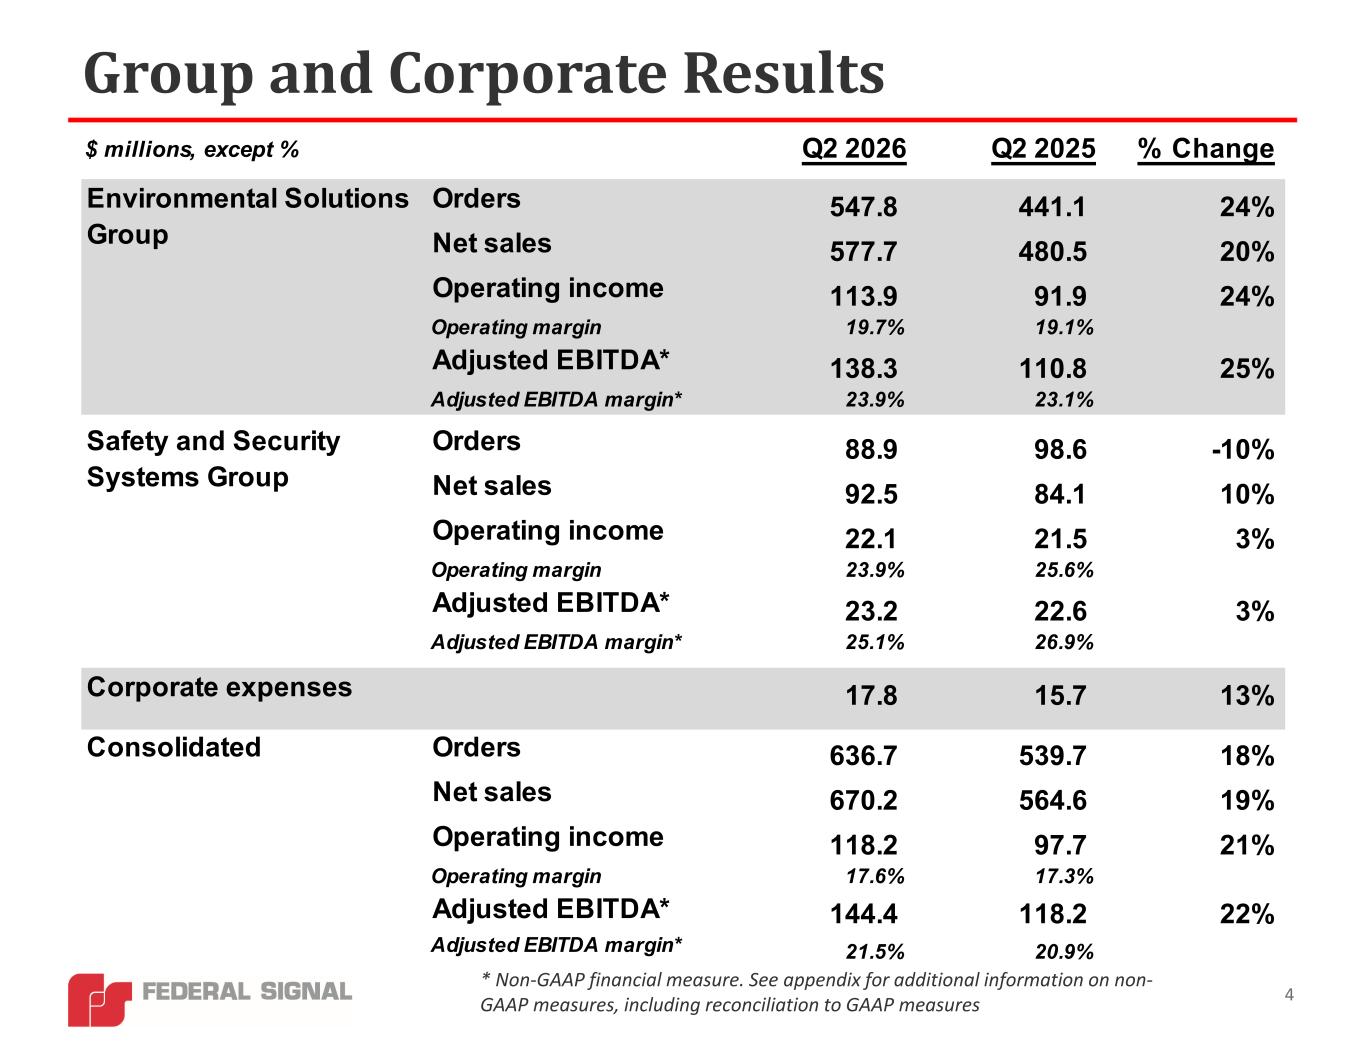
4 Group and Corporate Results * Non-GAAP financial measure. See appendix for additional information on non- GAAP measures, including reconciliation to GAAP measures $ millions, except % Q2 2026 Q2 2025 % Change Orders 547.8 441.1 24% Net sales 577.7 480.5 20% Operating income 113.9 91.9 24% Operating margin 19.7% 19.1% Adjusted EBITDA* 138.3 110.8 25% Adjusted EBITDA margin* 23.9% 23.1% Orders 88.9 98.6 -10% Net sales 92.5 84.1 10% Operating income 22.1 21.5 3% Operating margin 23.9% 25.6% Adjusted EBITDA* 23.2 22.6 3% Adjusted EBITDA margin* 25.1% 26.9% Corporate expenses 17.8 15.7 13% Consolidated Orders 636.7 539.7 18% Net sales 670.2 564.6 19% Operating income 118.2 97.7 21% Operating margin 17.6% 17.3% Adjusted EBITDA* 144.4 118.2 22% Adjusted EBITDA margin* 21.5% 20.9% Environmental Solutions Group Safety and Security Systems Group
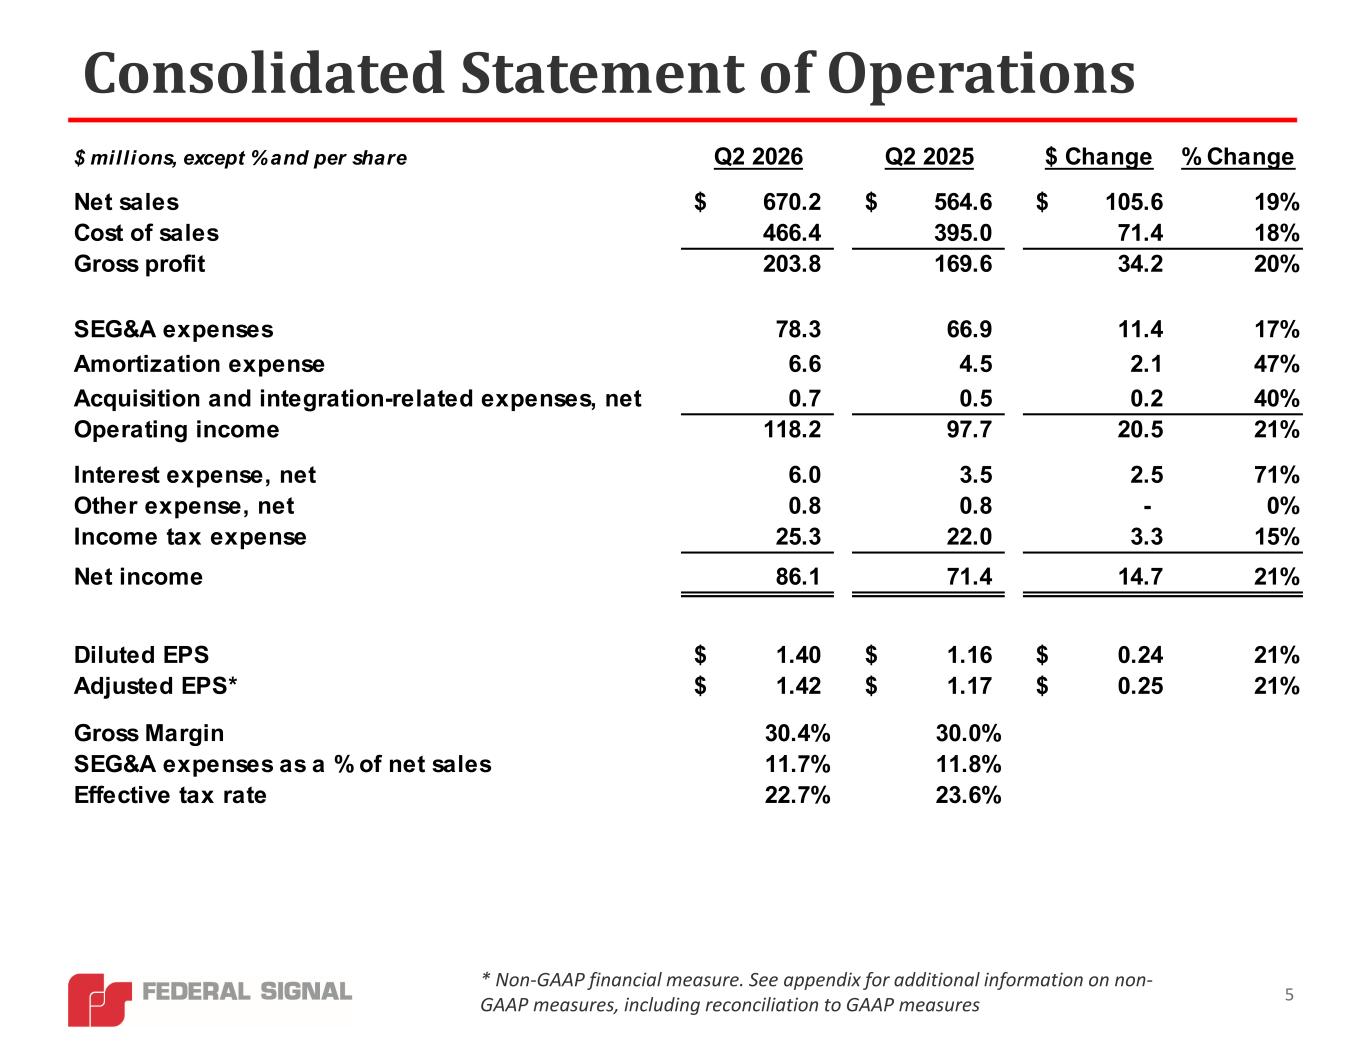
Consolidated Statement of Operations 5 * Non-GAAP financial measure. See appendix for additional information on non- GAAP measures, including reconciliation to GAAP measures $ millions, except % and per share Q2 2026 Q2 2025 $ Change % Change Net sales 670.2$ 564.6$ 105.6$ 19% Cost of sales 466.4 395.0 71.4 18% Gross profit 203.8 169.6 34.2 20% SEG&A expenses 78.3 66.9 11.4 17% Amortization expense 6.6 4.5 2.1 47% Acquisition and integration-related expenses, net 0.7 0.5 0.2 40% Operating income 118.2 97.7 20.5 21% Interest expense, net 6.0 3.5 2.5 71% Other expense, net 0.8 0.8 - 0% Income tax expense 25.3 22.0 3.3 15% Net income 86.1 71.4 14.7 21% Diluted EPS 1.40$ 1.16$ 0.24$ 21% Adjusted EPS* 1.42$ 1.17$ 0.25$ 21% Gross Margin 30.4% 30.0% SEG&A expenses as a % of net sales 11.7% 11.8% Effective tax rate 22.7% 23.6%
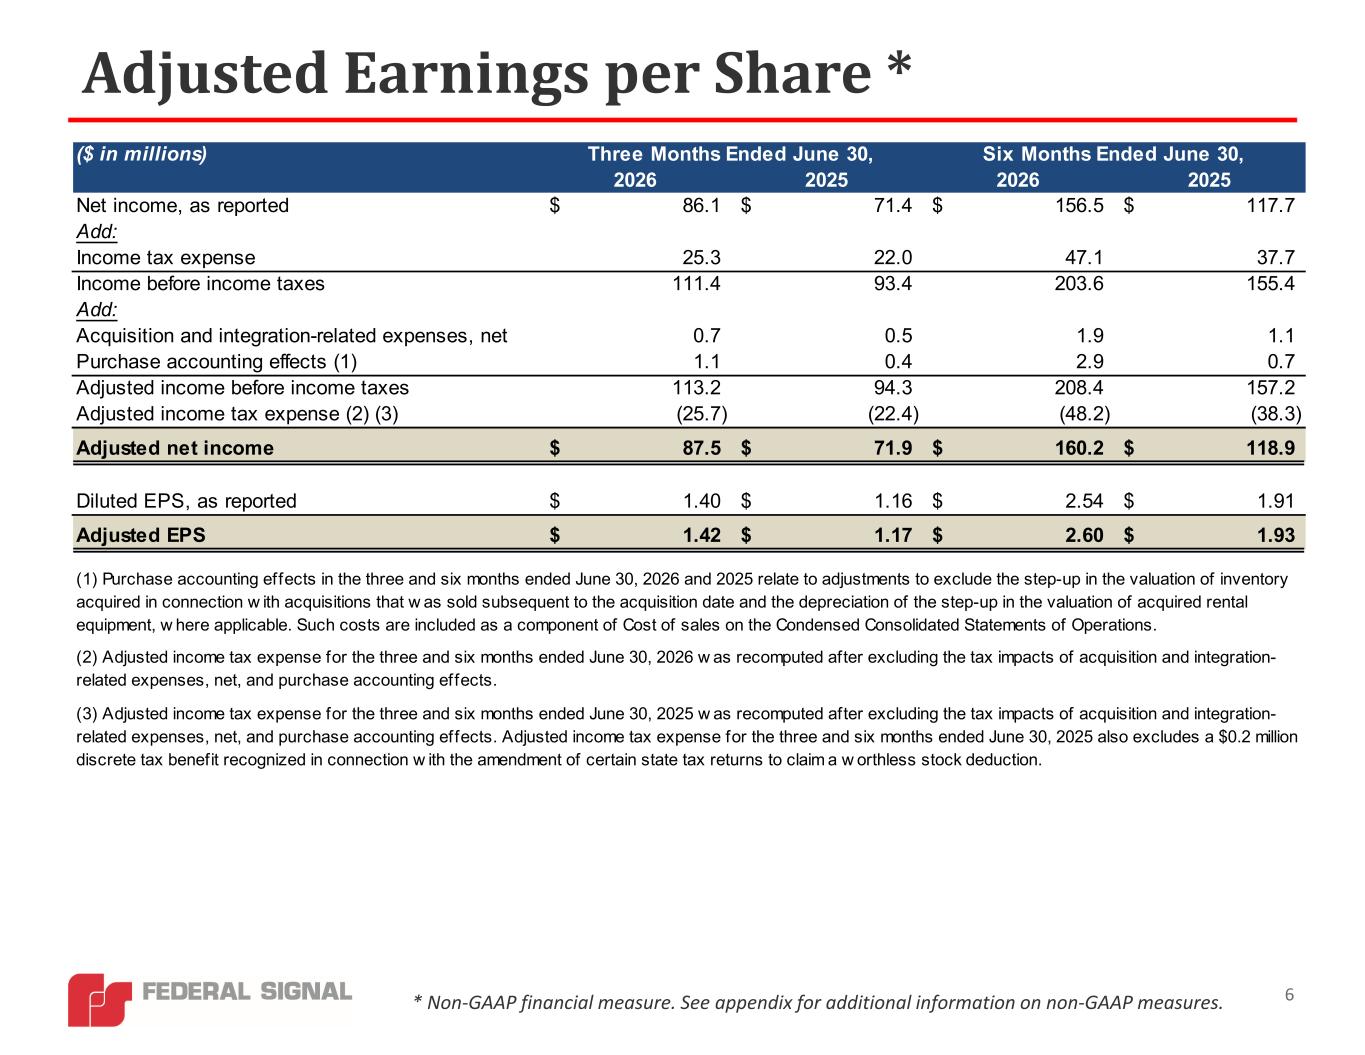
6 Adjusted Earnings per Share * * Non-GAAP financial measure. See appendix for additional information on non-GAAP measures. ($ in millions) 2026 2025 2026 2025 Net income, as reported 86.1$ 71.4$ 156.5$ 117.7$ Add: Income tax expense 25.3 22.0 47.1 37.7 Income before income taxes 111.4 93.4 203.6 155.4 Add: Acquisition and integration-related expenses, net 0.7 0.5 1.9 1.1 Purchase accounting effects (1) 1.1 0.4 2.9 0.7 Adjusted income before income taxes 113.2 94.3 208.4 157.2 Adjusted income tax expense (2) (3) (25.7) (22.4) (48.2) (38.3) Adjusted net income 87.5$ 71.9$ 160.2$ 118.9$ Diluted EPS, as reported 1.40$ 1.16$ 2.54$ 1.91$ Adjusted EPS 1.42$ 1.17$ 2.60$ 1.93$ Three Months Ended June 30, Six Months Ended June 30, (1) Purchase accounting effects in the three and six months ended June 30, 2026 and 2025 relate to adjustments to exclude the step-up in the valuation of inventory acquired in connection w ith acquisitions that w as sold subsequent to the acquisition date and the depreciation of the step-up in the valuation of acquired rental equipment, w here applicable. Such costs are included as a component of Cost of sales on the Condensed Consolidated Statements of Operations. (3) Adjusted income tax expense for the three and six months ended June 30, 2025 w as recomputed after excluding the tax impacts of acquisition and integration- related expenses, net, and purchase accounting effects. Adjusted income tax expense for the three and six months ended June 30, 2025 also excludes a $0.2 million discrete tax benefit recognized in connection w ith the amendment of certain state tax returns to claim a w orthless stock deduction. (2) Adjusted income tax expense for the three and six months ended June 30, 2026 w as recomputed after excluding the tax impacts of acquisition and integration- related expenses, net, and purchase accounting effects.
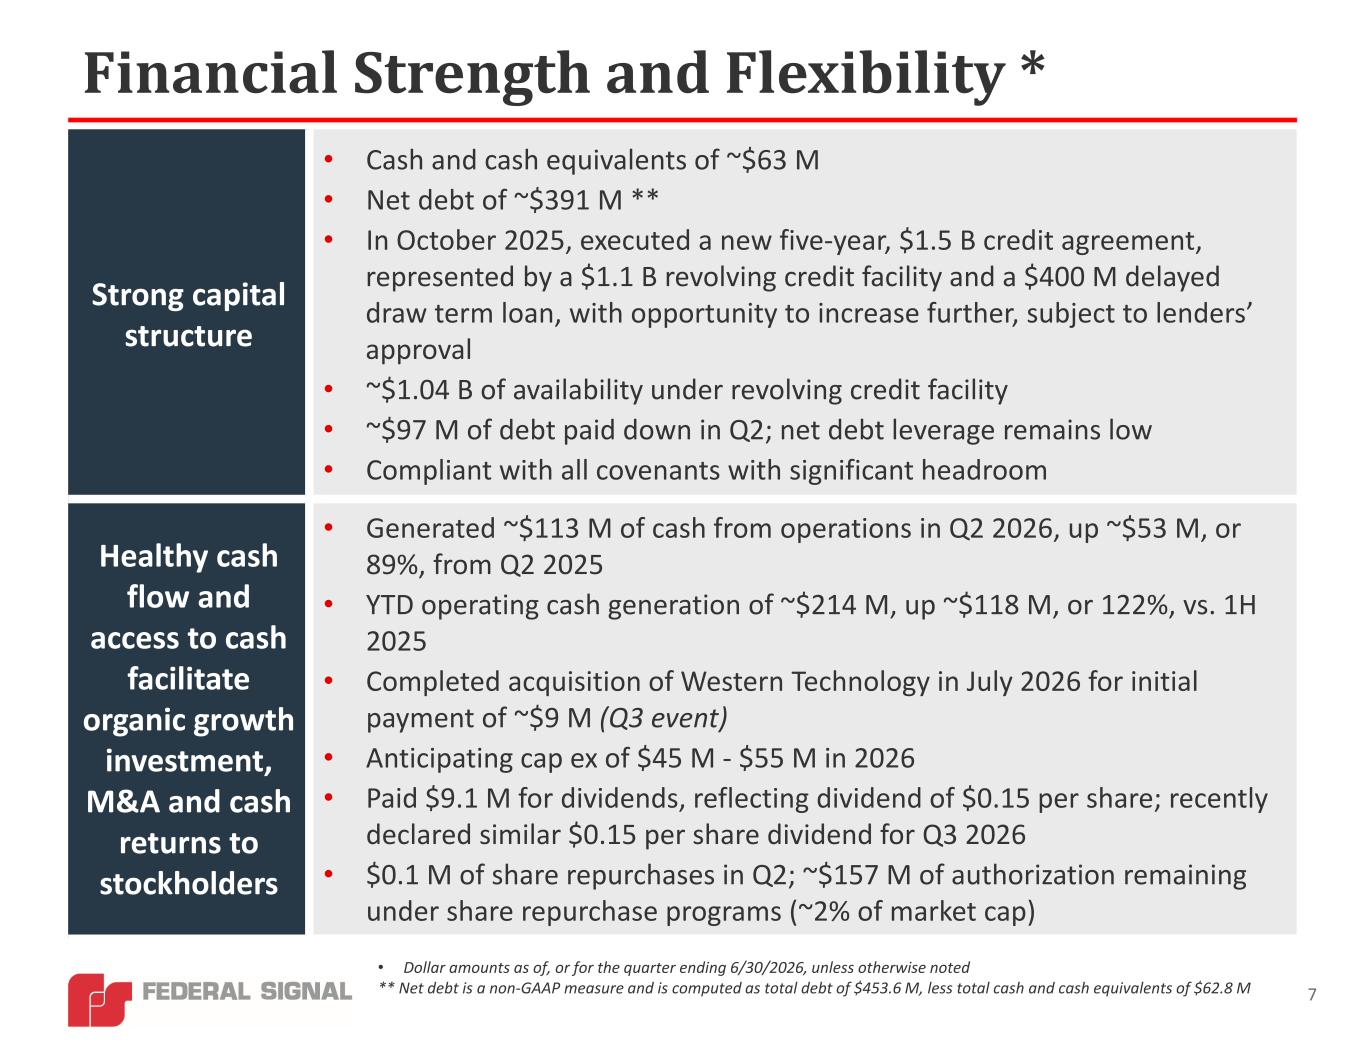
7 Financial Strength and Flexibility * • Dollar amounts as of, or for the quarter ending 6/30/2026, unless otherwise noted ** Net debt is a non-GAAP measure and is computed as total debt of $453.6 M, less total cash and cash equivalents of $62.8 M • Cash and cash equivalents of ~$63 M • Net debt of ~$391 M ** • In October 2025, executed a new five-year, $1.5 B credit agreement, represented by a $1.1 B revolving credit facility and a $400 M delayed draw term loan, with opportunity to increase further, subject to lenders’ approval • ~$1.04 B of availability under revolving credit facility • ~$97 M of debt paid down in Q2; net debt leverage remains low • Compliant with all covenants with significant headroom Strong capital structure • Generated ~$113 M of cash from operations in Q2 2026, up ~$53 M, or 89%, from Q2 2025 • YTD operating cash generation of ~$214 M, up ~$118 M, or 122%, vs. 1H 2025 • Completed acquisition of Western Technology in July 2026 for initial payment of ~$9 M (Q3 event) • Anticipating cap ex of $45 M - $55 M in 2026 • Paid $9.1 M for dividends, reflecting dividend of $0.15 per share; recently declared similar $0.15 per share dividend for Q3 2026 • $0.1 M of share repurchases in Q2; ~$157 M of authorization remaining under share repurchase programs (~2% of market cap) Healthy cash flow and access to cash facilitate organic growth investment, M&A and cash returns to stockholders
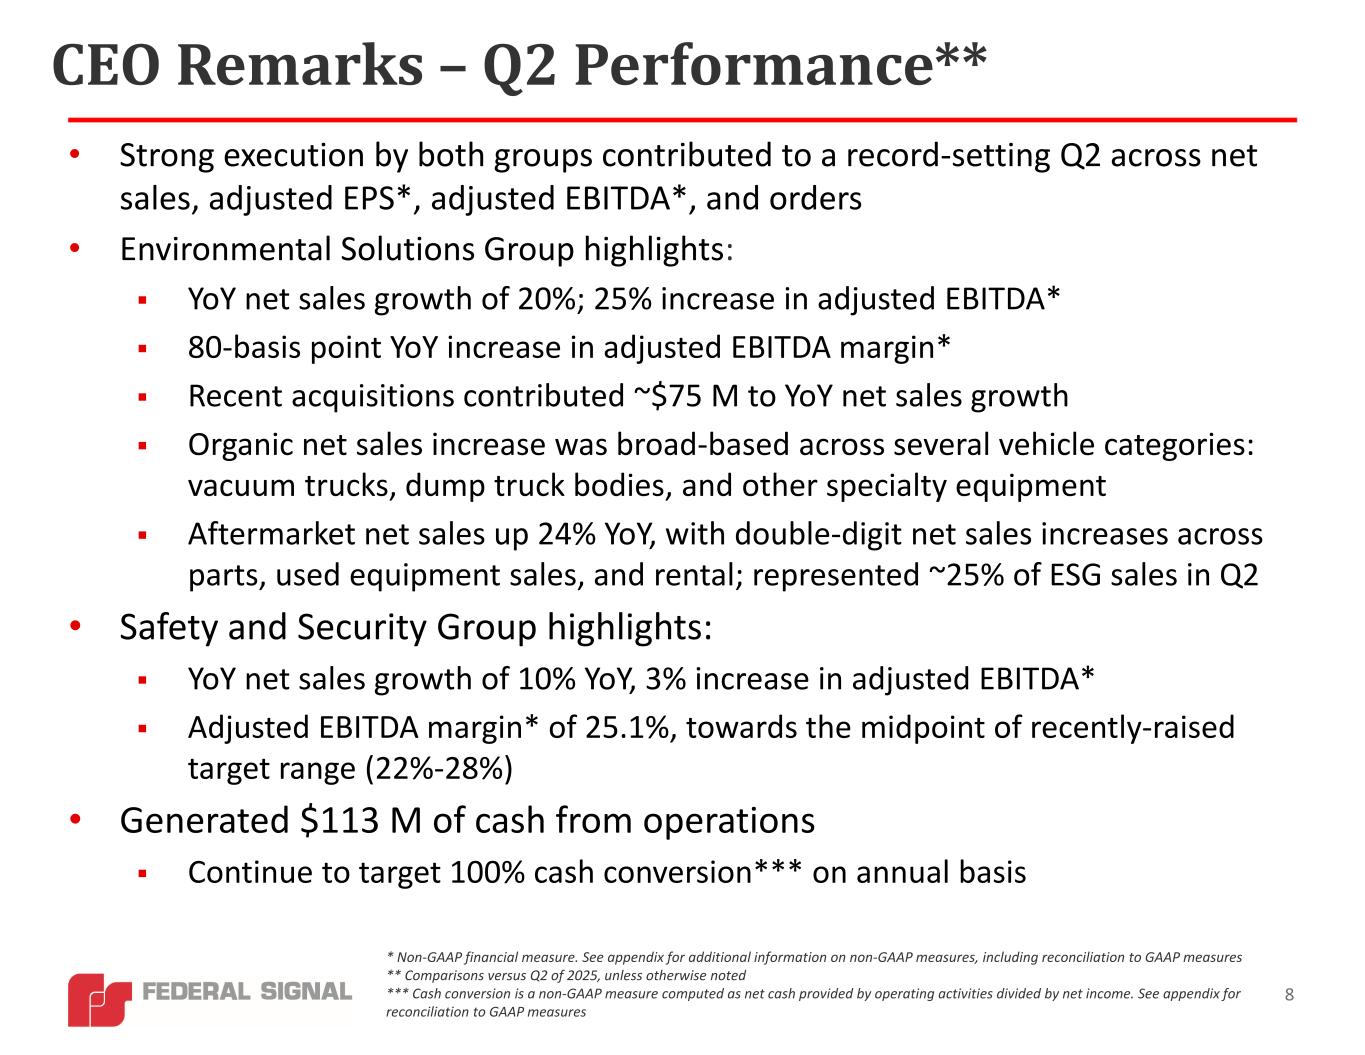
CEO Remarks – Q2 Performance** 8 • Strong execution by both groups contributed to a record-setting Q2 across net sales, adjusted EPS*, adjusted EBITDA*, and orders • Environmental Solutions Group highlights: YoY net sales growth of 20%; 25% increase in adjusted EBITDA* 80-basis point YoY increase in adjusted EBITDA margin* Recent acquisitions contributed ~$75 M to YoY net sales growth Organic net sales increase was broad-based across several vehicle categories: vacuum trucks, dump truck bodies, and other specialty equipment Aftermarket net sales up 24% YoY, with double-digit net sales increases across parts, used equipment sales, and rental; represented ~25% of ESG sales in Q2 • Safety and Security Group highlights: YoY net sales growth of 10% YoY, 3% increase in adjusted EBITDA* Adjusted EBITDA margin* of 25.1%, towards the midpoint of recently-raised target range (22%-28%) • Generated $113 M of cash from operations Continue to target 100% cash conversion*** on annual basis * Non-GAAP financial measure. See appendix for additional information on non-GAAP measures, including reconciliation to GAAP measures ** Comparisons versus Q2 of 2025, unless otherwise noted *** Cash conversion is a non-GAAP measure computed as net cash provided by operating activities divided by net income. See appendix for reconciliation to GAAP measures
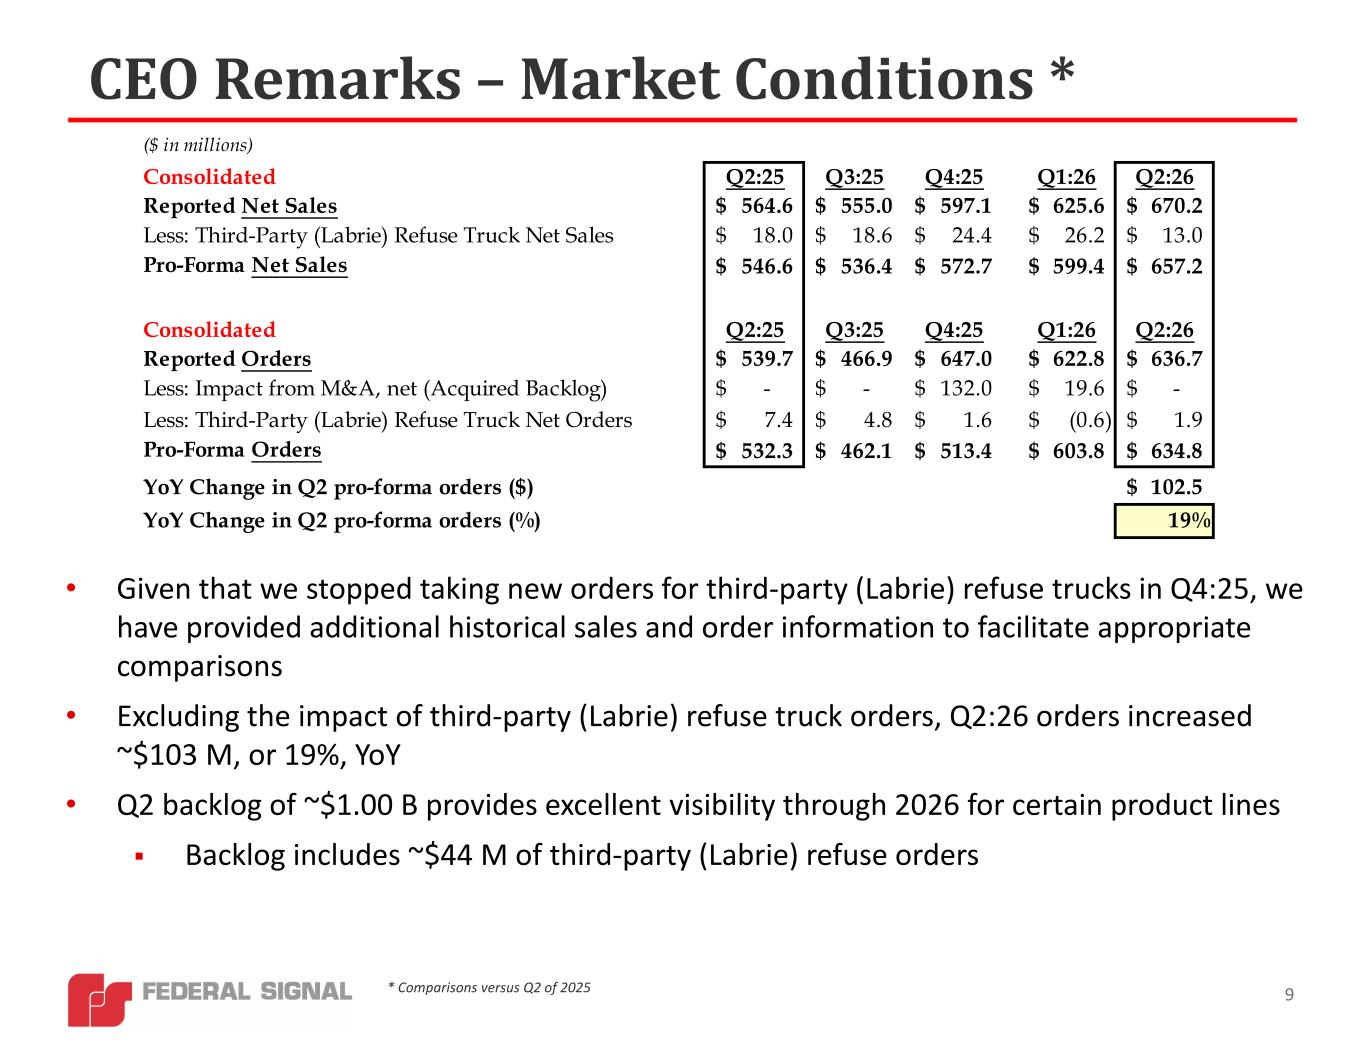
CEO Remarks – Market Conditions * 9* Comparisons versus Q2 of 2025 • Given that we stopped taking new orders for third-party (Labrie) refuse trucks in Q4:25, we have provided additional historical sales and order information to facilitate appropriate comparisons • Excluding the impact of third-party (Labrie) refuse truck orders, Q2:26 orders increased ~$103 M, or 19%, YoY • Q2 backlog of ~$1.00 B provides excellent visibility through 2026 for certain product lines Backlog includes ~$44 M of third-party (Labrie) refuse orders ($ in millions) Consolidated Q2:25 Q3:25 Q4:25 Q1:26 Q2:26 Reported Net Sales 564.6$ 555.0$ 597.1$ 625.6$ 670.2$ Less: Third-Party (Labrie) Refuse Truck Net Sales 18.0$ 18.6$ 24.4$ 26.2$ 13.0$ Pro-Forma Net Sales 546.6$ 536.4$ 572.7$ 599.4$ 657.2$ Consolidated Q2:25 Q3:25 Q4:25 Q1:26 Q2:26 Reported Orders 539.7$ 466.9$ 647.0$ 622.8$ 636.7$ Less: Impact from M&A, net (Acquired Backlog) -$ -$ 132.0$ 19.6$ -$ Less: Third-Party (Labrie) Refuse Truck Net Orders 7.4$ 4.8$ 1.6$ (0.6)$ 1.9$ Pro-Forma Orders 532.3$ 462.1$ 513.4$ 603.8$ 634.8$ YoY Change in Q2 pro-forma orders ($) 102.5$ YoY Change in Q2 pro-forma orders (%) 19%
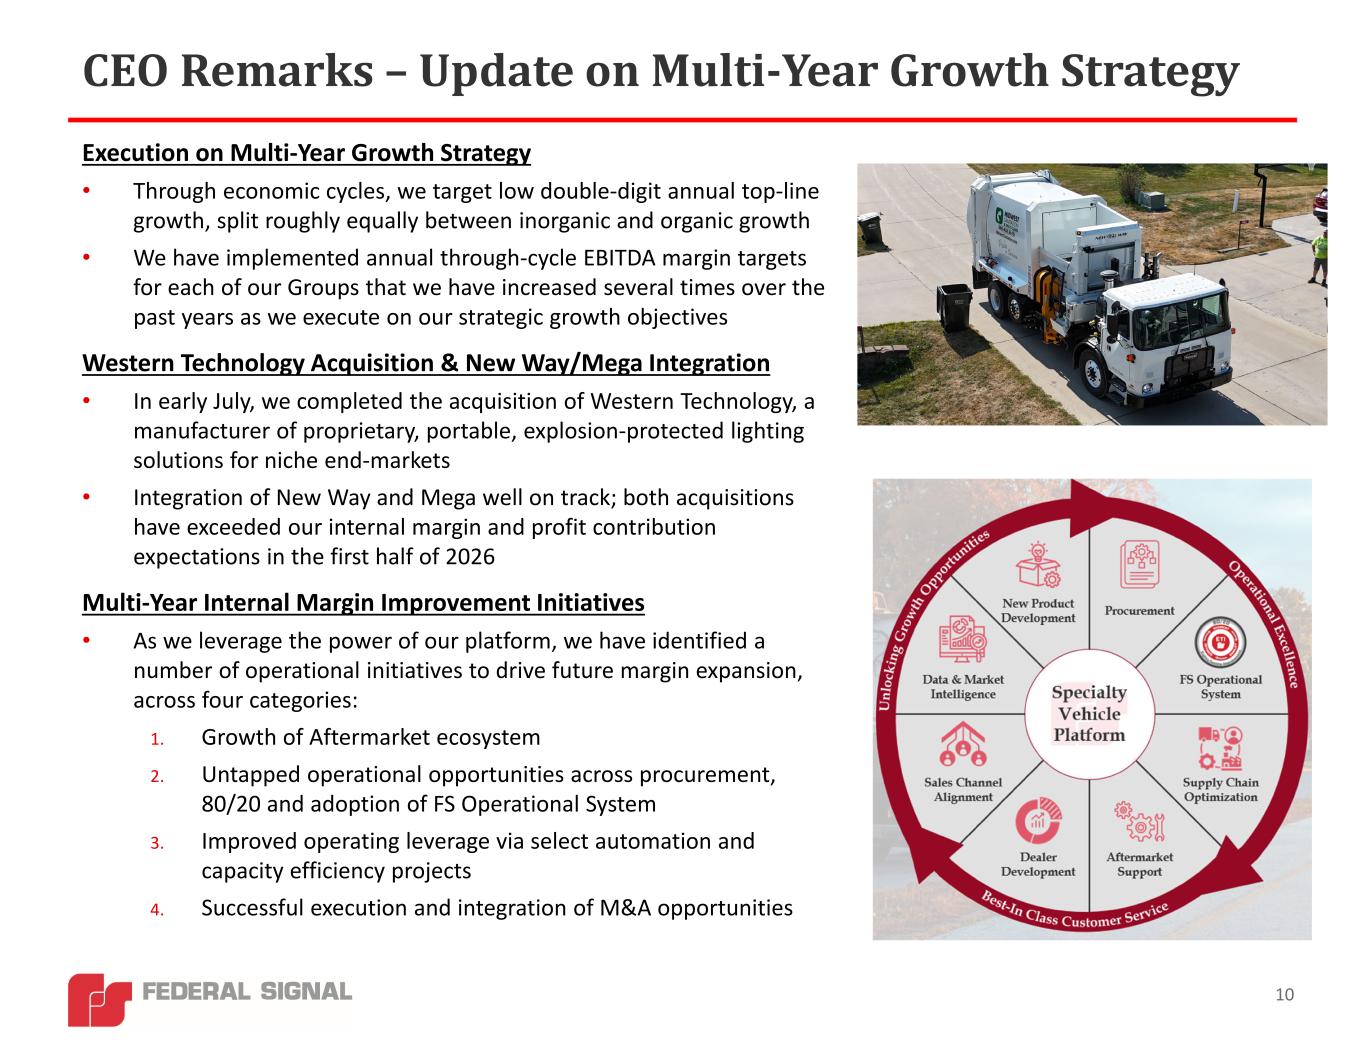
CEO Remarks – Update on Multi‐Year Growth Strategy 10 Execution on Multi-Year Growth Strategy • Through economic cycles, we target low double-digit annual top-line growth, split roughly equally between inorganic and organic growth • We have implemented annual through-cycle EBITDA margin targets for each of our Groups that we have increased several times over the past years as we execute on our strategic growth objectives Western Technology Acquisition & New Way/Mega Integration • In early July, we completed the acquisition of Western Technology, a manufacturer of proprietary, portable, explosion-protected lighting solutions for niche end-markets • Integration of New Way and Mega well on track; both acquisitions have exceeded our internal margin and profit contribution expectations in the first half of 2026 Multi-Year Internal Margin Improvement Initiatives • As we leverage the power of our platform, we have identified a number of operational initiatives to drive future margin expansion, across four categories: 1. Growth of Aftermarket ecosystem 2. Untapped operational opportunities across procurement, 80/20 and adoption of FS Operational System 3. Improved operating leverage via select automation and capacity efficiency projects 4. Successful execution and integration of M&A opportunities
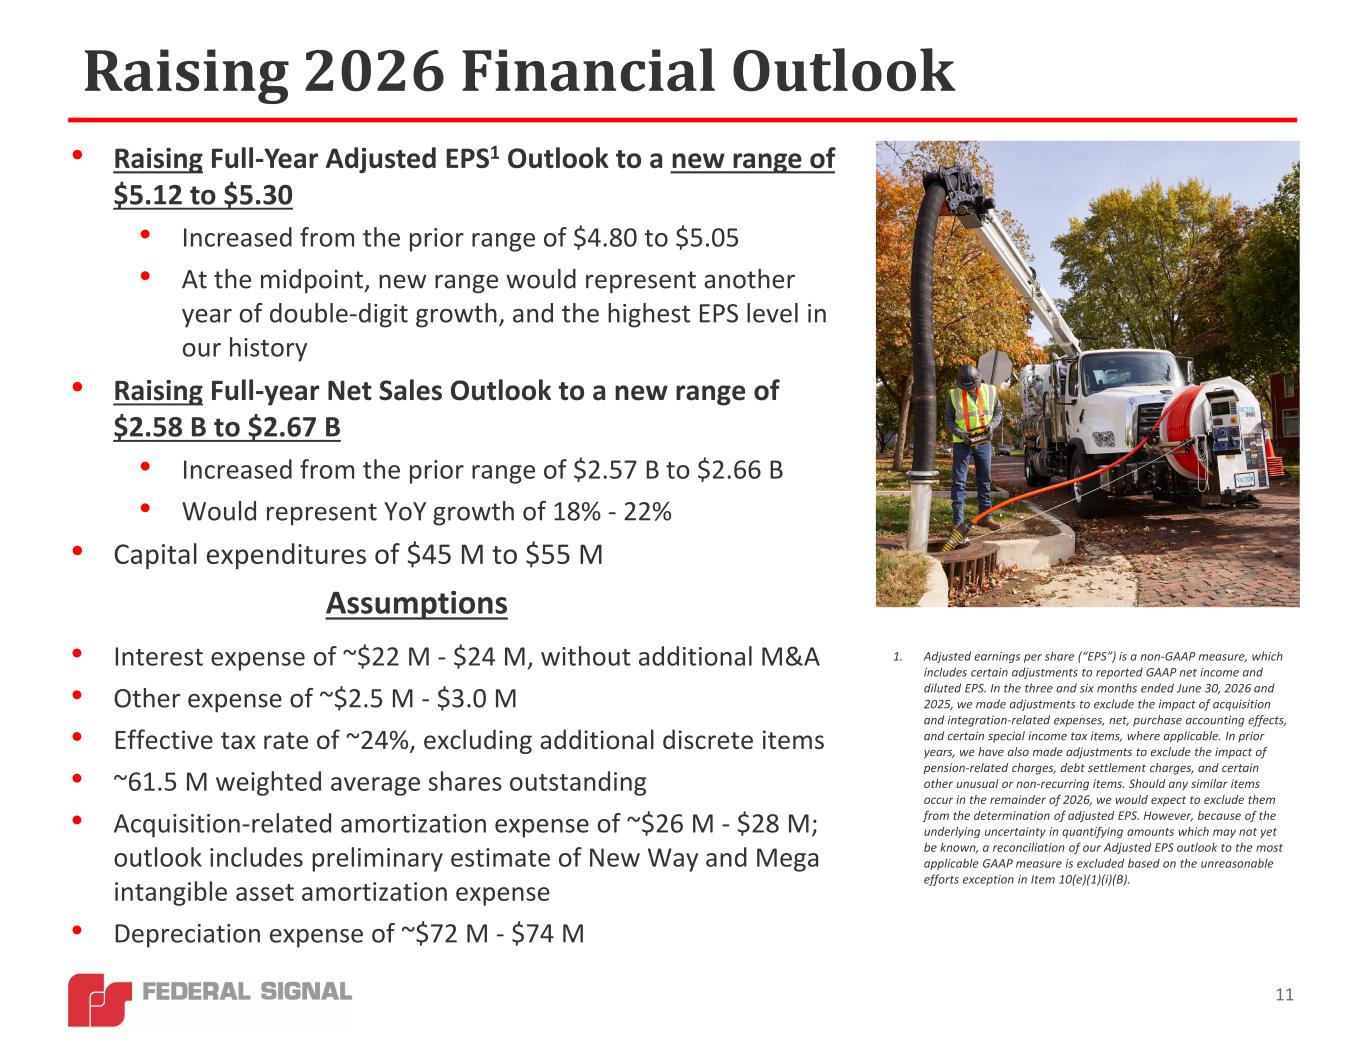
Raising 2026 Financial Outlook 11 • Raising Full-Year Adjusted EPS1 Outlook to a new range of $5.12 to $5.30 • Increased from the prior range of $4.80 to $5.05 • At the midpoint, new range would represent another year of double-digit growth, and the highest EPS level in our history • Raising Full-year Net Sales Outlook to a new range of $2.58 B to $2.67 B • Increased from the prior range of $2.57 B to $2.66 B • Would represent YoY growth of 18% - 22% • Capital expenditures of $45 M to $55 M Assumptions • Interest expense of ~$22 M - $24 M, without additional M&A • Other expense of ~$2.5 M - $3.0 M • Effective tax rate of ~24%, excluding additional discrete items • ~61.5 M weighted average shares outstanding • Acquisition-related amortization expense of ~$26 M - $28 M; outlook includes preliminary estimate of New Way and Mega intangible asset amortization expense • Depreciation expense of ~$72 M - $74 M 1. Adjusted earnings per share (“EPS”) is a non-GAAP measure, which includes certain adjustments to reported GAAP net income and diluted EPS. In the three and six months ended June 30, 2026 and 2025, we made adjustments to exclude the impact of acquisition and integration-related expenses, net, purchase accounting effects, and certain special income tax items, where applicable. In prior years, we have also made adjustments to exclude the impact of pension-related charges, debt settlement charges, and certain other unusual or non-recurring items. Should any similar items occur in the remainder of 2026, we would expect to exclude them from the determination of adjusted EPS. However, because of the underlying uncertainty in quantifying amounts which may not yet be known, a reconciliation of our Adjusted EPS outlook to the most applicable GAAP measure is excluded based on the unreasonable efforts exception in Item 10(e)(1)(i)(B).
Federal Signal Q2 2026 Earnings Call 12 Q&A July 30, 2026 Jennifer Sherman, President & Chief Executive Officer Ian Hudson, SVP, Chief Financial Officer Felix Boeschen, VP, Corporate Strategy & Investor Relations
Investor Information Stock Ticker - NYSE:FSS Company website: federalsignal.com/investors HEADQUARTERS 1333 Butterfield Road, Suite 500 Downers Grove, IL 60515 INVESTOR RELATIONS CONTACTS 630-954-2000 Felix Boeschen VP, Corporate Strategy and Investor Relations fboeschen@federalsignal.com 13
Federal Signal Q2 2026 Earnings Call 14 Appendix
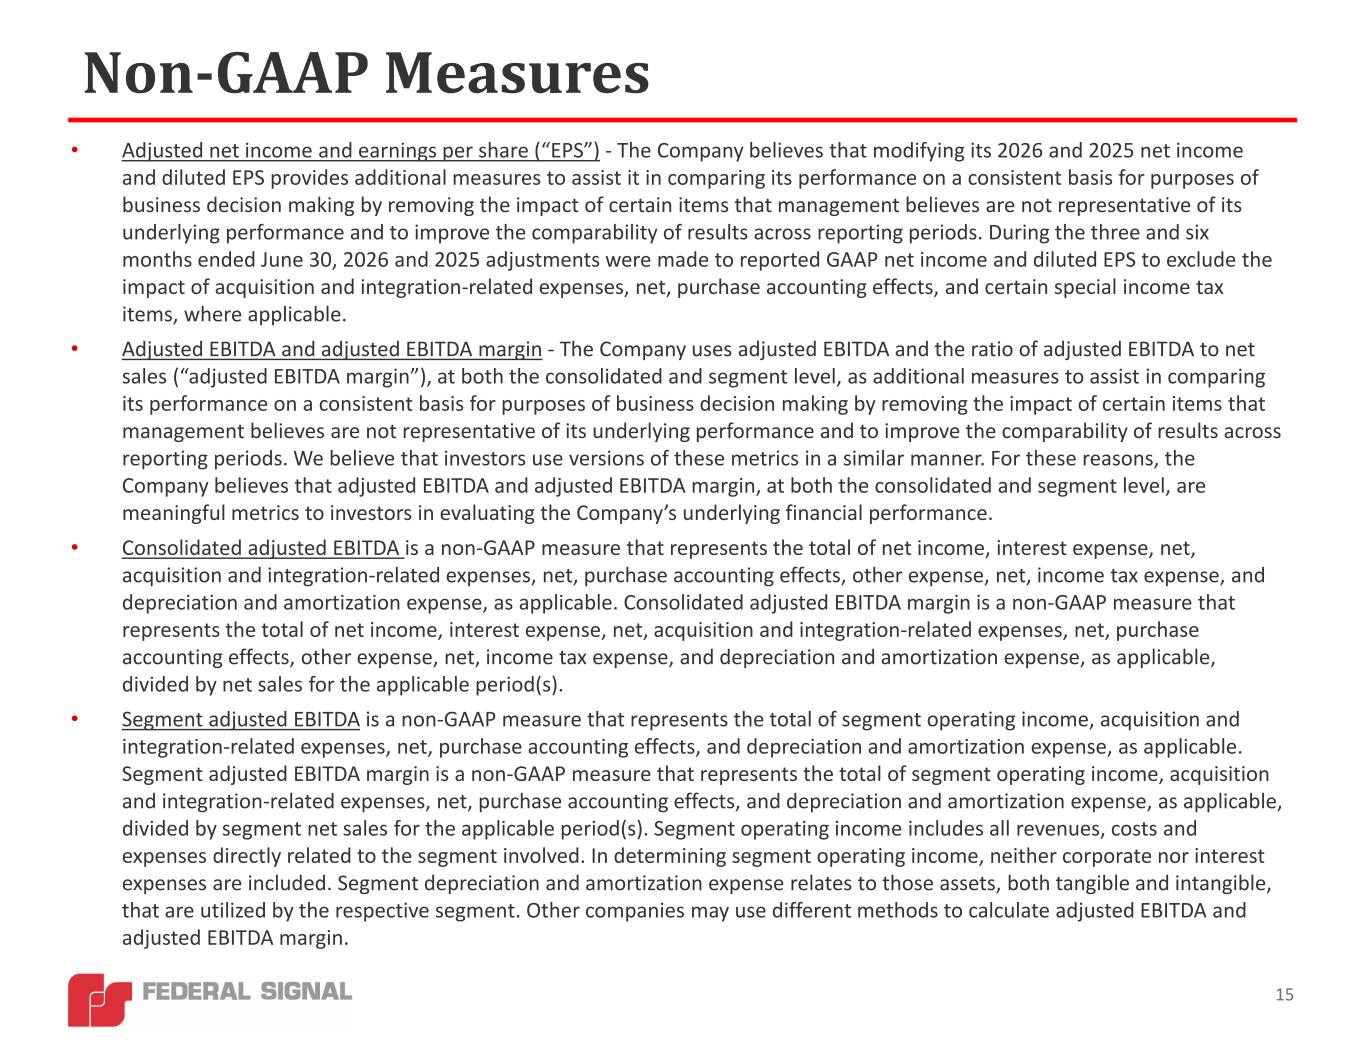
Non‐GAAP Measures 15 • Adjusted net income and earnings per share (“EPS”) - The Company believes that modifying its 2026 and 2025 net income and diluted EPS provides additional measures to assist it in comparing its performance on a consistent basis for purposes of business decision making by removing the impact of certain items that management believes are not representative of its underlying performance and to improve the comparability of results across reporting periods. During the three and six months ended June 30, 2026 and 2025 adjustments were made to reported GAAP net income and diluted EPS to exclude the impact of acquisition and integration-related expenses, net, purchase accounting effects, and certain special income tax items, where applicable. • Adjusted EBITDA and adjusted EBITDA margin - The Company uses adjusted EBITDA and the ratio of adjusted EBITDA to net sales (“adjusted EBITDA margin”), at both the consolidated and segment level, as additional measures to assist in comparing its performance on a consistent basis for purposes of business decision making by removing the impact of certain items that management believes are not representative of its underlying performance and to improve the comparability of results across reporting periods. We believe that investors use versions of these metrics in a similar manner. For these reasons, the Company believes that adjusted EBITDA and adjusted EBITDA margin, at both the consolidated and segment level, are meaningful metrics to investors in evaluating the Company’s underlying financial performance. • Consolidated adjusted EBITDA is a non-GAAP measure that represents the total of net income, interest expense, net, acquisition and integration-related expenses, net, purchase accounting effects, other expense, net, income tax expense, and depreciation and amortization expense, as applicable. Consolidated adjusted EBITDA margin is a non-GAAP measure that represents the total of net income, interest expense, net, acquisition and integration-related expenses, net, purchase accounting effects, other expense, net, income tax expense, and depreciation and amortization expense, as applicable, divided by net sales for the applicable period(s). • Segment adjusted EBITDA is a non-GAAP measure that represents the total of segment operating income, acquisition and integration-related expenses, net, purchase accounting effects, and depreciation and amortization expense, as applicable. Segment adjusted EBITDA margin is a non-GAAP measure that represents the total of segment operating income, acquisition and integration-related expenses, net, purchase accounting effects, and depreciation and amortization expense, as applicable, divided by segment net sales for the applicable period(s). Segment operating income includes all revenues, costs and expenses directly related to the segment involved. In determining segment operating income, neither corporate nor interest expenses are included. Segment depreciation and amortization expense relates to those assets, both tangible and intangible, that are utilized by the respective segment. Other companies may use different methods to calculate adjusted EBITDA and adjusted EBITDA margin.
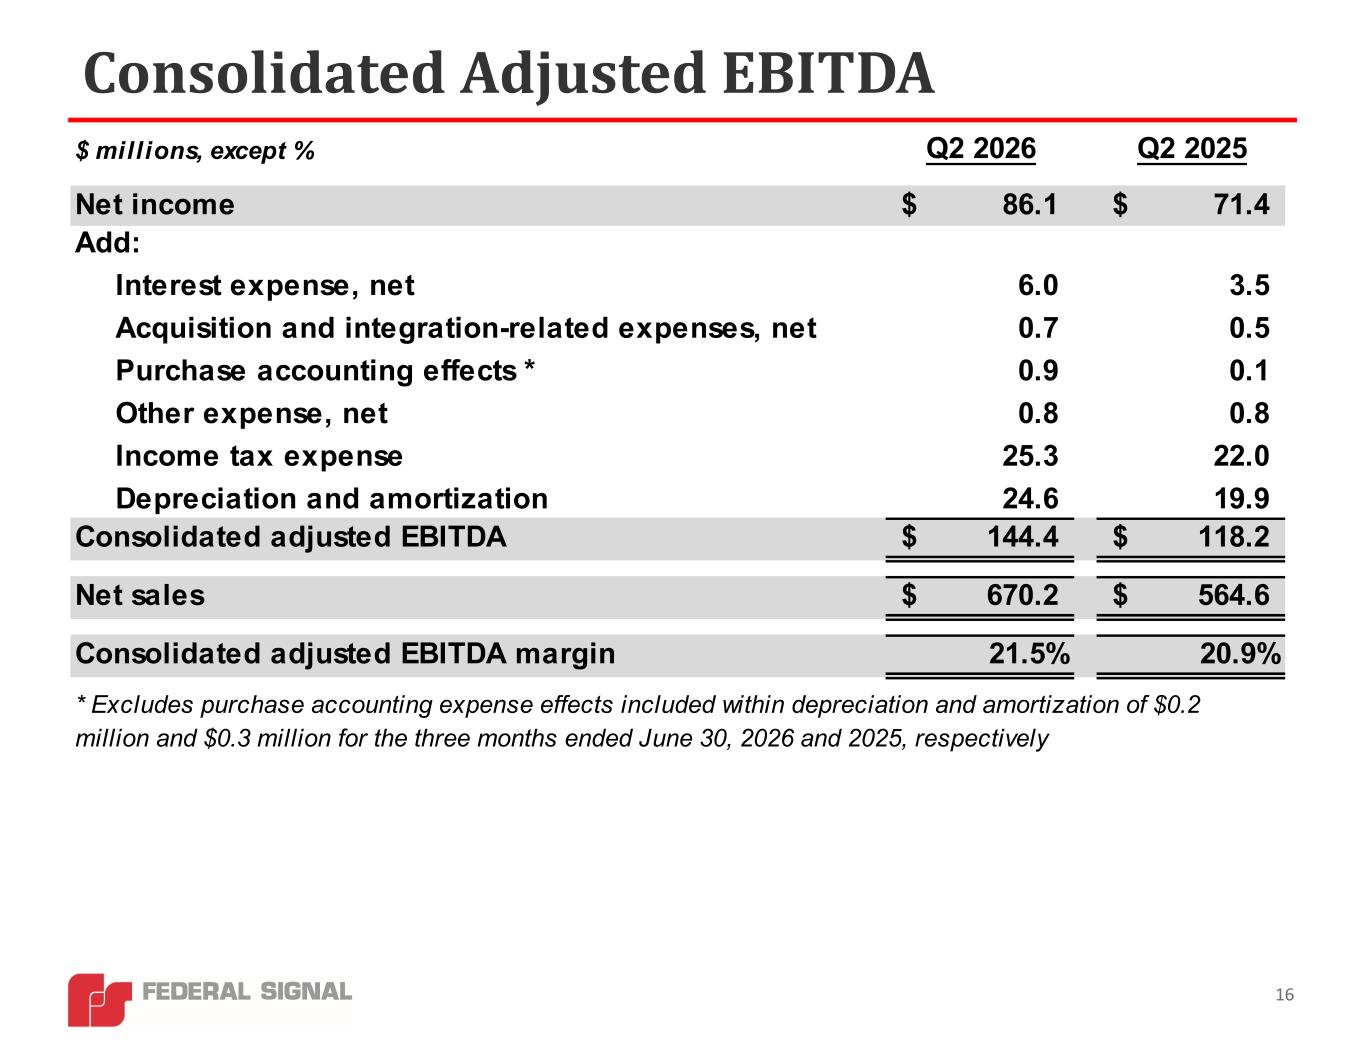
Consolidated Adjusted EBITDA 16 $ millions, except % Q2 2026 Q2 2025 Net income 86.1$ 71.4$ Add: Interest expense, net 6.0 3.5 Acquisition and integration-related expenses, net 0.7 0.5 Purchase accounting effects * 0.9 0.1 Other expense, net 0.8 0.8 Income tax expense 25.3 22.0 Depreciation and amortization 24.6 19.9 Consolidated adjusted EBITDA 144.4$ 118.2$ Net sales 670.2$ 564.6$ Consolidated adjusted EBITDA margin 21.5% 20.9% * Excludes purchase accounting expense effects included within depreciation and amortization of $0.2 million and $0.3 million for the three months ended June 30, 2026 and 2025, respectively
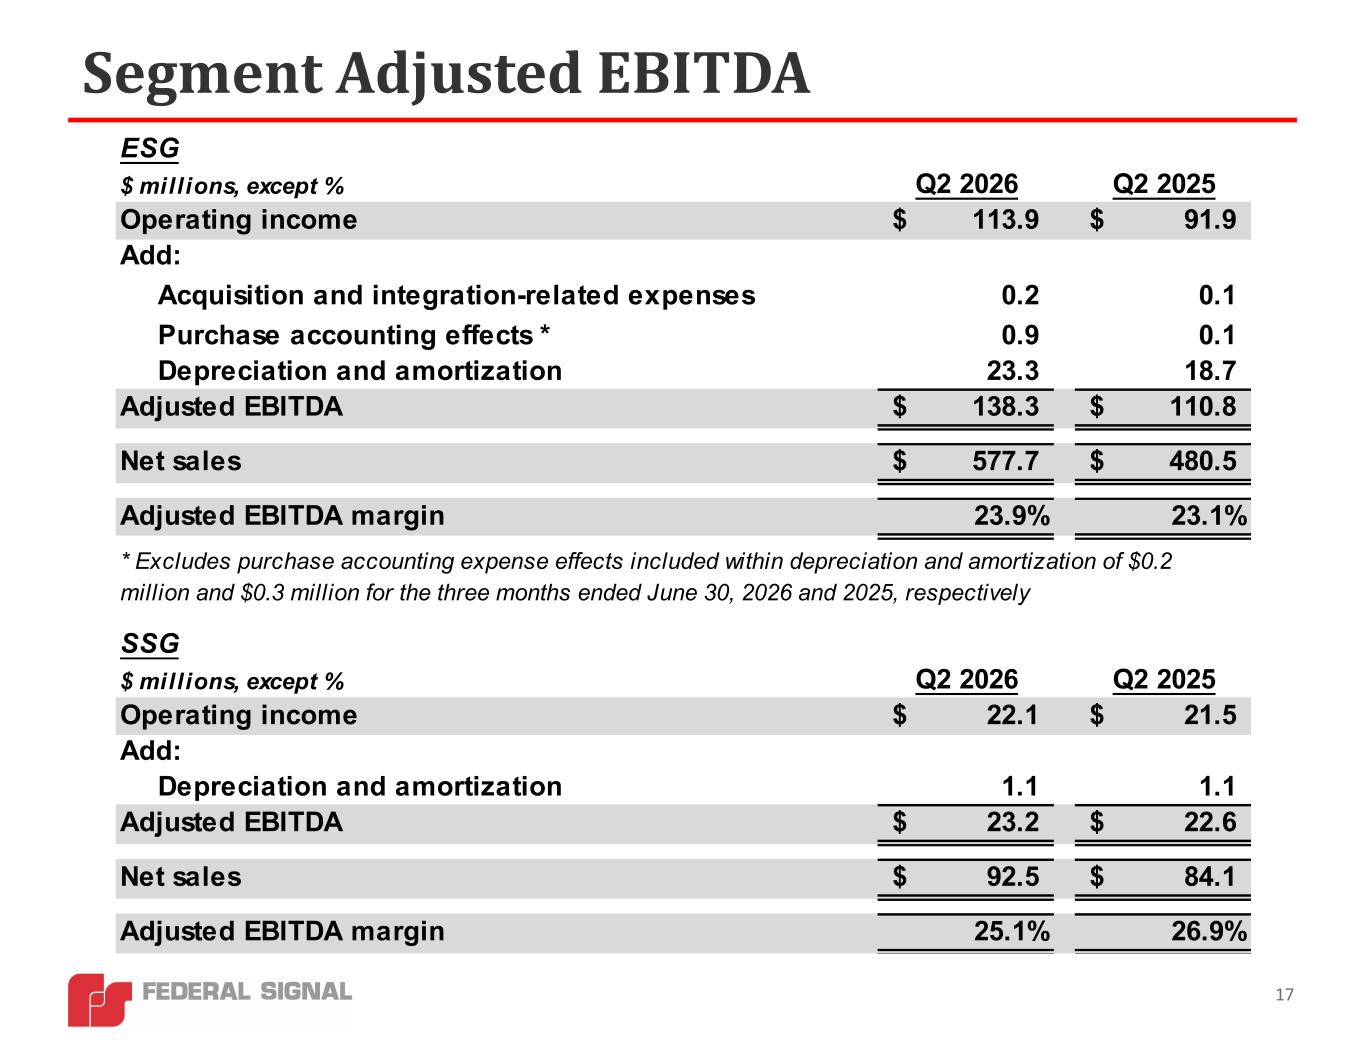
Segment Adjusted EBITDA 17 ESG $ millions, except % Q2 2026 Q2 2025 Operating income 113.9$ 91.9$ Add: Acquisition and integration-related expenses 0.2 0.1 Purchase accounting effects * 0.9 0.1 Depreciation and amortization 23.3 18.7 Adjusted EBITDA 138.3$ 110.8$ Net sales 577.7$ 480.5$ Adjusted EBITDA margin 23.9% 23.1% SSG $ millions, except % Q2 2026 Q2 2025 Operating income 22.1$ 21.5$ Add: Depreciation and amortization 1.1 1.1 Adjusted EBITDA 23.2$ 22.6$ Net sales 92.5$ 84.1$ Adjusted EBITDA margin 25.1% 26.9% * Excludes purchase accounting expense effects included within depreciation and amortization of $0.2 million and $0.3 million for the three months ended June 30, 2026 and 2025, respectively