JULY 30, 2026 SECOND-QUARTER 2026 FINANCIAL RESULTS Exhibit 99.3
1Edison International | Second-Quarter 2026 Earnings Call Forward-Looking Statements Statements contained in this presentation about future performance, including, without limitation, operating results, capital expenditures, rate base growth, dividend policy, financial outlook, and other statements that are not purely historical, are forward-looking statements. These forward-looking statements reflect our current expectations; however, such statements involve risks and uncertainties. Actual results could differ materially from current expectations. These forward-looking statements represent our expectations only as of the date of this presentation, and Edison International assumes no duty to update them to reflect new information, events or circumstances. Important factors that could cause different results include, but are not limited to the: • ability of SCE to recover its costs through regulated rates, timely or at all, including uninsured wildfire-related costs (including amounts paid for self-insured retention and co-insurance, and amounts not recoverable from the Wildfire Fund), and costs incurred for wildfire restoration efforts and to mitigate the risk of utility equipment causing future wildfires; • the cybersecurity of Edison International's and SCE's critical information technology systems for grid control and business, employee and customer data, and the physical security of Edison International's and SCE's critical assets and personnel; • risks associated with the construction, operation, and maintenance of electrical facilities, including worker, contractor, and public safety issues, the risk of utility assets causing or contributing to wildfires, failure, availability, efficiency, and output of equipment and facilities, and availability and cost of spare parts; • impact of affordability of customer rates on SCE's ability to execute its strategy, including the impact of lower-than-expected load growth and higher operating and capital costs (due to factors such as supply chain constraints, tariffs, inflation, and rising interest rates), which could affect SCE’s ability to obtain regulatory approval of, or cost recovery for, operations and maintenance expenses, proposed capital investment projects, and authorized returns on equity, as well as influence legislative actions; • ability of SCE to update its grid infrastructure to maintain system integrity and reliability, and meet electrification needs; • ability of SCE to implement its operational and strategic plans, including its Wildfire Mitigation Plan, its target energization times and capital investment program, including challenges related to project site identification, public opposition, environmental mitigation, construction, permitting, contractor performance, changes in the California Independent System Operator's (“CAISO”) transmission plans, and governmental approvals; • risks of regulatory or legislative restrictions that would limit SCE's ability to implement operational measures to mitigate wildfire risk, including Public Safety Power Shutoff (“PSPS”) and fast curve settings, when conditions warrant or would otherwise limit SCE's operational practices relative to wildfire risk mitigation; • ability of SCE to obtain safety certifications from the Office of Energy Infrastructure Safety of the California Natural Resources Agency (“OEIS“); • risk that the California Wildfire Legislation or anticipated new California legislation does not effectively mitigate the significant exposure faced by California investor-owned utilities related to liability for damages arising from catastrophic wildfires where utility facilities are alleged to be a substantial or contributing cause, including the longevity of the Wildfire Fund and the California Public Utilities Commission (“CPUC”) interpretation of and actions under the California Wildfire Legislation, including its interpretation of the clarified prudency standard; • ability of Edison International and SCE to effectively attract, manage, develop and retain a skilled workforce, including its contract workers; • decisions and other actions by the CPUC, the Federal Energy Regulatory Commission, and the United States Nuclear Regulatory Commission, the California legislature and other governmental authorities, including decisions and actions related to nationwide or statewide crisis, approval of regulatory proceeding settlements, determinations of authorized rates of return or return on equity, prudency determinations for wildfire-related costs, the availability and sufficiency of the Wildfire Fund and related cost recovery mechanisms, issuance of SCE's wildfire safety certification, reforming wildfire-related liability protections available to California investor-owned utilities, wildfire mitigation efforts, approval and implementation of electrification programs, restrictions on the issuance of dividends and delays in executive, regulatory and legislative actions; • governmental, statutory, regulatory, or administrative changes or initiatives affecting the electricity industry, including the market structure rules applicable to each market adopted by the North American Electric Reliability Corporation, CAISO, Western Electricity Coordinating Council, and similar regulatory bodies in adjoining regions, and changes in the United States' and California's environmental priorities that lessen the importance placed on greenhouse gas reduction and other climate related priorities; • potential for penalties or disallowances for non-compliance with applicable laws and regulations, including fines, penalties and disallowances related to customer notifications and to wildfires where SCE's equipment is alleged to be associated with ignition; • extreme weather-related incidents (including events caused, or exacerbated, by climate change), such as wildfires, debris flows, flooding, droughts, high wind events and extreme heat events and other natural disasters (such as earthquakes), which could cause, among other things, worker and public safety issues, property damage, outages and other operational issues (such as issues due to damaged infrastructure), PSPS activations and unanticipated costs; • risks associated with the decommissioning of San Onofre, including those related to worker and public safety, public opposition, permitting, governmental approvals, on-site storage of spent nuclear fuel and other radioactive material, delays, contractual disputes, and cost overruns; • risks associated with cost allocation resulting in higher rates for utility bundled service customers because of possible customer bypass or departure for other electricity providers such as Community Choice Aggregators (“CCA,” which are cities, counties, and certain other public agencies with the authority to generate and/or purchase electricity for their local residents and businesses) and Electric Service Providers (entities that offer electric power and ancillary services to retail customers, other than electrical corporations (like SCE) and CCAs); • actions by credit rating agencies to downgrade Edison International or SCE’s credit ratings or to place those ratings on negative watch or negative outlook, including downgrades that may be made if the California legislature does not timely adopt legislation that effectively mitigates the significant wildfire-related risk faced by California investor-owned utilities; • ability of Edison International or SCE to borrow funds and access bank and capital markets on reasonable terms; • changes in tax laws and regulations, at both the state and federal levels, or changes in the application of those laws, that could affect recorded deferred tax assets and liabilities, effective tax rates and cash flows; • changes in rates of inflation (including whether inflation-related adjustments to SCE's authorized revenues allowed by the public utility regulators are commensurate with inflation rates), and changes in interest rates and potential future adjustments to SCE's ROE based on changes in Moody's utility bond rate index; • availability and creditworthiness of counterparties and the resulting effects on liquidity in the power and fuel markets and/or the ability of counterparties to pay amounts owed in excess of collateral provided in support of their obligations; and • cost of fuel for generating facilities and related transportation, which could be impacted by, among other things, disruption of natural gas storage facilities, to the extent not recovered, timely or at all, through regulated rate cost escalation provisions or balancing accounts. Other important factors are discussed under the headings “Forward-Looking Statements”, “Risk Factors” and “Management’s Discussion and Analysis” in Edison International’s Form 10-K and other reports filed with the Securities and Exchange Commission, which are available on our website: edisoninvestor.com. These filings also provide additional information on historical and other factual data contained in this presentation.
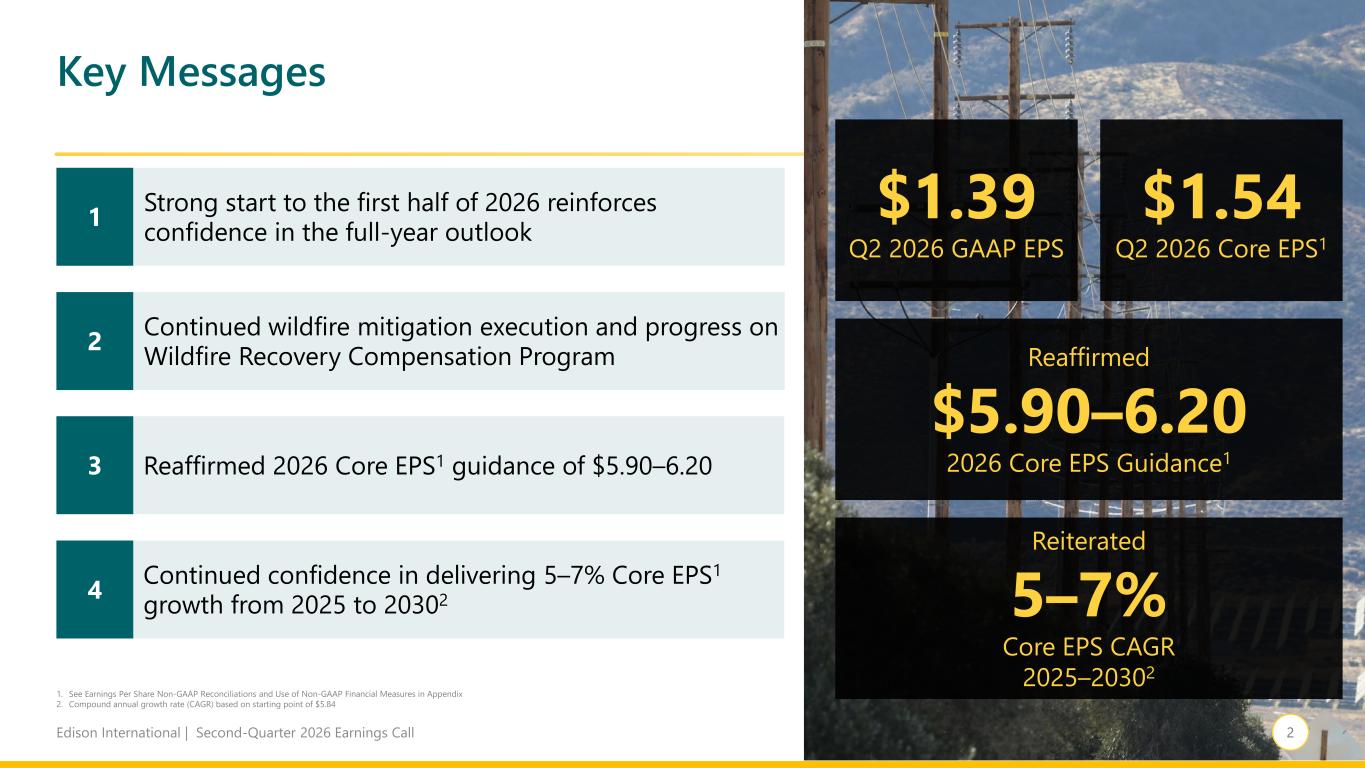
2Edison International | Second-Quarter 2026 Earnings Call Key Messages $1.39 Q2 2026 GAAP EPS $1.54 Q2 2026 Core EPS1 Reiterated 5–7% Core EPS CAGR 2025–20302 Reaffirmed $5.90–6.20 2026 Core EPS Guidance1 Strong start to the first half of 2026 reinforces confidence in the full-year outlook Continued wildfire mitigation execution and progress on Wildfire Recovery Compensation Program 1. See Earnings Per Share Non-GAAP Reconciliations and Use of Non-GAAP Financial Measures in Appendix 2. Compound annual growth rate (CAGR) based on starting point of $5.84 2 1 Reaffirmed 2026 Core EPS1 guidance of $5.90–6.203 4 Continued confidence in delivering 5–7% Core EPS1 growth from 2025 to 20302
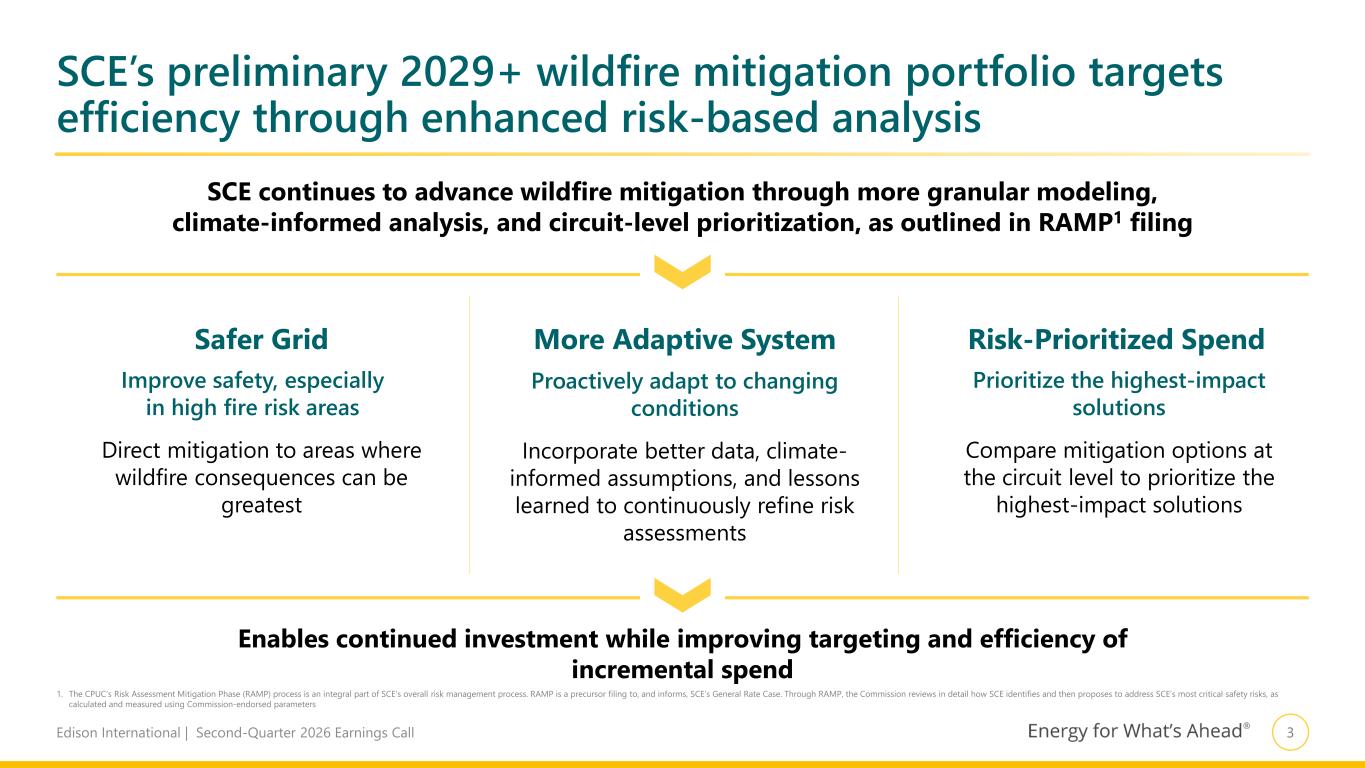
3Edison International | Second-Quarter 2026 Earnings Call SCE’s preliminary 2029+ wildfire mitigation portfolio targets efficiency through enhanced risk-based analysis SCE continues to advance wildfire mitigation through more granular modeling, climate-informed analysis, and circuit-level prioritization, as outlined in RAMP1 filing Risk-Prioritized SpendSafer Grid More Adaptive System Improve safety, especially in high fire risk areas Direct mitigation to areas where wildfire consequences can be greatest Proactively adapt to changing conditions Incorporate better data, climate- informed assumptions, and lessons learned to continuously refine risk assessments Prioritize the highest-impact solutions Compare mitigation options at the circuit level to prioritize the highest-impact solutions Enables continued investment while improving targeting and efficiency of incremental spend 1. The CPUC’s Risk Assessment Mitigation Phase (RAMP) process is an integral part of SCE’s overall risk management process. RAMP is a precursor filing to, and informs, SCE’s General Rate Case. Through RAMP, the Commission reviews in detail how SCE identifies and then proposes to address SCE’s most critical safety risks, as calculated and measured using Commission-endorsed parameters
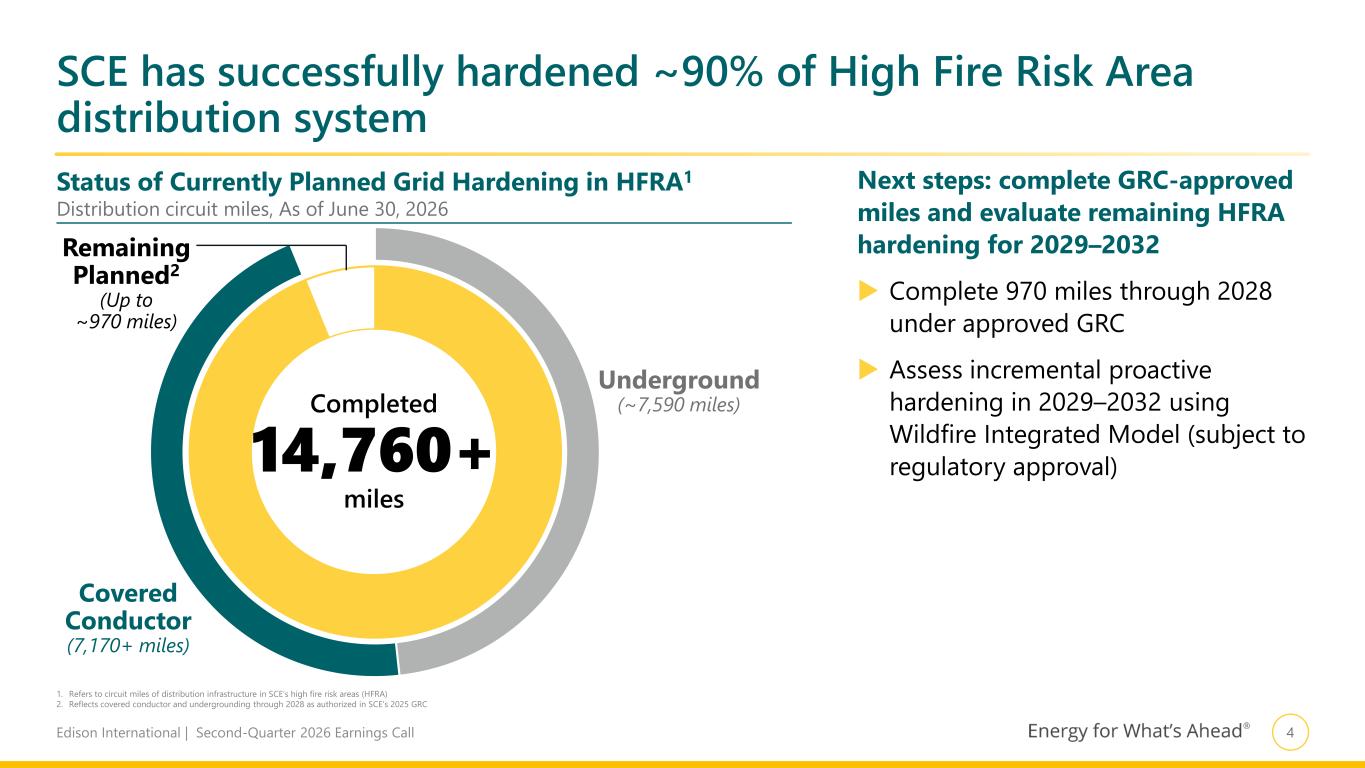
4Edison International | Second-Quarter 2026 Earnings Call SCE has successfully hardened ~90% of High Fire Risk Area distribution system Underground (~7,590 miles) Covered Conductor (7,170+ miles) Status of Currently Planned Grid Hardening in HFRA1 Distribution circuit miles, As of June 30, 2026 Completed 14,760+ miles 1. Refers to circuit miles of distribution infrastructure in SCE’s high fire risk areas (HFRA) 2. Reflects covered conductor and undergrounding through 2028 as authorized in SCE’s 2025 GRC Remaining Planned2 (Up to ~970 miles) Next steps: complete GRC-approved miles and evaluate remaining HFRA hardening for 2029–2032 Complete 970 miles through 2028 under approved GRC Assess incremental proactive hardening in 2029–2032 using Wildfire Integrated Model (subject to regulatory approval)
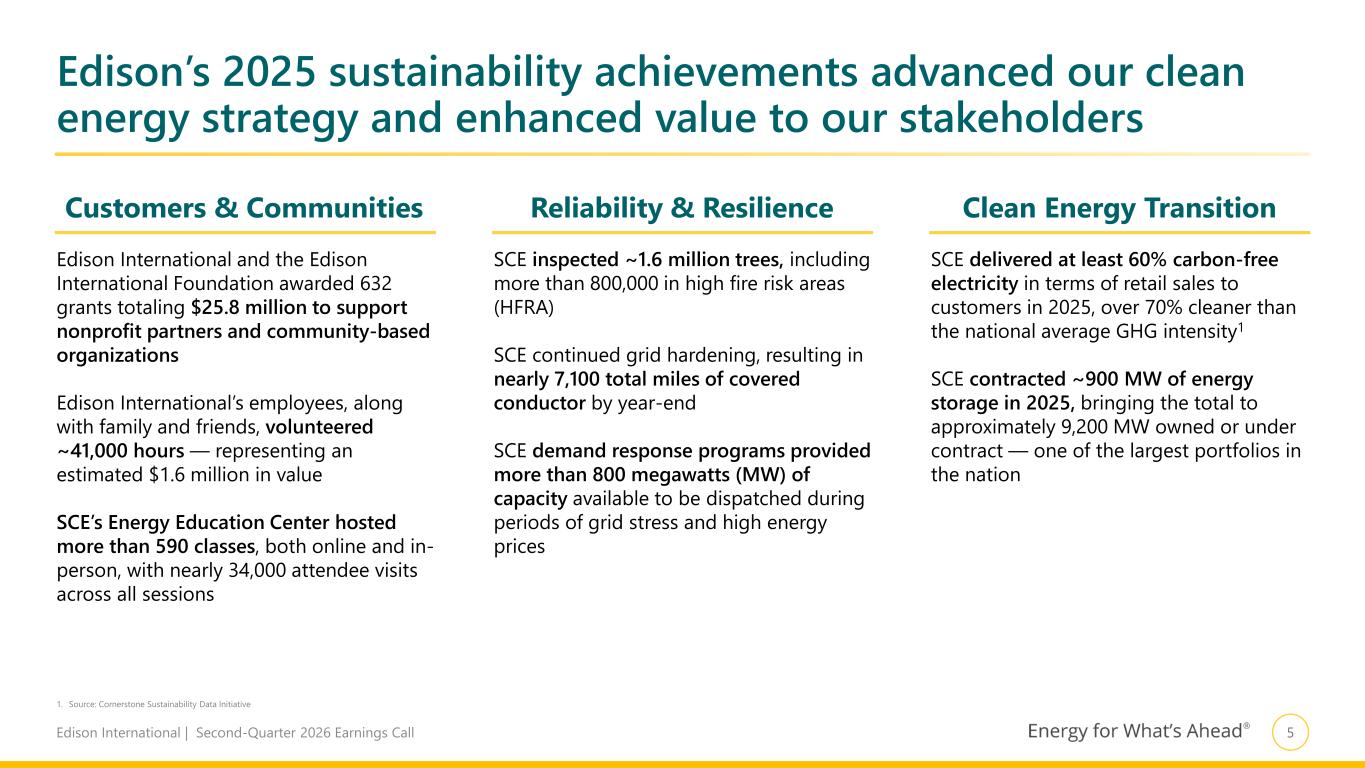
5Edison International | Second-Quarter 2026 Earnings Call Edison’s 2025 sustainability achievements advanced our clean energy strategy and enhanced value to our stakeholders 1. Source: Cornerstone Sustainability Data Initiative Clean Energy Transition SCE delivered at least 60% carbon-free electricity in terms of retail sales to customers in 2025, over 70% cleaner than the national average GHG intensity1 SCE contracted ~900 MW of energy storage in 2025, bringing the total to approximately 9,200 MW owned or under contract — one of the largest portfolios in the nation Customers & Communities Edison International and the Edison International Foundation awarded 632 grants totaling $25.8 million to support nonprofit partners and community-based organizations Edison International’s employees, along with family and friends, volunteered ~41,000 hours — representing an estimated $1.6 million in value SCE’s Energy Education Center hosted more than 590 classes, both online and in- person, with nearly 34,000 attendee visits across all sessions Reliability & Resilience SCE inspected ~1.6 million trees, including more than 800,000 in high fire risk areas (HFRA) SCE continued grid hardening, resulting in nearly 7,100 total miles of covered conductor by year-end SCE demand response programs provided more than 800 megawatts (MW) of capacity available to be dispatched during periods of grid stress and high energy prices
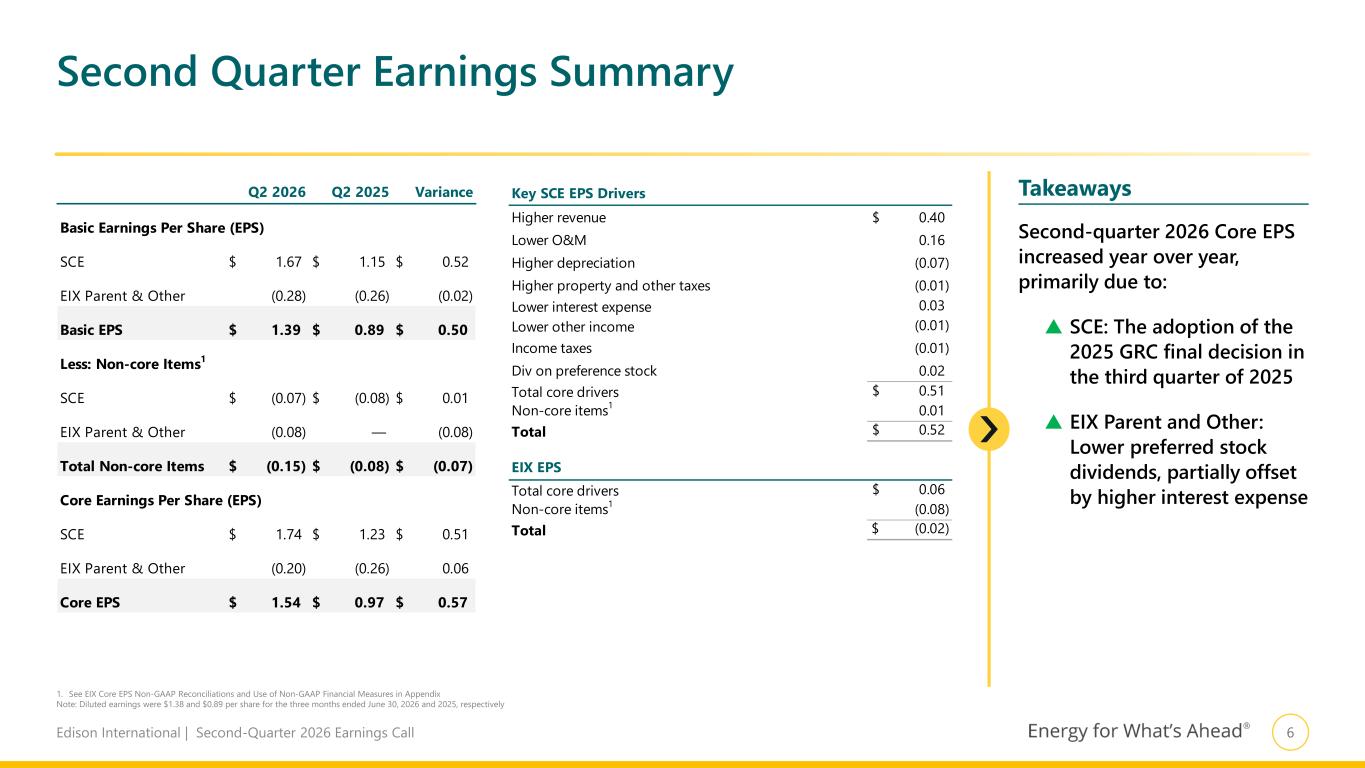
6Edison International | Second-Quarter 2026 Earnings Call Key SCE EPS Drivers Higher revenue 0.40$ Lower O&M 0.16 Higher depreciation (0.07) Higher property and other taxes (0.01) Lower interest expense 0.03 Lower other income (0.01) Income taxes (0.01) Div on preference stock 0.02 Total core drivers 0.51$ Non-core items1 0.01 Total 0.52$ Total core drivers 0.06$ Non-core items1 (0.08) Total (0.02)$ EIX EPS Q2 2026 Q2 2025 Variance Basic Earnings Per Share (EPS) SCE 1.67$ 1.15$ 0.52$ EIX Parent & Other (0.28) (0.26) (0.02) Basic EPS 1.39$ 0.89$ 0.50$ Less: Non-core Items1 SCE (0.07)$ (0.08)$ 0.01$ EIX Parent & Other (0.08) — (0.08) Total Non-core Items (0.15)$ (0.08)$ (0.07)$ Core Earnings Per Share (EPS) SCE 1.74$ 1.23$ 0.51$ EIX Parent & Other (0.20) (0.26) 0.06 Core EPS 1.54$ 0.97$ 0.57$ Second Quarter Earnings Summary 1. See EIX Core EPS Non-GAAP Reconciliations and Use of Non-GAAP Financial Measures in Appendix Note: Diluted earnings were $1.38 and $0.89 per share for the three months ended June 30, 2026 and 2025, respectively Second-quarter 2026 Core EPS increased year over year, primarily due to: SCE: The adoption of the 2025 GRC final decision in the third quarter of 2025 EIX Parent and Other: Lower preferred stock dividends, partially offset by higher interest expense Takeaways
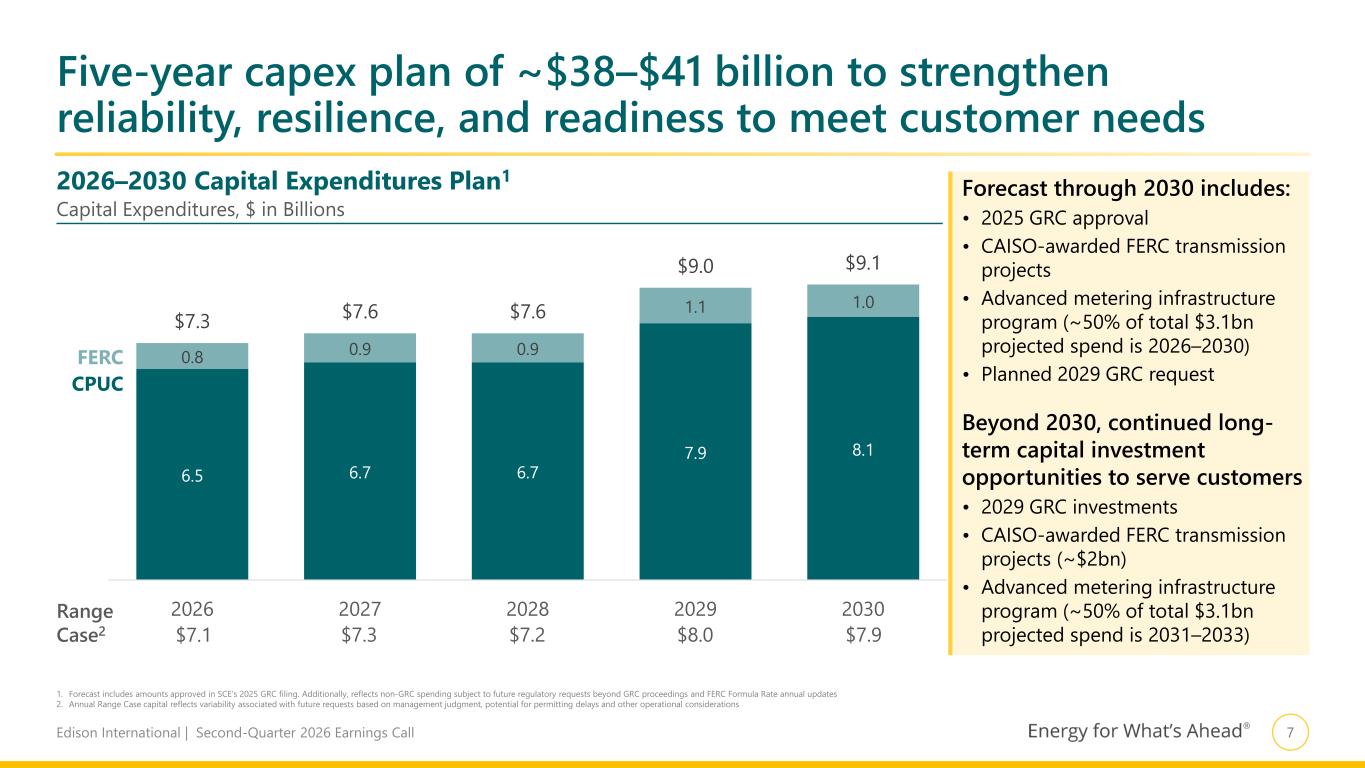
7Edison International | Second-Quarter 2026 Earnings Call 2026–2030 Capital Expenditures Plan1 Five-year capex plan of ~$38–$41 billion to strengthen reliability, resilience, and readiness to meet customer needs Capital Expenditures, $ in Billions 1. Forecast includes amounts approved in SCE’s 2025 GRC filing. Additionally, reflects non-GRC spending subject to future regulatory requests beyond GRC proceedings and FERC Formula Rate annual updates 2. Annual Range Case capital reflects variability associated with future requests based on management judgment, potential for permitting delays and other operational considerations 6.5 6.7 6.7 7.9 8.1 0.8 0.9 0.9 1.1 1.0 $7.3 $7.6 $7.6 $9.0 $9.1 2026 2027 2028 2029 2030 CPUC FERC Range Case2 $7.1 $7.3 $7.2 $8.0 $7.9 Forecast through 2030 includes: • 2025 GRC approval • CAISO-awarded FERC transmission projects • Advanced metering infrastructure program (~50% of total $3.1bn projected spend is 2026–2030) • Planned 2029 GRC request Beyond 2030, continued long- term capital investment opportunities to serve customers • 2029 GRC investments • CAISO-awarded FERC transmission projects (~$2bn) • Advanced metering infrastructure program (~50% of total $3.1bn projected spend is 2031–2033)
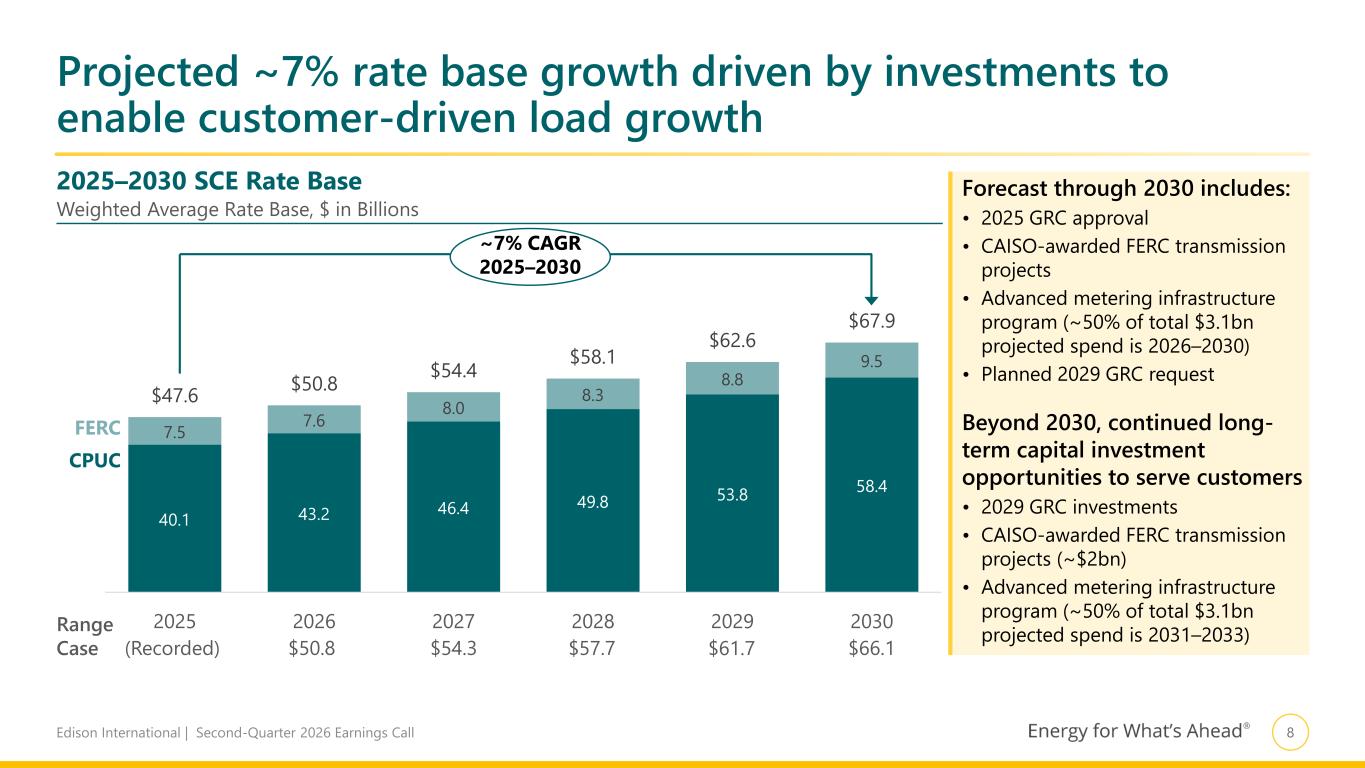
8Edison International | Second-Quarter 2026 Earnings Call 40.1 43.2 46.4 49.8 53.8 58.4 7.5 7.6 8.0 8.3 8.8 9.5 $47.6 $50.8 $54.4 $58.1 $62.6 $67.9 2025 2026 2027 2028 2029 2030 Projected ~7% rate base growth driven by investments to enable customer-driven load growth CPUC FERC ~7% CAGR 2025–2030 Range Case (Recorded) $50.8 $54.3 $57.7 $61.7 $66.1 2025–2030 SCE Rate Base Weighted Average Rate Base, $ in Billions Forecast through 2030 includes: • 2025 GRC approval • CAISO-awarded FERC transmission projects • Advanced metering infrastructure program (~50% of total $3.1bn projected spend is 2026–2030) • Planned 2029 GRC request Beyond 2030, continued long- term capital investment opportunities to serve customers • 2029 GRC investments • CAISO-awarded FERC transmission projects (~$2bn) • Advanced metering infrastructure program (~50% of total $3.1bn projected spend is 2031–2033)
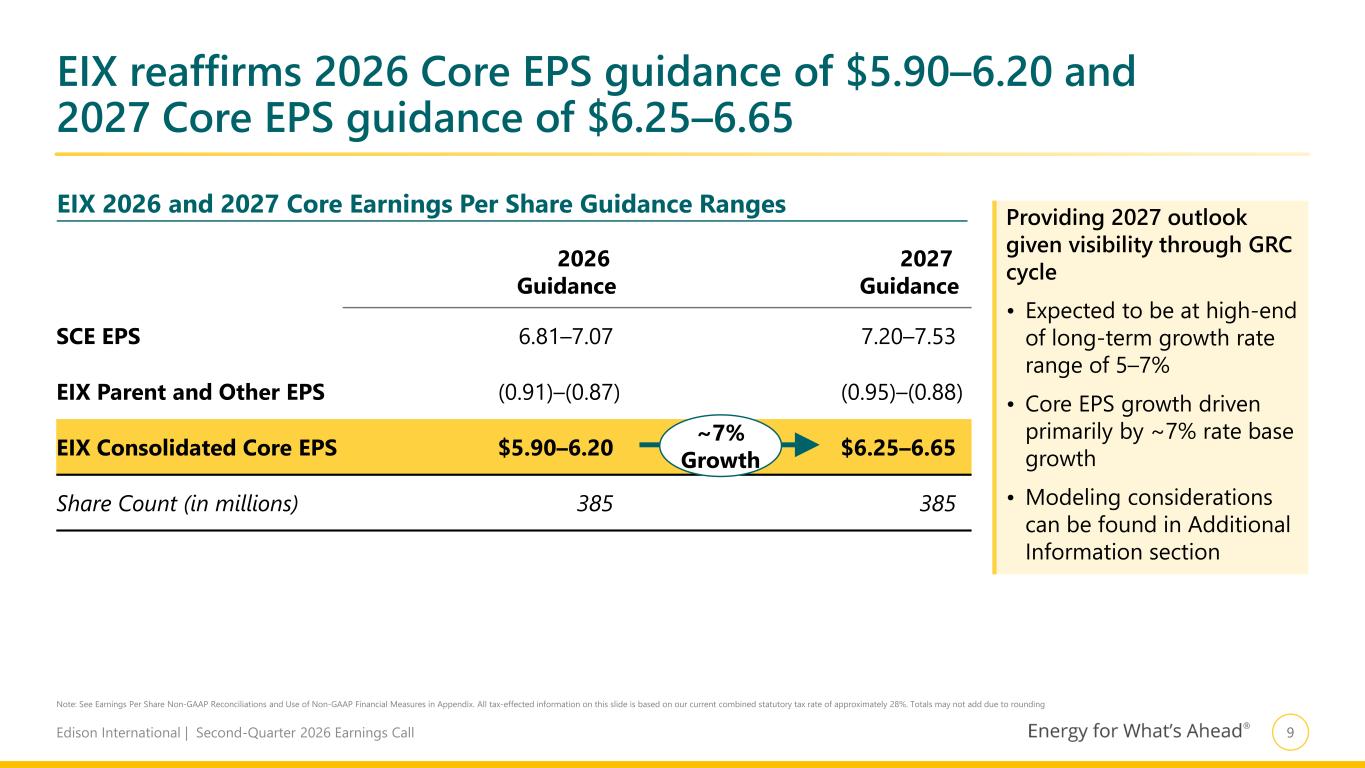
9Edison International | Second-Quarter 2026 Earnings Call Note: See Earnings Per Share Non-GAAP Reconciliations and Use of Non-GAAP Financial Measures in Appendix. All tax-effected information on this slide is based on our current combined statutory tax rate of approximately 28%. Totals may not add due to rounding EIX 2026 and 2027 Core Earnings Per Share Guidance Ranges 2026 Guidance 2027 Guidance SCE EPS 6.81–7.07 7.20–7.53 EIX Parent and Other EPS (0.91)–(0.87) (0.95)–(0.88) EIX Consolidated Core EPS $5.90–6.20 $6.25–6.65 Share Count (in millions) 385 385 EIX reaffirms 2026 Core EPS guidance of $5.90–6.20 and 2027 Core EPS guidance of $6.25–6.65 ~7% Growth Providing 2027 outlook given visibility through GRC cycle • Expected to be at high-end of long-term growth rate range of 5–7% • Core EPS growth driven primarily by ~7% rate base growth • Modeling considerations can be found in Additional Information section
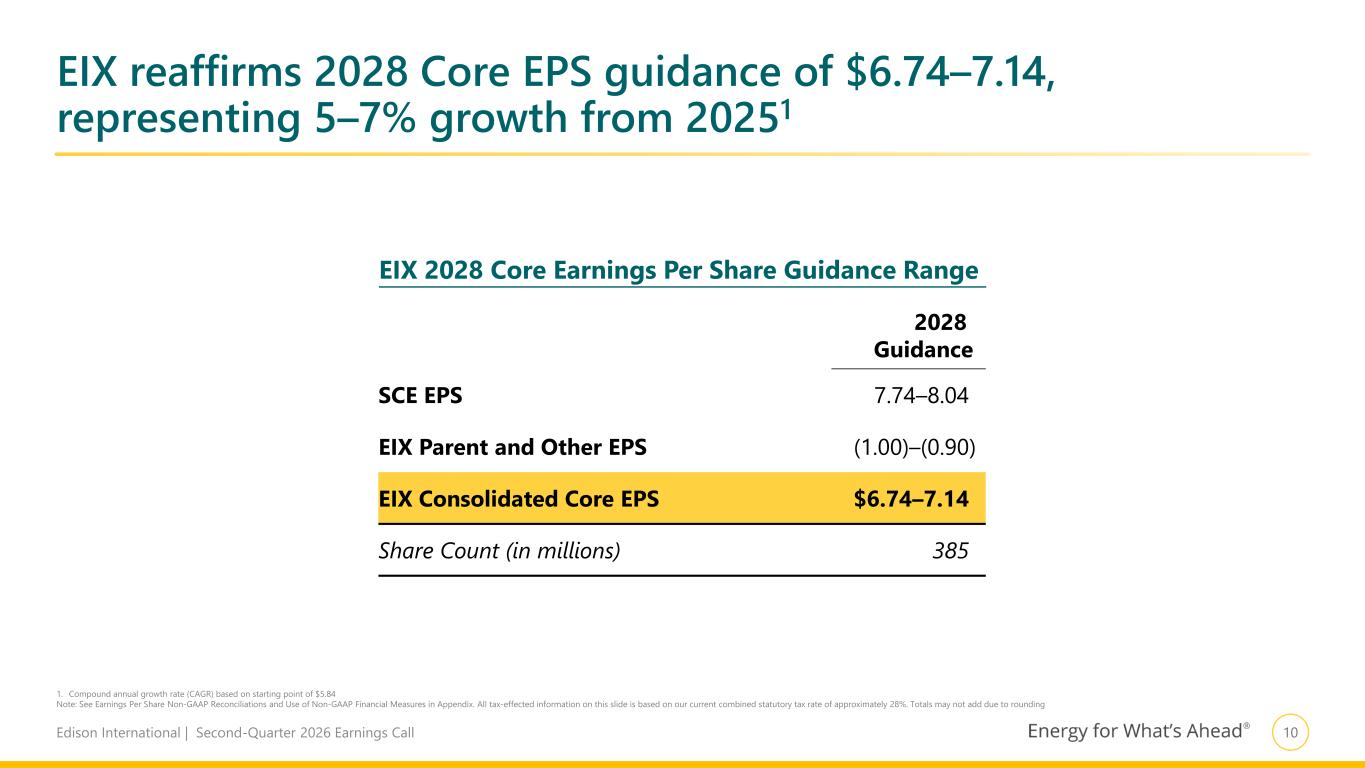
10Edison International | Second-Quarter 2026 Earnings Call 1. Compound annual growth rate (CAGR) based on starting point of $5.84 Note: See Earnings Per Share Non-GAAP Reconciliations and Use of Non-GAAP Financial Measures in Appendix. All tax-effected information on this slide is based on our current combined statutory tax rate of approximately 28%. Totals may not add due to rounding EIX 2028 Core Earnings Per Share Guidance Range 2028 Guidance SCE EPS 7.74–8.04 EIX Parent and Other EPS (1.00)–(0.90) EIX Consolidated Core EPS $6.74–7.14 Share Count (in millions) 385 EIX reaffirms 2028 Core EPS guidance of $6.74–7.14, representing 5–7% growth from 20251
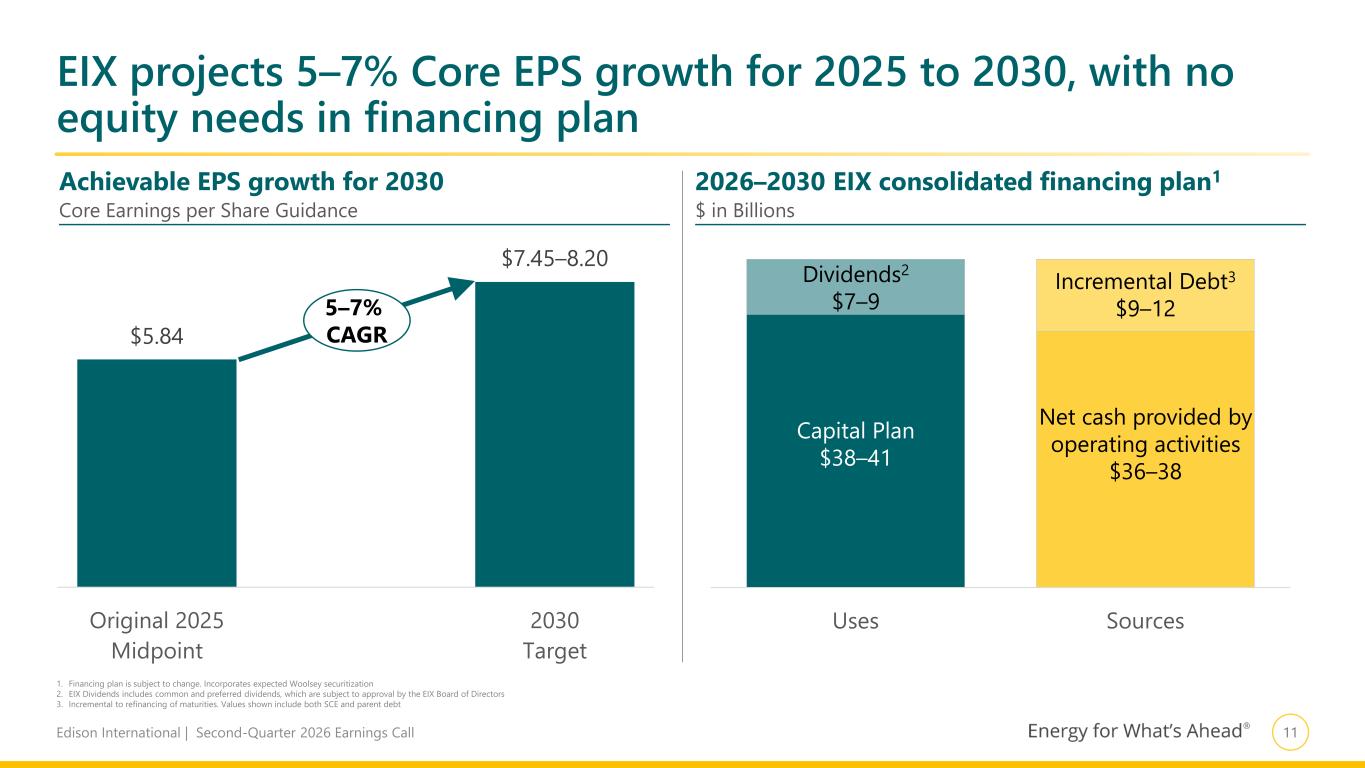
11Edison International | Second-Quarter 2026 Earnings Call EIX projects 5–7% Core EPS growth for 2025 to 2030, with no equity needs in financing plan 1. Financing plan is subject to change. Incorporates expected Woolsey securitization 2. EIX Dividends includes common and preferred dividends, which are subject to approval by the EIX Board of Directors 3. Incremental to refinancing of maturities. Values shown include both SCE and parent debt $5.84 $7.45–8.20 Original 2025 Midpoint 2030 Target Achievable EPS growth for 2030 Core Earnings per Share Guidance 5–7% CAGR 2026–2030 EIX consolidated financing plan1 $ in Billions Uses Sources Capital Plan $38–41 Dividends2 $7–9 Net cash provided by operating activities $36–38 Incremental Debt3 $9–12
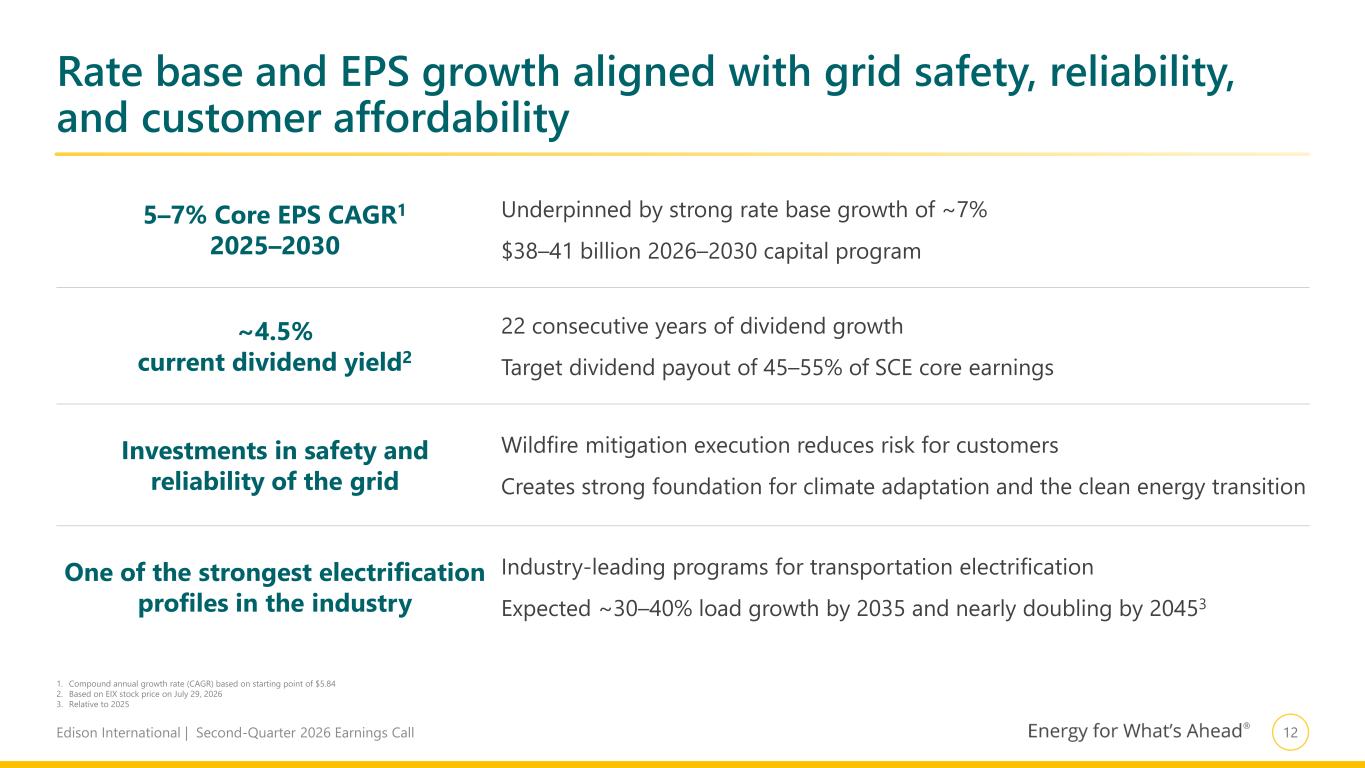
12Edison International | Second-Quarter 2026 Earnings Call Rate base and EPS growth aligned with grid safety, reliability, and customer affordability 1. Compound annual growth rate (CAGR) based on starting point of $5.84 2. Based on EIX stock price on July 29, 2026 3. Relative to 2025 5–7% Core EPS CAGR1 2025–2030 Underpinned by strong rate base growth of ~7% $38–41 billion 2026–2030 capital program ~4.5% current dividend yield2 22 consecutive years of dividend growth Target dividend payout of 45–55% of SCE core earnings Investments in safety and reliability of the grid Wildfire mitigation execution reduces risk for customers Creates strong foundation for climate adaptation and the clean energy transition One of the strongest electrification profiles in the industry Industry-leading programs for transportation electrification Expected ~30–40% load growth by 2035 and nearly doubling by 20453
ADDITIONAL INFORMATION
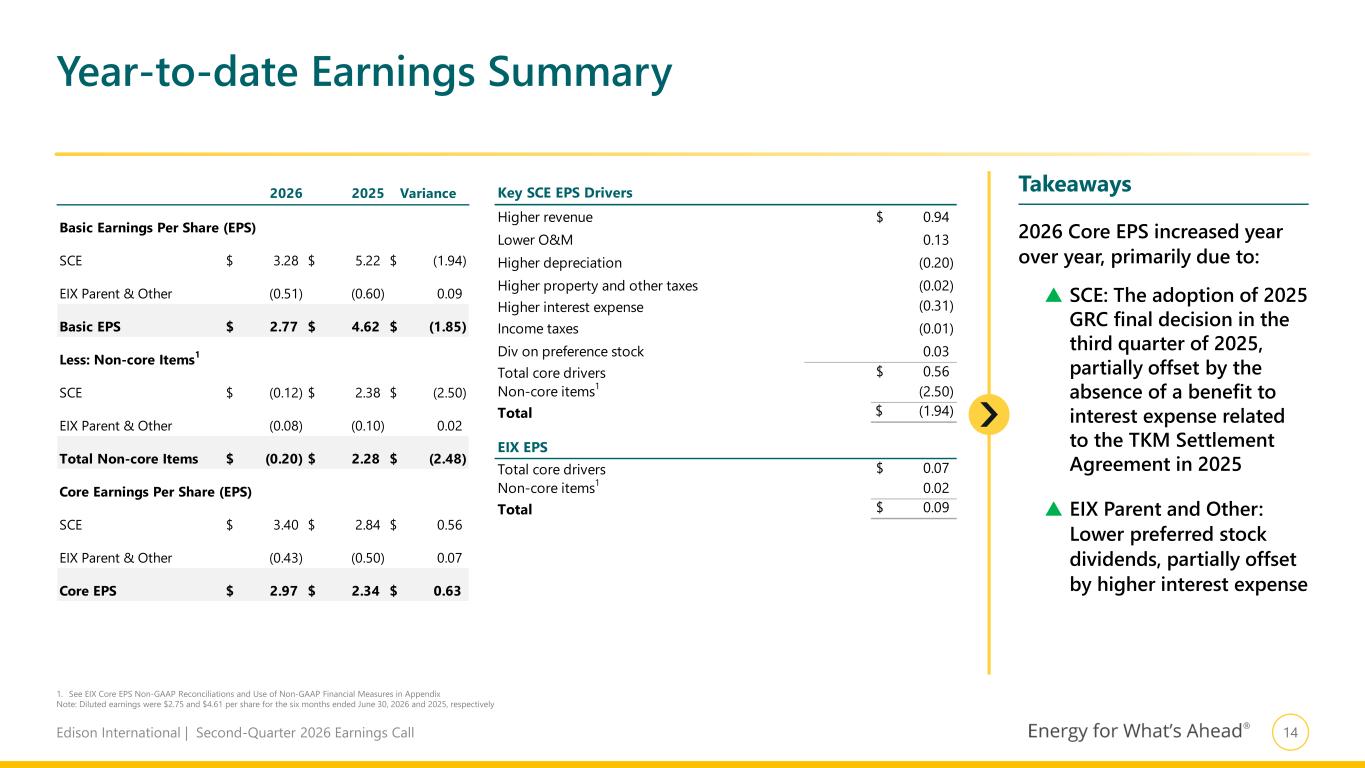
14Edison International | Second-Quarter 2026 Earnings Call Key SCE EPS Drivers Higher revenue 0.94$ Lower O&M 0.13 Higher depreciation (0.20) Higher property and other taxes (0.02) Higher interest expense (0.31) Income taxes (0.01) Div on preference stock 0.03 Total core drivers 0.56$ Non-core items1 (2.50) Total (1.94)$ Total core drivers 0.07$ Non-core items1 0.02 Total 0.09$ EIX EPS 2026 2025 Variance Basic Earnings Per Share (EPS) SCE 3.28$ 5.22$ (1.94)$ EIX Parent & Other (0.51) (0.60) 0.09 Basic EPS 2.77$ 4.62$ (1.85)$ Less: Non-core Items1 SCE (0.12)$ 2.38$ (2.50)$ EIX Parent & Other (0.08) (0.10) 0.02 Total Non-core Items (0.20)$ 2.28$ (2.48)$ Core Earnings Per Share (EPS) SCE 3.40$ 2.84$ 0.56$ EIX Parent & Other (0.43) (0.50) 0.07 Core EPS 2.97$ 2.34$ 0.63$ Year-to-date Earnings Summary 1. See EIX Core EPS Non-GAAP Reconciliations and Use of Non-GAAP Financial Measures in Appendix Note: Diluted earnings were $2.75 and $4.61 per share for the six months ended June 30, 2026 and 2025, respectively 2026 Core EPS increased year over year, primarily due to: SCE: The adoption of 2025 GRC final decision in the third quarter of 2025, partially offset by the absence of a benefit to interest expense related to the TKM Settlement Agreement in 2025 EIX Parent and Other: Lower preferred stock dividends, partially offset by higher interest expense Takeaways
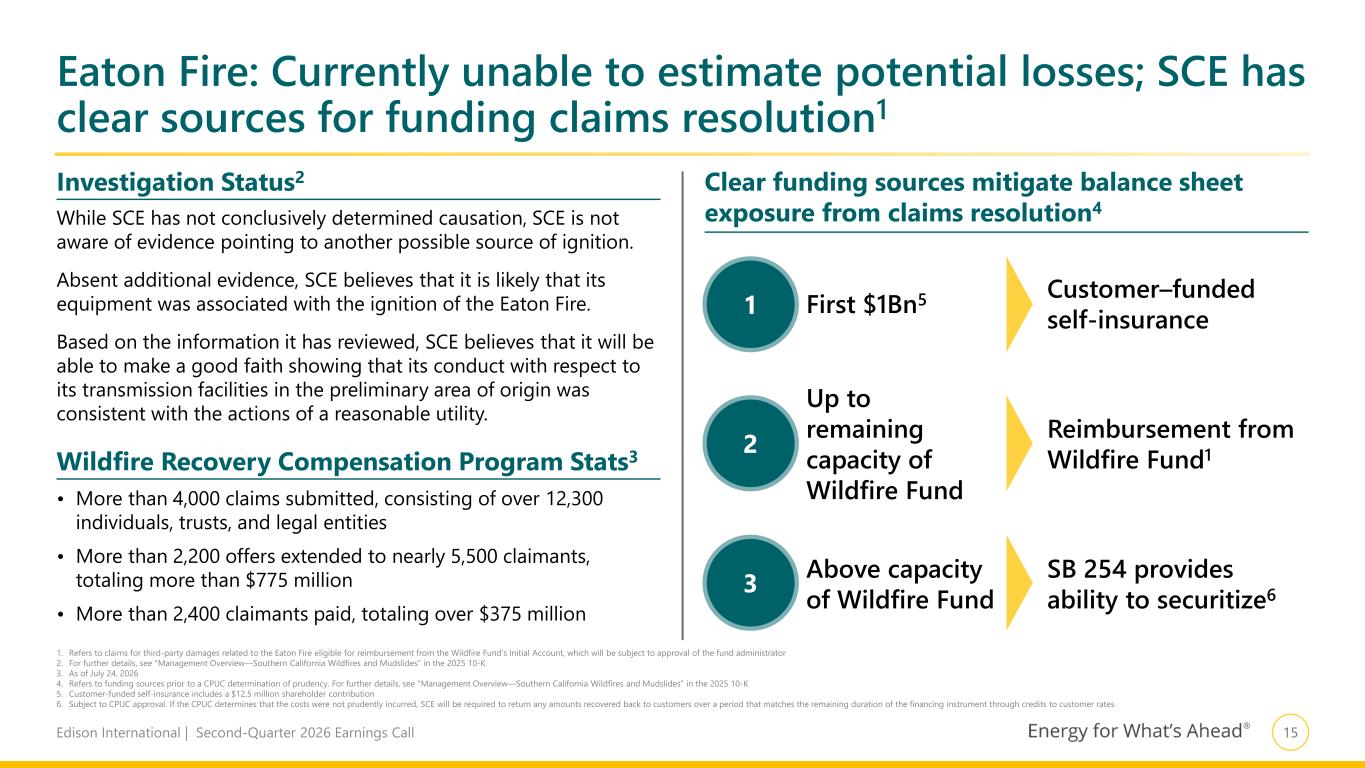
15Edison International | Second-Quarter 2026 Earnings Call 1 2 3 Eaton Fire: Currently unable to estimate potential losses; SCE has clear sources for funding claims resolution1 1. Refers to claims for third-party damages related to the Eaton Fire eligible for reimbursement from the Wildfire Fund’s Initial Account, which will be subject to approval of the fund administrator 2. For further details, see "Management Overview—Southern California Wildfires and Mudslides” in the 2025 10-K 3. As of July 24, 2026 4. Refers to funding sources prior to a CPUC determination of prudency. For further details, see "Management Overview—Southern California Wildfires and Mudslides” in the 2025 10-K 5. Customer-funded self-insurance includes a $12.5 million shareholder contribution 6. Subject to CPUC approval. If the CPUC determines that the costs were not prudently incurred, SCE will be required to return any amounts recovered back to customers over a period that matches the remaining duration of the financing instrument through credits to customer rates Clear funding sources mitigate balance sheet exposure from claims resolution4While SCE has not conclusively determined causation, SCE is not aware of evidence pointing to another possible source of ignition. Absent additional evidence, SCE believes that it is likely that its equipment was associated with the ignition of the Eaton Fire. Based on the information it has reviewed, SCE believes that it will be able to make a good faith showing that its conduct with respect to its transmission facilities in the preliminary area of origin was consistent with the actions of a reasonable utility. • More than 4,000 claims submitted, consisting of over 12,300 individuals, trusts, and legal entities • More than 2,200 offers extended to nearly 5,500 claimants, totaling more than $775 million • More than 2,400 claimants paid, totaling over $375 million Investigation Status2 Wildfire Recovery Compensation Program Stats3 First $1Bn5 Customer–funded self-insurance Up to remaining capacity of Wildfire Fund Reimbursement from Wildfire Fund1 Above capacity of Wildfire Fund SB 254 provides ability to securitize6
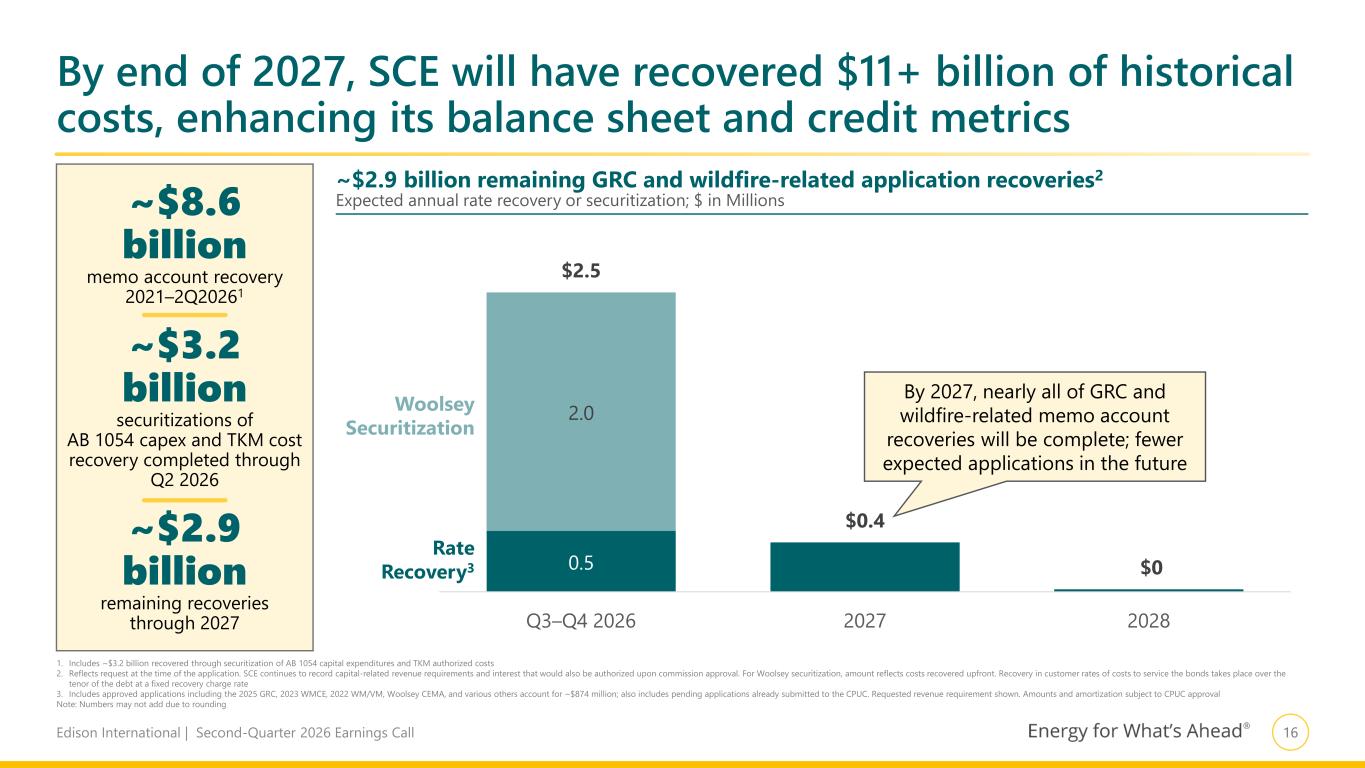
16Edison International | Second-Quarter 2026 Earnings Call By end of 2027, SCE will have recovered $11+ billion of historical costs, enhancing its balance sheet and credit metrics 1. Includes ~$3.2 billion recovered through securitization of AB 1054 capital expenditures and TKM authorized costs 2. Reflects request at the time of the application. SCE continues to record capital-related revenue requirements and interest that would also be authorized upon commission approval. For Woolsey securitization, amount reflects costs recovered upfront. Recovery in customer rates of costs to service the bonds takes place over the tenor of the debt at a fixed recovery charge rate 3. Includes approved applications including the 2025 GRC, 2023 WMCE, 2022 WM/VM, Woolsey CEMA, and various others account for ~$874 million; also includes pending applications already submitted to the CPUC. Requested revenue requirement shown. Amounts and amortization subject to CPUC approval Note: Numbers may not add due to rounding 0.5 2.0 $2.5 $0.4 $0 Q3–Q4 2026 2027 2028 Rate Recovery3 Woolsey Securitization ~$8.6 billion memo account recovery 2021–2Q20261 ~$3.2 billion securitizations of AB 1054 capex and TKM cost recovery completed through Q2 2026 ~$2.9 billion remaining recoveries through 2027 ~$2.9 billion remaining GRC and wildfire-related application recoveries2 Expected annual rate recovery or securitization; $ in Millions By 2027, nearly all of GRC and wildfire-related memo account recoveries will be complete; fewer expected applications in the future
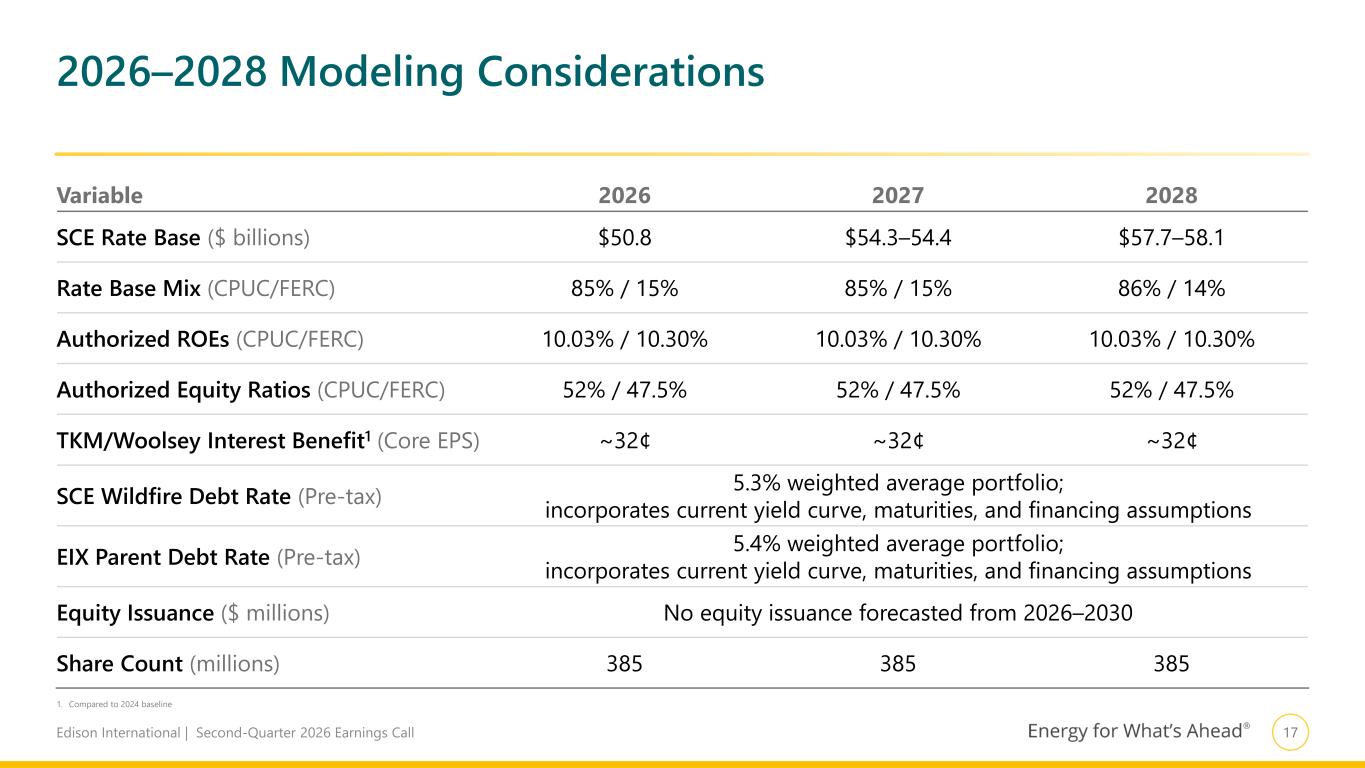
17Edison International | Second-Quarter 2026 Earnings Call 2026–2028 Modeling Considerations Variable 2026 2027 2028 SCE Rate Base ($ billions) $50.8 $54.3–54.4 $57.7–58.1 Rate Base Mix (CPUC/FERC) 85% / 15% 85% / 15% 86% / 14% Authorized ROEs (CPUC/FERC) 10.03% / 10.30% 10.03% / 10.30% 10.03% / 10.30% Authorized Equity Ratios (CPUC/FERC) 52% / 47.5% 52% / 47.5% 52% / 47.5% TKM/Woolsey Interest Benefit1 (Core EPS) ~32¢ ~32¢ ~32¢ SCE Wildfire Debt Rate (Pre-tax) 5.3% weighted average portfolio; incorporates current yield curve, maturities, and financing assumptions EIX Parent Debt Rate (Pre-tax) 5.4% weighted average portfolio; incorporates current yield curve, maturities, and financing assumptions Equity Issuance ($ millions) No equity issuance forecasted from 2026–2030 Share Count (millions) 385 385 385 1. Compared to 2024 baseline
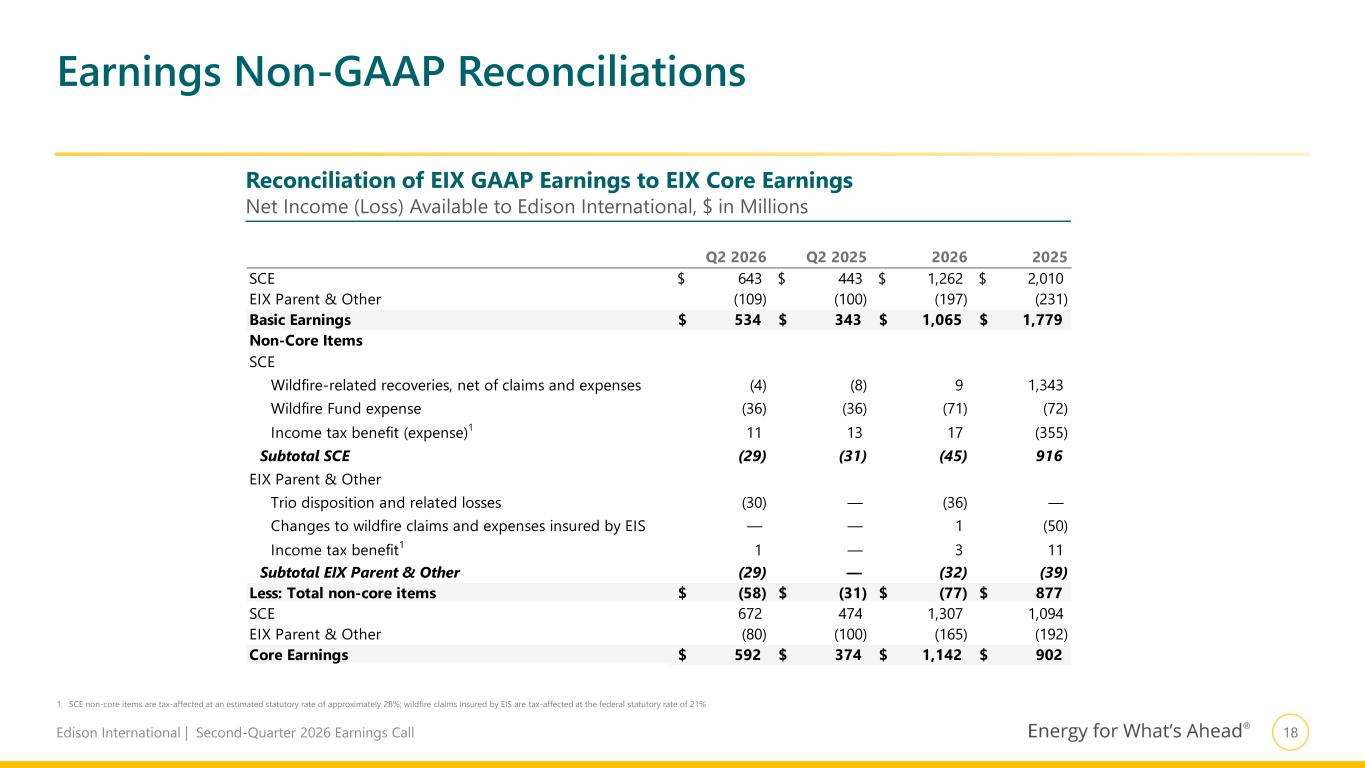
18Edison International | Second-Quarter 2026 Earnings Call Q2 2026 Q2 2025 2026 2025 SCE 643$ 443$ 1,262$ 2,010$ EIX Parent & Other (109) (100) (197) (231) Basic Earnings 534$ 343$ 1,065$ 1,779$ Non-Core Items SCE Wildfire-related recoveries, net of claims and expenses (4) (8) 9 1,343 Wildfire Fund expense (36) (36) (71) (72) Income tax benefit (expense)1 11 13 17 (355) Subtotal SCE (29) (31) (45) 916 EIX Parent & Other Trio disposition and related losses (30) — (36) — Changes to wildfire claims and expenses insured by EIS — — 1 (50) Income tax benefit1 1 — 3 11 Subtotal EIX Parent & Other (29) — (32) (39) Less: Total non-core items (58)$ (31)$ (77)$ 877$ SCE 672 474 1,307 1,094 EIX Parent & Other (80) (100) (165) (192) Core Earnings 592$ 374$ 1,142$ 902$ Earnings Non-GAAP Reconciliations 1. SCE non-core items are tax-affected at an estimated statutory rate of approximately 28%; wildfire claims insured by EIS are tax-affected at the federal statutory rate of 21% Reconciliation of EIX GAAP Earnings to EIX Core Earnings Net Income (Loss) Available to Edison International, $ in Millions
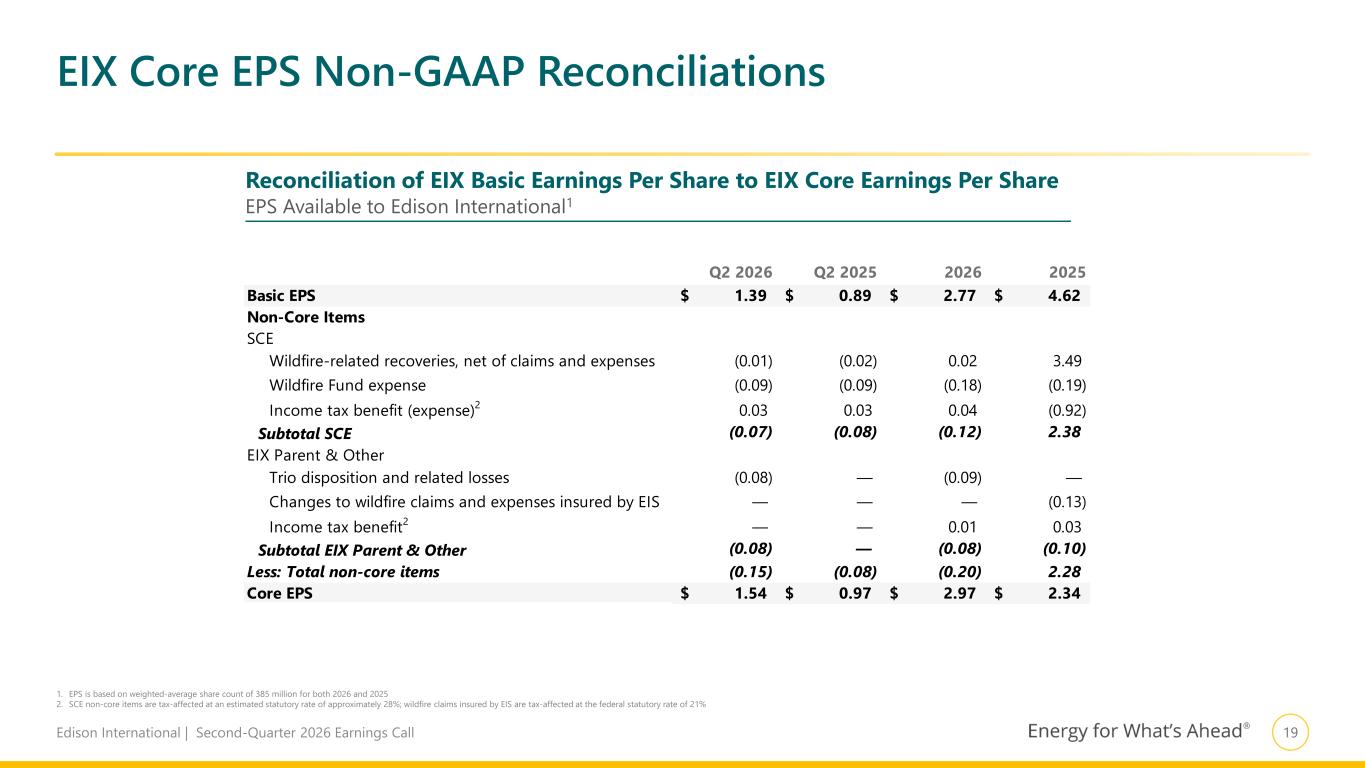
19Edison International | Second-Quarter 2026 Earnings Call Q2 2026 Q2 2025 2026 2025 Basic EPS 1.39$ 0.89$ 2.77$ 4.62$ Non-Core Items SCE Wildfire-related recoveries, net of claims and expenses (0.01) (0.02) 0.02 3.49 Wildfire Fund expense (0.09) (0.09) (0.18) (0.19) Income tax benefit (expense)2 0.03 0.03 0.04 (0.92) Subtotal SCE (0.07) (0.08) (0.12) 2.38 EIX Parent & Other Trio disposition and related losses (0.08) — (0.09) — Changes to wildfire claims and expenses insured by EIS — — — (0.13) Income tax benefit2 — — 0.01 0.03 Subtotal EIX Parent & Other (0.08) — (0.08) (0.10) Less: Total non-core items (0.15) (0.08) (0.20) 2.28 Core EPS 1.54$ 0.97$ 2.97$ 2.34$ EIX Core EPS Non-GAAP Reconciliations 1. EPS is based on weighted-average share count of 385 million for both 2026 and 2025 2. SCE non-core items are tax-affected at an estimated statutory rate of approximately 28%; wildfire claims insured by EIS are tax-affected at the federal statutory rate of 21% Reconciliation of EIX Basic Earnings Per Share to EIX Core Earnings Per Share EPS Available to Edison International1
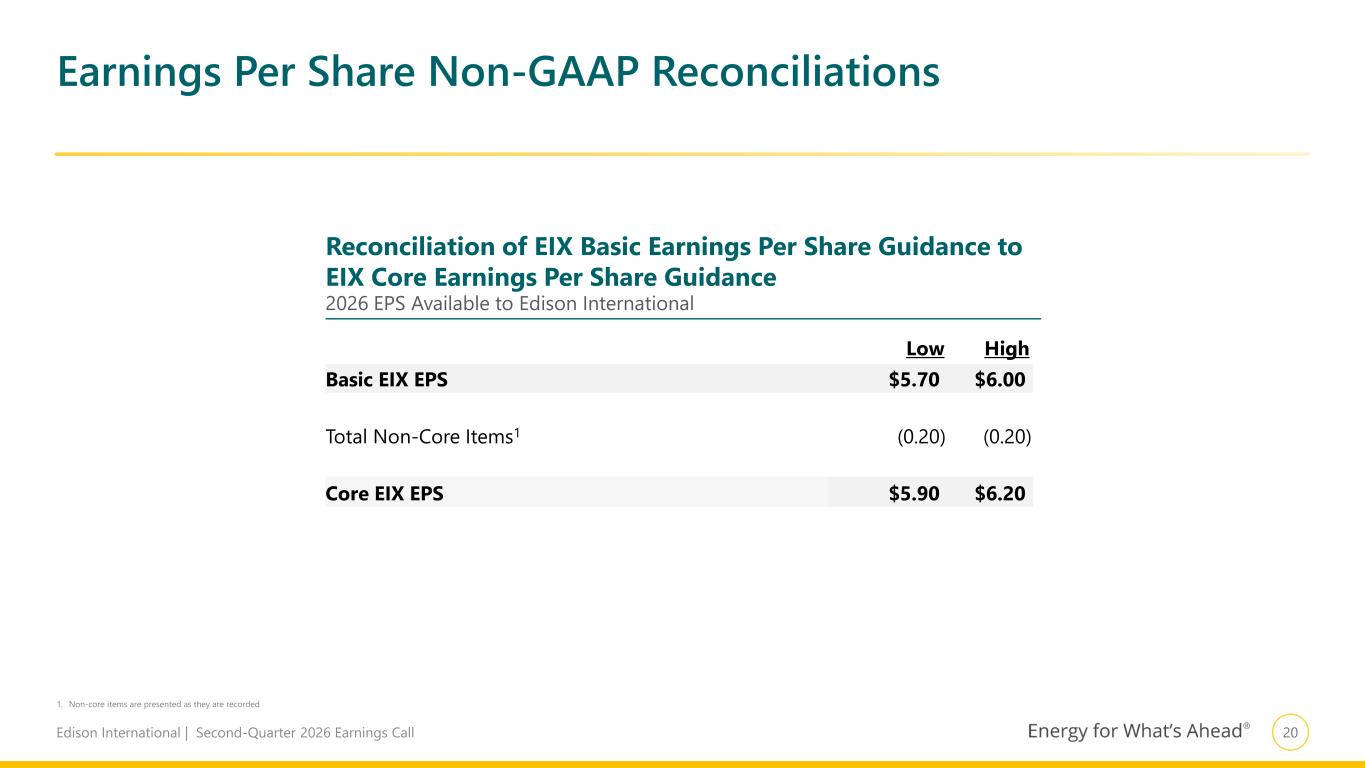
20Edison International | Second-Quarter 2026 Earnings Call Low High Basic EIX EPS $5.70 $6.00 Total Non-Core Items1 (0.20) (0.20) Core EIX EPS $5.90 $6.20 1. Non-core items are presented as they are recorded Earnings Per Share Non-GAAP Reconciliations Reconciliation of EIX Basic Earnings Per Share Guidance to EIX Core Earnings Per Share Guidance 2026 EPS Available to Edison International
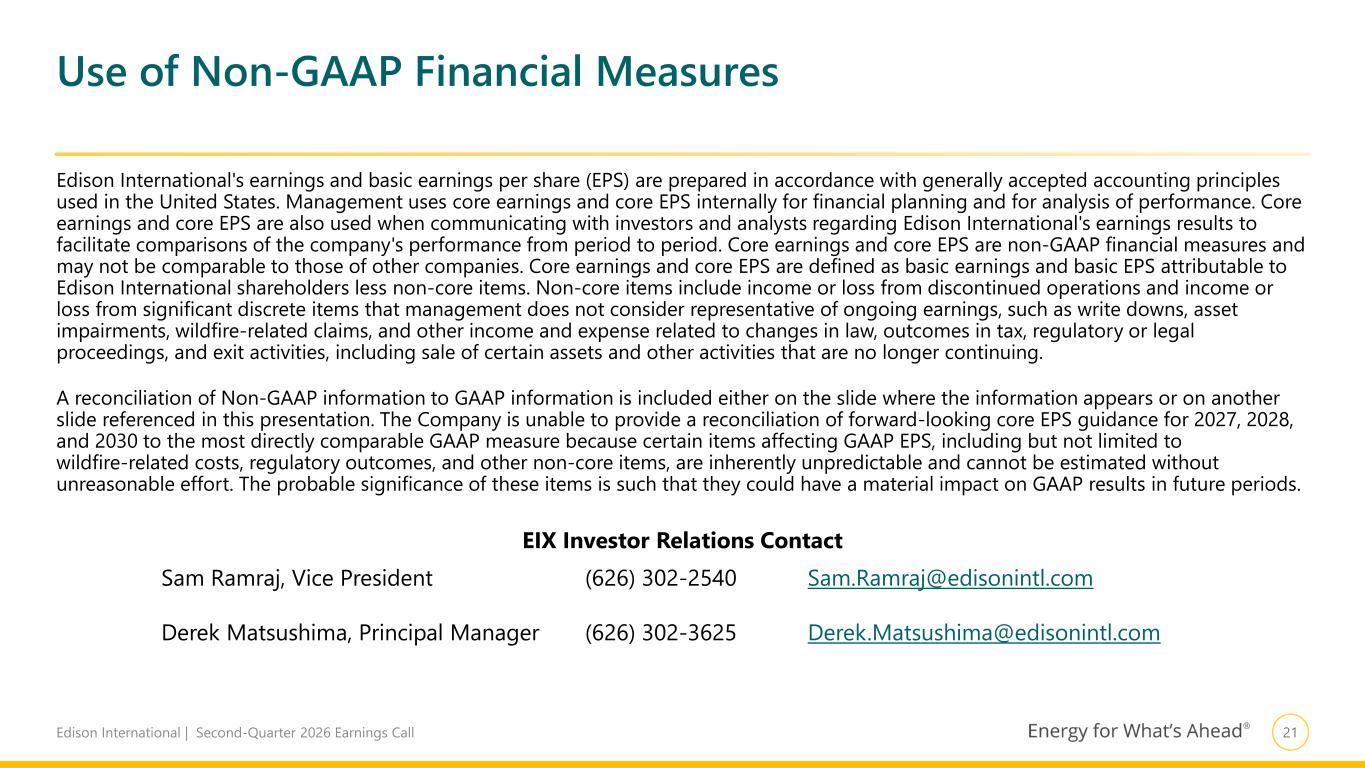
21Edison International | Second-Quarter 2026 Earnings Call Use of Non-GAAP Financial Measures EIX Investor Relations Contact Sam Ramraj, Vice President Derek Matsushima, Principal Manager (626) 302-2540 (626) 302-3625 Sam.Ramraj@edisonintl.com Derek.Matsushima@edisonintl.com Edison International's earnings and basic earnings per share (EPS) are prepared in accordance with generally accepted accounting principles used in the United States. Management uses core earnings and core EPS internally for financial planning and for analysis of performance. Core earnings and core EPS are also used when communicating with investors and analysts regarding Edison International's earnings results to facilitate comparisons of the company's performance from period to period. Core earnings and core EPS are non-GAAP financial measures and may not be comparable to those of other companies. Core earnings and core EPS are defined as basic earnings and basic EPS attributable to Edison International shareholders less non-core items. Non-core items include income or loss from discontinued operations and income or loss from significant discrete items that management does not consider representative of ongoing earnings, such as write downs, asset impairments, wildfire-related claims, and other income and expense related to changes in law, outcomes in tax, regulatory or legal proceedings, and exit activities, including sale of certain assets and other activities that are no longer continuing. A reconciliation of Non-GAAP information to GAAP information is included either on the slide where the information appears or on another slide referenced in this presentation. The Company is unable to provide a reconciliation of forward-looking core EPS guidance for 2027, 2028, and 2030 to the most directly comparable GAAP measure because certain items affecting GAAP EPS, including but not limited to wildfire-related costs, regulatory outcomes, and other non-core items, are inherently unpredictable and cannot be estimated without unreasonable effort. The probable significance of these items is such that they could have a material impact on GAAP results in future periods.