
©2026 Laureate Education, Inc. Second Quarter 2026 Earnings Presentation July 30, 2026 Exhibit 99.2
2©2026 Laureate Education, Inc. Forward Looking Statements This presentation includes statements that express Laureate’s opinions, expectations, beliefs, plans, objectives, assumptions or projections regarding future events or future results and therefore are, or may be deemed to be, ‘‘forward-looking statements’’ within the meaning of the federal securities laws, which involve risks and uncertainties. Laureate’s actual results may vary significantly from the results anticipated in these forward-looking statements. You can identify forward-looking statements because they contain words such as ‘‘believes,’’ ‘‘expects,’’ ‘‘may,’’ ‘‘will,’’ ‘‘should,’’ ‘‘seeks,’’ ‘‘approximately,’’ ‘‘intends,’’ ‘‘plans,’’ ‘‘estimates’’ or ‘‘anticipates’’ or similar expressions that concern our strategy, plans or intentions. In particular, statements regarding the amount, timing, process, tax treatment and impact of any future dividends represent forward-looking statements. All statements we make relating to guidance (including, but not limited to, total enrollments, revenues, Adjusted EBITDA, Adjusted net income, and Adjusted EPS), and all statements we make relating to our current growth strategy and other future plans, strategies or transactions that may be identified, explored or implemented and any litigation or dispute resulting from any completed transaction are forward-looking statements. In addition, we, through our senior management, from time to time make forward-looking public statements concerning our expected future operations and performance and other developments. All of these forward-looking statements are subject to risks and uncertainties that may change at any time, including with respect to our current growth strategy and the impact of any completed divestiture or separation transaction on our remaining businesses. Accordingly, our actual results may differ materially from those we expected. We derive most of our forward-looking statements from our operating budgets and forecasts, which are based upon many detailed assumptions. While we believe that our assumptions are reasonable, we caution that it is very difficult to predict the impact of known factors, and, of course, it is impossible for us to anticipate all factors that could affect our actual results. Important factors that could cause actual results to differ materially from our expectations are disclosed in our Annual Report on Form 10-K filed with the SEC on February 19, 2026, our subsequent Quarterly Reports on Form 10-Q filed, and to be filed, with the SEC and other filings made with the SEC. These forward-looking statements speak only as of the time of this release and we do not undertake to publicly update or revise them, whether as a result of new information, future events or otherwise, except as required by law. In addition, this presentation contains various operating data, including market share and market position, that are based on internal company data and management estimates. While management believes that our internal company research is reliable and the definitions of our markets which are used herein are appropriate, neither such research nor these definitions have been verified by an independent source and there are inherent challenges and limitations involved in compiling data across various geographies and from various sources, including those discussed under “Industry and Market Data” in Laureate’s filings with the SEC.
3©2026 Laureate Education, Inc. Presentation of Non-GAAP Measures In addition to the results provided in accordance with U.S. generally accepted accounting principles (GAAP) throughout this presentation, Laureate provides the non-GAAP measures of Adjusted EBITDA, Adjusted net income, Adjusted EPS, and total debt, net of cash and cash equivalents (or net debt). We have included the non-GAAP measures of Adjusted EBITDA and net debt because they are key measures used by our management and board of directors to understand and evaluate our core operating performance and trends, to prepare and approve our annual budget and to develop short- and long-term operational plans. We have included the non-GAAP measures of Adjusted net income and Adjusted EPS because management believes that these measures provide investors with better visibility into the Company’s underlying earnings as they exclude items that may not be indicative of our core operating results. Adjusted EBITDA consists of net income (loss), before (income) loss from discontinued operations, net of tax, equity in net (income) loss of affiliates, net of tax, income tax expense (benefit), (gain) loss on disposal of subsidiaries, net, foreign currency exchange (gain) loss, net, other (income) expense, net, interest expense, interest income, and loss on debt extinguishment, plus depreciation and amortization, share-based compensation expense, and loss on impairment of assets. The exclusion of certain expenses in calculating Adjusted EBITDA can provide a useful measure for period-to-period comparisons of our core business. Additionally, Adjusted EBITDA is a key input into the formula used by the compensation committee of our board of directors and our Chief Executive Officer in connection with the payment of incentive compensation to our executive officers and other members of our management team. Accordingly, we believe that Adjusted EBITDA provides useful information to investors and others in understanding and evaluating our operating results in the same manner as our management and board of directors. We define Adjusted net income as net income (loss), before (income) loss from discontinued operations, plus discrete tax items, loss on debt extinguishment, other non-operating income, loss (gain) on disposal of subsidiaries, net, foreign currency exchange (gain) loss, net, and loss on impairment of assets. We define Adjusted EPS as Adjusted net income divided by GAAP diluted weighted average shares outstanding. Adjusted net income and Adjusted EPS provide a useful indicator about Laureate’s earnings from core operations. Total debt, net of cash and cash equivalents (or net debt) consists of total gross debt, less total cash and cash equivalents. Net debt provides a useful indicator about Laureate’s leverage and liquidity. Free Cash Flow consists of operating cash flow minus capital expenditures (net of sales of PP&E). Free Cash Flow provides a useful indicator about Laureate’s ability to fund its operations and repay its debt. Adjusted EBITDA to Unlevered Free Cash Flow Conversion consists of Unlevered Free Cash Flow (which is defined as cash flows from operating activities, less capital expenditures (net of sales of PP&E), plus net cash interest expense) divided by Adjusted EBITDA. Adjusted EBITDA to Unlevered Free Cash Flow provides useful information to investors and others in understanding and evaluating our ability to generate cash flows. Laureate’s calculations of Adjusted EBITDA, Adjusted net income, Adjusted EPS, and total debt, net of cash and cash equivalents (or net debt) are not necessarily comparable to calculations performed by other companies and reported as similarly titled measures. These non-GAAP measures should be considered in addition to results prepared in accordance with GAAP but should not be considered a substitute for or superior to GAAP results. Adjusted EBITDA, Adjusted net income and Adjusted EPS are reconciled from their most directly comparable GAAP measures in the attached tables under “Non-GAAP Reconciliations.” We evaluate our results of operations on both an as reported and an constant currency basis. The constant currency presentation, which is a non-GAAP measure, excludes the impact of fluctuations in foreign currency exchange rates. We believe that providing constant currency information provides valuable supplemental information regarding our results of operations, consistent with how we evaluate our performance. We calculate constant currency amounts using the change from prior-period average foreign exchange rates to current-period average foreign exchange rates, as applied to local-currency operating results for the current period.

4©2026 Laureate Education, Inc. Summary Overview Note: Throughout this presentation amounts may not sum to totals due to rounding
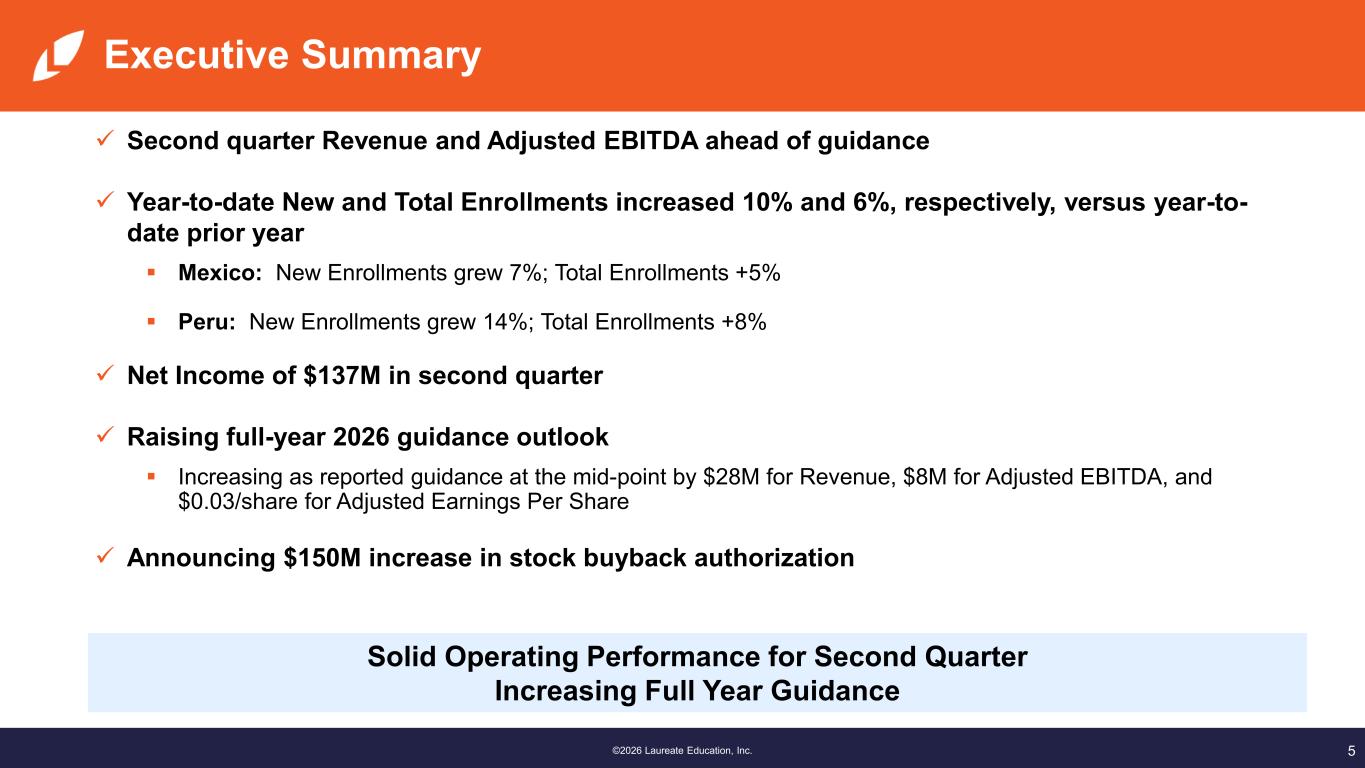
5©2024 Laureate Education, Inc.® | Confidential & Proprietary©2026 Laureate Education, I c. Executive Summary Second quarter Revenue and Adjusted EBITDA ahead of guidance Year-to-date New and Total Enrollments increased 10% and 6%, respectively, versus year-to- date prior year Mexico: New Enrollments grew 7%; Total Enrollments +5% Peru: New Enrollments grew 14%; Total Enrollments +8% Net Income of $137M in second quarter Raising full-year 2026 guidance outlook Increasing as reported guidance at the mid-point by $28M for Revenue, $8M for Adjusted EBITDA, and $0.03/share for Adjusted Earnings Per Share Announcing $150M increase in stock buyback authorization Solid Operating Performance for Second Quarter Increasing Full Year Guidance

6©2026 Laureate Education, Inc. Compelling Investment Characteristics
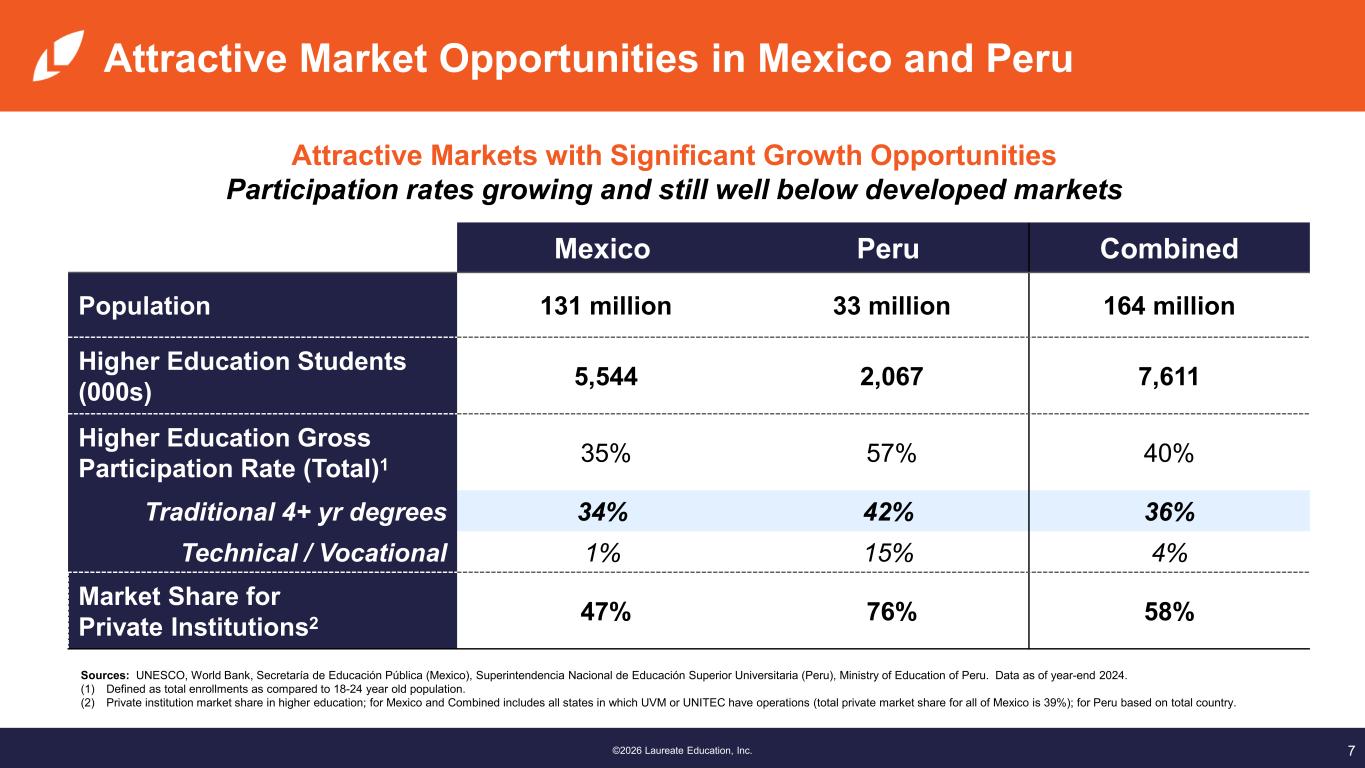
7©2024 Laureate Education, Inc.® | Confidential & Proprietary©2026 Laureate Education, I c. Mexico Peru Combined Population 131 million 33 million 164 million Higher Education Students (000s) 5,544 2,067 7,611 Higher Education Gross Participation Rate (Total)1 35% 57% 40% Traditional 4+ yr degrees 34% 42% 36% Technical / Vocational 1% 15% 4% Market Share for Private Institutions2 47% 76% 58% Sources: UNESCO, World Bank, Secretaría de Educación Pública (Mexico), Superintendencia Nacional de Educación Superior Universitaria (Peru), Ministry of Education of Peru. Data as of year-end 2024. (1) Defined as total enrollments as compared to 18-24 year old population. (2) Private institution market share in higher education; for Mexico and Combined includes all states in which UVM or UNITEC have operations (total private market share for all of Mexico is 39%); for Peru based on total country. Attractive Markets with Significant Growth Opportunities Participation rates growing and still well below developed markets Attractive Market Opportunities in Mexico and Peru
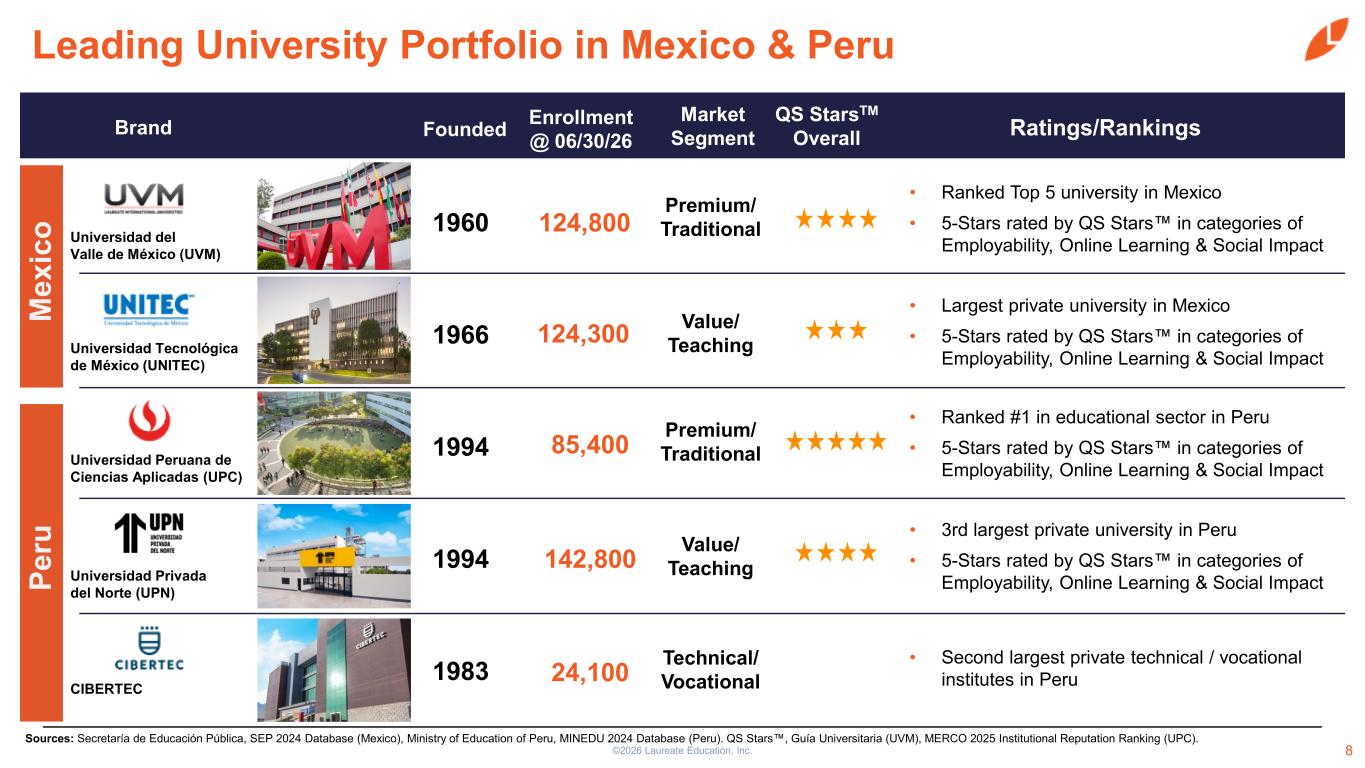
©2026 Laureate Education, Inc. 8 Leading University Portfolio in Mexico & Peru Sources: Secretaría de Educación Pública, SEP 2024 Database (Mexico), Ministry of Education of Peru, MINEDU 2024 Database (Peru). QS Stars , Guía Universitaria (UVM), MERCO 2025 Institutional Reputation Ranking (UPC). 1960 Brand Founded Market Segment Ratings/RankingsQS StarsTM Overall Universidad del Valle de México (UVM) Premium/ Traditional Enrollment @ 06/30/26 124,800 1966Universidad Tecnológica de México (UNITEC) Value/ Teaching124,300 1994 Premium/ Traditional85,400 1994 Value/ Teaching142,800 1983 Technical/ Vocational24,100 Universidad Peruana de Ciencias Aplicadas (UPC) Universidad Privada del Norte (UPN) CIBERTEC M ex ic o Pe ru • Ranked Top 5 university in Mexico • 5-Stars rated by QS Stars in categories of Employability, Online Learning & Social Impact • Largest private university in Mexico • 5-Stars rated by QS Stars in categories of Employability, Online Learning & Social Impact • Ranked #1 in educational sector in Peru • 5-Stars rated by QS Stars in categories of Employability, Online Learning & Social Impact • 3rd largest private university in Peru • 5-Stars rated by QS Stars in categories of Employability, Online Learning & Social Impact • Second largest private technical / vocational institutes in Peru
9©2026 Laureate Education, Inc. Q2 & YTD 2026 Performance Results
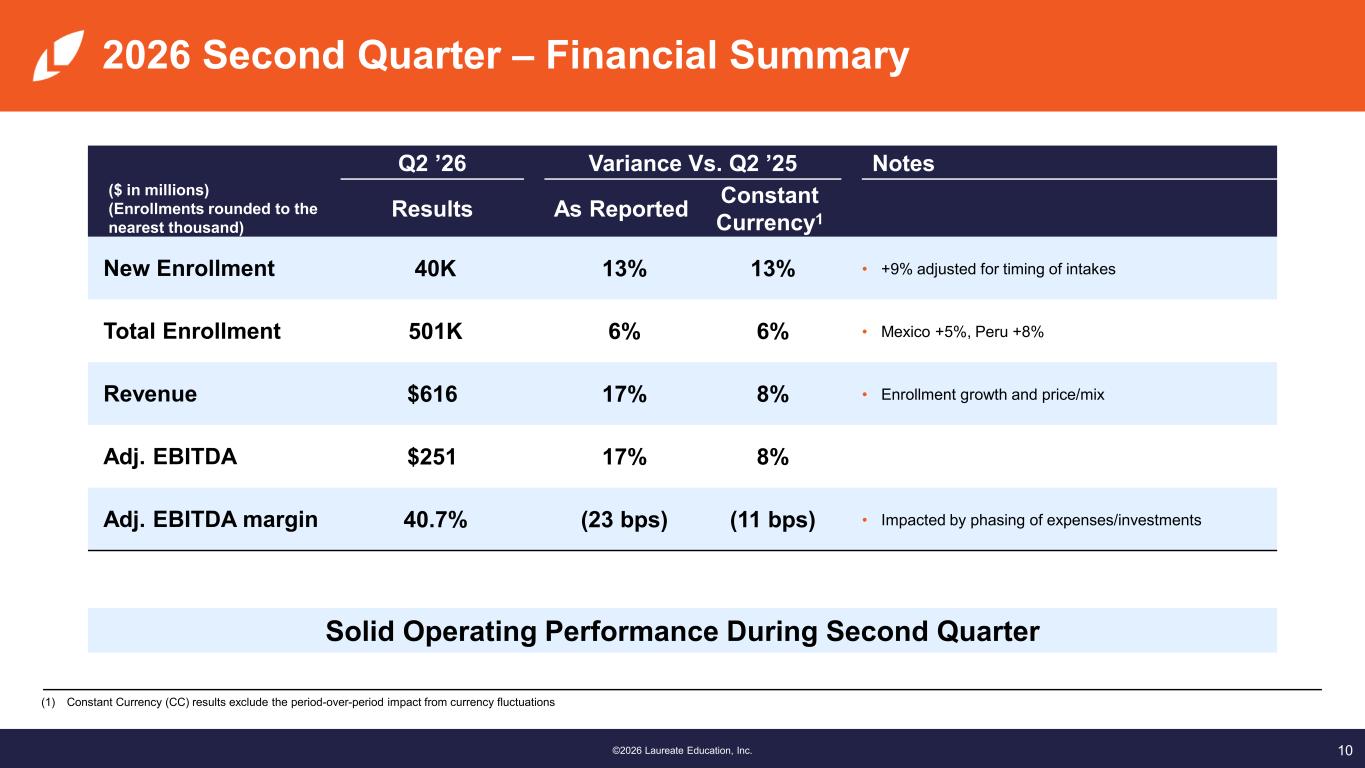
10©2026 Laureate Education, Inc. 2026 Second Quarter – Financial Summary Q2 ’26 Variance Vs. Q2 ’25 Notes ($ in millions) (Enrollments rounded to the nearest thousand) Results As Reported Constant Currency1 New Enrollment 40K 13% 13% • +9% adjusted for timing of intakes Total Enrollment 501K 6% 6% • Mexico +5%, Peru +8% Revenue $616 17% 8% • Enrollment growth and price/mix Adj. EBITDA $251 17% 8% Adj. EBITDA margin 40.7% (23 bps) (11 bps) • Impacted by phasing of expenses/investments Solid Operating Performance During Second Quarter (1) Constant Currency (CC) results exclude the period-over-period impact from currency fluctuations
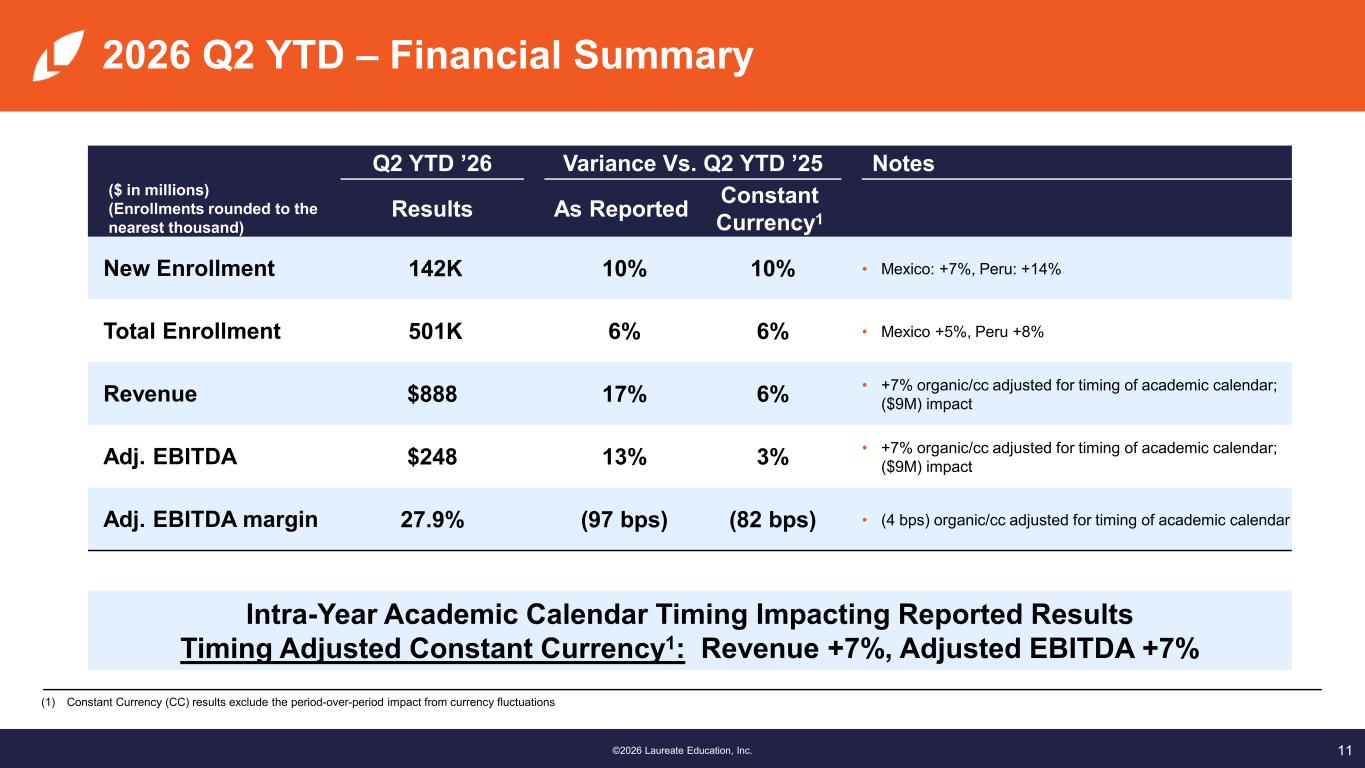
11©2026 Laureate Education, Inc. 2026 Q2 YTD – Financial Summary Q2 YTD ’26 Variance Vs. Q2 YTD ’25 Notes ($ in millions) (Enrollments rounded to the nearest thousand) Results As Reported Constant Currency1 New Enrollment 142K 10% 10% • Mexico: +7%, Peru: +14% Total Enrollment 501K 6% 6% • Mexico +5%, Peru +8% Revenue $888 17% 6% • +7% organic/cc adjusted for timing of academic calendar; ($9M) impact Adj. EBITDA $248 13% 3% • +7% organic/cc adjusted for timing of academic calendar; ($9M) impact Adj. EBITDA margin 27.9% (97 bps) (82 bps) • (4 bps) organic/cc adjusted for timing of academic calendar Intra-Year Academic Calendar Timing Impacting Reported Results Timing Adjusted Constant Currency1: Revenue +7%, Adjusted EBITDA +7% (1) Constant Currency (CC) results exclude the period-over-period impact from currency fluctuations

12©2026 Laureate Education, Inc. Segment Results
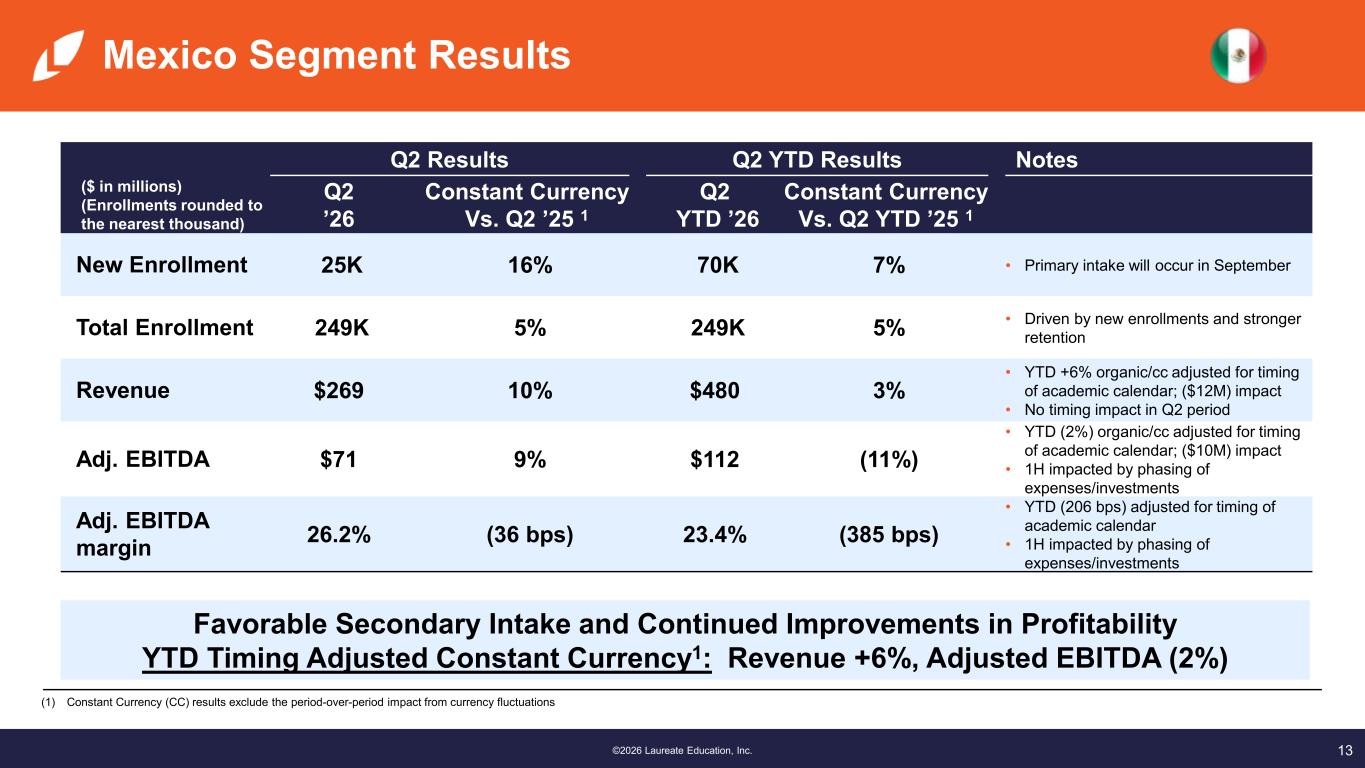
13©2026 Laureate Education, Inc. Mexico Segment Results Q2 Results Q2 YTD Results Notes ($ in millions) (Enrollments rounded to the nearest thousand) Q2 ’26 Constant Currency Vs. Q2 ’25 1 Q2 YTD ’26 Constant Currency Vs. Q2 YTD ’25 1 New Enrollment 25K 16% 70K 7% • Primary intake will occur in September Total Enrollment 249K 5% 249K 5% • Driven by new enrollments and stronger retention Revenue $269 10% $480 3% • YTD +6% organic/cc adjusted for timing of academic calendar; ($12M) impact • No timing impact in Q2 period Adj. EBITDA $71 9% $112 (11%) • YTD (2%) organic/cc adjusted for timing of academic calendar; ($10M) impact • 1H impacted by phasing of expenses/investments Adj. EBITDA margin 26.2% (36 bps) 23.4% (385 bps) • YTD (206 bps) adjusted for timing of academic calendar • 1H impacted by phasing of expenses/investments Favorable Secondary Intake and Continued Improvements in Profitability YTD Timing Adjusted Constant Currency1: Revenue +6%, Adjusted EBITDA (2%) (1) Constant Currency (CC) results exclude the period-over-period impact from currency fluctuations
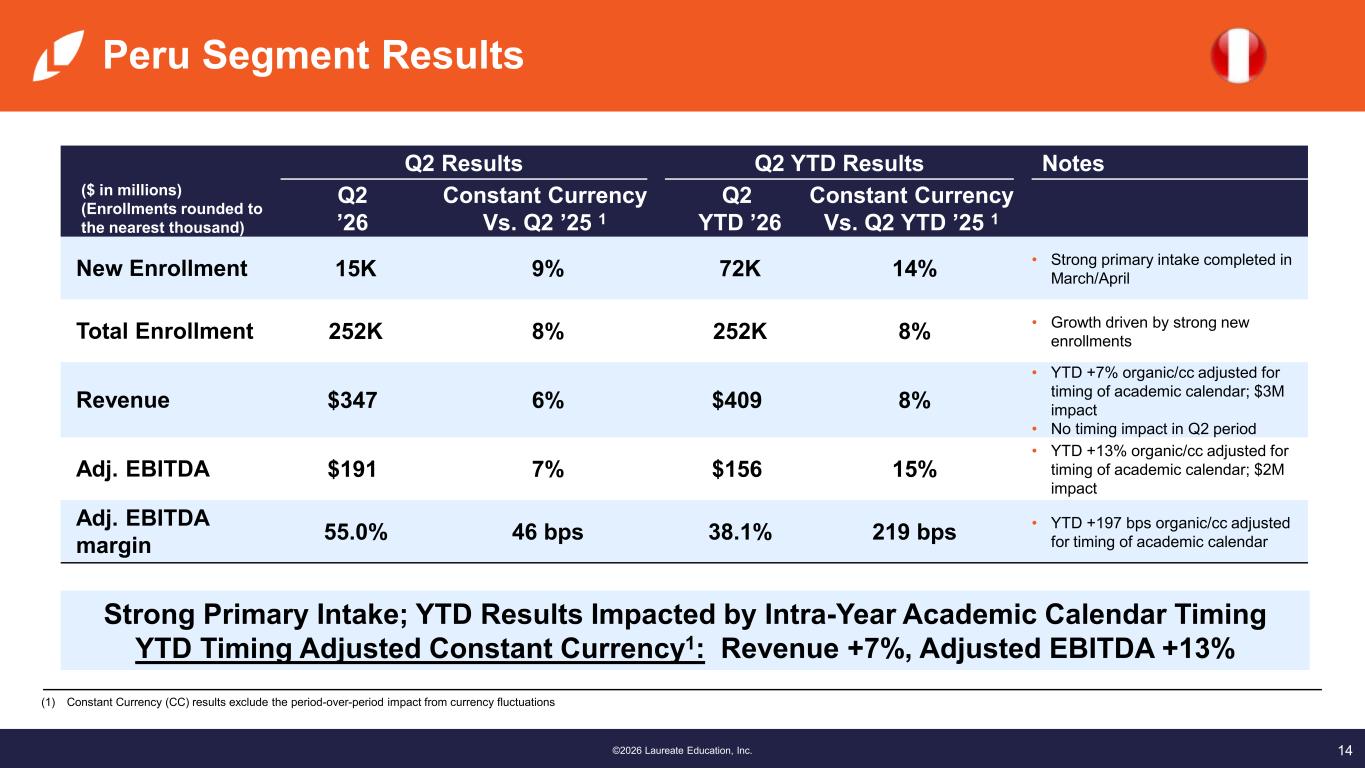
14©2026 Laureate Education, Inc. Peru Segment Results Q2 Results Q2 YTD Results Notes ($ in millions) (Enrollments rounded to the nearest thousand) Q2 ’26 Constant Currency Vs. Q2 ’25 1 Q2 YTD ’26 Constant Currency Vs. Q2 YTD ’25 1 New Enrollment 15K 9% 72K 14% • Strong primary intake completed in March/April Total Enrollment 252K 8% 252K 8% • Growth driven by strong new enrollments Revenue $347 6% $409 8% • YTD +7% organic/cc adjusted for timing of academic calendar; $3M impact • No timing impact in Q2 period Adj. EBITDA $191 7% $156 15% • YTD +13% organic/cc adjusted for timing of academic calendar; $2M impact Adj. EBITDA margin 55.0% 46 bps 38.1% 219 bps • YTD +197 bps organic/cc adjusted for timing of academic calendar Strong Primary Intake; YTD Results Impacted by Intra-Year Academic Calendar Timing YTD Timing Adjusted Constant Currency1: Revenue +7%, Adjusted EBITDA +13% (1) Constant Currency (CC) results exclude the period-over-period impact from currency fluctuations

15©2026 Laureate Education, Inc. Capitalization and Share Count
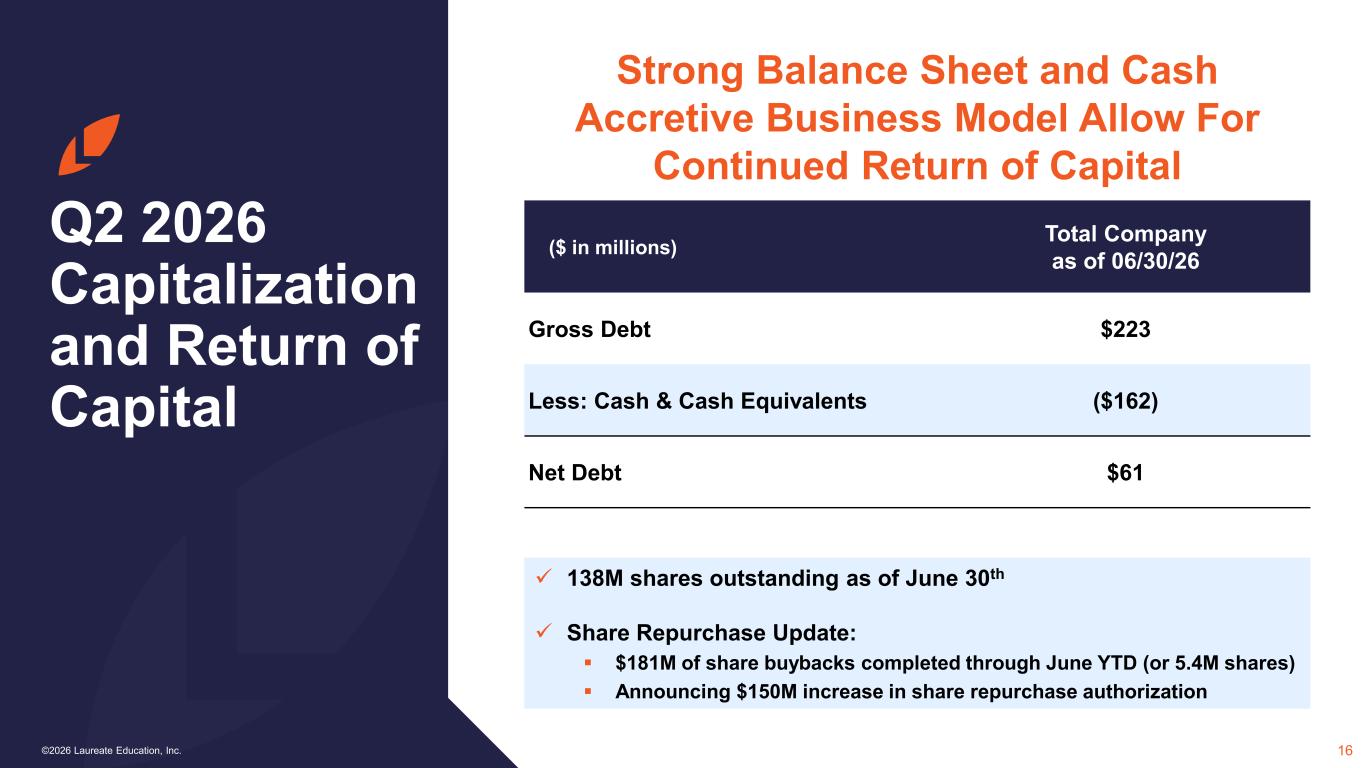
16©2026 Laureate Education, Inc. Q2 2026 Capitalization and Return of Capital Strong Balance Sheet and Cash Accretive Business Model Allow For Continued Return of Capital ($ in millions) Total Company as of 06/30/26 Gross Debt $223 Less: Cash & Cash Equivalents ($162) Net Debt $61 138M shares outstanding as of June 30th Share Repurchase Update: $181M of share buybacks completed through June YTD (or 5.4M shares) Announcing $150M increase in share repurchase authorization

17©2026 Laureate Education, Inc. Outlook
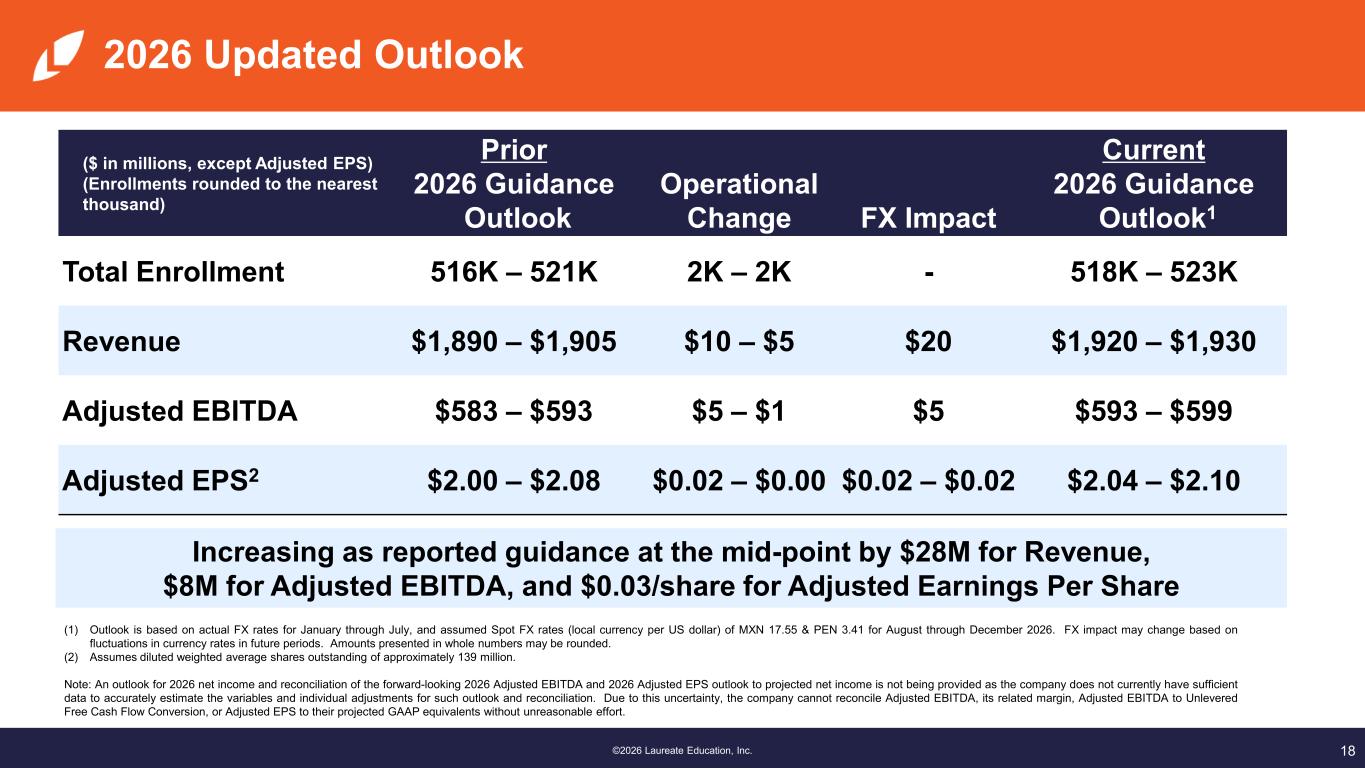
18©2024 Laureate Education, Inc.® | Confidential & Proprietary©2026 Laureate Education, I c. 2026 Updated Outlook Increasing as reported guidance at the mid-point by $28M for Revenue, $8M for Adjusted EBITDA, and $0.03/share for Adjusted Earnings Per Share ($ in millions, except Adjusted EPS) (Enrollments rounded to the nearest thousand) Prior 2026 Guidance Outlook Operational Change FX Impact Current 2026 Guidance Outlook1 Total Enrollment 516K – 521K 2K – 2K - 518K – 523K Revenue $1,890 – $1,905 $10 – $5 $20 $1,920 – $1,930 Adjusted EBITDA $583 – $593 $5 – $1 $5 $593 – $599 Adjusted EPS2 $2.00 – $2.08 $0.02 – $0.00 $0.02 – $0.02 $2.04 – $2.10 (1) Outlook is based on actual FX rates for January through July, and assumed Spot FX rates (local currency per US dollar) of MXN 17.55 & PEN 3.41 for August through December 2026. FX impact may change based on fluctuations in currency rates in future periods. Amounts presented in whole numbers may be rounded. (2) Assumes diluted weighted average shares outstanding of approximately 139 million. Note: An outlook for 2026 net income and reconciliation of the forward-looking 2026 Adjusted EBITDA and 2026 Adjusted EPS outlook to projected net income is not being provided as the company does not currently have sufficient data to accurately estimate the variables and individual adjustments for such outlook and reconciliation. Due to this uncertainty, the company cannot reconcile Adjusted EBITDA, its related margin, Adjusted EBITDA to Unlevered Free Cash Flow Conversion, or Adjusted EPS to their projected GAAP equivalents without unreasonable effort.
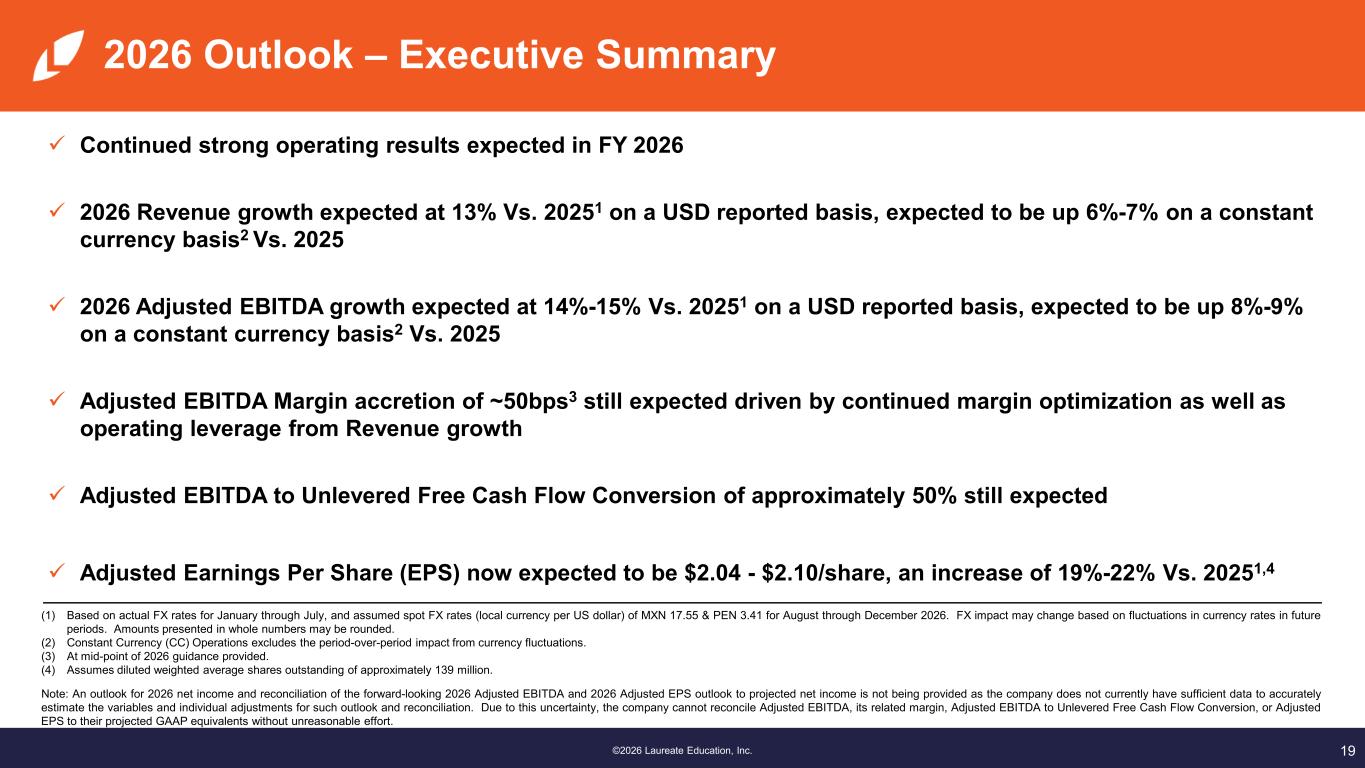
19©2024 Laureate Education, Inc.® | Confidential & Proprietary©2026 Laureate Education, I c. 2026 Outlook – Executive Summary Continued strong operating results expected in FY 2026 2026 Revenue growth expected at 13% Vs. 20251 on a USD reported basis, expected to be up 6%-7% on a constant currency basis2 Vs. 2025 2026 Adjusted EBITDA growth expected at 14%-15% Vs. 20251 on a USD reported basis, expected to be up 8%-9% on a constant currency basis2 Vs. 2025 Adjusted EBITDA Margin accretion of ~50bps3 still expected driven by continued margin optimization as well as operating leverage from Revenue growth Adjusted EBITDA to Unlevered Free Cash Flow Conversion of approximately 50% still expected Adjusted Earnings Per Share (EPS) now expected to be $2.04 - $2.10/share, an increase of 19%-22% Vs. 20251,4 (1) Based on actual FX rates for January through July, and assumed spot FX rates (local currency per US dollar) of MXN 17.55 & PEN 3.41 for August through December 2026. FX impact may change based on fluctuations in currency rates in future periods. Amounts presented in whole numbers may be rounded. (2) Constant Currency (CC) Operations excludes the period-over-period impact from currency fluctuations. (3) At mid-point of 2026 guidance provided. (4) Assumes diluted weighted average shares outstanding of approximately 139 million. Note: An outlook for 2026 net income and reconciliation of the forward-looking 2026 Adjusted EBITDA and 2026 Adjusted EPS outlook to projected net income is not being provided as the company does not currently have sufficient data to accurately estimate the variables and individual adjustments for such outlook and reconciliation. Due to this uncertainty, the company cannot reconcile Adjusted EBITDA, its related margin, Adjusted EBITDA to Unlevered Free Cash Flow Conversion, or Adjusted EPS to their projected GAAP equivalents without unreasonable effort.
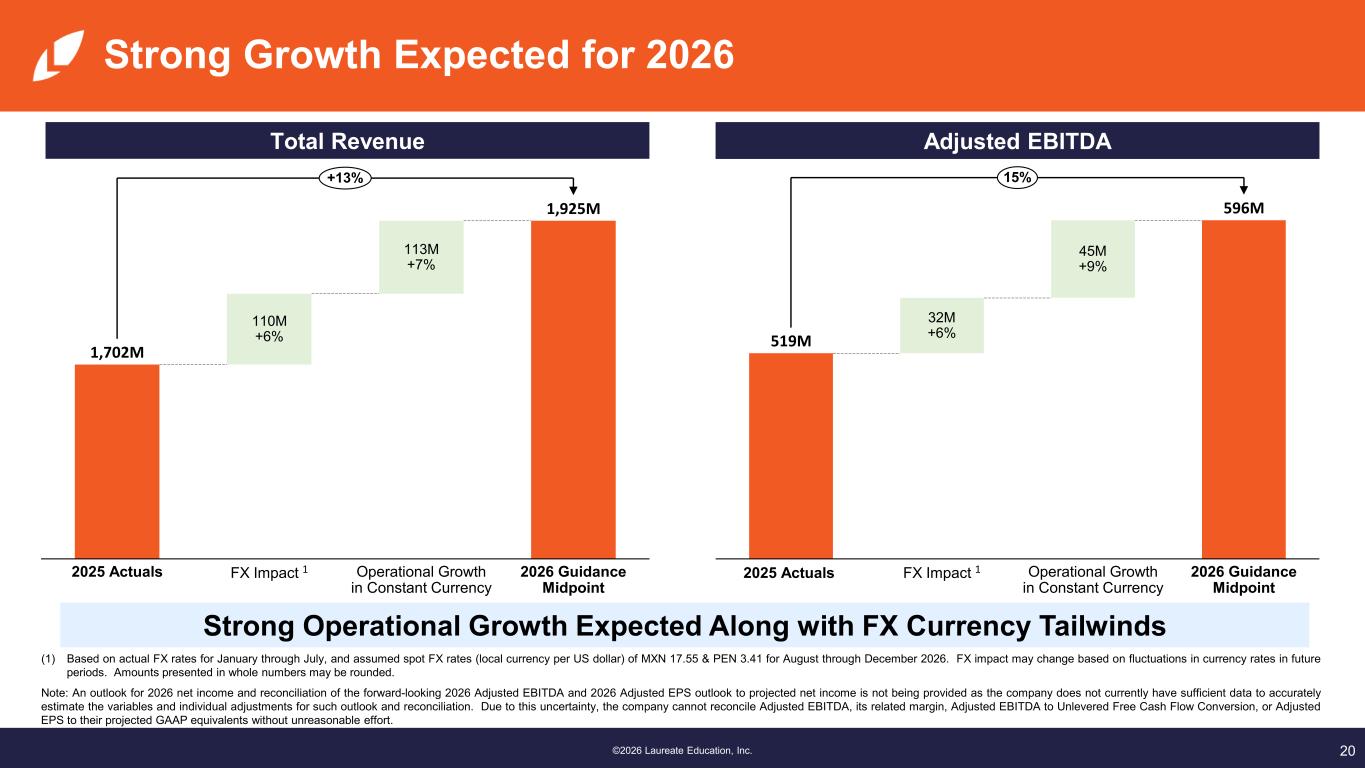
20©2024 Laureate Education, Inc.® | Confidential & Proprietary©2026 Laureate Education, I c. Strong Growth Expected for 2026 Total Revenue Adjusted EBITDA Strong Operational Growth Expected Along with FX Currency Tailwinds (1) Based on actual FX rates for January through July, and assumed spot FX rates (local currency per US dollar) of MXN 17.55 & PEN 3.41 for August through December 2026. FX impact may change based on fluctuations in currency rates in future periods. Amounts presented in whole numbers may be rounded. Note: An outlook for 2026 net income and reconciliation of the forward-looking 2026 Adjusted EBITDA and 2026 Adjusted EPS outlook to projected net income is not being provided as the company does not currently have sufficient data to accurately estimate the variables and individual adjustments for such outlook and reconciliation. Due to this uncertainty, the company cannot reconcile Adjusted EBITDA, its related margin, Adjusted EBITDA to Unlevered Free Cash Flow Conversion, or Adjusted EPS to their projected GAAP equivalents without unreasonable effort. 1,702M 1,925M 2025 Actuals 110M +6% FX Impact 1 113M +7% Operational Growth in Constant Currency 2026 Guidance Midpoint +13% 519M 596M 2025 Actuals 32M +6% FX Impact 1 45M +9% Operational Growth in Constant Currency 2026 Guidance Midpoint 15%
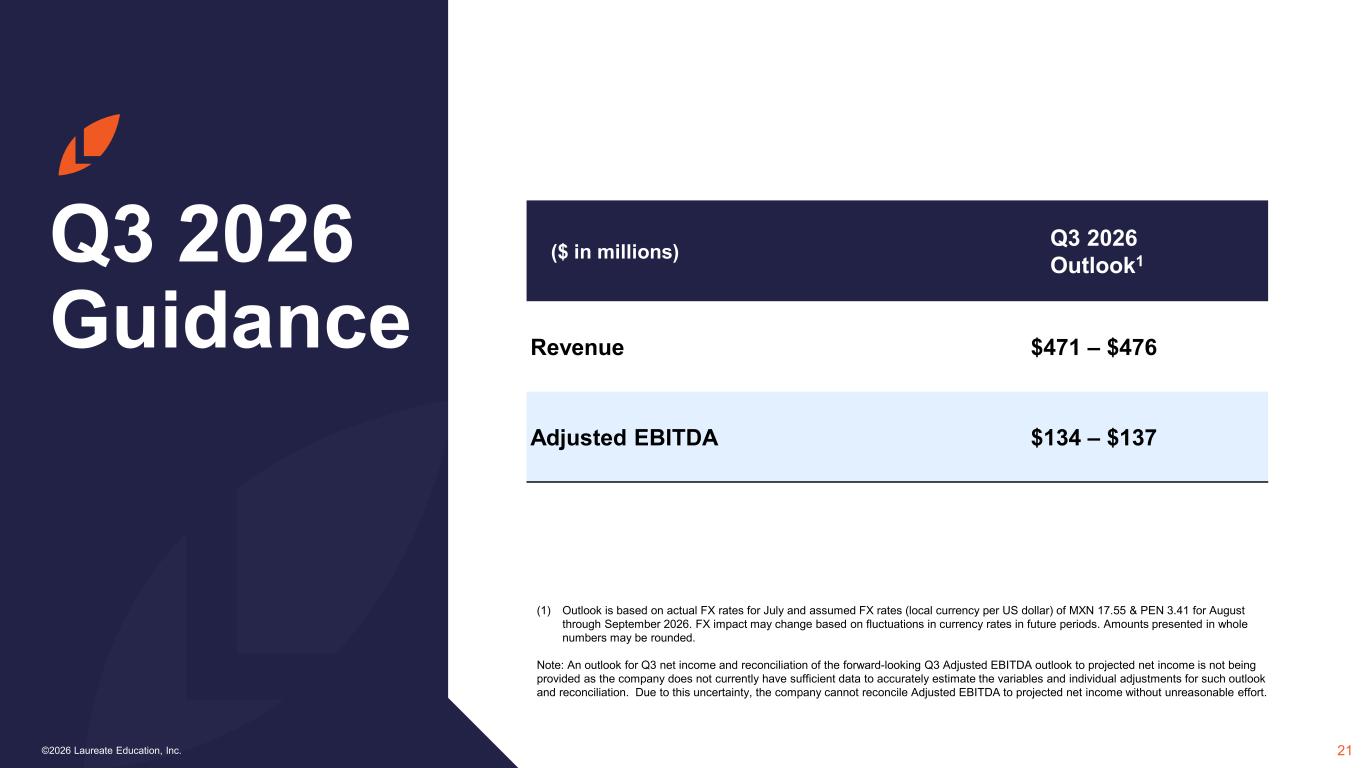
21©2026 Laureate Education, Inc. Q3 2026 Guidance ($ in millions) Q3 2026 Outlook1 Revenue $471 – $476 Adjusted EBITDA $134 – $137 (1) Outlook is based on actual FX rates for July and assumed FX rates (local currency per US dollar) of MXN 17.55 & PEN 3.41 for August through September 2026. FX impact may change based on fluctuations in currency rates in future periods. Amounts presented in whole numbers may be rounded. Note: An outlook for Q3 net income and reconciliation of the forward-looking Q3 Adjusted EBITDA outlook to projected net income is not being provided as the company does not currently have sufficient data to accurately estimate the variables and individual adjustments for such outlook and reconciliation. Due to this uncertainty, the company cannot reconcile Adjusted EBITDA to projected net income without unreasonable effort.
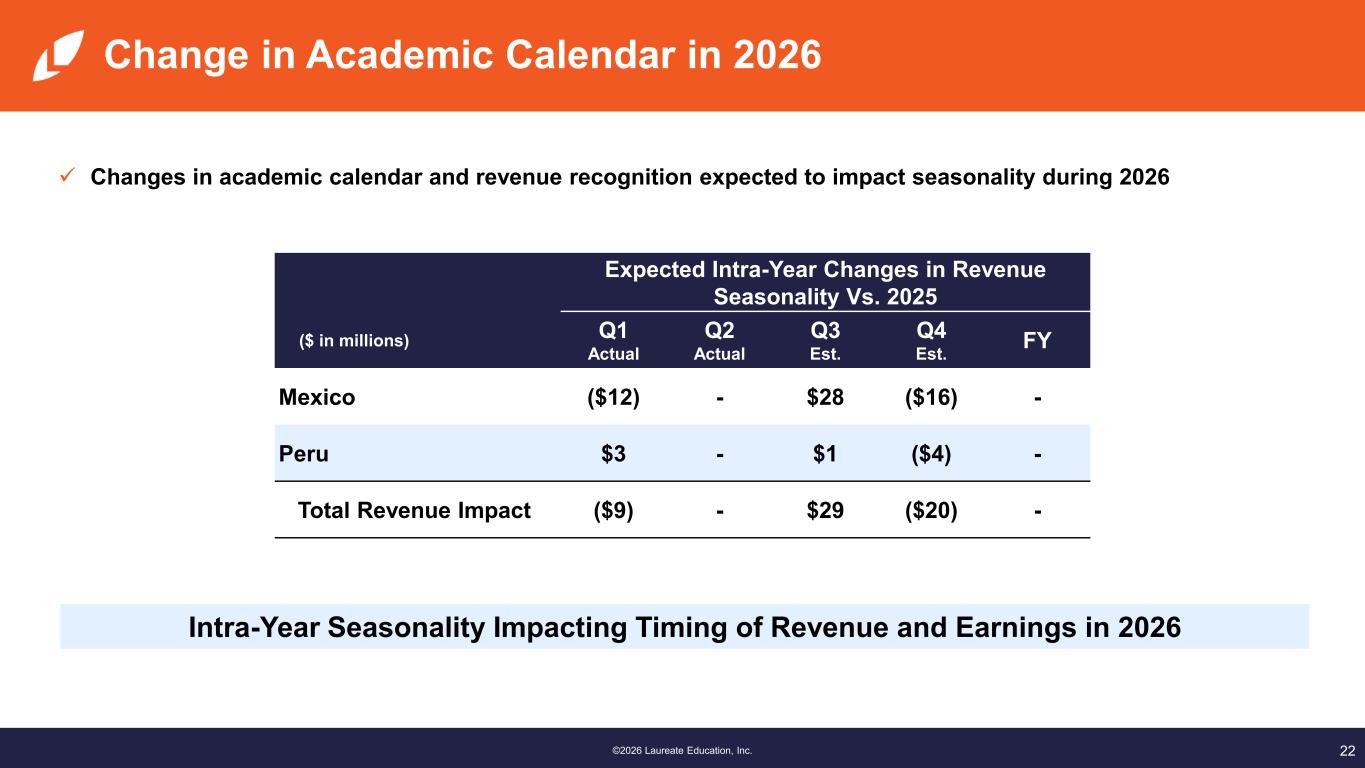
22©2024 Laureate Education, Inc.® | Confidential & Proprietary©2026 Laureate Education, I c. Change in Academic Calendar in 2026 Expected Intra-Year Changes in Revenue Seasonality Vs. 2025 ($ in millions) Q1 Actual Q2 Actual Q3 Est. Q4 Est. FY Mexico ($12) - $28 ($16) - Peru $3 - $1 ($4) - Total Revenue Impact ($9) - $29 ($20) - Changes in academic calendar and revenue recognition expected to impact seasonality during 2026 Intra-Year Seasonality Impacting Timing of Revenue and Earnings in 2026
23©2026 Laureate Education, Inc. Appendix
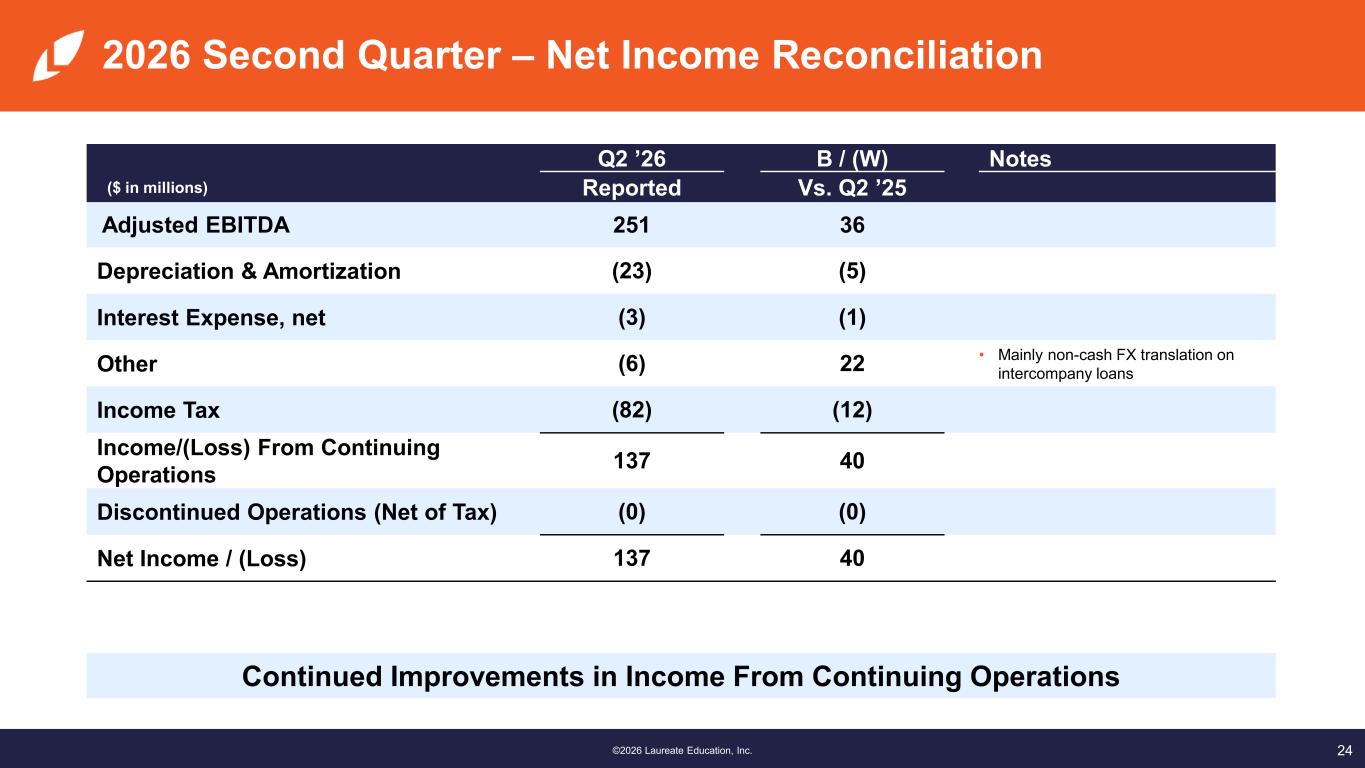
24©2026 Laureate Education, Inc. 2026 Second Quarter – Net Income Reconciliation Q2 ’26 B / (W) Notes ($ in millions) Reported Vs. Q2 ’25 Adjusted EBITDA 251 36 Depreciation & Amortization (23) (5) Interest Expense, net (3) (1) Other (6) 22 • Mainly non-cash FX translation on intercompany loans Income Tax (82) (12) Income/(Loss) From Continuing Operations 137 40 Discontinued Operations (Net of Tax) (0) (0) Net Income / (Loss) 137 40 Continued Improvements in Income From Continuing Operations
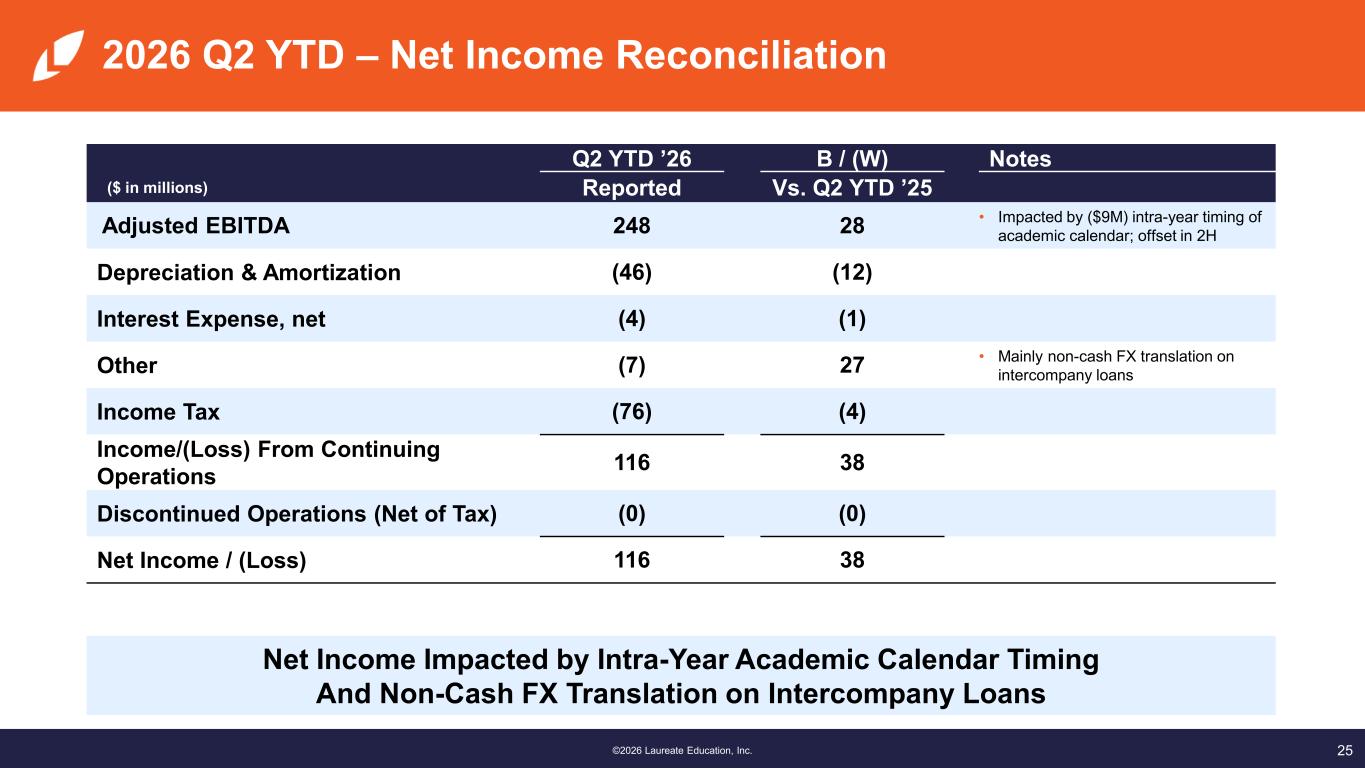
25©2026 Laureate Education, Inc. 2026 Q2 YTD – Net Income Reconciliation Q2 YTD ’26 B / (W) Notes ($ in millions) Reported Vs. Q2 YTD ’25 Adjusted EBITDA 248 28 • Impacted by ($9M) intra-year timing of academic calendar; offset in 2H Depreciation & Amortization (46) (12) Interest Expense, net (4) (1) Other (7) 27 • Mainly non-cash FX translation on intercompany loans Income Tax (76) (4) Income/(Loss) From Continuing Operations 116 38 Discontinued Operations (Net of Tax) (0) (0) Net Income / (Loss) 116 38 Net Income Impacted by Intra-Year Academic Calendar Timing And Non-Cash FX Translation on Intercompany Loans
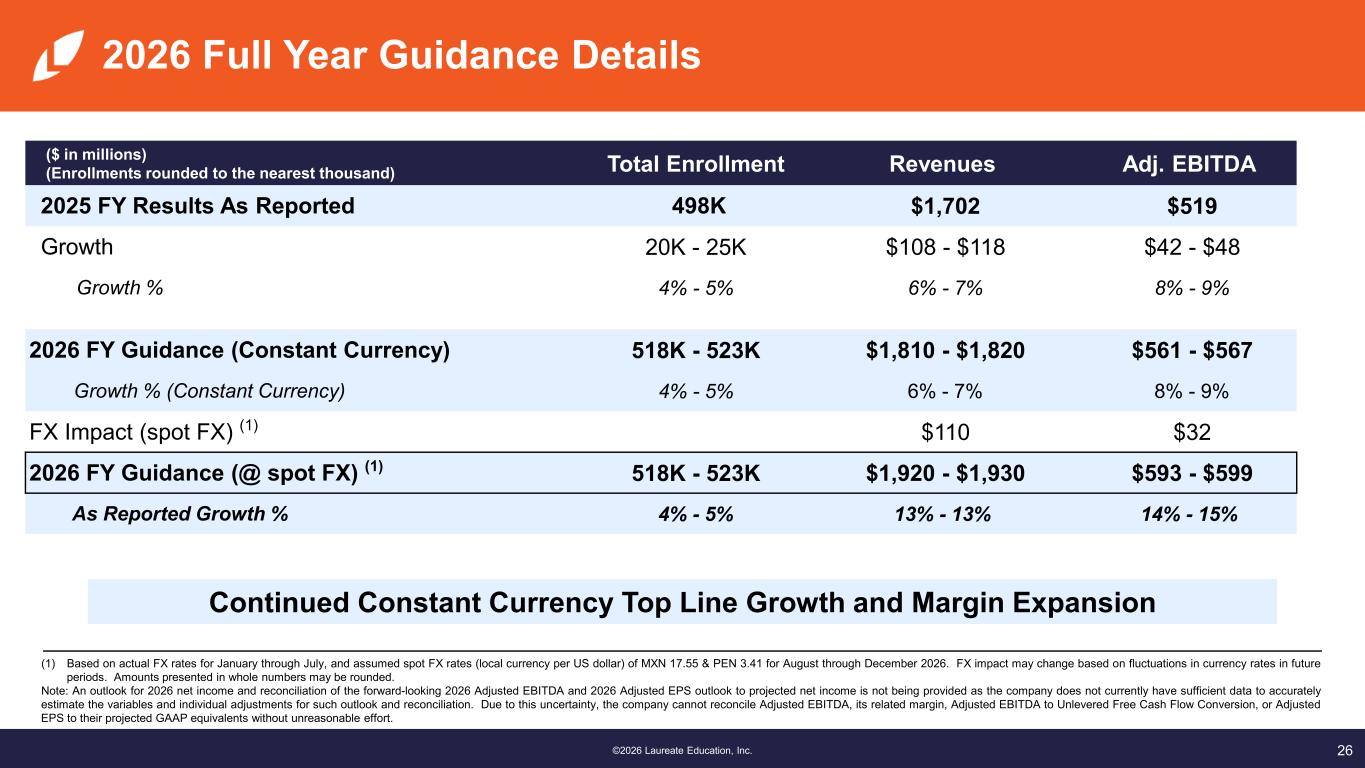
26©2026 Laureate Education, Inc. 2026 Full Year Guidance Details ($ in millions) (Enrollments rounded to the nearest thousand) Total Enrollment Revenues Adj. EBITDA 2025 FY Results As Reported 498K $1,702 $519 Growth 20K - 25K $108 - $118 $42 - $48 Growth % 4% - 5% 6% - 7% 8% - 9% 2026 FY Guidance (Constant Currency) 518K - 523K $1,810 - $1,820 $561 - $567 Growth % (Constant Currency) 4% - 5% 6% - 7% 8% - 9% FX Impact (spot FX) (1) $110 $32 2026 FY Guidance (@ spot FX) (1) 518K - 523K $1,920 - $1,930 $593 - $599 As Reported Growth % 4% - 5% 13% - 13% 14% - 15% Continued Constant Currency Top Line Growth and Margin Expansion (1) Based on actual FX rates for January through July, and assumed spot FX rates (local currency per US dollar) of MXN 17.55 & PEN 3.41 for August through December 2026. FX impact may change based on fluctuations in currency rates in future periods. Amounts presented in whole numbers may be rounded. Note: An outlook for 2026 net income and reconciliation of the forward-looking 2026 Adjusted EBITDA and 2026 Adjusted EPS outlook to projected net income is not being provided as the company does not currently have sufficient data to accurately estimate the variables and individual adjustments for such outlook and reconciliation. Due to this uncertainty, the company cannot reconcile Adjusted EBITDA, its related margin, Adjusted EBITDA to Unlevered Free Cash Flow Conversion, or Adjusted EPS to their projected GAAP equivalents without unreasonable effort.
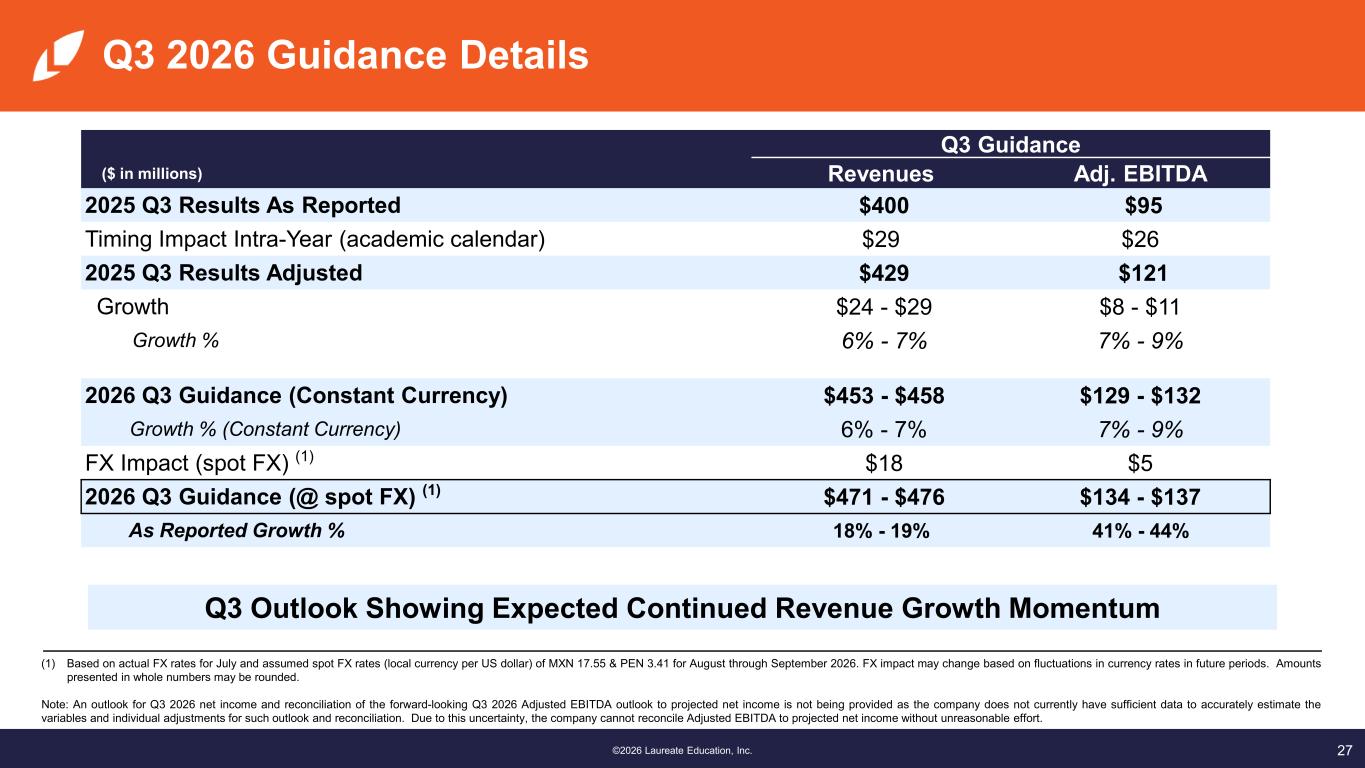
27©2026 Laureate Education, Inc. Q3 2026 Guidance Details Q3 Outlook Showing Expected Continued Revenue Growth Momentum Q3 Guidance ($ in millions) Revenues Adj. EBITDA 2025 Q3 Results As Reported $400 $95 Timing Impact Intra-Year (academic calendar) $29 $26 2025 Q3 Results Adjusted $429 $121 Growth $24 - $29 $8 - $11 Growth % 6% - 7% 7% - 9% 2026 Q3 Guidance (Constant Currency) $453 - $458 $129 - $132 Growth % (Constant Currency) 6% - 7% 7% - 9% FX Impact (spot FX) (1) $18 $5 2026 Q3 Guidance (@ spot FX) (1) $471 - $476 $134 - $137 As Reported Growth % 18% - 19% 41% - 44% (1) Based on actual FX rates for July and assumed spot FX rates (local currency per US dollar) of MXN 17.55 & PEN 3.41 for August through September 2026. FX impact may change based on fluctuations in currency rates in future periods. Amounts presented in whole numbers may be rounded. Note: An outlook for Q3 2026 net income and reconciliation of the forward-looking Q3 2026 Adjusted EBITDA outlook to projected net income is not being provided as the company does not currently have sufficient data to accurately estimate the variables and individual adjustments for such outlook and reconciliation. Due to this uncertainty, the company cannot reconcile Adjusted EBITDA to projected net income without unreasonable effort.
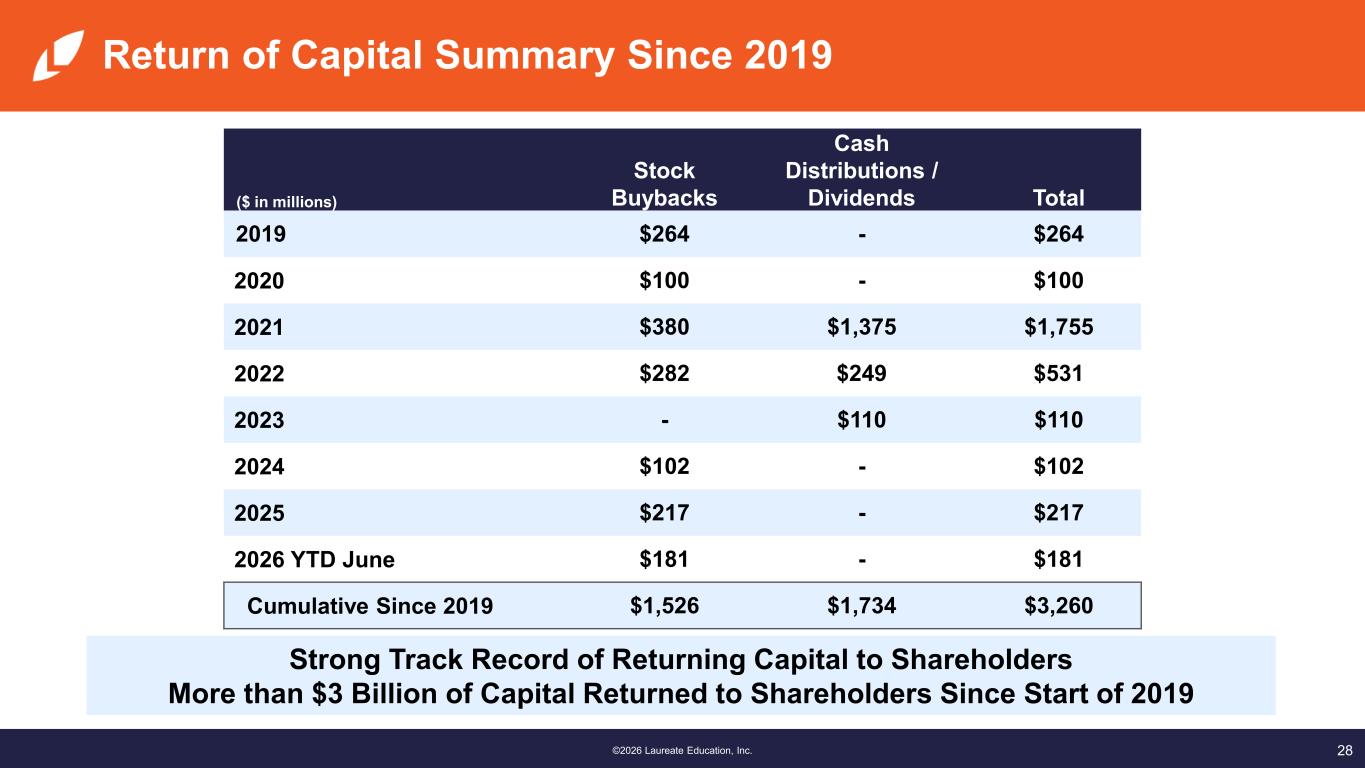
28©2026 Laureate Education, Inc. Return of Capital Summary Since 2019 ($ in millions) Stock Buybacks Cash Distributions / Dividends Total 2019 $264 - $264 2020 $100 - $100 2021 $380 $1,375 $1,755 2022 $282 $249 $531 2023 - $110 $110 2024 $102 - $102 2025 $217 - $217 2026 YTD June $181 - $181 Cumulative Since 2019 $1,526 $1,734 $3,260 Strong Track Record of Returning Capital to Shareholders More than $3 Billion of Capital Returned to Shareholders Since Start of 2019
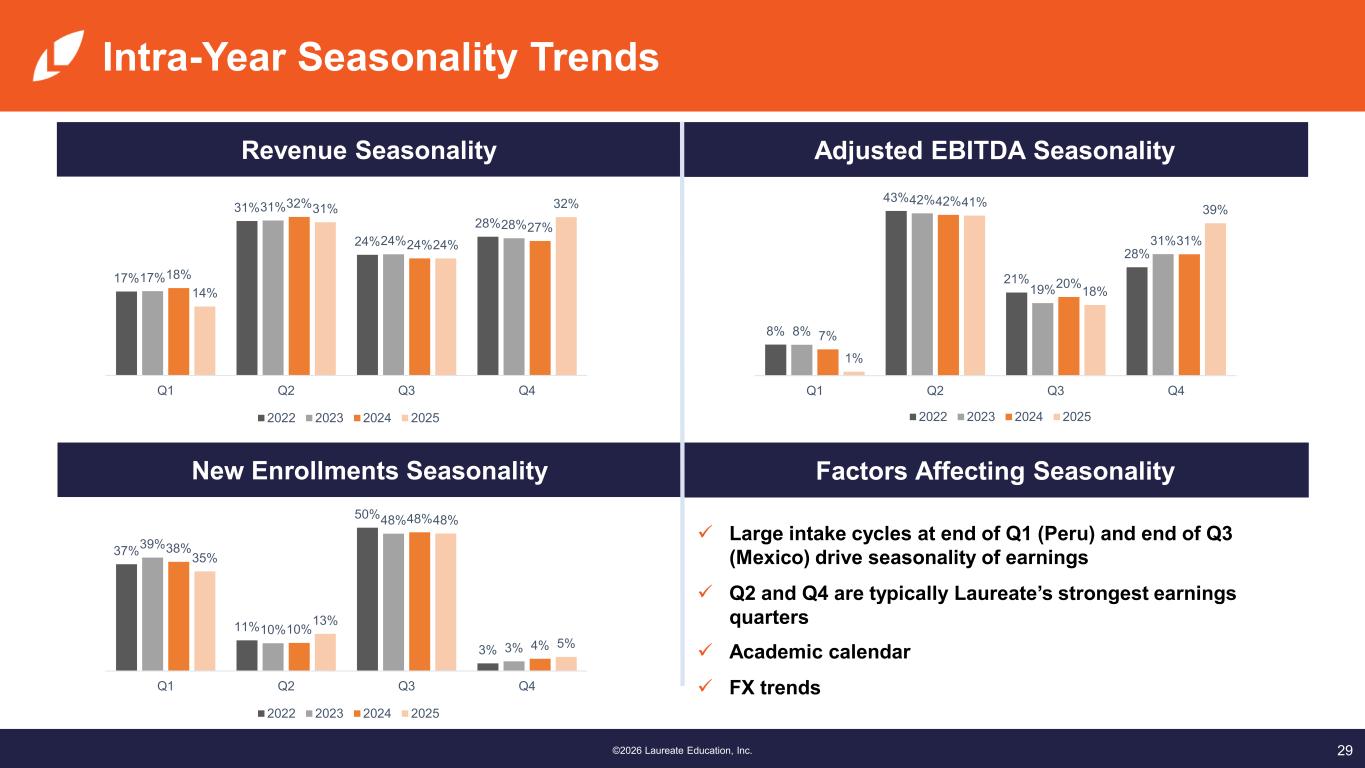
29©2026 Laureate Education, Inc. New Enrollments Seasonality Intra-Year Seasonality Trends Revenue Seasonality Adjusted EBITDA Seasonality Factors Affecting Seasonality Large intake cycles at end of Q1 (Peru) and end of Q3 (Mexico) drive seasonality of earnings Q2 and Q4 are typically Laureate’s strongest earnings quarters Academic calendar FX trends 37% 11% 50% 3% 39% 10% 48% 3% 38% 10% 48% 4% 35% 13% 48% 5% Q1 Q2 Q3 Q4 2022 2023 2024 2025 8% 43% 21% 28% 8% 42% 19% 31% 7% 42% 20% 31% 1% 41% 18% 39% Q1 Q2 Q3 Q4 2022 2023 2024 2025 17% 31% 24% 28% 17% 31% 24% 28% 18% 32% 24% 27% 14% 31% 24% 32% Q1 Q2 Q3 Q4 2022 2023 2024 2025

30©2026 Laureate Education, Inc. Financial Results & Tables
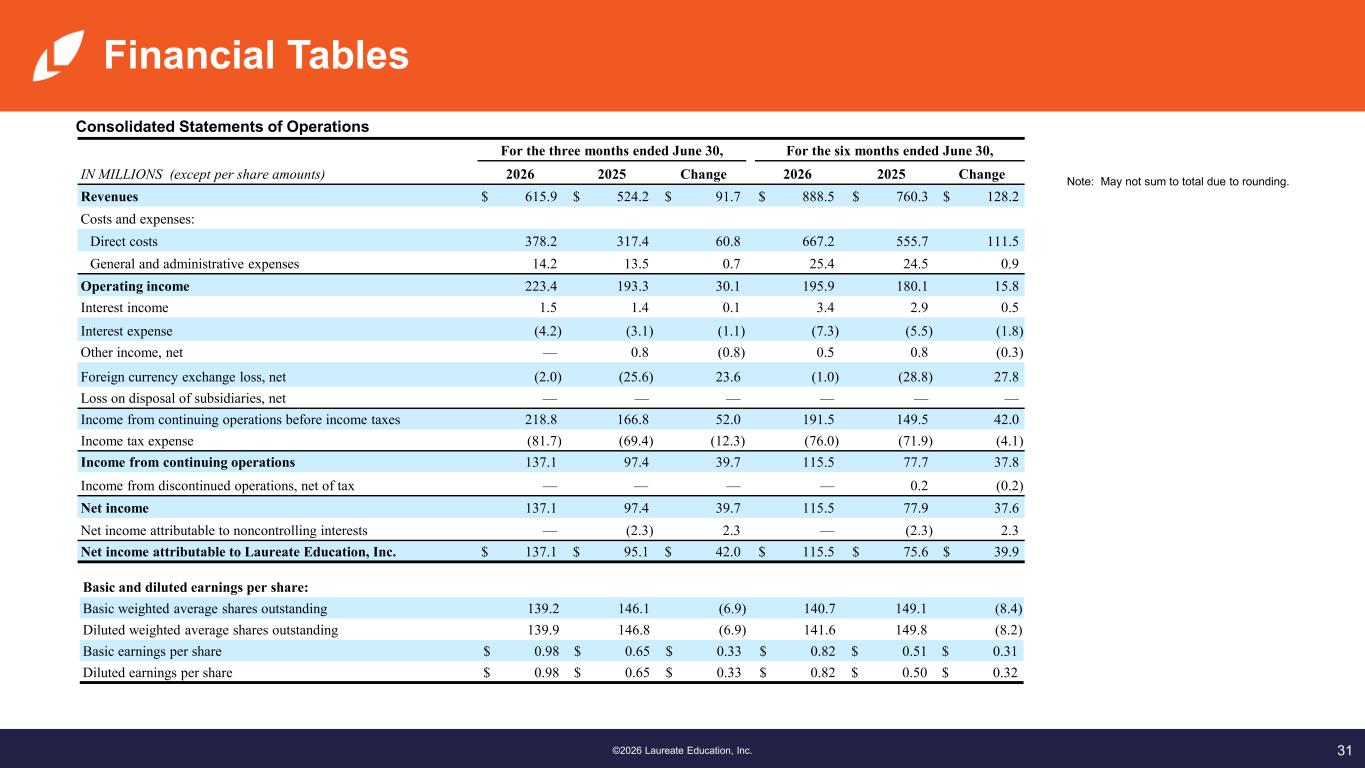
31©2026 Laureate Education, Inc. Financial Tables Consolidated Statements of Operations Note: May not sum to total due to rounding. For the three months ended June 30, For the six months ended June 30, IN MILLIONS (except per share amounts) 2026 2025 Change 2026 2025 Change Revenues $ 615.9 $ 524.2 $ 91.7 $ 888.5 $ 760.3 $ 128.2 Costs and expenses: Direct costs 378.2 317.4 60.8 667.2 555.7 111.5 General and administrative expenses 14.2 13.5 0.7 25.4 24.5 0.9 Operating income 223.4 193.3 30.1 195.9 180.1 15.8 Interest income 1.5 1.4 0.1 3.4 2.9 0.5 Interest expense (4.2) (3.1) (1.1) (7.3) (5.5) (1.8) Other income, net — 0.8 (0.8) 0.5 0.8 (0.3) Foreign currency exchange loss, net (2.0) (25.6) 23.6 (1.0) (28.8) 27.8 Loss on disposal of subsidiaries, net — — — — — — Income from continuing operations before income taxes 218.8 166.8 52.0 191.5 149.5 42.0 Income tax expense (81.7) (69.4) (12.3) (76.0) (71.9) (4.1) Income from continuing operations 137.1 97.4 39.7 115.5 77.7 37.8 Income from discontinued operations, net of tax — — — — 0.2 (0.2) Net income 137.1 97.4 39.7 115.5 77.9 37.6 Net income attributable to noncontrolling interests — (2.3) 2.3 — (2.3) 2.3 Net income attributable to Laureate Education, Inc. $ 137.1 $ 95.1 $ 42.0 $ 115.5 $ 75.6 $ 39.9 Basic and diluted earnings per share: Basic weighted average shares outstanding 139.2 146.1 (6.9) 140.7 149.1 (8.4) Diluted weighted average shares outstanding 139.9 146.8 (6.9) 141.6 149.8 (8.2) Basic earnings per share $ 0.98 $ 0.65 $ 0.33 $ 0.82 $ 0.51 $ 0.31 Diluted earnings per share $ 0.98 $ 0.65 $ 0.33 $ 0.82 $ 0.50 $ 0.32
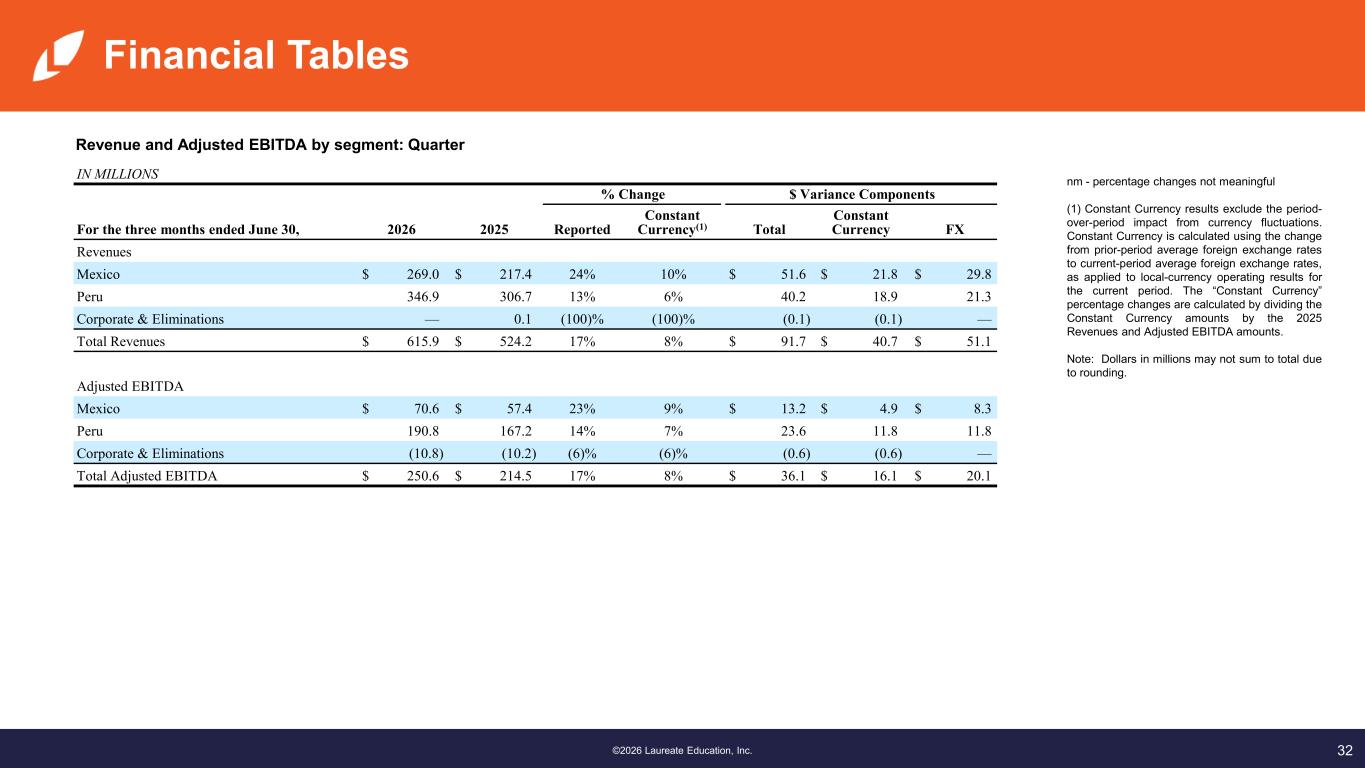
32©2026 Laureate Education, Inc. Financial Tables Revenue and Adjusted EBITDA by segment: Quarter nm - percentage changes not meaningful (1) Constant Currency results exclude the period- over-period impact from currency fluctuations. Constant Currency is calculated using the change from prior-period average foreign exchange rates to current-period average foreign exchange rates, as applied to local-currency operating results for the current period. The “Constant Currency” percentage changes are calculated by dividing the Constant Currency amounts by the 2025 Revenues and Adjusted EBITDA amounts. Note: Dollars in millions may not sum to total due to rounding. IN MILLIONS % Change $ Variance Components For the three months ended June 30, 2026 2025 Reported Constant Currency(1) Total Constant Currency FX Revenues Mexico $ 269.0 $ 217.4 24% 10% $ 51.6 $ 21.8 $ 29.8 Peru 346.9 306.7 13% 6% 40.2 18.9 21.3 Corporate & Eliminations — 0.1 (100)% (100)% (0.1) (0.1) — Total Revenues $ 615.9 $ 524.2 17% 8% $ 91.7 $ 40.7 $ 51.1 Adjusted EBITDA Mexico $ 70.6 $ 57.4 23% 9% $ 13.2 $ 4.9 $ 8.3 Peru 190.8 167.2 14% 7% 23.6 11.8 11.8 Corporate & Eliminations (10.8) (10.2) (6)% (6)% (0.6) (0.6) — Total Adjusted EBITDA $ 250.6 $ 214.5 17% 8% $ 36.1 $ 16.1 $ 20.1
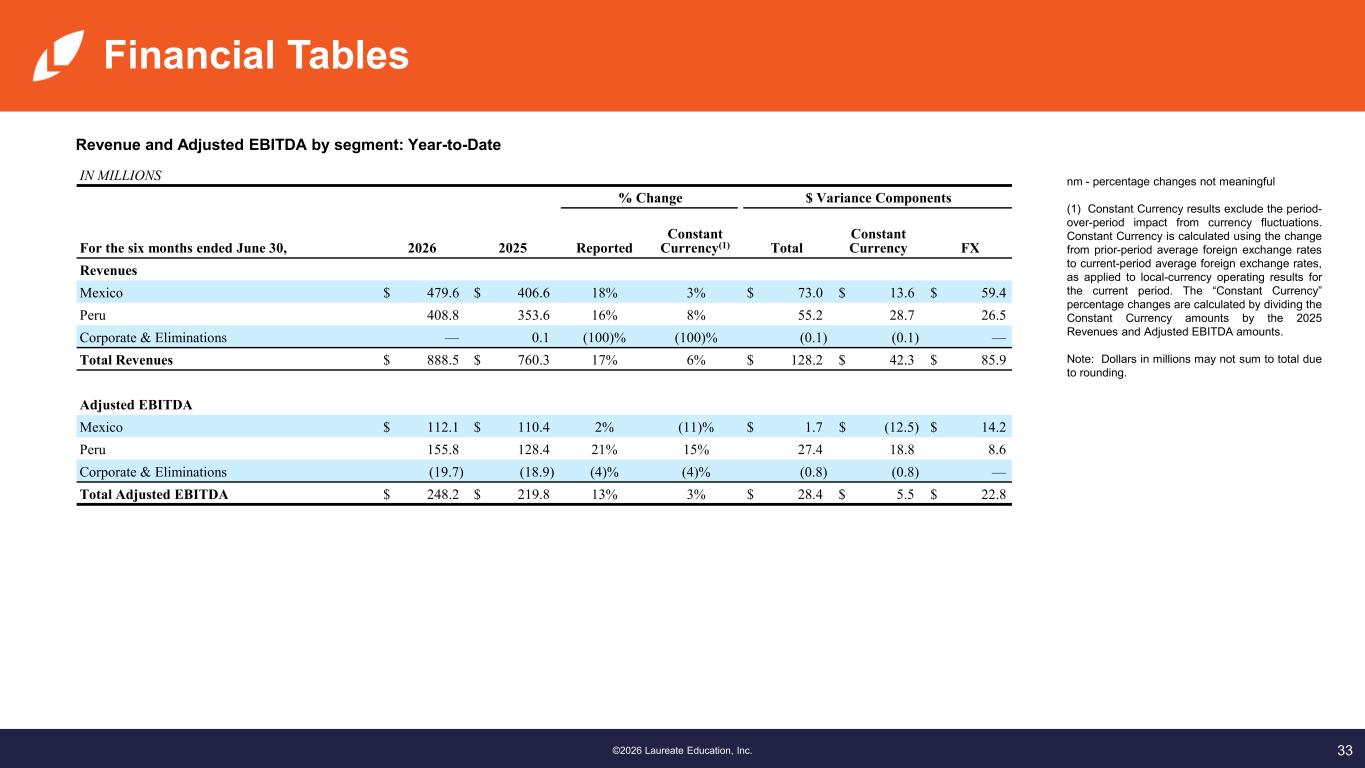
33©2026 Laureate Education, Inc. Financial Tables Revenue and Adjusted EBITDA by segment: Year-to-Date nm - percentage changes not meaningful (1) Constant Currency results exclude the period- over-period impact from currency fluctuations. Constant Currency is calculated using the change from prior-period average foreign exchange rates to current-period average foreign exchange rates, as applied to local-currency operating results for the current period. The “Constant Currency” percentage changes are calculated by dividing the Constant Currency amounts by the 2025 Revenues and Adjusted EBITDA amounts. Note: Dollars in millions may not sum to total due to rounding. IN MILLIONS % Change $ Variance Components For the six months ended June 30, 2026 2025 Reported Constant Currency(1) Total Constant Currency FX Revenues Mexico $ 479.6 $ 406.6 18% 3% $ 73.0 $ 13.6 $ 59.4 Peru 408.8 353.6 16% 8% 55.2 28.7 26.5 Corporate & Eliminations — 0.1 (100)% (100)% (0.1) (0.1) — Total Revenues $ 888.5 $ 760.3 17% 6% $ 128.2 $ 42.3 $ 85.9 Adjusted EBITDA Mexico $ 112.1 $ 110.4 2% (11)% $ 1.7 $ (12.5) $ 14.2 Peru 155.8 128.4 21% 15% 27.4 18.8 8.6 Corporate & Eliminations (19.7) (18.9) (4)% (4)% (0.8) (0.8) — Total Adjusted EBITDA $ 248.2 $ 219.8 13% 3% $ 28.4 $ 5.5 $ 22.8
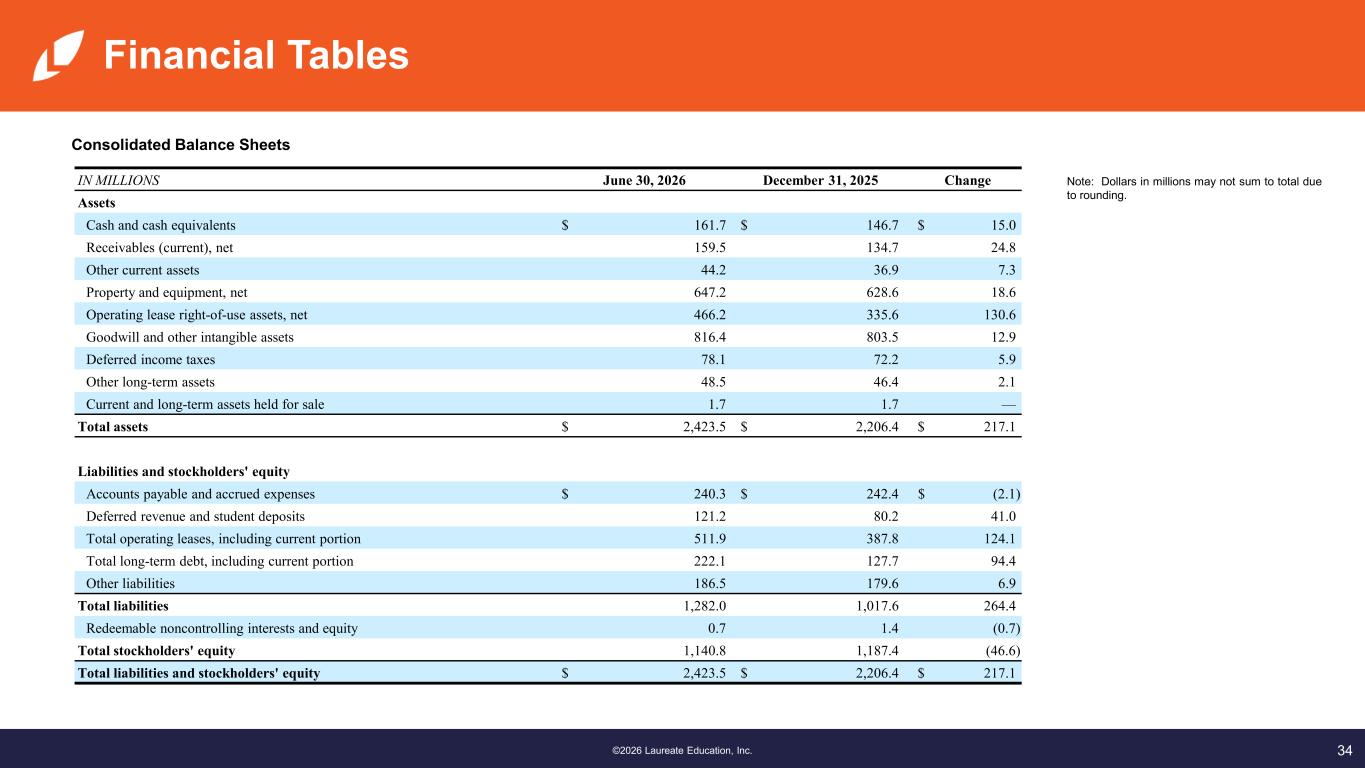
34©2026 Laureate Education, Inc. Financial Tables Consolidated Balance Sheets Note: Dollars in millions may not sum to total due to rounding. IN MILLIONS June 30, 2026 December 31, 2025 Change Assets Cash and cash equivalents $ 161.7 $ 146.7 $ 15.0 Receivables (current), net 159.5 134.7 24.8 Other current assets 44.2 36.9 7.3 Property and equipment, net 647.2 628.6 18.6 Operating lease right-of-use assets, net 466.2 335.6 130.6 Goodwill and other intangible assets 816.4 803.5 12.9 Deferred income taxes 78.1 72.2 5.9 Other long-term assets 48.5 46.4 2.1 Current and long-term assets held for sale 1.7 1.7 — Total assets $ 2,423.5 $ 2,206.4 $ 217.1 Liabilities and stockholders' equity Accounts payable and accrued expenses $ 240.3 $ 242.4 $ (2.1) Deferred revenue and student deposits 121.2 80.2 41.0 Total operating leases, including current portion 511.9 387.8 124.1 Total long-term debt, including current portion 222.1 127.7 94.4 Other liabilities 186.5 179.6 6.9 Total liabilities 1,282.0 1,017.6 264.4 Redeemable noncontrolling interests and equity 0.7 1.4 (0.7) Total stockholders' equity 1,140.8 1,187.4 (46.6) Total liabilities and stockholders' equity $ 2,423.5 $ 2,206.4 $ 217.1
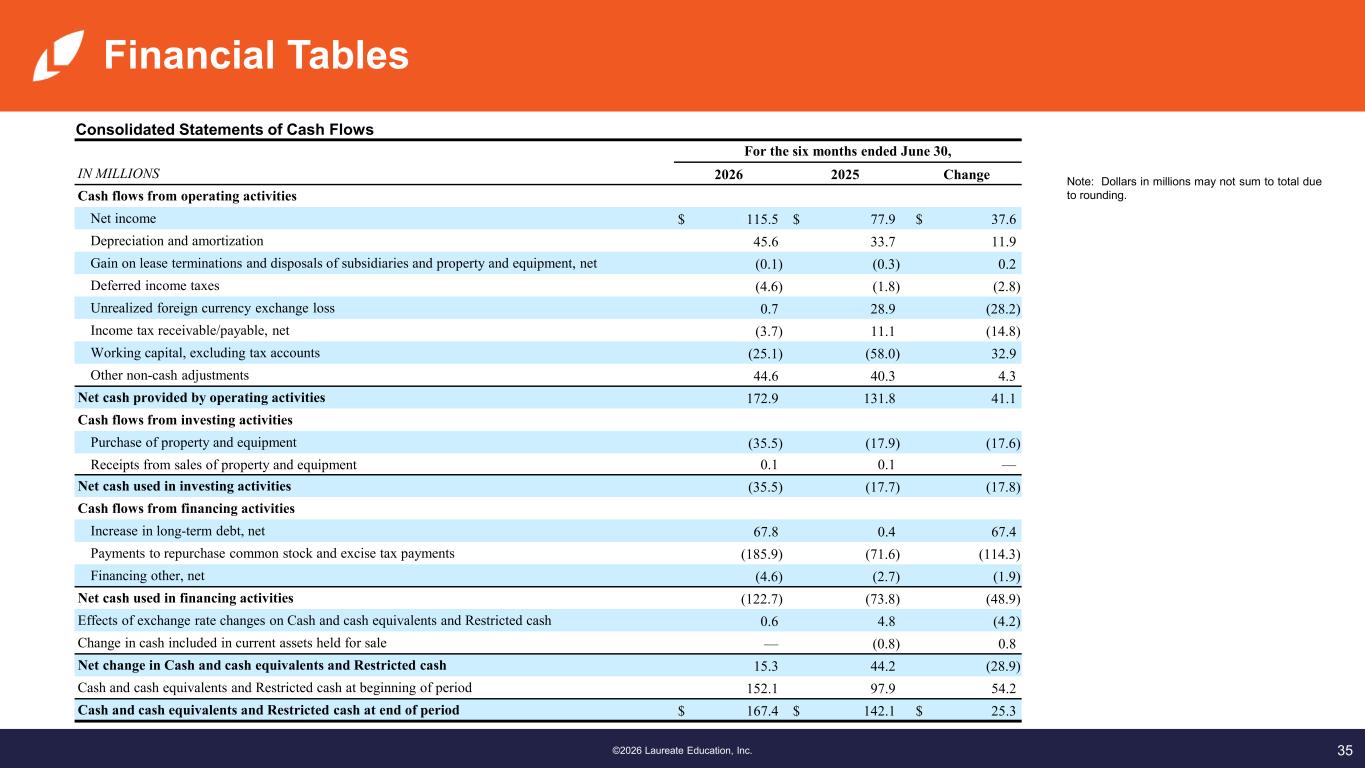
35©2026 Laureate Education, Inc. Financial Tables Consolidated Statements of Cash Flows Note: Dollars in millions may not sum to total due to rounding. For the six months ended June 30, IN MILLIONS 2026 2025 Change Cash flows from operating activities Net income $ 115.5 $ 77.9 $ 37.6 Depreciation and amortization 45.6 33.7 11.9 Gain on lease terminations and disposals of subsidiaries and property and equipment, net (0.1) (0.3) 0.2 Deferred income taxes (4.6) (1.8) (2.8) Unrealized foreign currency exchange loss 0.7 28.9 (28.2) Income tax receivable/payable, net (3.7) 11.1 (14.8) Working capital, excluding tax accounts (25.1) (58.0) 32.9 Other non-cash adjustments 44.6 40.3 4.3 Net cash provided by operating activities 172.9 131.8 41.1 Cash flows from investing activities Purchase of property and equipment (35.5) (17.9) (17.6) Receipts from sales of property and equipment 0.1 0.1 — Net cash used in investing activities (35.5) (17.7) (17.8) Cash flows from financing activities Increase in long-term debt, net 67.8 0.4 67.4 Payments to repurchase common stock and excise tax payments (185.9) (71.6) (114.3) Financing other, net (4.6) (2.7) (1.9) Net cash used in financing activities (122.7) (73.8) (48.9) Effects of exchange rate changes on Cash and cash equivalents and Restricted cash 0.6 4.8 (4.2) Change in cash included in current assets held for sale — (0.8) 0.8 Net change in Cash and cash equivalents and Restricted cash 15.3 44.2 (28.9) Cash and cash equivalents and Restricted cash at beginning of period 152.1 97.9 54.2 Cash and cash equivalents and Restricted cash at end of period $ 167.4 $ 142.1 $ 25.3
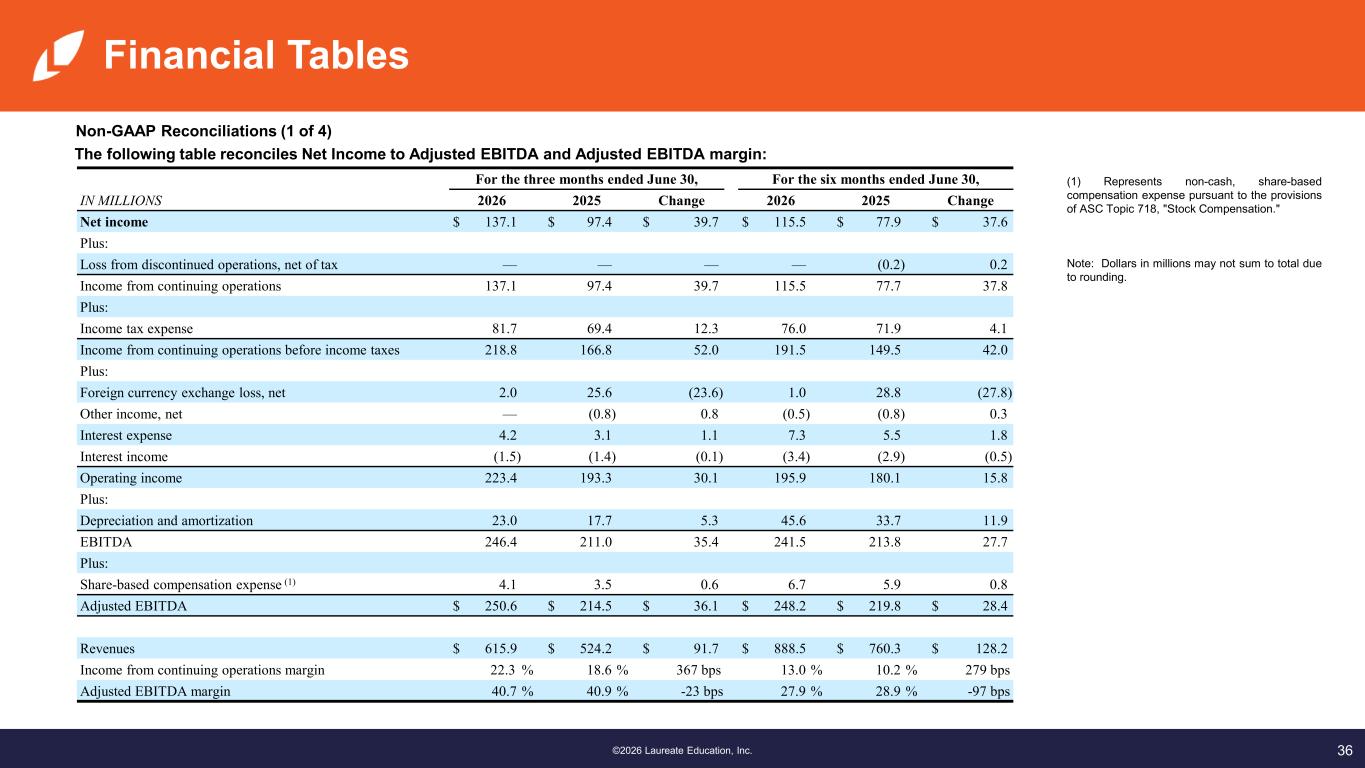
36©2026 Laureate Education, Inc. Financial Tables Non-GAAP Reconciliations (1 of 4) The following table reconciles Net Income to Adjusted EBITDA and Adjusted EBITDA margin: (1) Represents non-cash, share-based compensation expense pursuant to the provisions of ASC Topic 718, "Stock Compensation." Note: Dollars in millions may not sum to total due to rounding. For the three months ended June 30, For the six months ended June 30, IN MILLIONS 2026 2025 Change 2026 2025 Change Net income $ 137.1 $ 97.4 $ 39.7 $ 115.5 $ 77.9 $ 37.6 Plus: Loss from discontinued operations, net of tax — — — — (0.2) 0.2 Income from continuing operations 137.1 97.4 39.7 115.5 77.7 37.8 Plus: Income tax expense 81.7 69.4 12.3 76.0 71.9 4.1 Income from continuing operations before income taxes 218.8 166.8 52.0 191.5 149.5 42.0 Plus: Foreign currency exchange loss, net 2.0 25.6 (23.6) 1.0 28.8 (27.8) Other income, net — (0.8) 0.8 (0.5) (0.8) 0.3 Interest expense 4.2 3.1 1.1 7.3 5.5 1.8 Interest income (1.5) (1.4) (0.1) (3.4) (2.9) (0.5) Operating income 223.4 193.3 30.1 195.9 180.1 15.8 Plus: Depreciation and amortization 23.0 17.7 5.3 45.6 33.7 11.9 EBITDA 246.4 211.0 35.4 241.5 213.8 27.7 Plus: Share-based compensation expense (1) 4.1 3.5 0.6 6.7 5.9 0.8 Adjusted EBITDA $ 250.6 $ 214.5 $ 36.1 $ 248.2 $ 219.8 $ 28.4 Revenues $ 615.9 $ 524.2 $ 91.7 $ 888.5 $ 760.3 $ 128.2 Income from continuing operations margin 22.3 % 18.6 % 367 bps 13.0 % 10.2 % 279 bps Adjusted EBITDA margin 40.7 % 40.9 % -23 bps 27.9 % 28.9 % -97 bps
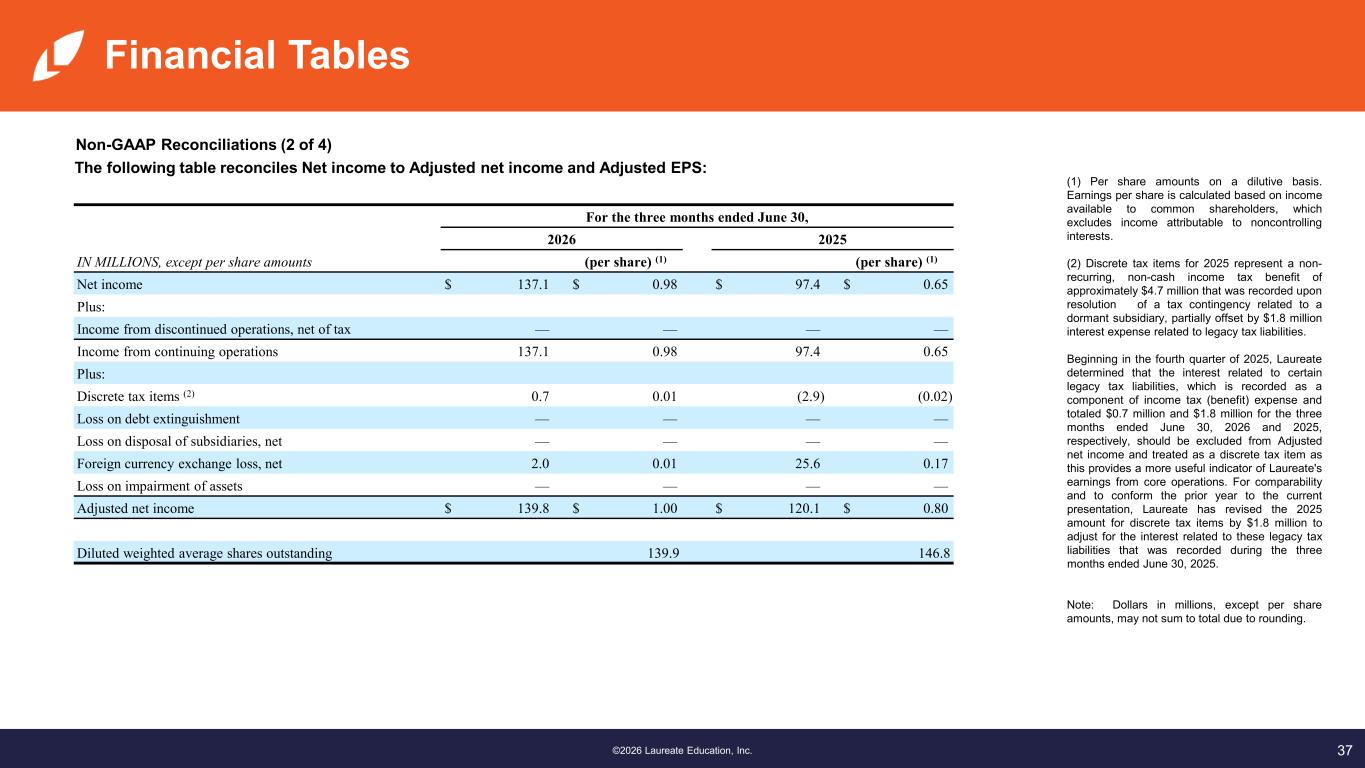
37©2026 Laureate Education, Inc. Financial Tables Non-GAAP Reconciliations (2 of 4) The following table reconciles Net income to Adjusted net income and Adjusted EPS: (1) Per share amounts on a dilutive basis. Earnings per share is calculated based on income available to common shareholders, which excludes income attributable to noncontrolling interests. (2) Discrete tax items for 2025 represent a non- recurring, non-cash income tax benefit of approximately $4.7 million that was recorded upon resolution of a tax contingency related to a dormant subsidiary, partially offset by $1.8 million interest expense related to legacy tax liabilities. Beginning in the fourth quarter of 2025, Laureate determined that the interest related to certain legacy tax liabilities, which is recorded as a component of income tax (benefit) expense and totaled $0.7 million and $1.8 million for the three months ended June 30, 2026 and 2025, respectively, should be excluded from Adjusted net income and treated as a discrete tax item as this provides a more useful indicator of Laureate's earnings from core operations. For comparability and to conform the prior year to the current presentation, Laureate has revised the 2025 amount for discrete tax items by $1.8 million to adjust for the interest related to these legacy tax liabilities that was recorded during the three months ended June 30, 2025. Note: Dollars in millions, except per share amounts, may not sum to total due to rounding. For the three months ended June 30, 2026 2025 IN MILLIONS, except per share amounts (per share) (1) (per share) (1) Net income $ 137.1 $ 0.98 $ 97.4 $ 0.65 Plus: Income from discontinued operations, net of tax — — — — Income from continuing operations 137.1 0.98 97.4 0.65 Plus: Discrete tax items (2) 0.7 0.01 (2.9) (0.02) Loss on debt extinguishment — — — — Loss on disposal of subsidiaries, net — — — — Foreign currency exchange loss, net 2.0 0.01 25.6 0.17 Loss on impairment of assets — — — — Adjusted net income $ 139.8 $ 1.00 $ 120.1 $ 0.80 Diluted weighted average shares outstanding 139.9 146.8
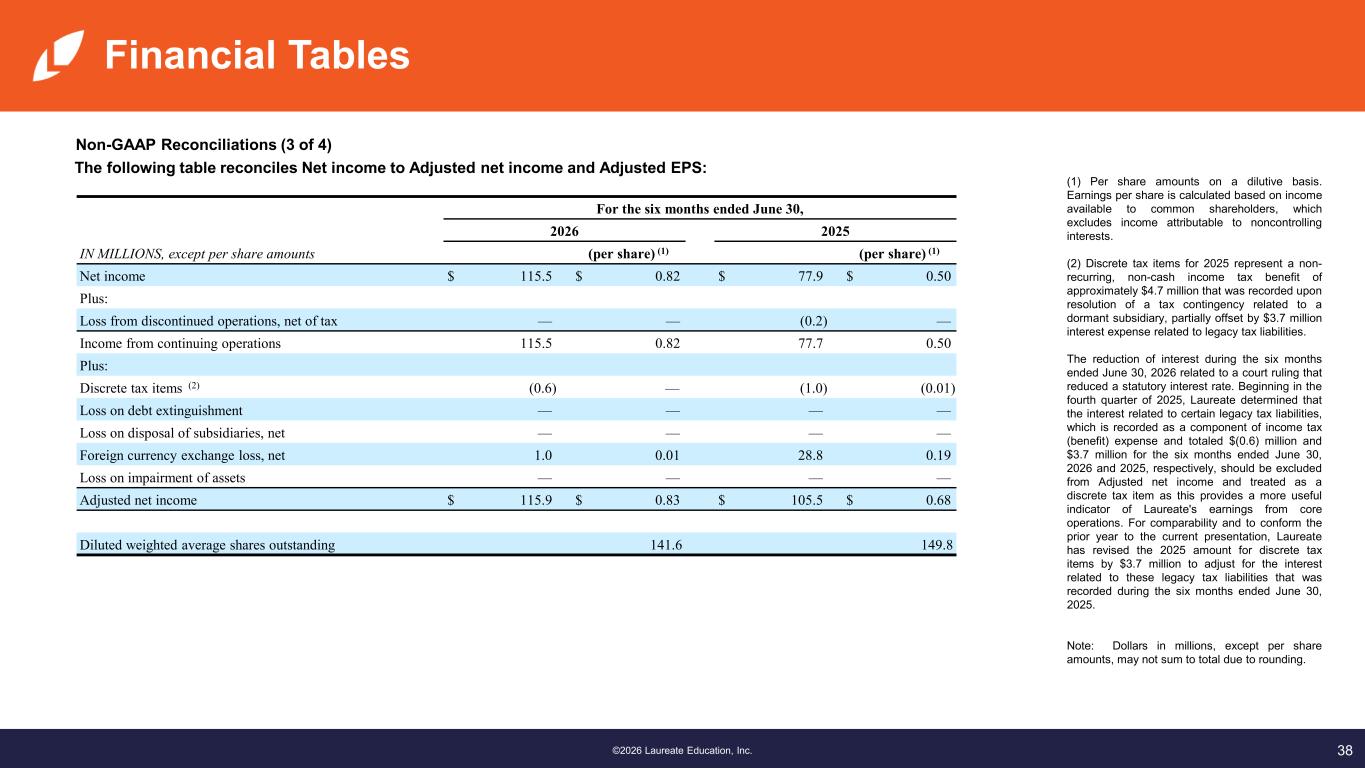
38©2026 Laureate Education, Inc. Financial Tables Non-GAAP Reconciliations (3 of 4) The following table reconciles Net income to Adjusted net income and Adjusted EPS: (1) Per share amounts on a dilutive basis. Earnings per share is calculated based on income available to common shareholders, which excludes income attributable to noncontrolling interests. (2) Discrete tax items for 2025 represent a non- recurring, non-cash income tax benefit of approximately $4.7 million that was recorded upon resolution of a tax contingency related to a dormant subsidiary, partially offset by $3.7 million interest expense related to legacy tax liabilities. The reduction of interest during the six months ended June 30, 2026 related to a court ruling that reduced a statutory interest rate. Beginning in the fourth quarter of 2025, Laureate determined that the interest related to certain legacy tax liabilities, which is recorded as a component of income tax (benefit) expense and totaled $(0.6) million and $3.7 million for the six months ended June 30, 2026 and 2025, respectively, should be excluded from Adjusted net income and treated as a discrete tax item as this provides a more useful indicator of Laureate's earnings from core operations. For comparability and to conform the prior year to the current presentation, Laureate has revised the 2025 amount for discrete tax items by $3.7 million to adjust for the interest related to these legacy tax liabilities that was recorded during the six months ended June 30, 2025. Note: Dollars in millions, except per share amounts, may not sum to total due to rounding. For the six months ended June 30, 2026 2025 IN MILLIONS, except per share amounts (per share) (1) (per share) (1) Net income $ 115.5 $ 0.82 $ 77.9 $ 0.50 Plus: Loss from discontinued operations, net of tax — — (0.2) — Income from continuing operations 115.5 0.82 77.7 0.50 Plus: Discrete tax items (2) (0.6) — (1.0) (0.01) Loss on debt extinguishment — — — — Loss on disposal of subsidiaries, net — — — — Foreign currency exchange loss, net 1.0 0.01 28.8 0.19 Loss on impairment of assets — — — — Adjusted net income $ 115.9 $ 0.83 $ 105.5 $ 0.68 Diluted weighted average shares outstanding 141.6 149.8
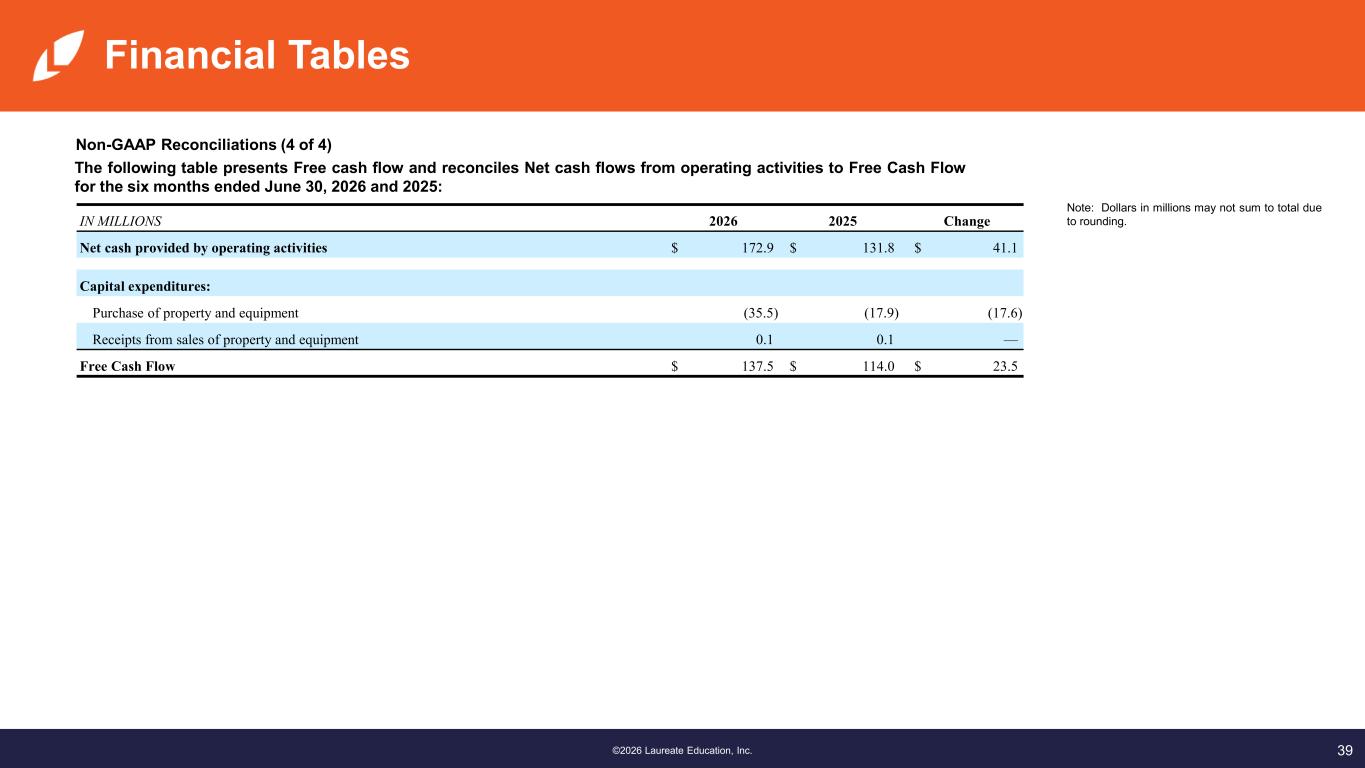
39©2026 Laureate Education, Inc. Financial Tables Non-GAAP Reconciliations (4 of 4) The following table presents Free cash flow and reconciles Net cash flows from operating activities to Free Cash Flow for the six months ended June 30, 2026 and 2025: Note: Dollars in millions may not sum to total due to rounding.IN MILLIONS 2026 2025 Change Net cash provided by operating activities $ 172.9 $ 131.8 $ 41.1 Capital expenditures: Purchase of property and equipment (35.5) (17.9) (17.6) Receipts from sales of property and equipment 0.1 0.1 — Free Cash Flow $ 137.5 $ 114.0 $ 23.5

©2026 Laureate Education, Inc.