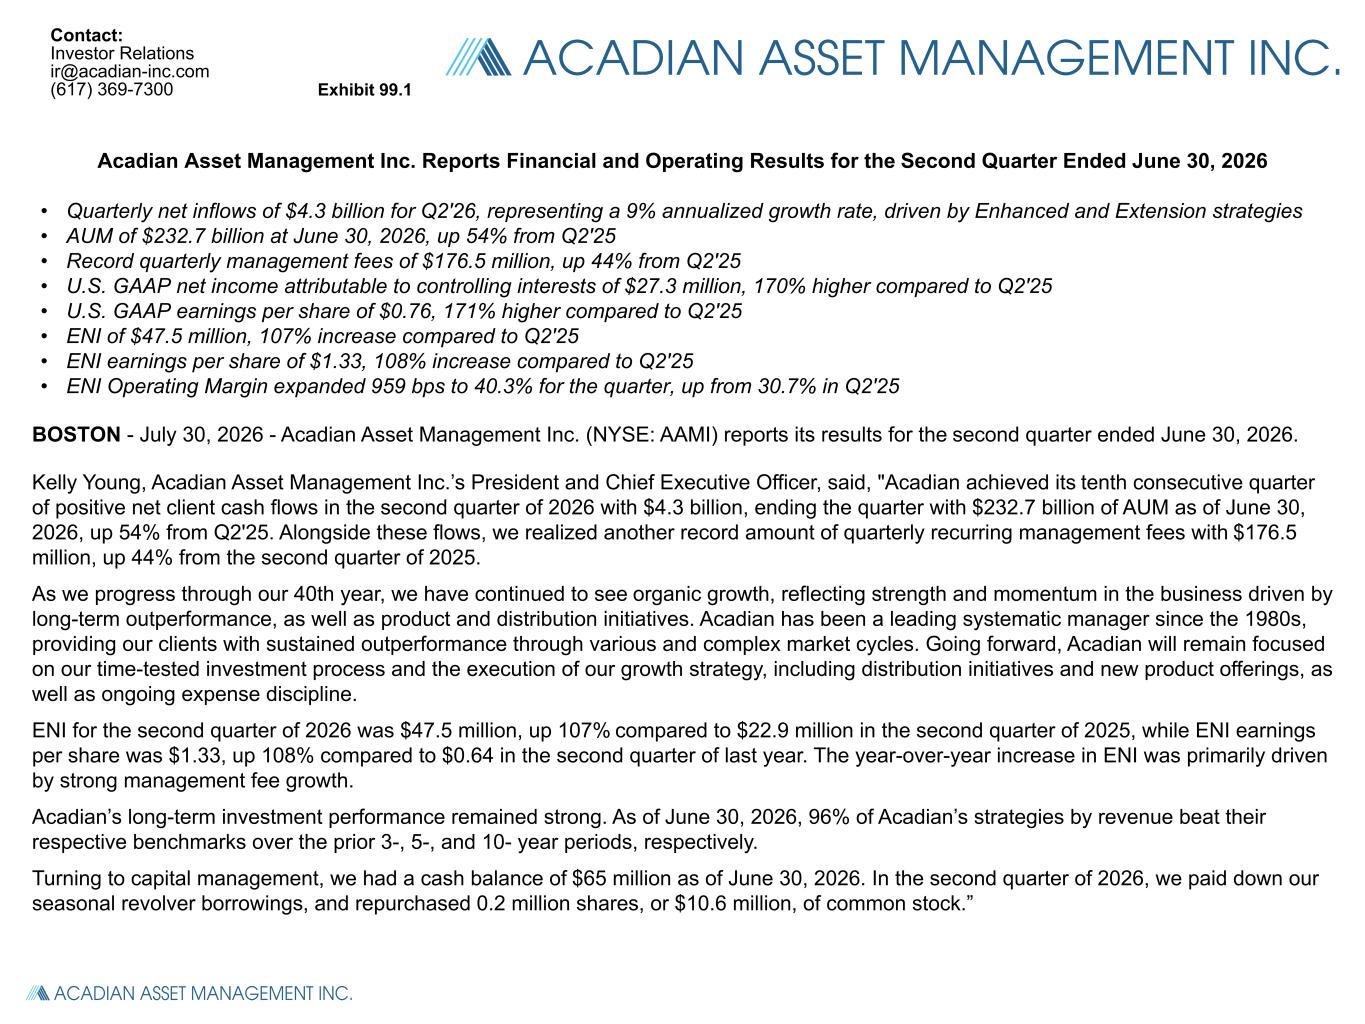
Acadian Asset Management Inc. Reports Financial and Operating Results for the Second Quarter Ended June 30, 2026 • Quarterly net inflows of $4.3 billion for Q2'26, representing a 9% annualized growth rate, driven by Enhanced and Extension strategies • AUM of $232.7 billion at June 30, 2026, up 54% from Q2'25 • Record quarterly management fees of $176.5 million, up 44% from Q2'25 • U.S. GAAP net income attributable to controlling interests of $27.3 million, 170% higher compared to Q2'25 • U.S. GAAP earnings per share of $0.76, 171% higher compared to Q2'25 • ENI of $47.5 million, 107% increase compared to Q2'25 • ENI earnings per share of $1.33, 108% increase compared to Q2'25 • ENI Operating Margin expanded 959 bps to 40.3% for the quarter, up from 30.7% in Q2'25 BOSTON - July 30, 2026 - Acadian Asset Management Inc. (NYSE: AAMI) reports its results for the second quarter ended June 30, 2026. Kelly Young, Acadian Asset Management Inc.’s President and Chief Executive Officer, said, "Acadian achieved its tenth consecutive quarter of positive net client cash flows in the second quarter of 2026 with $4.3 billion, ending the quarter with $232.7 billion of AUM as of June 30, 2026, up 54% from Q2'25. Alongside these flows, we realized another record amount of quarterly recurring management fees with $176.5 million, up 44% from the second quarter of 2025. As we progress through our 40th year, we have continued to see organic growth, reflecting strength and momentum in the business driven by long-term outperformance, as well as product and distribution initiatives. Acadian has been a leading systematic manager since the 1980s, providing our clients with sustained outperformance through various and complex market cycles. Going forward, Acadian will remain focused on our time-tested investment process and the execution of our growth strategy, including distribution initiatives and new product offerings, as well as ongoing expense discipline. ENI for the second quarter of 2026 was $47.5 million, up 107% compared to $22.9 million in the second quarter of 2025, while ENI earnings per share was $1.33, up 108% compared to $0.64 in the second quarter of last year. The year-over-year increase in ENI was primarily driven by strong management fee growth. Acadian’s long-term investment performance remained strong. As of June 30, 2026, 96% of Acadian’s strategies by revenue beat their respective benchmarks over the prior 3-, 5-, and 10- year periods, respectively. Turning to capital management, we had a cash balance of $65 million as of June 30, 2026. In the second quarter of 2026, we paid down our seasonal revolver borrowings, and repurchased 0.2 million shares, or $10.6 million, of common stock.” Contact: Investor Relations ir@acadian-inc.com (617) 369-7300 Exhibit 99.1
Dividend Declaration The Company’s Board of Directors approved a quarterly interim dividend of $0.10 per share payable on September 25, 2026 to shareholders of record as of the close of business on September 11, 2026. Conference Call Dial-in The Company will hold a conference call and simultaneous webcast to discuss the results at 11:00 a.m. Eastern Time on July 30, 2026. To listen to the call or view the webcast, participants should visit the Company’s website, at ir.acadian-inc.com or: Dial-in: Local Dial-in Number: (585) 542-9983 Toll Free Dial-in Number: (833) 461-5787 Meeting ID: 284 305 202 Dial-in Replay: A replay of the call will be available beginning approximately one hour after its conclusion on the Company’s website, at ir.acadian-inc.com. About Acadian Asset Management Inc. Acadian Asset Management Inc. is the NYSE listed holding company of Acadian Asset Management LLC, with approximately $233 billion of assets under management as of June 30, 2026. Acadian offers institutional investors across the globe access to a wide array of leading quantitative and solutions-based strategies designed to meet a range of risk and return objectives. For more information, please visit our website at www.acadian-inc.com. Information that may be important to investors will be routinely posted on our website.
Forward-Looking Statements This communication includes forward-looking statements which may include, from time to time, anticipated revenues, margins, operating expense, variable compensation and distribution ratios, cash flows or earnings growth profile, expectations regarding the investment process, anticipated performance and growth of the Company’s business going forward, expected distribution initiatives and new product offerings, expected distribution and variable compensation ratios, expected sector trends and their potential impact, expected future net cash flows, expected uses of capital, including expectations for paying down our revolving credit facility, and capital management, including expectations regarding market conditions, investing in organic growth and returning capital to shareholders. The words or phrases ‘‘will likely result,’’ ‘‘are expected to,’’ ‘‘will continue,’’ ‘‘is anticipated,’’ ‘‘can be,’’ ‘‘may be,’’ ‘‘aim to,’’ ‘‘may affect,’’ ‘‘may depend,’’ ‘‘intends,’’ ‘‘expects,’’ ‘‘believes,’’ ‘‘estimate,’’ ‘‘project,’’ and other similar expressions are intended to identify such forward-looking statements. Such statements are subject to various known and unknown risks and uncertainties and readers should be cautioned that any forward-looking information provided by or on behalf of the Company is not a guarantee of future performance. Actual results may differ materially from those in forward-looking information as a result of various factors, some of which are beyond the Company’s control, including but not limited to those discussed elsewhere in this communication. Additional factors that could cause actual results to differ from the forward-looking statements in this release include: our financial results are dependent on Acadian Asset Management LLC; our reliance on key personnel; our use of a limited number of investment strategies; our ability to attract and retain assets under management; the potential for losses on seed and co-investment capital; foreign currency exchange risk; risks associated with government regulation; and other factors that may be described in the Company's most recent Annual Report on Form 10-K filed with the Securities and Exchange Commission on February 27, 2026. Due to such risks and uncertainties and other factors, the Company cautions each person receiving such forward-looking information not to place undue reliance on such statements. Further, such forward-looking statements speak only as of the date of this communication and the Company undertakes no obligations to update any forward-looking statement to reflect events or circumstances after the date of this communication or to reflect the occurrence of unanticipated events. This communication does not constitute an offer for any fund managed by the Company or any subsidiary of the Company. Non-GAAP Financial Measures This communication contains non-GAAP financial measures. Reconciliations of non-GAAP to GAAP financial measures, along with certain segment measures, are included in the Supplemental Information, Reconciliations and Disclosures section of this communication.

Q2 2026 EARNINGS PRESENTATION July 30, 2026
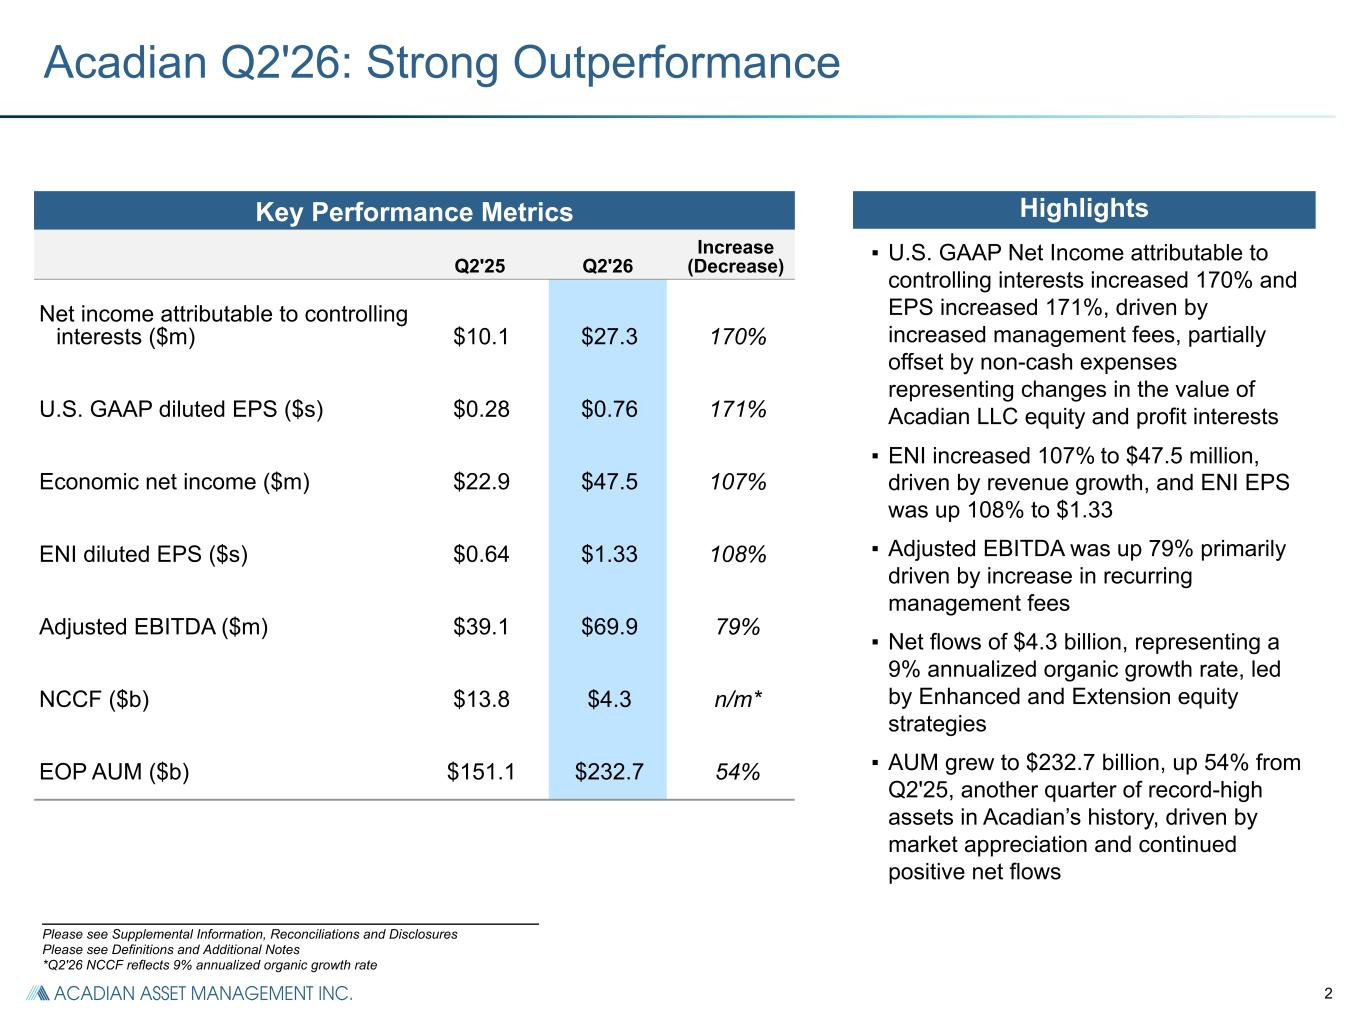
2 Key Performance Metrics Q2'25 Q2'26 Increase (Decrease) Net income attributable to controlling interests ($m) $10.1 $27.3 170% U.S. GAAP diluted EPS ($s) $0.28 $0.76 171% Economic net income ($m) $22.9 $47.5 107% ENI diluted EPS ($s) $0.64 $1.33 108% Adjusted EBITDA ($m) $39.1 $69.9 79% NCCF ($b) $13.8 $4.3 n/m* EOP AUM ($b) $151.1 $232.7 54% Acadian Q2'26: Strong Outperformance Highlights ▪ U.S. GAAP Net Income attributable to controlling interests increased 170% and EPS increased 171%, driven by increased management fees, partially offset by non-cash expenses representing changes in the value of Acadian LLC equity and profit interests ▪ ENI increased 107% to $47.5 million, driven by revenue growth, and ENI EPS was up 108% to $1.33 ▪ Adjusted EBITDA was up 79% primarily driven by increase in recurring management fees ▪ Net flows of $4.3 billion, representing a 9% annualized organic growth rate, led by Enhanced and Extension equity strategies ▪ AUM grew to $232.7 billion, up 54% from Q2'25, another quarter of record-high assets in Acadian’s history, driven by market appreciation and continued positive net flows ___________________________________________________________ Please see Supplemental Information, Reconciliations and Disclosures Please see Definitions and Additional Notes *Q2'26 NCCF reflects 9% annualized organic growth rate
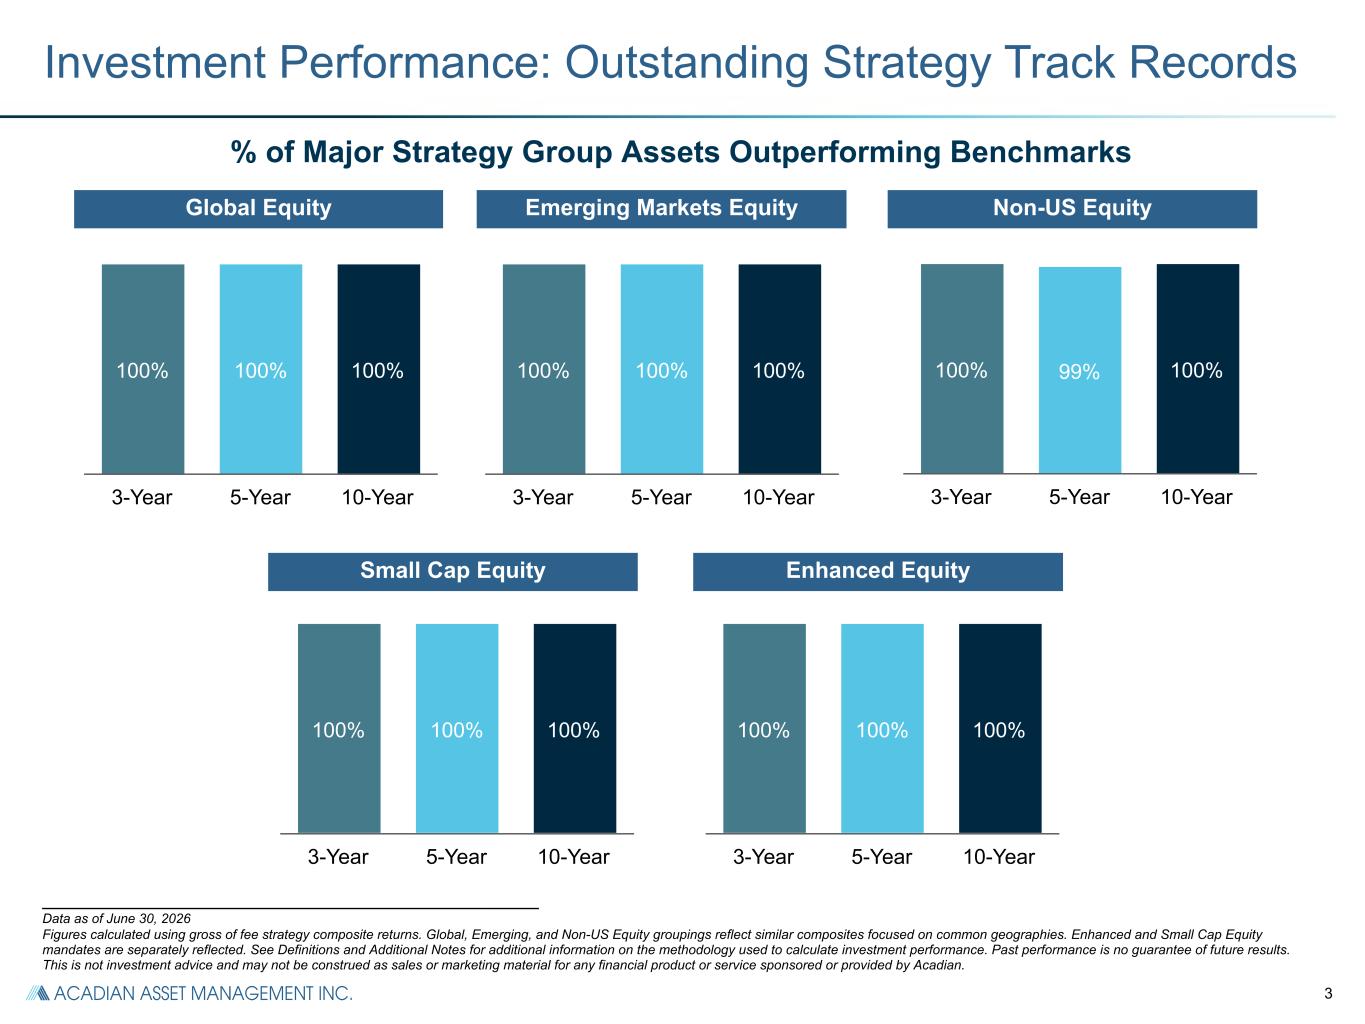
3 100% 100% 100% 3-Year 5-Year 10-Year 100% 100% 100% 3-Year 5-Year 10-Year 100% 99% 100% 3-Year 5-Year 10-Year 100% 100% 100% 3-Year 5-Year 10-Year 100% 100% 100% 3-Year 5-Year 10-Year Global Equity Investment Performance: Outstanding Strategy Track Records % of Major Strategy Group Assets Outperforming Benchmarks Emerging Markets Equity Non-US Equity Small Cap Equity Enhanced Equity ___________________________________________________________ Data as of June 30, 2026 Figures calculated using gross of fee strategy composite returns. Global, Emerging, and Non-US Equity groupings reflect similar composites focused on common geographies. Enhanced and Small Cap Equity mandates are separately reflected. See Definitions and Additional Notes for additional information on the methodology used to calculate investment performance. Past performance is no guarantee of future results. This is not investment advice and may not be construed as sales or marketing material for any financial product or service sponsored or provided by Acadian.
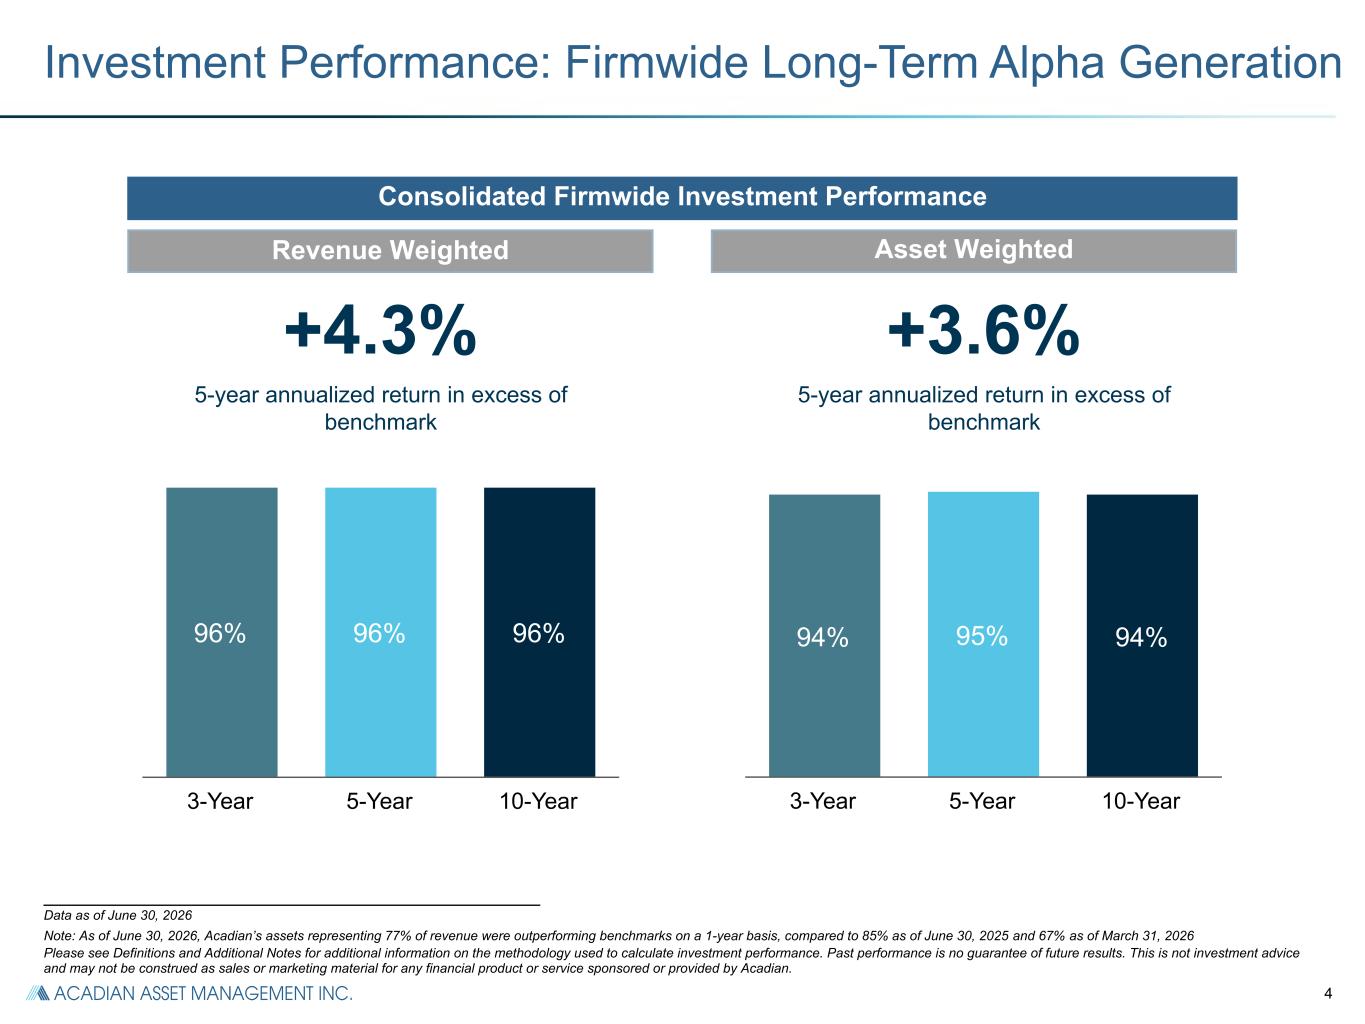
4 96% 96% 96% 3-Year 5-Year 10-Year 94% 95% 94% 3-Year 5-Year 10-Year +4.3% 5-year annualized return in excess of benchmark +3.6% 5-year annualized return in excess of benchmark Revenue Weighted Asset Weighted Consolidated Firmwide Investment Performance Investment Performance: Firmwide Long-Term Alpha Generation ___________________________________________________________ Data as of June 30, 2026 Note: As of June 30, 2026, Acadian’s assets representing 77% of revenue were outperforming benchmarks on a 1-year basis, compared to 85% as of June 30, 2025 and 67% as of March 31, 2026 Please see Definitions and Additional Notes for additional information on the methodology used to calculate investment performance. Past performance is no guarantee of future results. This is not investment advice and may not be construed as sales or marketing material for any financial product or service sponsored or provided by Acadian.
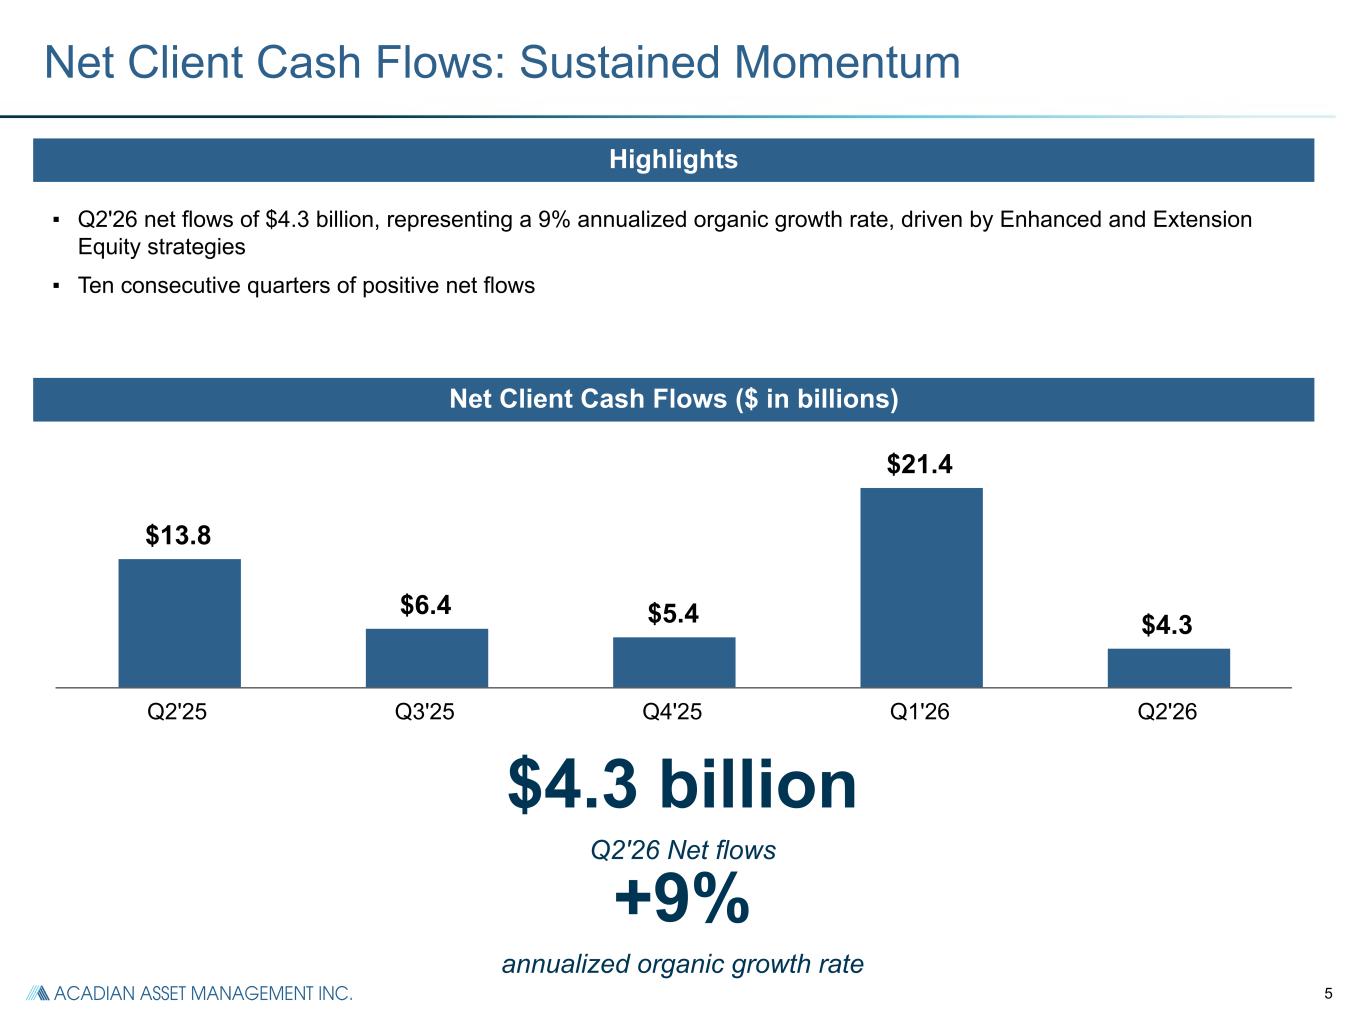
5 $13.8 $6.4 $5.4 $21.4 $4.3 Q2'25 Q3'25 Q4'25 Q1'26 Q2'26 Net Client Cash Flows: Sustained Momentum ▪ Q2'26 net flows of $4.3 billion, representing a 9% annualized organic growth rate, driven by Enhanced and Extension Equity strategies ▪ Ten consecutive quarters of positive net flows Highlights Net Client Cash Flows ($ in billions) $4.3 billion Q2'26 Net flows +9% annualized organic growth rate
6 Q2 2026 FINANCIAL RESULTS
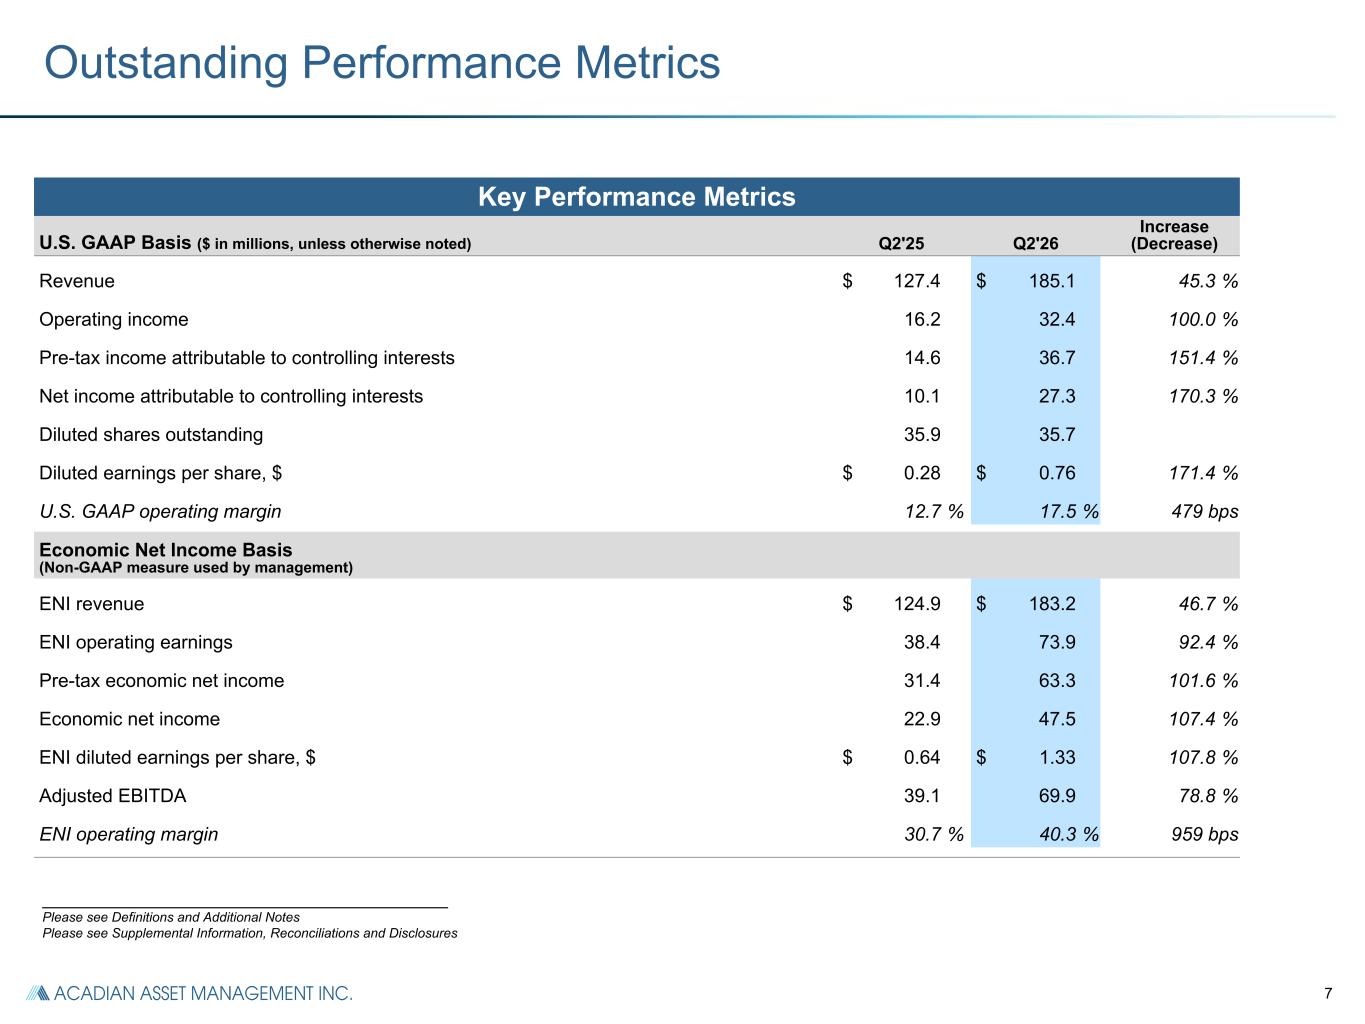
7 Outstanding Performance Metrics Key Performance Metrics U.S. GAAP Basis ($ in millions, unless otherwise noted) Q2'25 Q2'26 Increase (Decrease) Revenue $ 127.4 $ 185.1 45.3 % Operating income 16.2 32.4 100.0 % Pre-tax income attributable to controlling interests 14.6 36.7 151.4 % Net income attributable to controlling interests 10.1 27.3 170.3 % Diluted shares outstanding 35.9 35.7 Diluted earnings per share, $ $ 0.28 $ 0.76 171.4 % U.S. GAAP operating margin 12.7 % 17.5 % 479 bps Economic Net Income Basis (Non-GAAP measure used by management) ENI revenue $ 124.9 $ 183.2 46.7 % ENI operating earnings 38.4 73.9 92.4 % Pre-tax economic net income 31.4 63.3 101.6 % Economic net income 22.9 47.5 107.4 % ENI diluted earnings per share, $ $ 0.64 $ 1.33 107.8 % Adjusted EBITDA 39.1 69.9 78.8 % ENI operating margin 30.7 % 40.3 % 959 bps _______________________________________________________ Please see Definitions and Additional Notes Please see Supplemental Information, Reconciliations and Disclosures
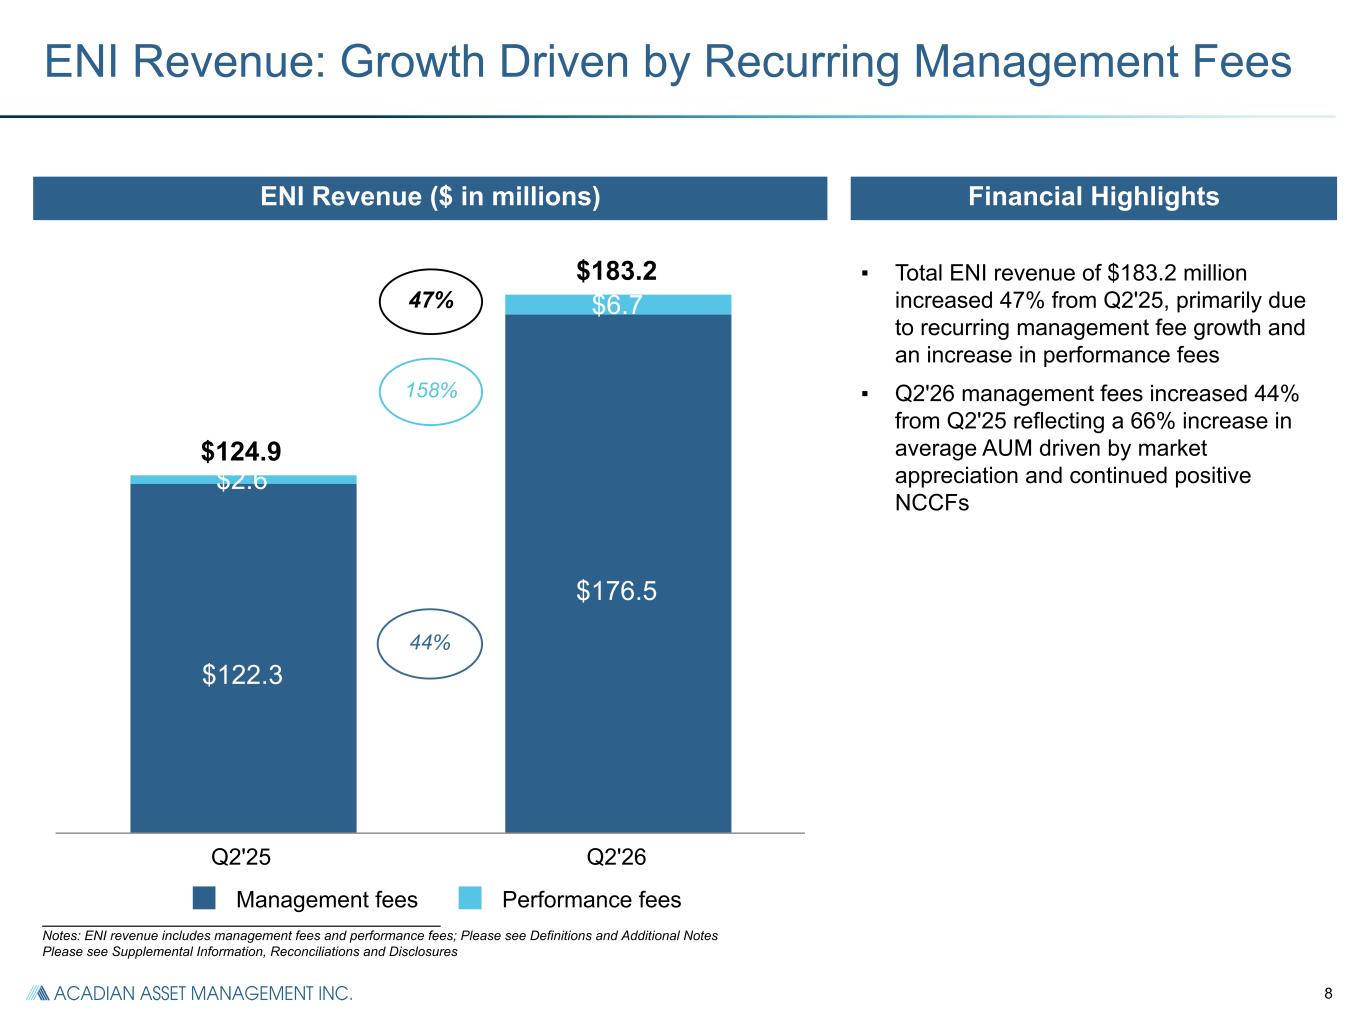
8 $124.9 $183.2 $122.3 $176.5 $2.6 $6.7 Management fees Performance fees Q2'25 Q2'26 ______________________________________________________ Notes: ENI revenue includes management fees and performance fees; Please see Definitions and Additional Notes Please see Supplemental Information, Reconciliations and Disclosures ENI Revenue: Growth Driven by Recurring Management Fees ▪ Total ENI revenue of $183.2 million increased 47% from Q2'25, primarily due to recurring management fee growth and an increase in performance fees ▪ Q2'26 management fees increased 44% from Q2'25 reflecting a 66% increase in average AUM driven by market appreciation and continued positive NCCFs Financial HighlightsENI Revenue ($ in millions) 44% 158% 47%
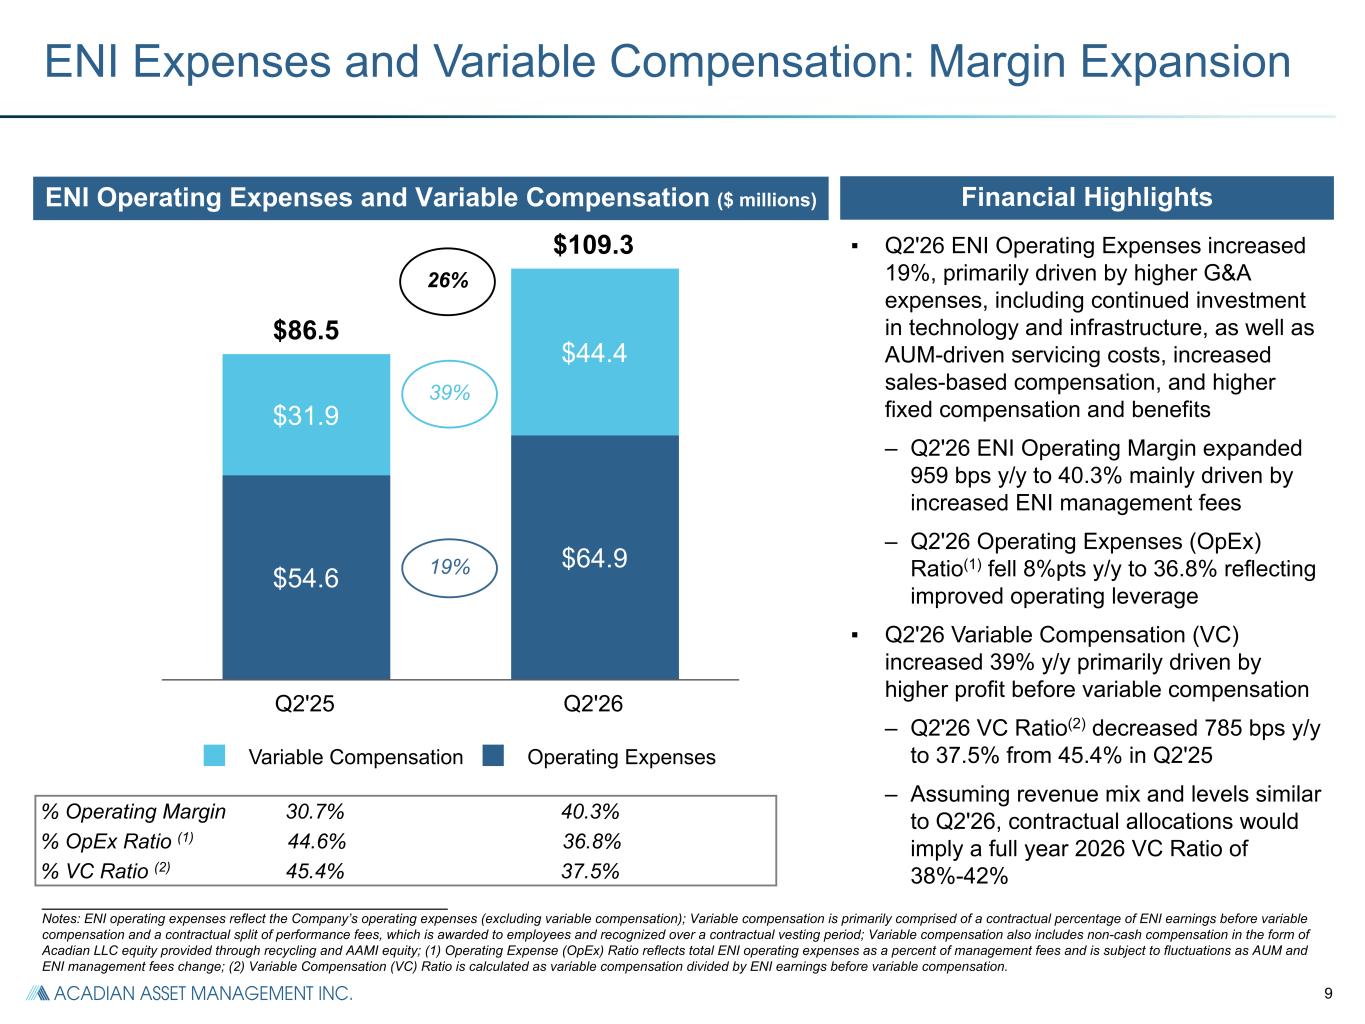
9 _______________________________________________________ Notes: ENI operating expenses reflect the Company’s operating expenses (excluding variable compensation); Variable compensation is primarily comprised of a contractual percentage of ENI earnings before variable compensation and a contractual split of performance fees, which is awarded to employees and recognized over a contractual vesting period; Variable compensation also includes non-cash compensation in the form of Acadian LLC equity provided through recycling and AAMI equity; (1) Operating Expense (OpEx) Ratio reflects total ENI operating expenses as a percent of management fees and is subject to fluctuations as AUM and ENI management fees change; (2) Variable Compensation (VC) Ratio is calculated as variable compensation divided by ENI earnings before variable compensation. $86.5 $109.3 $54.6 $64.9 $31.9 $44.4 Variable Compensation Operating Expenses Q2'25 Q2'26 ENI Expenses and Variable Compensation: Margin Expansion Financial HighlightsENI Operating Expenses and Variable Compensation ($ millions) % Operating Margin 30.7% 40.3% % OpEx Ratio (1) 44.6% 36.8% % VC Ratio (2) 45.4% 37.5% ▪ Q2'26 ENI Operating Expenses increased 19%, primarily driven by higher G&A expenses, including continued investment in technology and infrastructure, as well as AUM-driven servicing costs, increased sales-based compensation, and higher fixed compensation and benefits – Q2'26 ENI Operating Margin expanded 959 bps y/y to 40.3% mainly driven by increased ENI management fees – Q2'26 Operating Expenses (OpEx) Ratio(1) fell 8%pts y/y to 36.8% reflecting improved operating leverage ▪ Q2'26 Variable Compensation (VC) increased 39% y/y primarily driven by higher profit before variable compensation – Q2'26 VC Ratio(2) decreased 785 bps y/y to 37.5% from 45.4% in Q2'25 – Assuming revenue mix and levels similar to Q2'26, contractual allocations would imply a full year 2026 VC Ratio of 38%-42% 26% 39% 19%
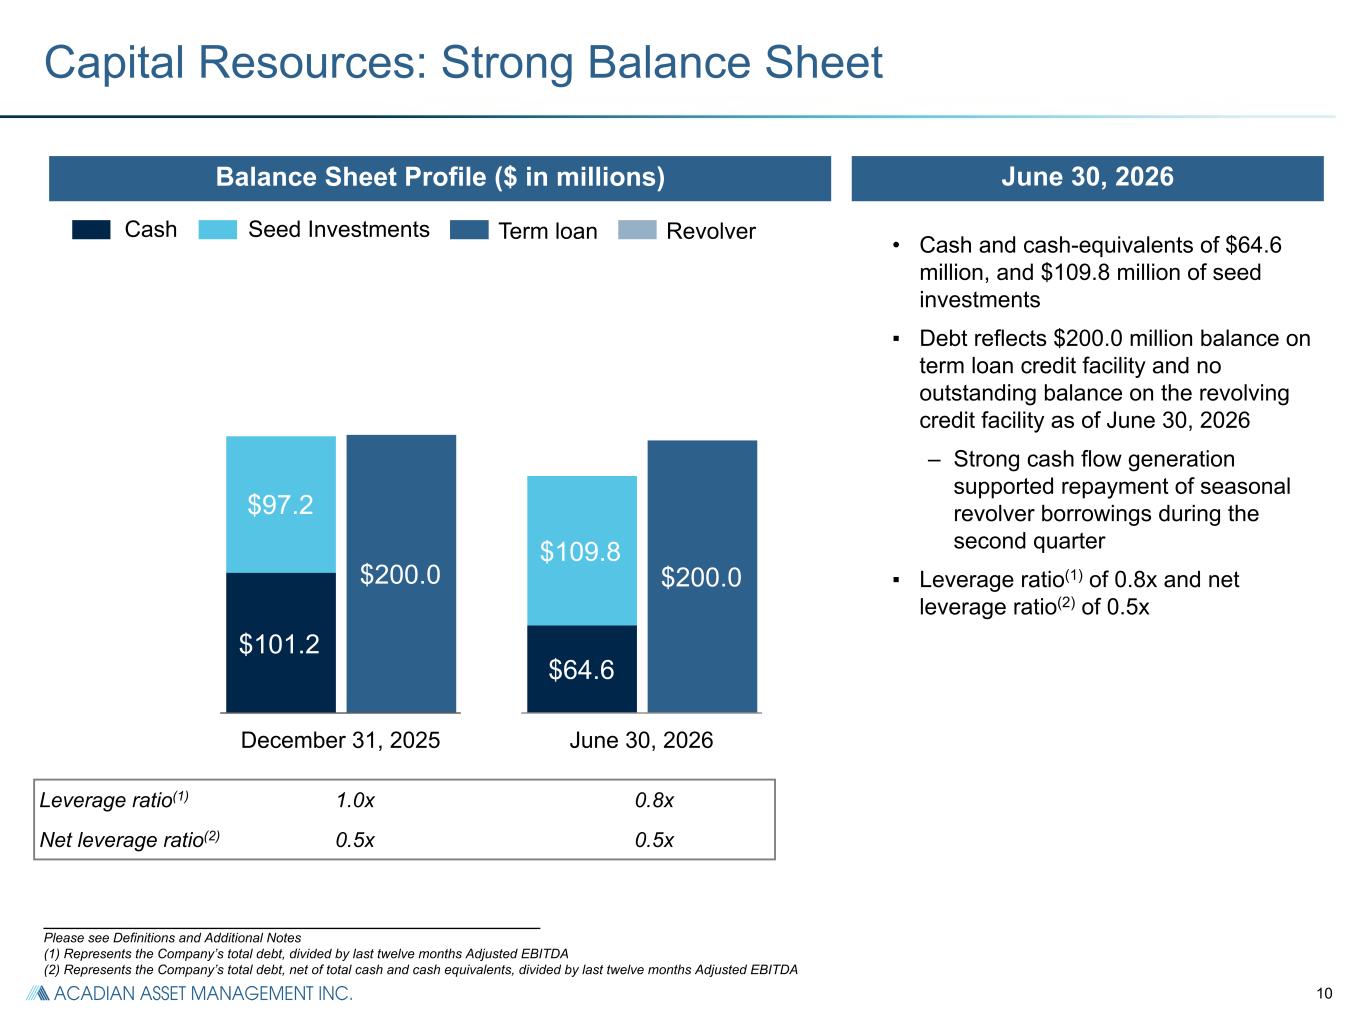
10 $64.6 $109.8 $200.0 ___________________________________________________________ Please see Definitions and Additional Notes (1) Represents the Company’s total debt, divided by last twelve months Adjusted EBITDA (2) Represents the Company’s total debt, net of total cash and cash equivalents, divided by last twelve months Adjusted EBITDA Capital Resources: Strong Balance Sheet • Cash and cash-equivalents of $64.6 million, and $109.8 million of seed investments ▪ Debt reflects $200.0 million balance on term loan credit facility and no outstanding balance on the revolving credit facility as of June 30, 2026 – Strong cash flow generation supported repayment of seasonal revolver borrowings during the second quarter ▪ Leverage ratio(1) of 0.8x and net leverage ratio(2) of 0.5x June 30, 2026 $101.2 $97.2 $200.0 Term loanCash Balance Sheet Profile ($ in millions) Seed Investments Leverage ratio(1) 1.0x 0.8x Net leverage ratio(2) 0.5x 0.5x December 31, 2025 June 30, 2026 Revolver
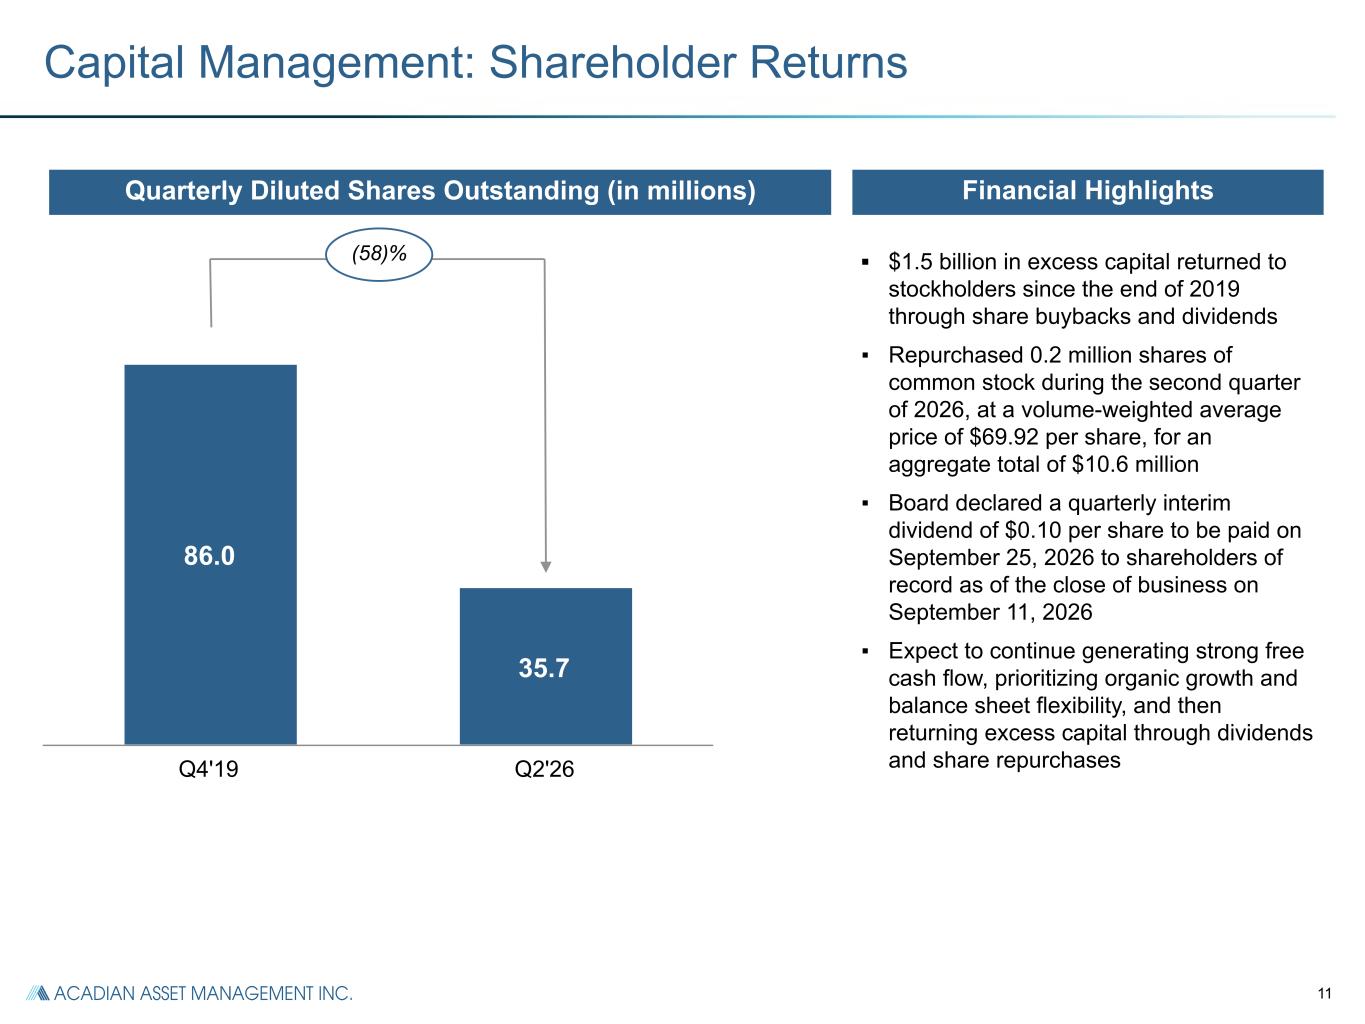
11 86.0 35.7 Q4'19 Q2'26 Capital Management: Shareholder Returns ▪ $1.5 billion in excess capital returned to stockholders since the end of 2019 through share buybacks and dividends ▪ Repurchased 0.2 million shares of common stock during the second quarter of 2026, at a volume-weighted average price of $69.92 per share, for an aggregate total of $10.6 million ▪ Board declared a quarterly interim dividend of $0.10 per share to be paid on September 25, 2026 to shareholders of record as of the close of business on September 11, 2026 ▪ Expect to continue generating strong free cash flow, prioritizing organic growth and balance sheet flexibility, and then returning excess capital through dividends and share repurchases Quarterly Diluted Shares Outstanding (in millions) Financial Highlights (58)%
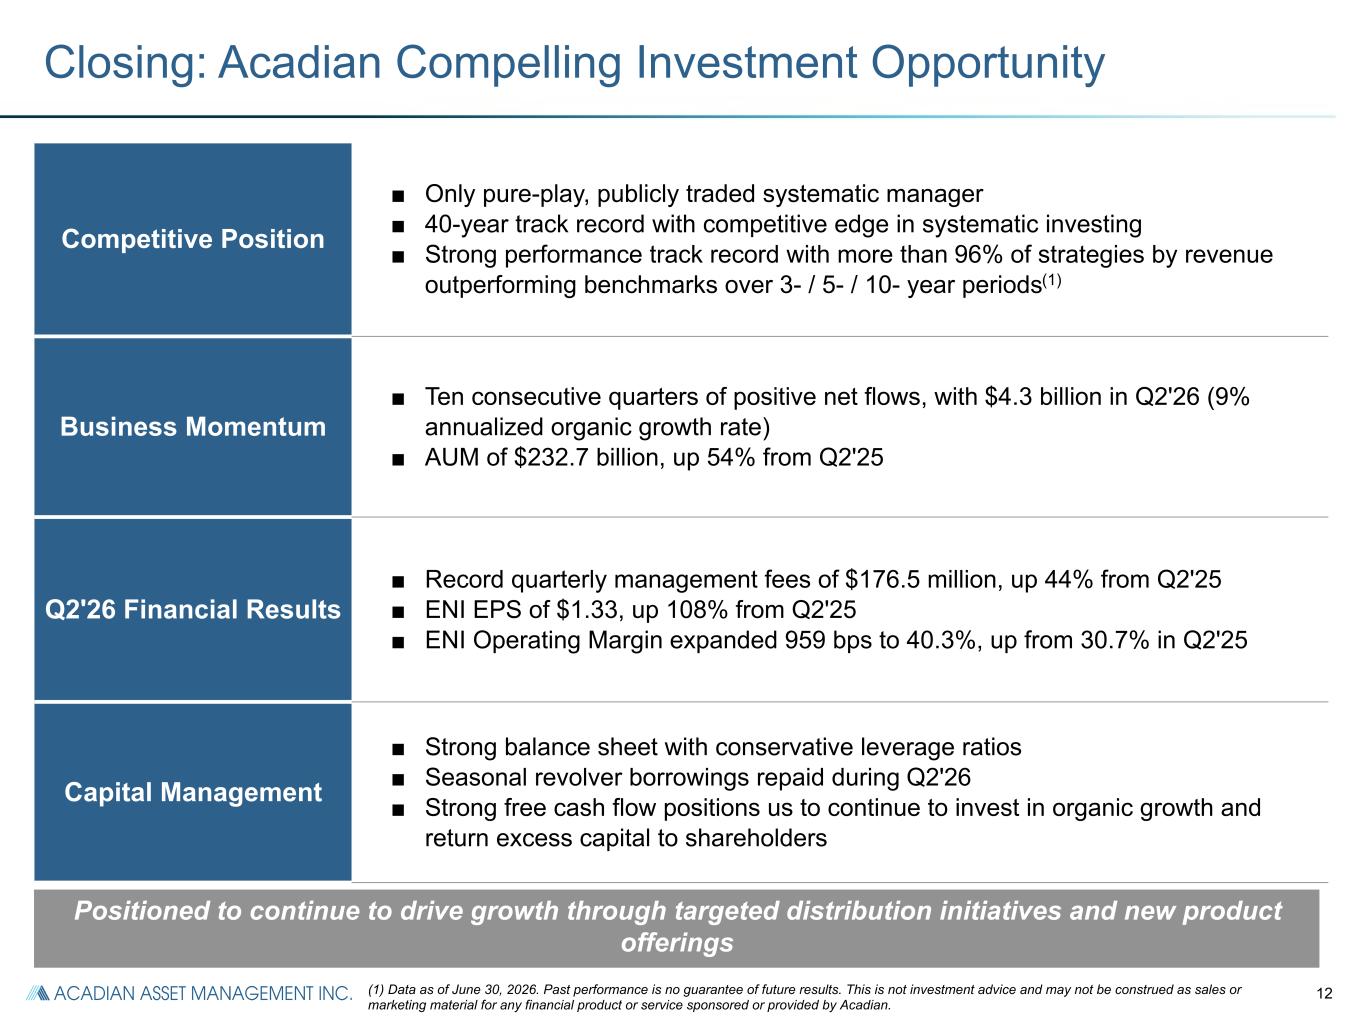
12 Closing: Acadian Compelling Investment Opportunity (1) Data as of June 30, 2026. Past performance is no guarantee of future results. This is not investment advice and may not be construed as sales or marketing material for any financial product or service sponsored or provided by Acadian. Competitive Position ■ Only pure-play, publicly traded systematic manager ■ 40-year track record with competitive edge in systematic investing ■ Strong performance track record with more than 96% of strategies by revenue outperforming benchmarks over 3- / 5- / 10- year periods(1) Business Momentum ■ Ten consecutive quarters of positive net flows, with $4.3 billion in Q2'26 (9% annualized organic growth rate) ■ AUM of $232.7 billion, up 54% from Q2'25 Q2'26 Financial Results ■ Record quarterly management fees of $176.5 million, up 44% from Q2'25 ■ ENI EPS of $1.33, up 108% from Q2'25 ■ ENI Operating Margin expanded 959 bps to 40.3%, up from 30.7% in Q2'25 Capital Management ■ Strong balance sheet with conservative leverage ratios ■ Seasonal revolver borrowings repaid during Q2'26 ■ Strong free cash flow positions us to continue to invest in organic growth and return excess capital to shareholders Positioned to continue to drive growth through targeted distribution initiatives and new product offerings
13 Supplemental Information, Reconciliations and Disclosures
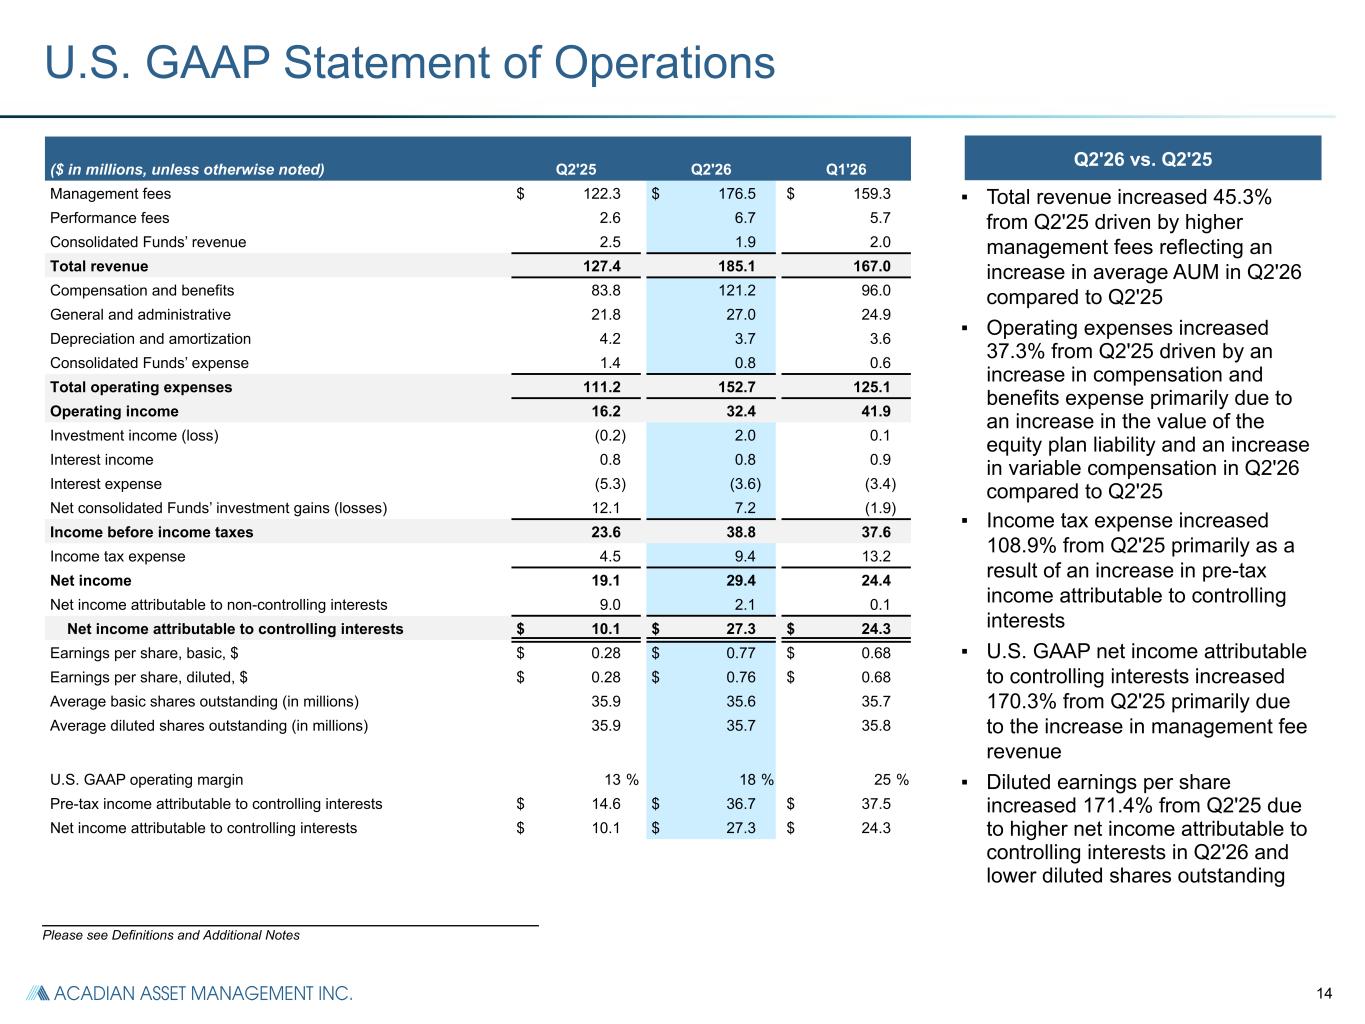
14 U.S. GAAP Statement of Operations ($ in millions, unless otherwise noted) Q2'25 Q2'26 Q1'26 Management fees $ 122.3 $ 176.5 $ 159.3 Performance fees 2.6 6.7 5.7 Consolidated Funds’ revenue 2.5 1.9 2.0 Total revenue 127.4 185.1 167.0 Compensation and benefits 83.8 121.2 96.0 General and administrative 21.8 27.0 24.9 Depreciation and amortization 4.2 3.7 3.6 Consolidated Funds’ expense 1.4 0.8 0.6 Total operating expenses 111.2 152.7 125.1 Operating income 16.2 32.4 41.9 Investment income (loss) (0.2) 2.0 0.1 Interest income 0.8 0.8 0.9 Interest expense (5.3) (3.6) (3.4) Net consolidated Funds’ investment gains (losses) 12.1 7.2 (1.9) Income before income taxes 23.6 38.8 37.6 Income tax expense 4.5 9.4 13.2 Net income 19.1 29.4 24.4 Net income attributable to non-controlling interests 9.0 2.1 0.1 Net income attributable to controlling interests $ 10.1 $ 27.3 $ 24.3 Earnings per share, basic, $ $ 0.28 $ 0.77 $ 0.68 Earnings per share, diluted, $ $ 0.28 $ 0.76 $ 0.68 Average basic shares outstanding (in millions) 35.9 35.6 35.7 Average diluted shares outstanding (in millions) 35.9 35.7 35.8 U.S. GAAP operating margin 13 % 18 % 25 % Pre-tax income attributable to controlling interests $ 14.6 $ 36.7 $ 37.5 Net income attributable to controlling interests $ 10.1 $ 27.3 $ 24.3 Q2'26 vs. Q2'25 ▪ Total revenue increased 45.3% from Q2'25 driven by higher management fees reflecting an increase in average AUM in Q2'26 compared to Q2'25 ▪ Operating expenses increased 37.3% from Q2'25 driven by an increase in compensation and benefits expense primarily due to an increase in the value of the equity plan liability and an increase in variable compensation in Q2'26 compared to Q2'25 ▪ Income tax expense increased 108.9% from Q2'25 primarily as a result of an increase in pre-tax income attributable to controlling interests ▪ U.S. GAAP net income attributable to controlling interests increased 170.3% from Q2'25 primarily due to the increase in management fee revenue ▪ Diluted earnings per share increased 171.4% from Q2'25 due to higher net income attributable to controlling interests in Q2'26 and lower diluted shares outstanding ___________________________________________________________ Please see Definitions and Additional Notes
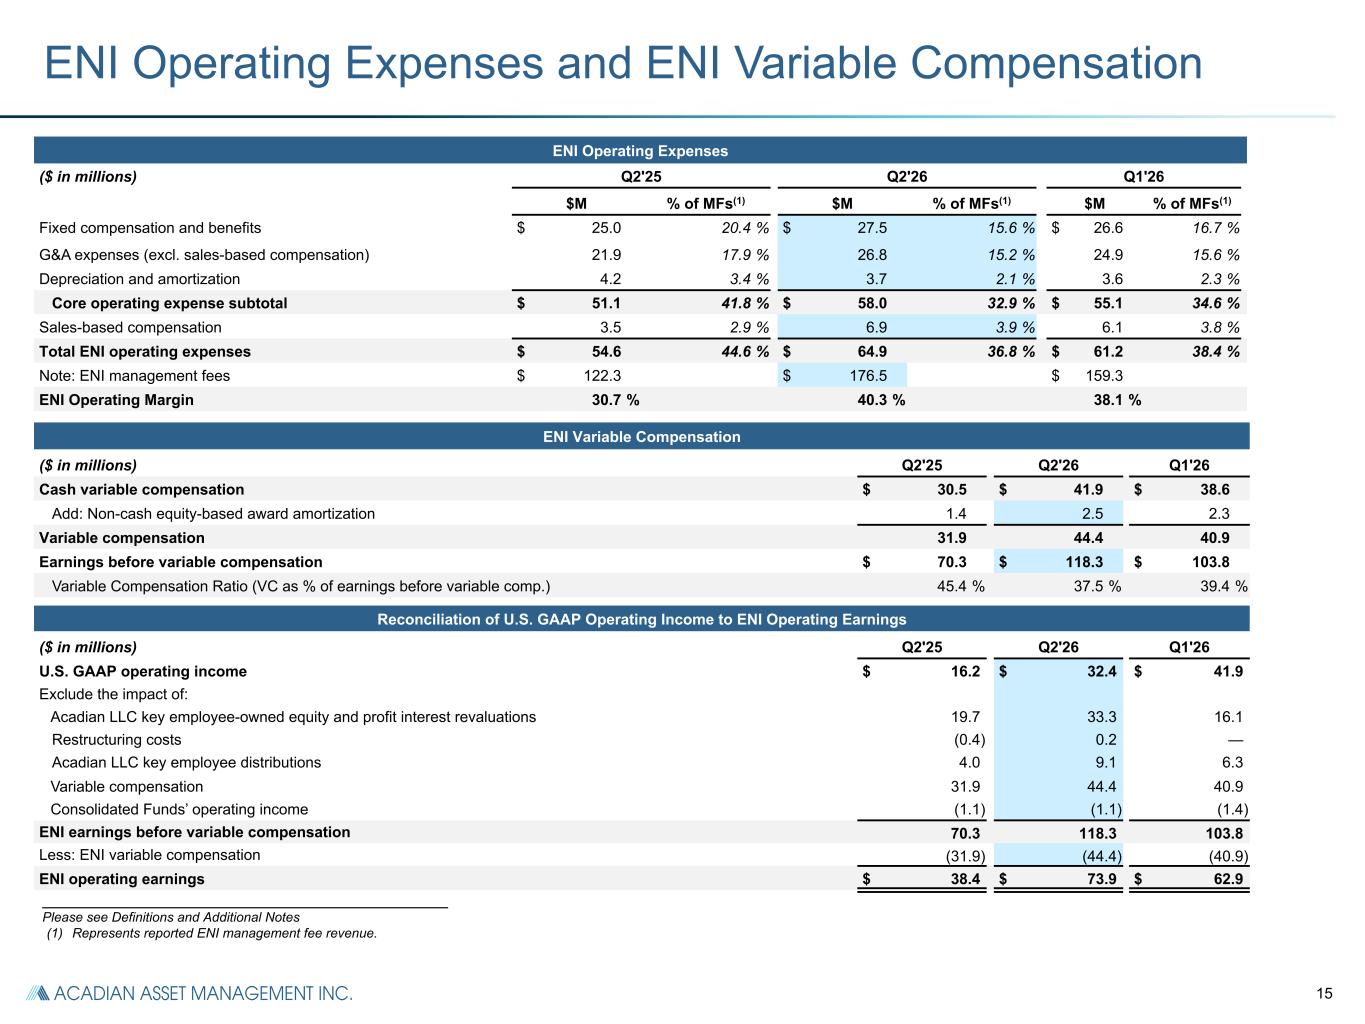
15 _______________________________________________________ Please see Definitions and Additional Notes (1) Represents reported ENI management fee revenue. ENI Operating Expenses and ENI Variable Compensation ENI Operating Expenses ($ in millions) Q2'25 Q2'26 Q1'26 $M % of MFs(1) $M % of MFs(1) $M % of MFs(1) Fixed compensation and benefits $ 25.0 20.4 % $ 27.5 15.6 % $ 26.6 16.7 % G&A expenses (excl. sales-based compensation) 21.9 17.9 % 26.8 15.2 % 24.9 15.6 % Depreciation and amortization 4.2 3.4 % 3.7 2.1 % 3.6 2.3 % Core operating expense subtotal $ 51.1 41.8 % $ 58.0 32.9 % $ 55.1 34.6 % Sales-based compensation 3.5 2.9 % 6.9 3.9 % 6.1 3.8 % Total ENI operating expenses $ 54.6 44.6 % $ 64.9 36.8 % $ 61.2 38.4 % Note: ENI management fees $ 122.3 $ 176.5 $ 159.3 ENI Operating Margin 30.7 % 40.3 % 38.1 % ENI Variable Compensation ($ in millions) Q2'25 Q2'26 Q1'26 Cash variable compensation $ 30.5 $ 41.9 $ 38.6 Add: Non-cash equity-based award amortization 1.4 2.5 2.3 Variable compensation 31.9 44.4 40.9 Earnings before variable compensation $ 70.3 $ 118.3 $ 103.8 Variable Compensation Ratio (VC as % of earnings before variable comp.) 45.4 % 37.5 % 39.4 % Reconciliation of U.S. GAAP Operating Income to ENI Operating Earnings ($ in millions) Q2'25 Q2'26 Q1'26 U.S. GAAP operating income $ 16.2 $ 32.4 $ 41.9 Exclude the impact of: Acadian LLC key employee-owned equity and profit interest revaluations 19.7 33.3 16.1 Restructuring costs (0.4) 0.2 — Acadian LLC key employee distributions 4.0 9.1 6.3 Variable compensation 31.9 44.4 40.9 Consolidated Funds’ operating income (1.1) (1.1) (1.4) ENI earnings before variable compensation 70.3 118.3 103.8 Less: ENI variable compensation (31.9) (44.4) (40.9) ENI operating earnings $ 38.4 $ 73.9 $ 62.9
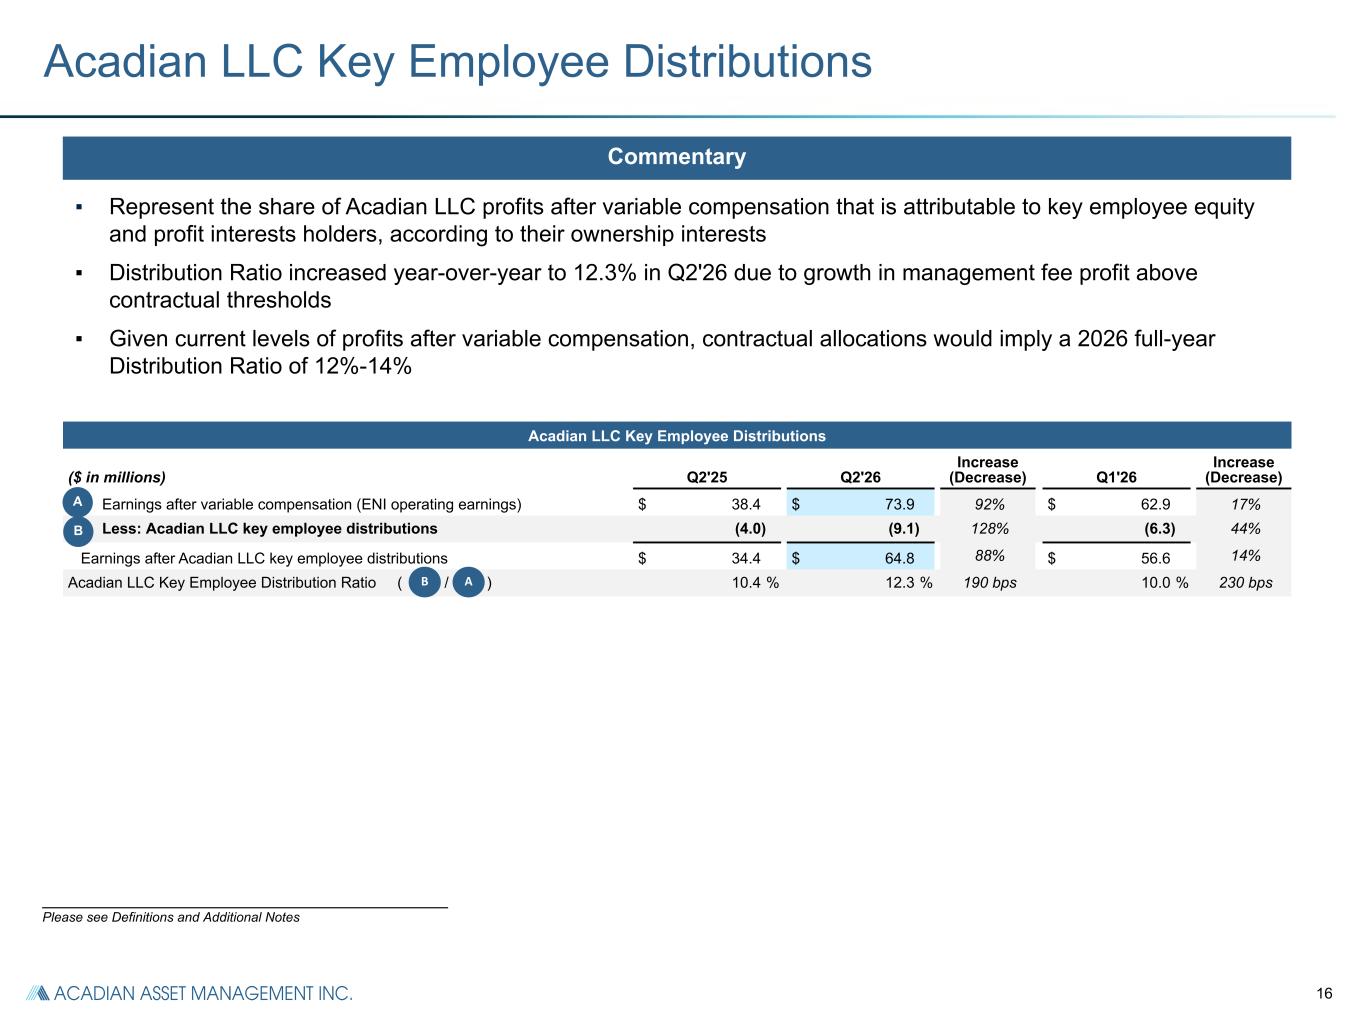
16 Acadian LLC Key Employee Distributions ($ in millions) Q2'25 Q2'26 Increase (Decrease) Q1'26 Increase (Decrease) Earnings after variable compensation (ENI operating earnings) $ 38.4 $ 73.9 92% $ 62.9 17% Less: Acadian LLC key employee distributions (4.0) (9.1) 128% (6.3) 44% Earnings after Acadian LLC key employee distributions $ 34.4 $ 64.8 88% $ 56.6 14% Acadian LLC Key Employee Distribution Ratio ( / ) 10.4 % 12.3 % 190 bps 10.0 % 230 bps ▪ Represent the share of Acadian LLC profits after variable compensation that is attributable to key employee equity and profit interests holders, according to their ownership interests ▪ Distribution Ratio increased year-over-year to 12.3% in Q2'26 due to growth in management fee profit above contractual thresholds ▪ Given current levels of profits after variable compensation, contractual allocations would imply a 2026 full-year Distribution Ratio of 12%-14% Acadian LLC Key Employee Distributions A A B B Commentary _______________________________________________________ Please see Definitions and Additional Notes
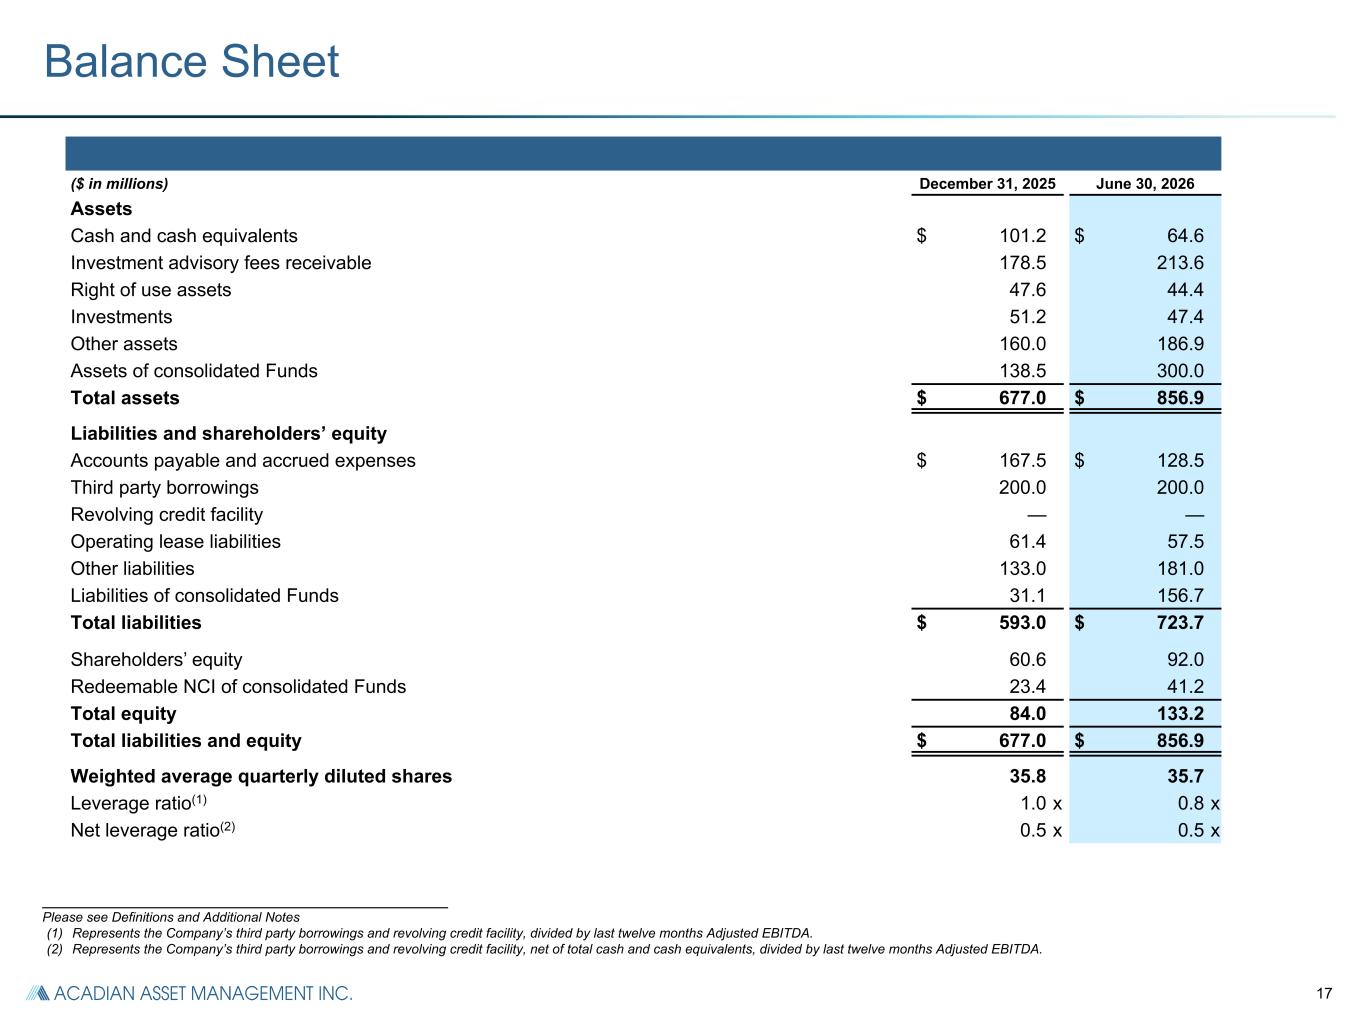
17 ($ in millions) December 31, 2025 June 30, 2026 Assets Cash and cash equivalents $ 101.2 $ 64.6 Investment advisory fees receivable 178.5 213.6 Right of use assets 47.6 44.4 Investments 51.2 47.4 Other assets 160.0 186.9 Assets of consolidated Funds 138.5 300.0 Total assets $ 677.0 $ 856.9 Liabilities and shareholders’ equity Accounts payable and accrued expenses $ 167.5 $ 128.5 Third party borrowings 200.0 200.0 Revolving credit facility — — Operating lease liabilities 61.4 57.5 Other liabilities 133.0 181.0 Liabilities of consolidated Funds 31.1 156.7 Total liabilities $ 593.0 $ 723.7 Shareholders’ equity 60.6 92.0 Redeemable NCI of consolidated Funds 23.4 41.2 Total equity 84.0 133.2 Total liabilities and equity $ 677.0 $ 856.9 Weighted average quarterly diluted shares 35.8 35.7 Leverage ratio(1) 1.0 x 0.8 x Net leverage ratio(2) 0.5 x 0.5 x Balance Sheet _______________________________________________________ Please see Definitions and Additional Notes (1) Represents the Company’s third party borrowings and revolving credit facility, divided by last twelve months Adjusted EBITDA. (2) Represents the Company’s third party borrowings and revolving credit facility, net of total cash and cash equivalents, divided by last twelve months Adjusted EBITDA.
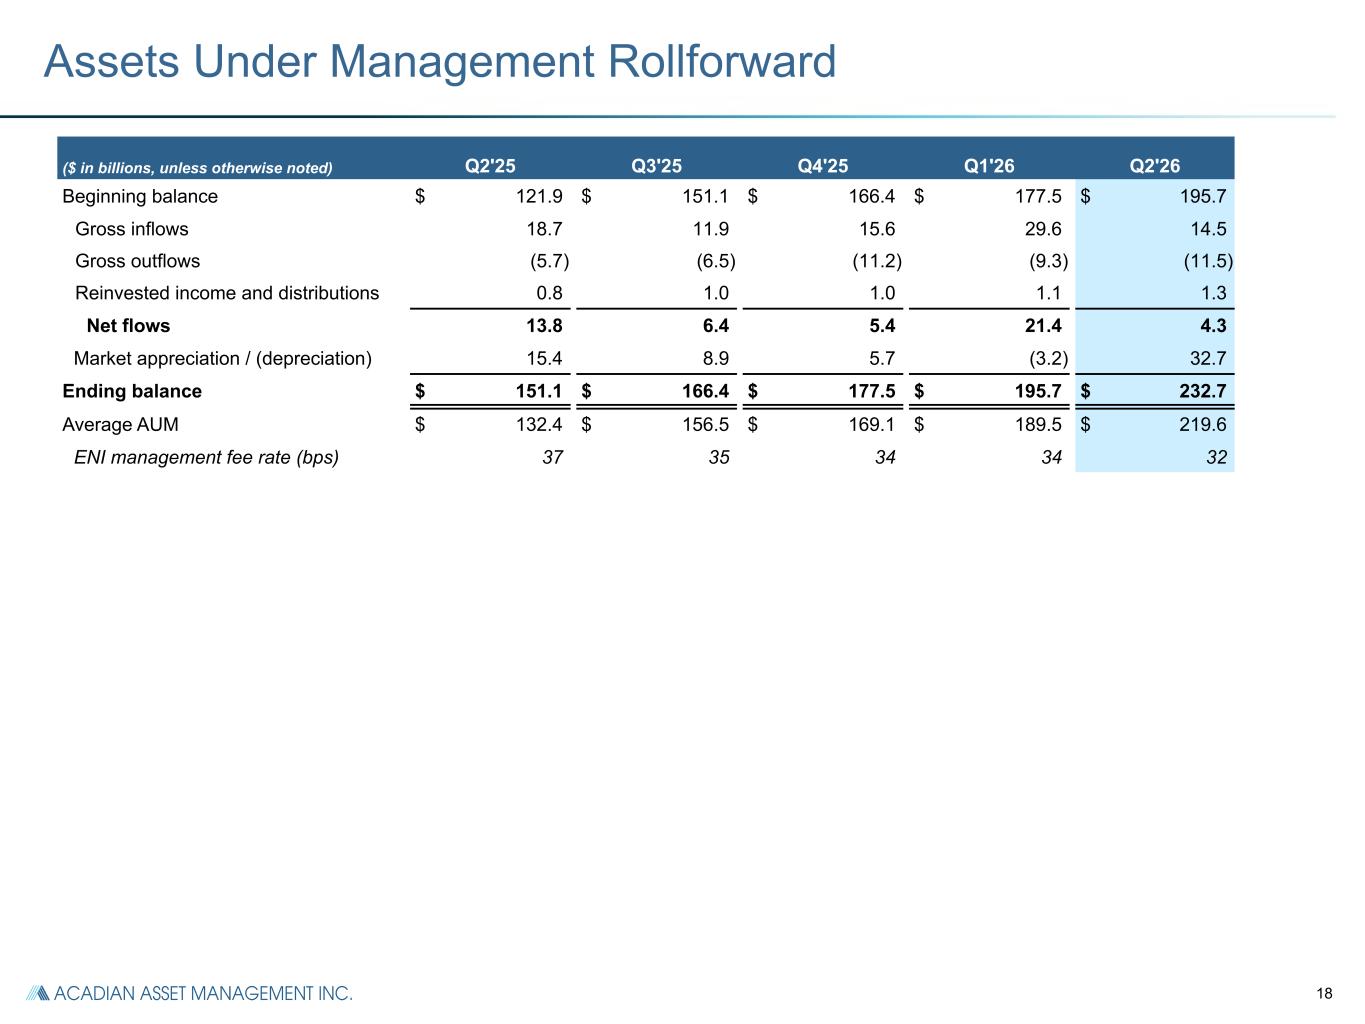
18 Assets Under Management Rollforward ($ in billions, unless otherwise noted) Q2'25 Q3'25 Q4'25 Q1'26 Q2'26 Beginning balance $ 121.9 $ 151.1 $ 166.4 $ 177.5 $ 195.7 Gross inflows 18.7 11.9 15.6 29.6 14.5 Gross outflows (5.7) (6.5) (11.2) (9.3) (11.5) Reinvested income and distributions 0.8 1.0 1.0 1.1 1.3 Net flows 13.8 6.4 5.4 21.4 4.3 Market appreciation / (depreciation) 15.4 8.9 5.7 (3.2) 32.7 Ending balance $ 151.1 $ 166.4 $ 177.5 $ 195.7 $ 232.7 Average AUM $ 132.4 $ 156.5 $ 169.1 $ 189.5 $ 219.6 ENI management fee rate (bps) 37 35 34 34 32
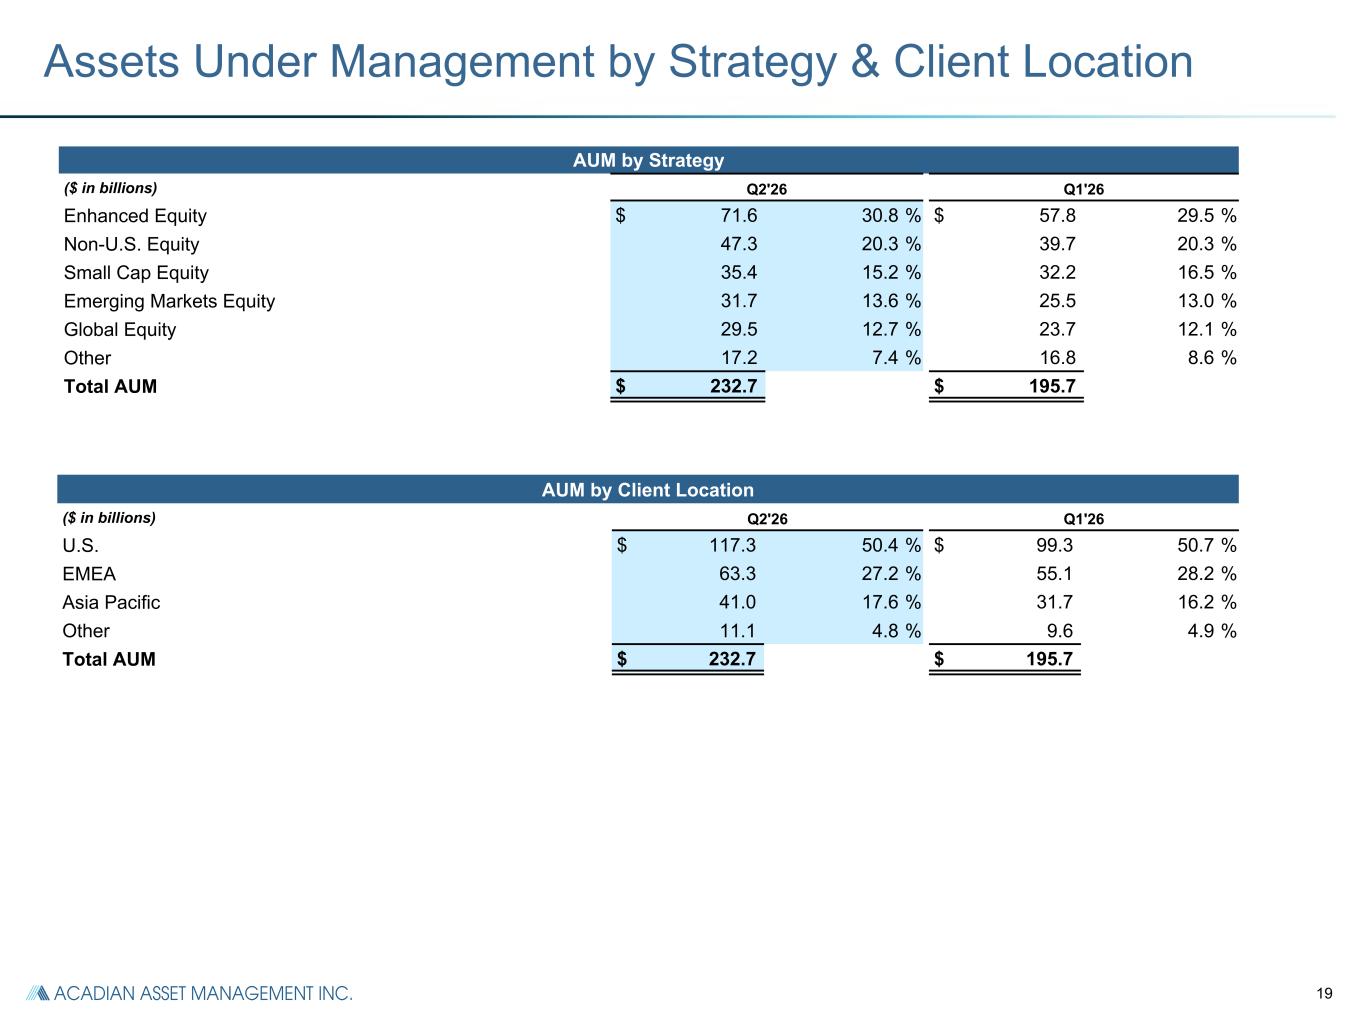
19 AUM by Client Location ($ in billions) Q2'26 Q1'26 U.S. $ 117.3 50.4 % $ 99.3 50.7 % EMEA 63.3 27.2 % 55.1 28.2 % Asia Pacific 41.0 17.6 % 31.7 16.2 % Other 11.1 4.8 % 9.6 4.9 % Total AUM $ 232.7 $ 195.7 AUM by Strategy ($ in billions) Q2'26 Q1'26 Enhanced Equity $ 71.6 30.8 % $ 57.8 29.5 % Non-U.S. Equity 47.3 20.3 % 39.7 20.3 % Small Cap Equity 35.4 15.2 % 32.2 16.5 % Emerging Markets Equity 31.7 13.6 % 25.5 13.0 % Global Equity 29.5 12.7 % 23.7 12.1 % Other 17.2 7.4 % 16.8 8.6 % Total AUM $ 232.7 $ 195.7 Assets Under Management by Strategy & Client Location
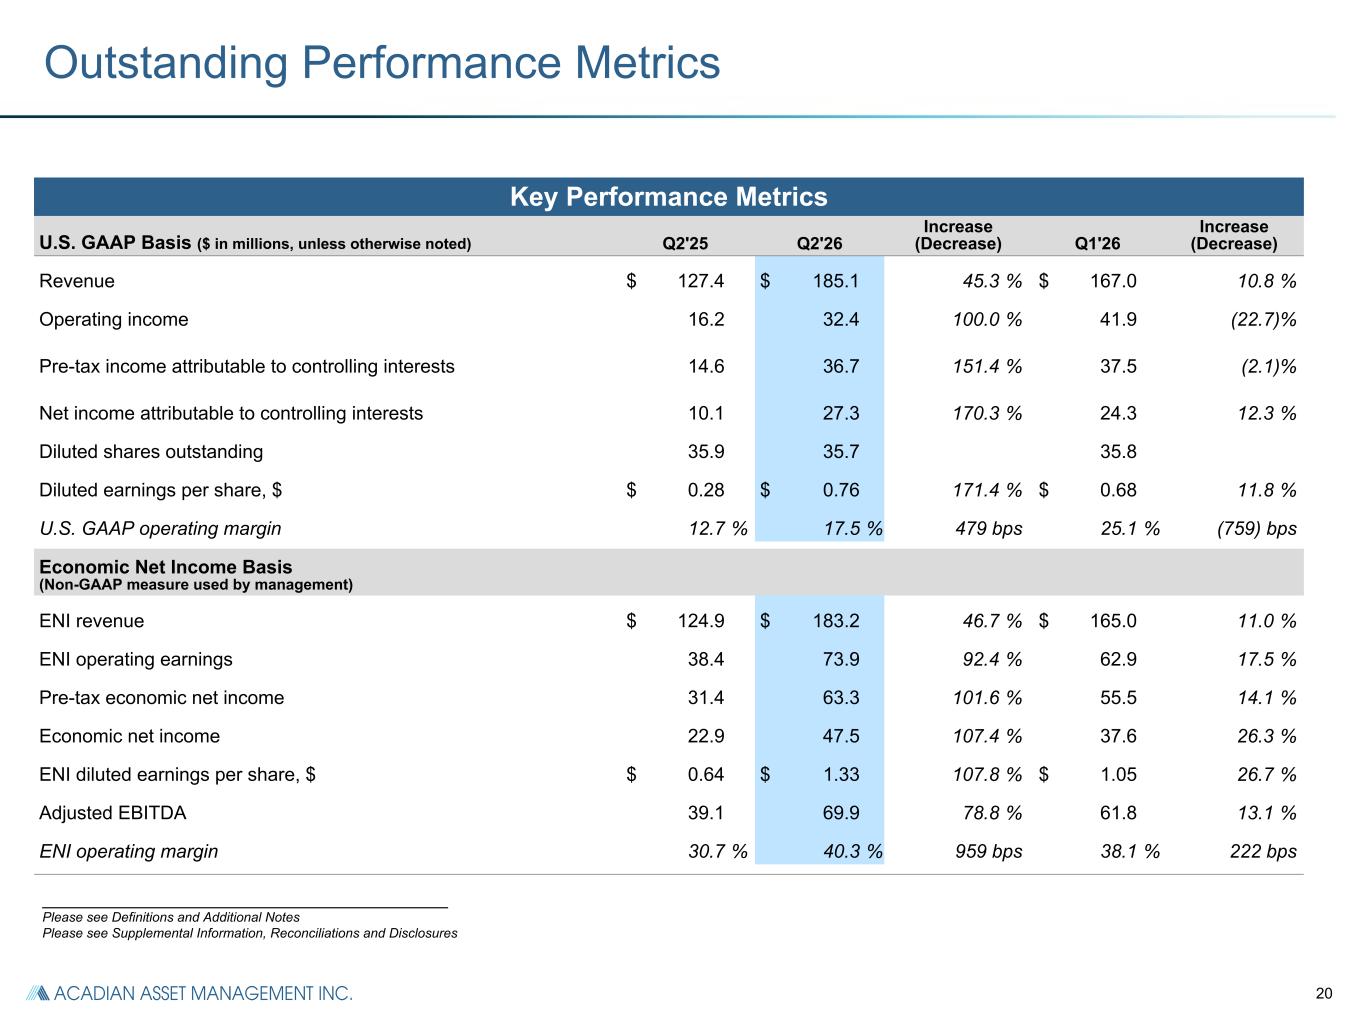
20 Outstanding Performance Metrics Key Performance Metrics U.S. GAAP Basis ($ in millions, unless otherwise noted) Q2'25 Q2'26 Increase (Decrease) Q1'26 Increase (Decrease) Revenue $ 127.4 $ 185.1 45.3 % $ 167.0 10.8 % Operating income 16.2 32.4 100.0 % 41.9 (22.7) % Pre-tax income attributable to controlling interests 14.6 36.7 151.4 % 37.5 (2.1) % Net income attributable to controlling interests 10.1 27.3 170.3 % 24.3 12.3 % Diluted shares outstanding 35.9 35.7 35.8 Diluted earnings per share, $ $ 0.28 $ 0.76 171.4 % $ 0.68 11.8 % U.S. GAAP operating margin 12.7 % 17.5 % 479 bps 25.1 % (759) bps Economic Net Income Basis (Non-GAAP measure used by management) ENI revenue $ 124.9 $ 183.2 46.7 % $ 165.0 11.0 % ENI operating earnings 38.4 73.9 92.4 % 62.9 17.5 % Pre-tax economic net income 31.4 63.3 101.6 % 55.5 14.1 % Economic net income 22.9 47.5 107.4 % 37.6 26.3 % ENI diluted earnings per share, $ $ 0.64 $ 1.33 107.8 % $ 1.05 26.7 % Adjusted EBITDA 39.1 69.9 78.8 % 61.8 13.1 % ENI operating margin 30.7 % 40.3 % 959 bps 38.1 % 222 bps _______________________________________________________ Please see Definitions and Additional Notes Please see Supplemental Information, Reconciliations and Disclosures
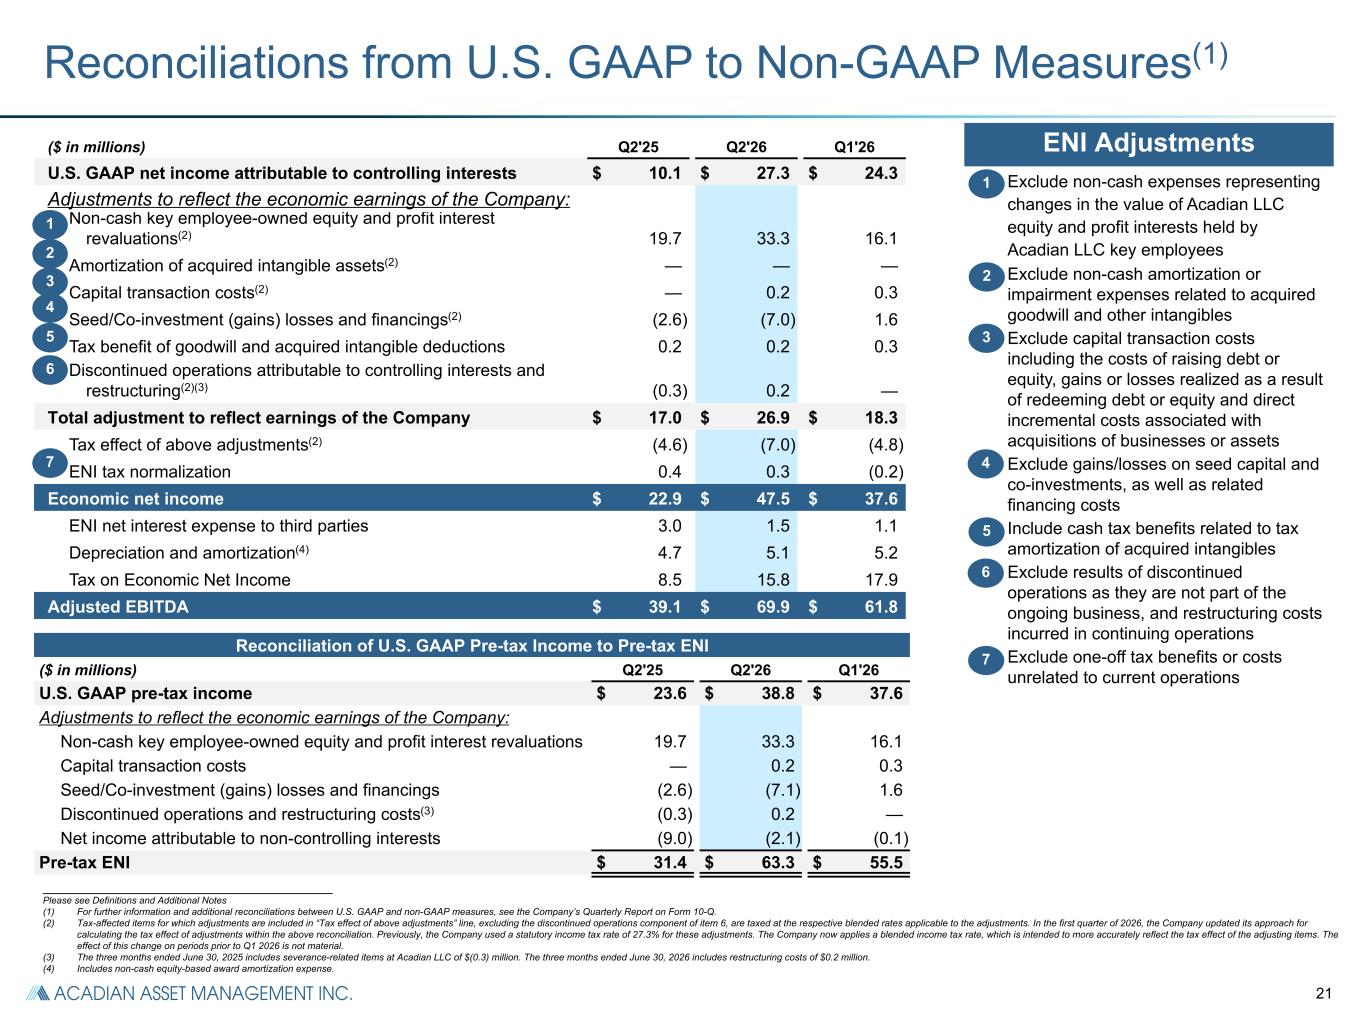
21 ($ in millions) Q2'25 Q2'26 Q1'26 U.S. GAAP net income attributable to controlling interests $ 10.1 $ 27.3 $ 24.3 Adjustments to reflect the economic earnings of the Company: Non-cash key employee-owned equity and profit interest revaluations(2) 19.7 33.3 16.1 Amortization of acquired intangible assets(2) — — — Capital transaction costs(2) — 0.2 0.3 Seed/Co-investment (gains) losses and financings(2) (2.6) (7.0) 1.6 Tax benefit of goodwill and acquired intangible deductions 0.2 0.2 0.3 Discontinued operations attributable to controlling interests and restructuring(2)(3) (0.3) 0.2 — Total adjustment to reflect earnings of the Company $ 17.0 $ 26.9 $ 18.3 Tax effect of above adjustments(2) (4.6) (7.0) (4.8) ENI tax normalization 0.4 0.3 (0.2) Economic net income $ 22.9 $ 47.5 $ 37.6 ENI net interest expense to third parties 3.0 1.5 1.1 Depreciation and amortization(4) 4.7 5.1 5.2 Tax on Economic Net Income 8.5 15.8 17.9 Adjusted EBITDA $ 39.1 $ 69.9 $ 61.8 Reconciliations from U.S. GAAP to Non-GAAP Measures(1) i Exclude non-cash expenses representing changes in the value of Acadian LLC equity and profit interests held by Acadian LLC key employees ii Exclude non-cash amortization or impairment expenses related to acquired goodwill and other intangibles iii Exclude capital transaction costs including the costs of raising debt or equity, gains or losses realized as a result of redeeming debt or equity and direct incremental costs associated with acquisitions of businesses or assets iv Exclude gains/losses on seed capital and co-investments, as well as related financing costs v Include cash tax benefits related to tax amortization of acquired intangibles vi Exclude results of discontinued operations as they are not part of the ongoing business, and restructuring costs incurred in continuing operations vii Exclude one-off tax benefits or costs unrelated to current operations ENI Adjustments 1 3 2 3 4 5 7 6 2 1 4 5 6 7 _______________________________________________________ Please see Definitions and Additional Notes (1) For further information and additional reconciliations between U.S. GAAP and non-GAAP measures, see the Company’s Quarterly Report on Form 10-Q. (2) Tax-affected items for which adjustments are included in “Tax effect of above adjustments” line, excluding the discontinued operations component of item 6, are taxed at the respective blended rates applicable to the adjustments. In the first quarter of 2026, the Company updated its approach for calculating the tax effect of adjustments within the above reconciliation. Previously, the Company used a statutory income tax rate of 27.3% for these adjustments. The Company now applies a blended income tax rate, which is intended to more accurately reflect the tax effect of the adjusting items. The effect of this change on periods prior to Q1 2026 is not material. (3) The three months ended June 30, 2025 includes severance-related items at Acadian LLC of $(0.3) million. The three months ended June 30, 2026 includes restructuring costs of $0.2 million. (4) Includes non-cash equity-based award amortization expense. Reconciliation of U.S. GAAP Pre-tax Income to Pre-tax ENI ($ in millions) Q2'25 Q2'26 Q1'26 U.S. GAAP pre-tax income $ 23.6 $ 38.8 $ 37.6 Adjustments to reflect the economic earnings of the Company: Non-cash key employee-owned equity and profit interest revaluations 19.7 33.3 16.1 Capital transaction costs — 0.2 0.3 Seed/Co-investment (gains) losses and financings (2.6) (7.1) 1.6 Discontinued operations and restructuring costs(3) (0.3) 0.2 — Net income attributable to non-controlling interests (9.0) (2.1) (0.1) Pre-tax ENI $ 31.4 $ 63.3 $ 55.5
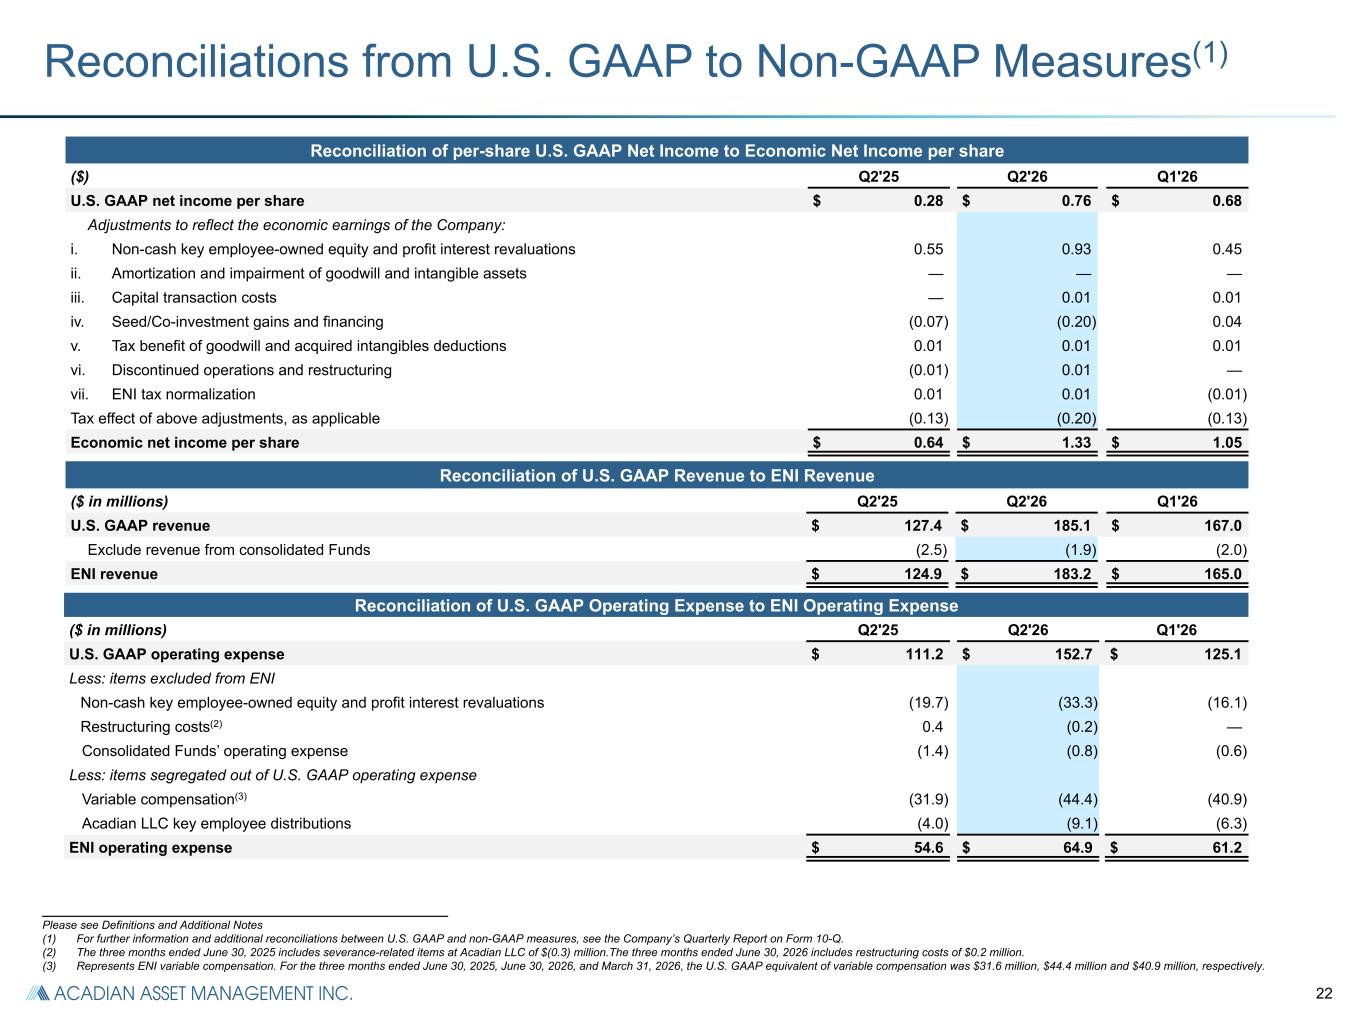
22 Reconciliations from U.S. GAAP to Non-GAAP Measures(1) Reconciliation of per-share U.S. GAAP Net Income to Economic Net Income per share ($) Q2'25 Q2'26 Q1'26 U.S. GAAP net income per share $ 0.28 $ 0.76 $ 0.68 Adjustments to reflect the economic earnings of the Company: i. Non-cash key employee-owned equity and profit interest revaluations 0.55 0.93 0.45 ii. Amortization and impairment of goodwill and intangible assets — — — iii. Capital transaction costs — 0.01 0.01 iv. Seed/Co-investment gains and financing (0.07) (0.20) 0.04 v. Tax benefit of goodwill and acquired intangibles deductions 0.01 0.01 0.01 vi. Discontinued operations and restructuring (0.01) 0.01 — vii. ENI tax normalization 0.01 0.01 (0.01) Tax effect of above adjustments, as applicable (0.13) (0.20) (0.13) Economic net income per share $ 0.64 $ 1.33 $ 1.05 Reconciliation of U.S. GAAP Revenue to ENI Revenue ($ in millions) Q2'25 Q2'26 Q1'26 U.S. GAAP revenue $ 127.4 $ 185.1 $ 167.0 Exclude revenue from consolidated Funds (2.5) (1.9) (2.0) ENI revenue $ 124.9 $ 183.2 $ 165.0 _______________________________________________________ Please see Definitions and Additional Notes (1) For further information and additional reconciliations between U.S. GAAP and non-GAAP measures, see the Company’s Quarterly Report on Form 10-Q. (2) The three months ended June 30, 2025 includes severance-related items at Acadian LLC of $(0.3) million.The three months ended June 30, 2026 includes restructuring costs of $0.2 million. (3) Represents ENI variable compensation. For the three months ended June 30, 2025, June 30, 2026, and March 31, 2026, the U.S. GAAP equivalent of variable compensation was $31.6 million, $44.4 million and $40.9 million, respectively. Reconciliation of U.S. GAAP Operating Expense to ENI Operating Expense ($ in millions) Q2'25 Q2'26 Q1'26 U.S. GAAP operating expense $ 111.2 $ 152.7 $ 125.1 Less: items excluded from ENI Non-cash key employee-owned equity and profit interest revaluations (19.7) (33.3) (16.1) Restructuring costs(2) 0.4 (0.2) — Consolidated Funds’ operating expense (1.4) (0.8) (0.6) Less: items segregated out of U.S. GAAP operating expense Variable compensation(3) (31.9) (44.4) (40.9) Acadian LLC key employee distributions (4.0) (9.1) (6.3) ENI operating expense $ 54.6 $ 64.9 $ 61.2
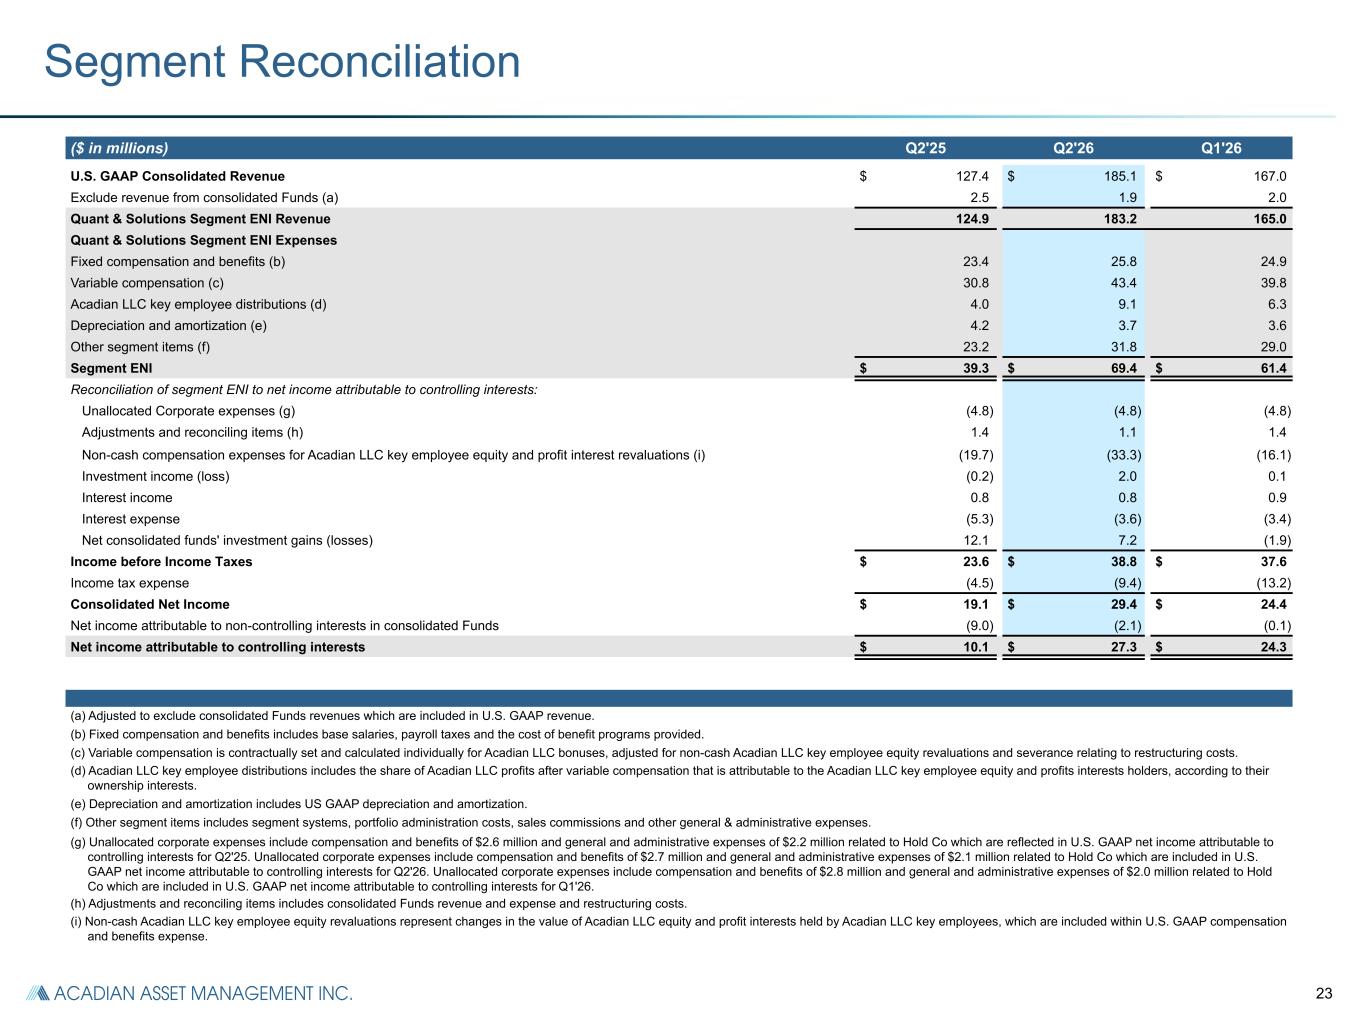
23 Segment Reconciliation ($ in millions) Q2'25 Q2'26 Q1'26 U.S. GAAP Consolidated Revenue $ 127.4 $ 185.1 $ 167.0 Exclude revenue from consolidated Funds (a) 2.5 1.9 2.0 Quant & Solutions Segment ENI Revenue 124.9 183.2 165.0 Quant & Solutions Segment ENI Expenses Fixed compensation and benefits (b) 23.4 25.8 24.9 Variable compensation (c) 30.8 43.4 39.8 Acadian LLC key employee distributions (d) 4.0 9.1 6.3 Depreciation and amortization (e) 4.2 3.7 3.6 Other segment items (f) 23.2 31.8 29.0 Segment ENI $ 39.3 $ 69.4 $ 61.4 Reconciliation of segment ENI to net income attributable to controlling interests: Unallocated Corporate expenses (g) (4.8) (4.8) (4.8) Adjustments and reconciling items (h) 1.4 1.1 1.4 Non-cash compensation expenses for Acadian LLC key employee equity and profit interest revaluations (i) (19.7) (33.3) (16.1) Investment income (loss) (0.2) 2.0 0.1 Interest income 0.8 0.8 0.9 Interest expense (5.3) (3.6) (3.4) Net consolidated funds' investment gains (losses) 12.1 7.2 (1.9) Income before Income Taxes $ 23.6 $ 38.8 $ 37.6 Income tax expense (4.5) (9.4) (13.2) Consolidated Net Income $ 19.1 $ 29.4 $ 24.4 Net income attributable to non-controlling interests in consolidated Funds (9.0) (2.1) (0.1) Net income attributable to controlling interests $ 10.1 $ 27.3 $ 24.3 (a) Adjusted to exclude consolidated Funds revenues which are included in U.S. GAAP revenue. (b) Fixed compensation and benefits includes base salaries, payroll taxes and the cost of benefit programs provided. (c) Variable compensation is contractually set and calculated individually for Acadian LLC bonuses, adjusted for non-cash Acadian LLC key employee equity revaluations and severance relating to restructuring costs. (d) Acadian LLC key employee distributions includes the share of Acadian LLC profits after variable compensation that is attributable to the Acadian LLC key employee equity and profits interests holders, according to their ownership interests. (e) Depreciation and amortization includes US GAAP depreciation and amortization. (f) Other segment items includes segment systems, portfolio administration costs, sales commissions and other general & administrative expenses. (g) Unallocated corporate expenses include compensation and benefits of $2.6 million and general and administrative expenses of $2.2 million related to Hold Co which are reflected in U.S. GAAP net income attributable to controlling interests for Q2'25. Unallocated corporate expenses include compensation and benefits of $2.7 million and general and administrative expenses of $2.1 million related to Hold Co which are included in U.S. GAAP net income attributable to controlling interests for Q2'26. Unallocated corporate expenses include compensation and benefits of $2.8 million and general and administrative expenses of $2.0 million related to Hold Co which are included in U.S. GAAP net income attributable to controlling interests for Q1'26. (h) Adjustments and reconciling items includes consolidated Funds revenue and expense and restructuring costs. (i) Non-cash Acadian LLC key employee equity revaluations represent changes in the value of Acadian LLC equity and profit interests held by Acadian LLC key employees, which are included within U.S. GAAP compensation and benefits expense.
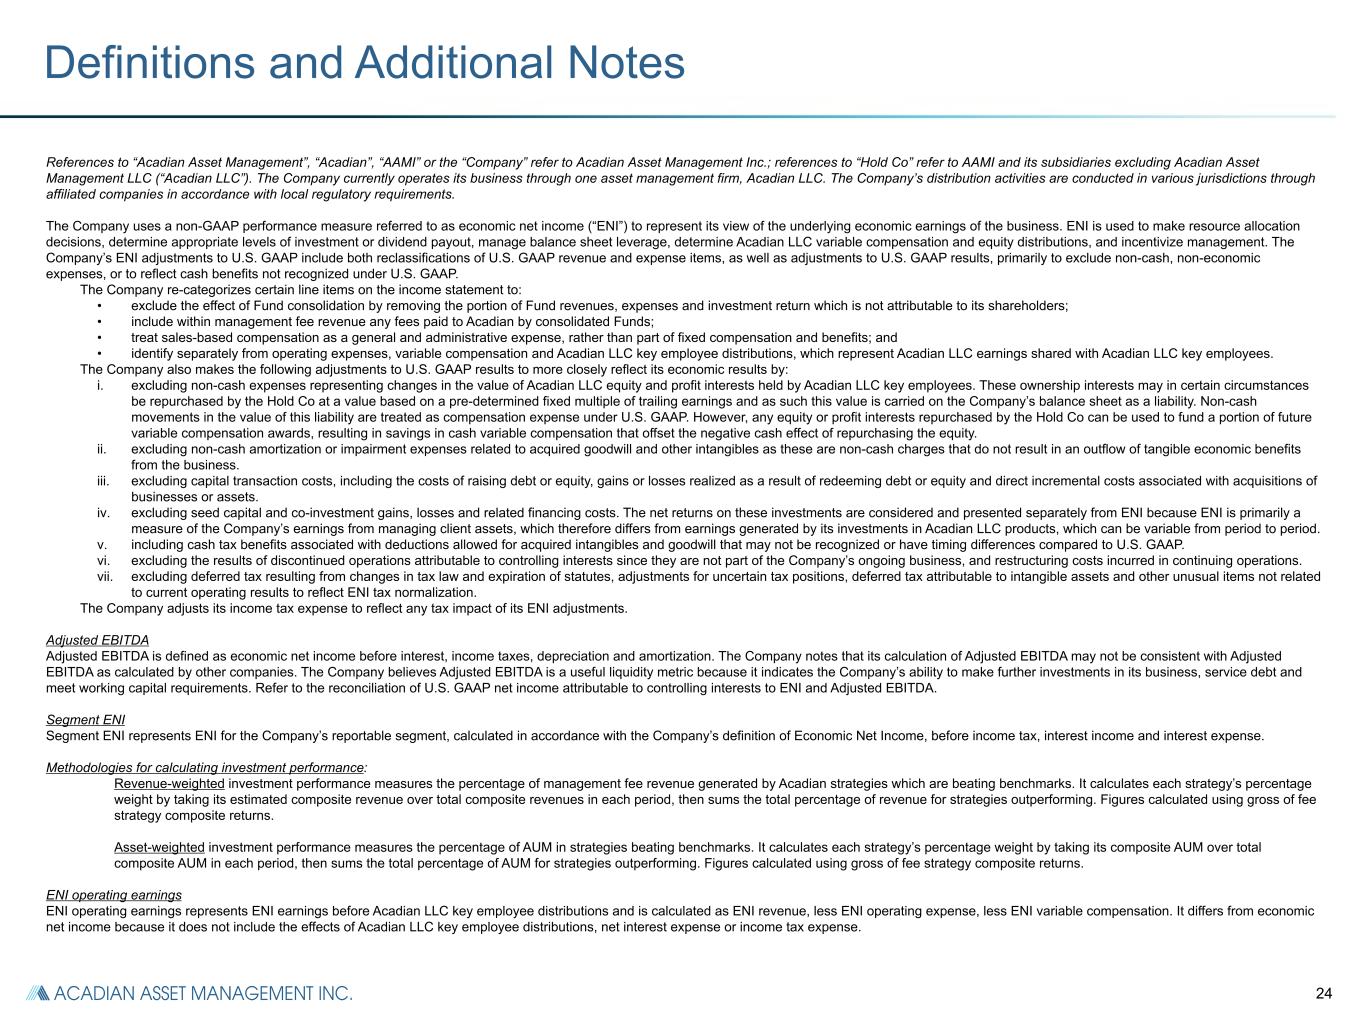
24 References to “Acadian Asset Management”, “Acadian”, “AAMI” or the “Company” refer to Acadian Asset Management Inc.; references to “Hold Co” refer to AAMI and its subsidiaries excluding Acadian Asset Management LLC (“Acadian LLC”). The Company currently operates its business through one asset management firm, Acadian LLC. The Company’s distribution activities are conducted in various jurisdictions through affiliated companies in accordance with local regulatory requirements. The Company uses a non-GAAP performance measure referred to as economic net income (“ENI”) to represent its view of the underlying economic earnings of the business. ENI is used to make resource allocation decisions, determine appropriate levels of investment or dividend payout, manage balance sheet leverage, determine Acadian LLC variable compensation and equity distributions, and incentivize management. The Company’s ENI adjustments to U.S. GAAP include both reclassifications of U.S. GAAP revenue and expense items, as well as adjustments to U.S. GAAP results, primarily to exclude non-cash, non-economic expenses, or to reflect cash benefits not recognized under U.S. GAAP. The Company re-categorizes certain line items on the income statement to: • exclude the effect of Fund consolidation by removing the portion of Fund revenues, expenses and investment return which is not attributable to its shareholders; • include within management fee revenue any fees paid to Acadian by consolidated Funds; • treat sales-based compensation as a general and administrative expense, rather than part of fixed compensation and benefits; and • identify separately from operating expenses, variable compensation and Acadian LLC key employee distributions, which represent Acadian LLC earnings shared with Acadian LLC key employees. The Company also makes the following adjustments to U.S. GAAP results to more closely reflect its economic results by: i. excluding non-cash expenses representing changes in the value of Acadian LLC equity and profit interests held by Acadian LLC key employees. These ownership interests may in certain circumstances be repurchased by the Hold Co at a value based on a pre-determined fixed multiple of trailing earnings and as such this value is carried on the Company’s balance sheet as a liability. Non-cash movements in the value of this liability are treated as compensation expense under U.S. GAAP. However, any equity or profit interests repurchased by the Hold Co can be used to fund a portion of future variable compensation awards, resulting in savings in cash variable compensation that offset the negative cash effect of repurchasing the equity. ii. excluding non-cash amortization or impairment expenses related to acquired goodwill and other intangibles as these are non-cash charges that do not result in an outflow of tangible economic benefits from the business. iii. excluding capital transaction costs, including the costs of raising debt or equity, gains or losses realized as a result of redeeming debt or equity and direct incremental costs associated with acquisitions of businesses or assets. iv. excluding seed capital and co-investment gains, losses and related financing costs. The net returns on these investments are considered and presented separately from ENI because ENI is primarily a measure of the Company’s earnings from managing client assets, which therefore differs from earnings generated by its investments in Acadian LLC products, which can be variable from period to period. v. including cash tax benefits associated with deductions allowed for acquired intangibles and goodwill that may not be recognized or have timing differences compared to U.S. GAAP. vi. excluding the results of discontinued operations attributable to controlling interests since they are not part of the Company’s ongoing business, and restructuring costs incurred in continuing operations. vii. excluding deferred tax resulting from changes in tax law and expiration of statutes, adjustments for uncertain tax positions, deferred tax attributable to intangible assets and other unusual items not related to current operating results to reflect ENI tax normalization. The Company adjusts its income tax expense to reflect any tax impact of its ENI adjustments. Adjusted EBITDA Adjusted EBITDA is defined as economic net income before interest, income taxes, depreciation and amortization. The Company notes that its calculation of Adjusted EBITDA may not be consistent with Adjusted EBITDA as calculated by other companies. The Company believes Adjusted EBITDA is a useful liquidity metric because it indicates the Company’s ability to make further investments in its business, service debt and meet working capital requirements. Refer to the reconciliation of U.S. GAAP net income attributable to controlling interests to ENI and Adjusted EBITDA. Segment ENI Segment ENI represents ENI for the Company’s reportable segment, calculated in accordance with the Company’s definition of Economic Net Income, before income tax, interest income and interest expense. Methodologies for calculating investment performance: Revenue-weighted investment performance measures the percentage of management fee revenue generated by Acadian strategies which are beating benchmarks. It calculates each strategy’s percentage weight by taking its estimated composite revenue over total composite revenues in each period, then sums the total percentage of revenue for strategies outperforming. Figures calculated using gross of fee strategy composite returns. Asset-weighted investment performance measures the percentage of AUM in strategies beating benchmarks. It calculates each strategy’s percentage weight by taking its composite AUM over total composite AUM in each period, then sums the total percentage of AUM for strategies outperforming. Figures calculated using gross of fee strategy composite returns. ENI operating earnings ENI operating earnings represents ENI earnings before Acadian LLC key employee distributions and is calculated as ENI revenue, less ENI operating expense, less ENI variable compensation. It differs from economic net income because it does not include the effects of Acadian LLC key employee distributions, net interest expense or income tax expense. Definitions and Additional Notes
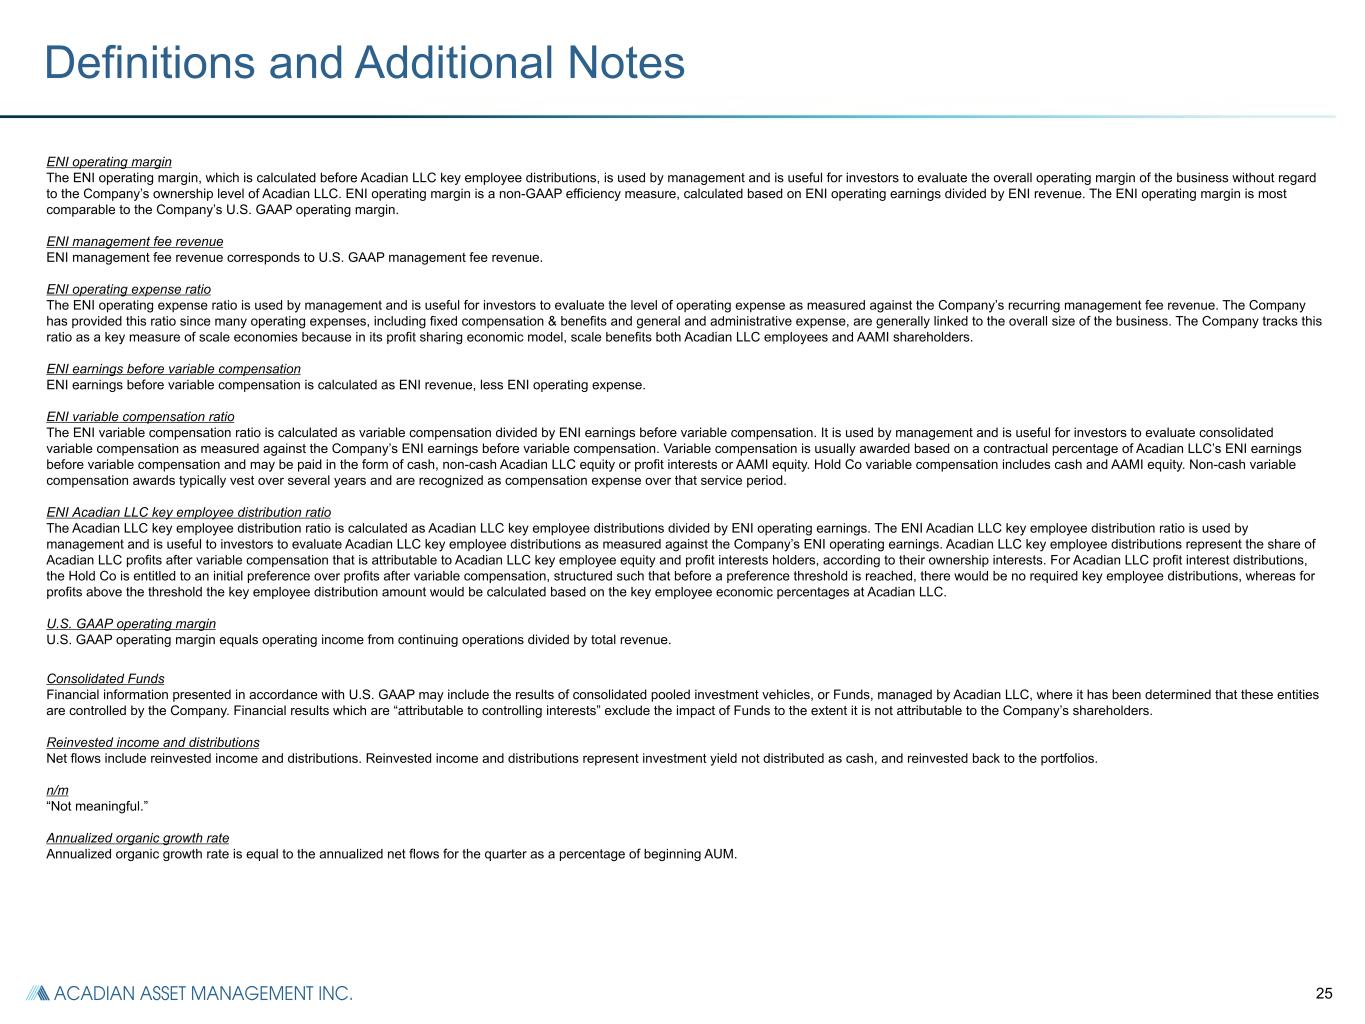
25 Definitions and Additional Notes ENI operating margin The ENI operating margin, which is calculated before Acadian LLC key employee distributions, is used by management and is useful for investors to evaluate the overall operating margin of the business without regard to the Company’s ownership level of Acadian LLC. ENI operating margin is a non-GAAP efficiency measure, calculated based on ENI operating earnings divided by ENI revenue. The ENI operating margin is most comparable to the Company’s U.S. GAAP operating margin. ENI management fee revenue ENI management fee revenue corresponds to U.S. GAAP management fee revenue. ENI operating expense ratio The ENI operating expense ratio is used by management and is useful for investors to evaluate the level of operating expense as measured against the Company’s recurring management fee revenue. The Company has provided this ratio since many operating expenses, including fixed compensation & benefits and general and administrative expense, are generally linked to the overall size of the business. The Company tracks this ratio as a key measure of scale economies because in its profit sharing economic model, scale benefits both Acadian LLC employees and AAMI shareholders. ENI earnings before variable compensation ENI earnings before variable compensation is calculated as ENI revenue, less ENI operating expense. ENI variable compensation ratio The ENI variable compensation ratio is calculated as variable compensation divided by ENI earnings before variable compensation. It is used by management and is useful for investors to evaluate consolidated variable compensation as measured against the Company’s ENI earnings before variable compensation. Variable compensation is usually awarded based on a contractual percentage of Acadian LLC’s ENI earnings before variable compensation and may be paid in the form of cash, non-cash Acadian LLC equity or profit interests or AAMI equity. Hold Co variable compensation includes cash and AAMI equity. Non-cash variable compensation awards typically vest over several years and are recognized as compensation expense over that service period. ENI Acadian LLC key employee distribution ratio The Acadian LLC key employee distribution ratio is calculated as Acadian LLC key employee distributions divided by ENI operating earnings. The ENI Acadian LLC key employee distribution ratio is used by management and is useful to investors to evaluate Acadian LLC key employee distributions as measured against the Company’s ENI operating earnings. Acadian LLC key employee distributions represent the share of Acadian LLC profits after variable compensation that is attributable to Acadian LLC key employee equity and profit interests holders, according to their ownership interests. For Acadian LLC profit interest distributions, the Hold Co is entitled to an initial preference over profits after variable compensation, structured such that before a preference threshold is reached, there would be no required key employee distributions, whereas for profits above the threshold the key employee distribution amount would be calculated based on the key employee economic percentages at Acadian LLC. U.S. GAAP operating margin U.S. GAAP operating margin equals operating income from continuing operations divided by total revenue. Consolidated Funds Financial information presented in accordance with U.S. GAAP may include the results of consolidated pooled investment vehicles, or Funds, managed by Acadian LLC, where it has been determined that these entities are controlled by the Company. Financial results which are “attributable to controlling interests” exclude the impact of Funds to the extent it is not attributable to the Company’s shareholders. Reinvested income and distributions Net flows include reinvested income and distributions. Reinvested income and distributions represent investment yield not distributed as cash, and reinvested back to the portfolios. n/m “Not meaningful.” Annualized organic growth rate Annualized organic growth rate is equal to the annualized net flows for the quarter as a percentage of beginning AUM.