
FINANCIAL RESULTS Q2 2026 July 30, 2026 Exhibit 99.2
This presentation includes “forward -looking” statements that are subject to risks and uncertainties that could cause actual resu lts to differ materially from those expressed or implied in the statements. Statements that are not statements of historical facts are forward -looking statements and are made pursuant to the safe harbor p rovisions of the Private Securities Litigation Reform Act of 1995. Words such as “estimate,” “guidance,” “outlook,” “project,” “planned,” “contemplate,” “potential,” “possible,” “proposed,” “intend, ” “believe,” “anticipate,” “expect,” “may,” “will,” “would,” “should,” “could,” and similar expressions are intended to identify forward -looking statements. All statements other than statements of historical fact s included in this presentation are forward -looking statements. Forward - looking statements are based on the Company's current expectations and assumptions regarding its business, the economy and ot her future conditions. The Company cautions readers that any such forward -looking statements it makes are not guarantees of future performance and that actual results may differ materially from anticipated results or expectations expressed in its forward -looking statements as a result of a variety of factors, including many that are beyond the Company's control. Important factors that could cause actual results to differ materially from the Company’s expectations include: existing and unk nown future limitations on the ability of the Company's direct and indirect subsidiaries to make their cash flow available to the Company for payments on the Company's indebtedness or other pu rpo ses; reduced demands or prices for biofuels, biogases or renewable electricity; global demands for grain and oilseed commodities, which have exhibited volatility, and can impact the cost of fe ed for cattle, hogs and poultry, thus affecting available rendering feedstock and selling prices for the Company’s products; reductions in raw material volumes available to the Company due to weak margin s in the meat production industry as a result of higher feed costs, reduced consumer demand, reduced volume due to government regulations affecting animal production or other factors, reduced v olume from food service establishments, or otherwise; reduced demand for animal feed; reduced finished product prices, including a decline in fat, used cooking oil, protein or collagen (i ncl uding, without limitation, collagen peptides and gelatin) finished product prices; changes to government policies around the world relating to renewable fuels and greenhouse gas (“GHG”) emissions that ad versely affect prices, margins or markets (including for the DGD Joint Venture), including programs like renewable fuel standards, low carbon fuel standards, renewable fuel mandates and tax credit s f or biofuels, or loss or diminishment of tax credits due to failure to satisfy any eligibility requirements, including, without limitation, in relation to the blenders tax credit or the Clean Fuel s P roduction Credit (“CFPC”); climate related adverse results, including with respect to the Company’s climate goals, targets or commitments; possible product recall resulting from developments relating to the d isc overy of unauthorized adulterations to food or food additives or products which do not meet specifications, contract requirements or regulatory standards; the occurrence of 2009 H1N1 flu (in itially known as “Swine Flu”), highly pathogenic strains of avian influenza (collectively known as “Bird Flu”), severe acute respiratory syndrome (“SARS”), bovine spongiform encephalopathy (or “BSE”), por cine epidemic diarrhea (“PED”) or other diseases associated with animal origin in the U.S. or elsewhere, such as the outbreak of African Swine Fever in China and elsewhere; the occurrence of pandem ics , epidemics or disease outbreaks; unanticipated costs and/or reductions in raw material volumes related to the Company’s compliance with the existing or unforeseen new U.S. or foreign (including, w ithout limitation, China) regulations (including new or modified animal feed, Bird Flu, SARS, PED, BSE or ASF or similar or unanticipated regulations) affecting the industries in which the Company operat es or its value added products; risks associated with the DGD Joint Venture, including possible unanticipated operating disruptions and/or a decline in margins on the products produced by the DGD Joint Ven ture; risks and uncertainties relating to international sales and operations, including imposition of tariffs, quotas, trade barriers and other trade protections by the U.S. or foreign countr ies ; tax changes, such as global minimum tax measures, or issues related to administration, guidance and/or regulations associated with biofuel policies, including CFPC, and risks associated with the q ual ification and sale of such credits; difficulties or a significant disruption (including, without limitation, due to cyber -attack) in the Company’s information systems, networks or the confidentiality, avai lability or integrity of our data or failure to implement new systems and software successfully; risks relating to possible third -party claims of intellectual property infringement; increased contributi ons to the Company’s pension and benefit plans, including multiemployer and employer -sponsored defined benefit pension plans as required by legislation, regulation or other applicable U.S. or foreign law or resulting from a U.S. mass withdrawal event; bad debt write -offs; loss of or failure to obtain necessary permits and registrations; the potential for future terrorist attacks, responses to terrorist att acks and other acts of war or hostility, including the ongoing conflicts in the Middle East, Africa, North Korea and Ukraine; uncertainty regarding any administration changes in the U.S. or elsewhere aroun d t he world, including, without limitation, impacts to trade, tariffs and/or policies impacting the Company (such as biofuel policies and mandates); and/or unfavorable export or import markets. These fa cto rs, coupled with volatile prices for natural gas and diesel fuel, inflation rates, climate conditions, currency exchange fluctuations, general performance of the U.S. and global economies, di stu rbances in world financial, credit, commodities and stock markets, and any decline in consumer confidence and discretionary spending, including the inability of consumers and companies to obtain c red it due to lack of liquidity in the financial markets, among others, could cause actual results to vary materially from the forward -looking statements included in this presentation or negatively impact t he Company’s results of operations. Among other things, future profitability may be affected by the Company’s ability to grow its business, which faces competition from companies that may hav e substantially greater resources than the Company. The Company’s announced share repurchase program may be suspended or discontinued at any time and purchases of shares under the program are su bject to market conditions and other factors, which are likely to change from time to time. For more detailed discussion of these factors and other risks and uncertainties regarding the Compa ny, its business and the industries in which it operates, see the Company’s filings with the SEC, including the Risk Factors discussion in Item 1A of Part I of the Company's Annual Report on Form 10 -K for the fiscal year ended January 3, 2026. The Company cautions readers that all forward -looking statements speak only as of the date made, and the Company undertakes no obligation to update any forward -looking statements, whether as a result of changes in circumstances, new events or otherwise.
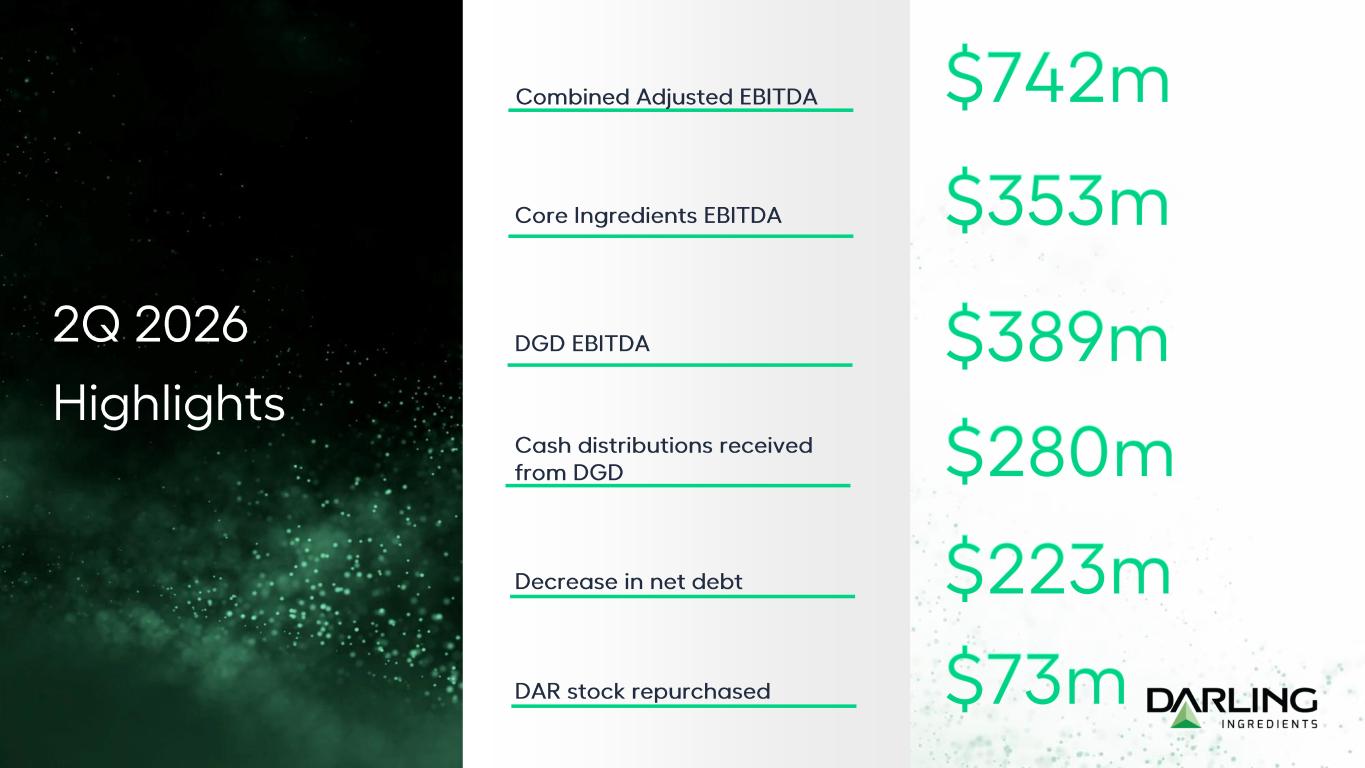
2Q 2026 Highlights Combined Adjusted EBITDA $742m Core Ingredients EBITDA $353m DGD EBITDA $389m Cash distributions received from DGD $280m $223m $73m Decrease in net debt DAR stock repurchased
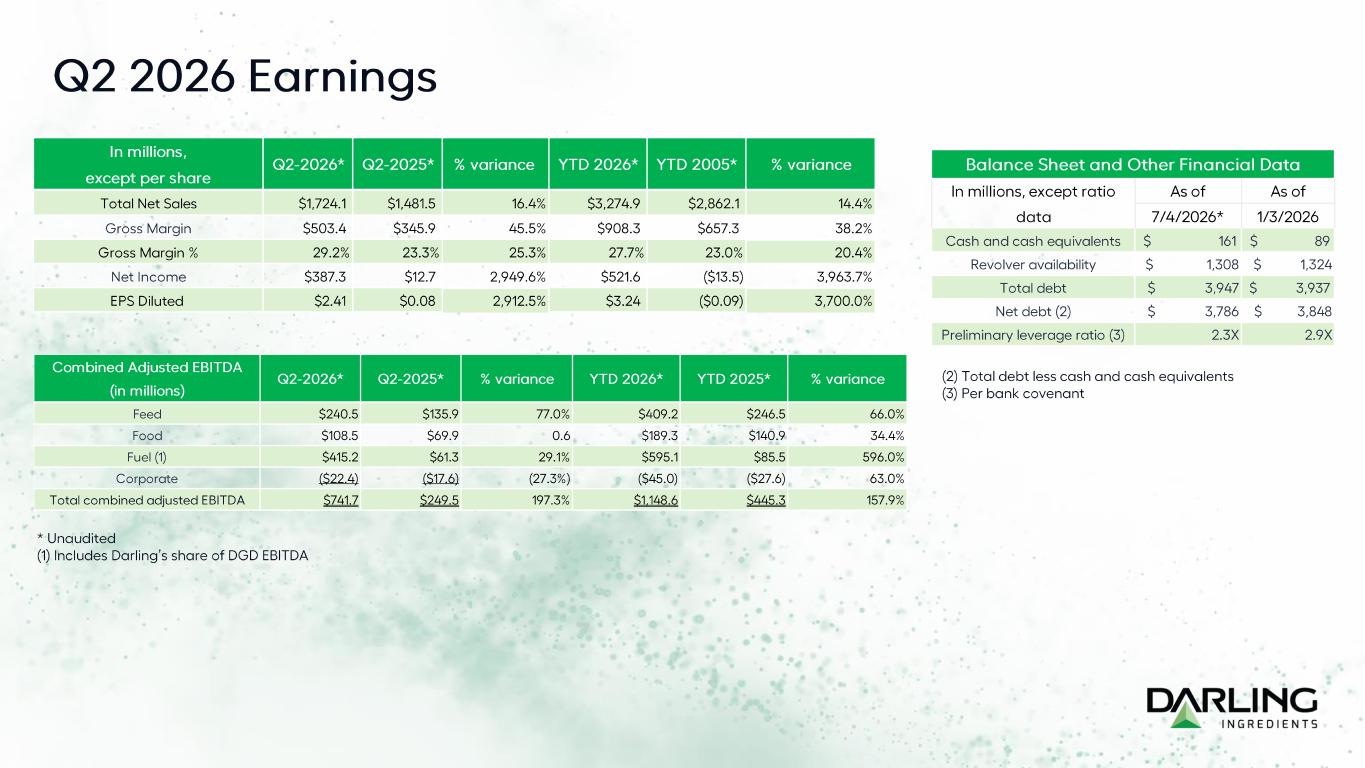
Q2 2026 Earnings In millions, except per share Q2-2026* Q2-2025* % variance YTD 2026* YTD 2005* % variance Total Net Sales $1,724.1 $1,481.5 16.4% $3,274.9 $2,862.1 14.4% Gross Margin $503.4 $345.9 45.5% $908.3 $657.3 38.2% Gross Margin % 29.2% 23.3% 25.3% 27.7% 23.0% 20.4% Net Income $387.3 $12.7 2,949.6% $521.6 ($13.5) 3,963.7% EPS Diluted $2.41 $0.08 2,912.5% $3.24 ($0.09) 3,700.0% Combined Adjusted EBITDA (in millions) Q2-2026* Q2-2025* % variance YTD 2026* YTD 2025* % variance Feed $240.5 $135.9 77.0% $409.2 $246.5 66.0% Food $108.5 $69.9 0.6 $189.3 $140.9 34.4% Fuel (1) $415.2 $61.3 29.1% $595.1 $85.5 596.0% Corporate ($22.4) ($17.6) (27.3%) ($45.0) ($27.6) 63.0% Total combined adjusted EBITDA $741.7 $249.5 197.3% $1,148.6 $445.3 157.9% As of As of 7/4/2026* 1/3/2026 Cash and cash equivalents $ 161 $ 89 Revolver availability $ 1,308 $ 1,324 Total debt $ 3,947 $ 3,937 Net debt (2) $ 3,786 $ 3,848 Preliminary leverage ratio (3) 2.3X 2.9X Balance Sheet and Other Financial Data In millions, except ratio data * Unaudited (1) Includes Darling’s share of DGD EBITDA (2) Total debt less cash and cash equivalents (3) Per bank covenant
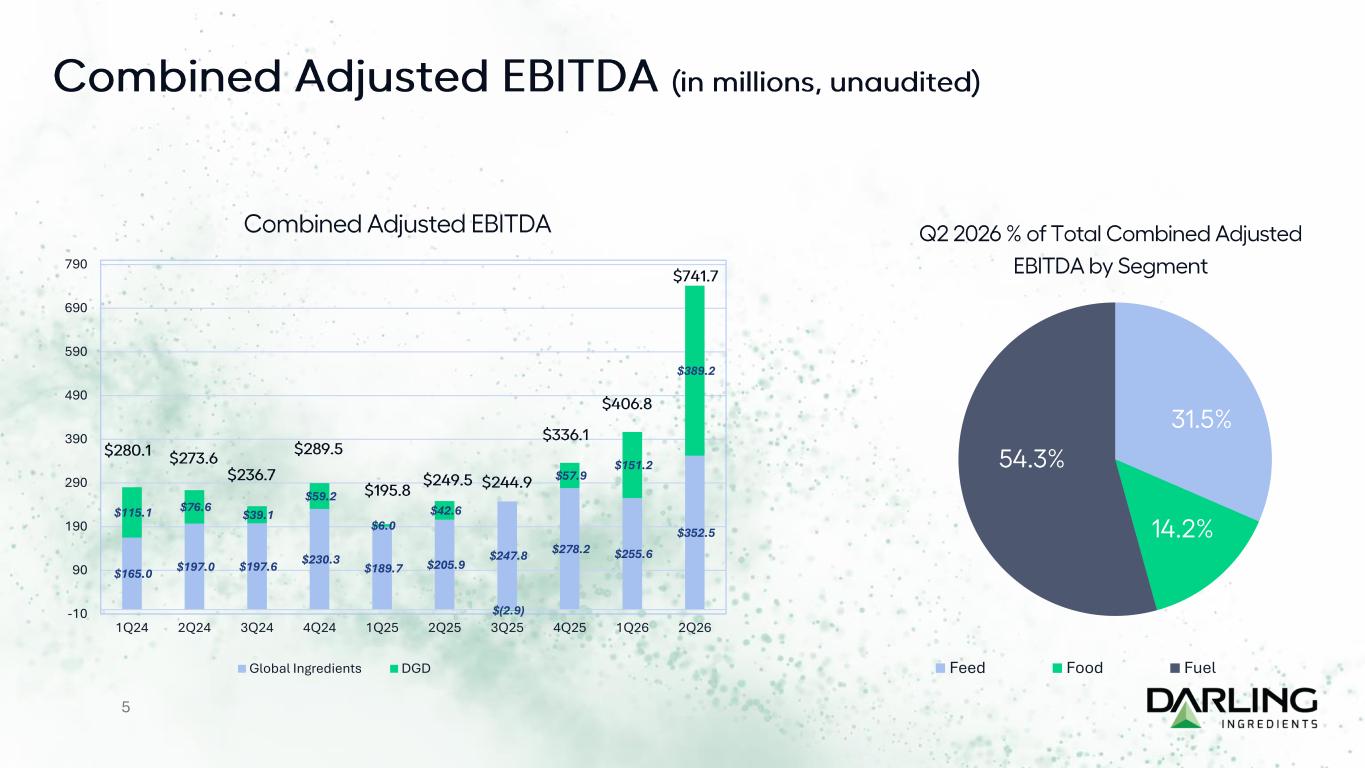
Combined Adjusted EBITDA (in millions, unaudited) 5 $165.0 $197.0 $197.6 $230.3 $189.7 $205.9 $247.8 $278.2 $255.6 $352.5 $115.1 $76.6 $39.1 $59.2 $6.0 $42.6 $(2.9) $57.9 $151.2 $389.2 -10 90 190 290 390 490 590 690 790 1Q24 2Q24 3Q24 4Q24 1Q25 2Q25 3Q25 4Q25 1Q26 2Q26 Combined Adjusted EBITDA Global Ingredients DGD $249.5 31.5% 14.2% 54.3% Q2 2026 % of Total Combined Adjusted EBITDA by Segment Feed Food Fuel $280.1 $273.6 $236.7 $289.5 $195.8 $244.9 $336.1 $406.8 $741.7
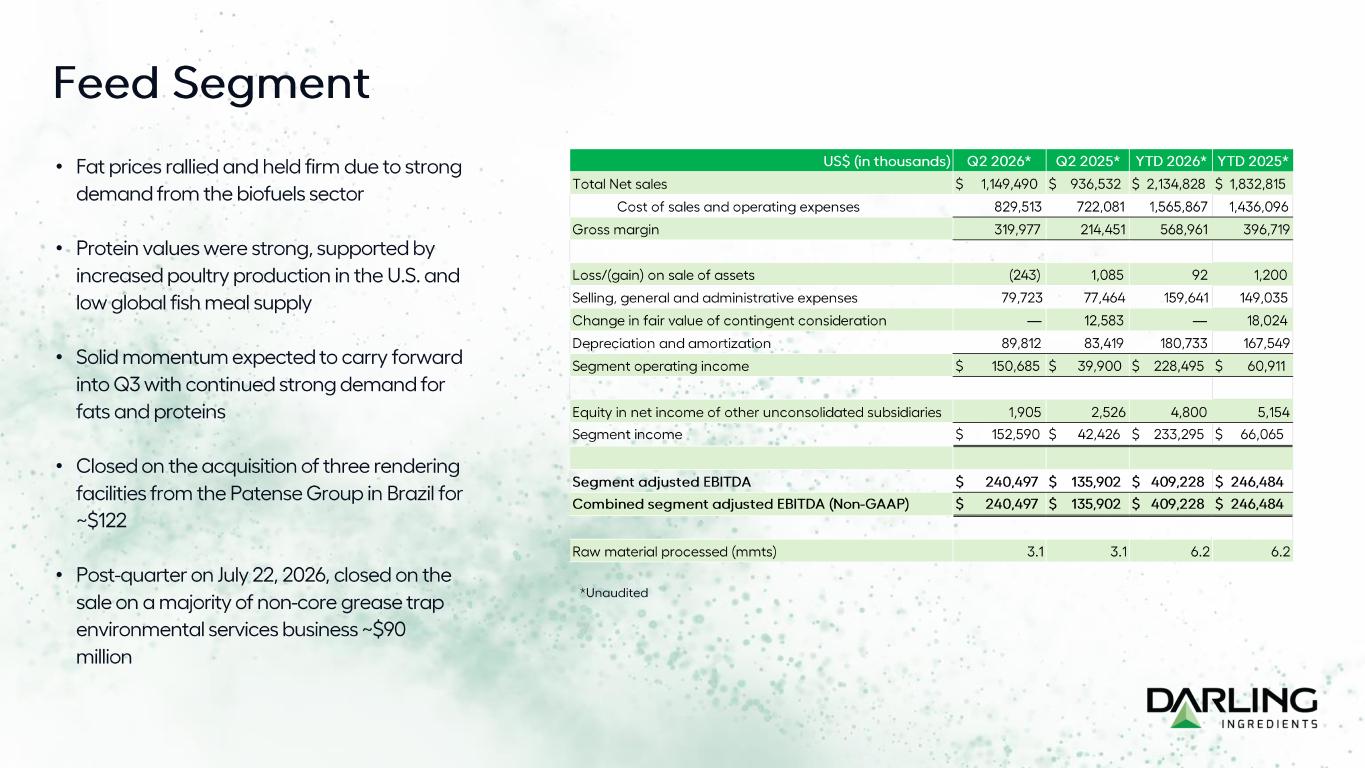
Feed Segment • Fat prices rallied and held firm due to strong demand from the biofuels sector • Protein values were strong, supported by increased poultry production in the U.S. and low global fish meal supply • Solid momentum expected to carry forward into Q3 with continued strong demand for fats and proteins • Closed on the acquisition of three rendering facilities from the Patense Group in Brazil for ~$122 • Post-quarter on July 22, 2026, closed on the sale on a majority of non -core grease trap environmental services business ~$90 million US$ (in thousands) Q2 2026* Q2 2025* YTD 2026* YTD 2025* Total Net sales $ 1,149,490 $ 936,532 $ 2,134,828 $ 1,832,815 Cost of sales and operating expenses 829,513 722,081 1,565,867 1,436,096 Gross margin 319,977 214,451 568,961 396,719 Loss/(gain) on sale of assets (243) 1,085 92 1,200 Selling, general and administrative expenses 79,723 77,464 159,641 149,035 Change in fair value of contingent consideration — 12,583 — 18,024 Depreciation and amortization 89,812 83,419 180,733 167,549 Segment operating income $ 150,685 $ 39,900 $ 228,495 $ 60,911 Equity in net income of other unconsolidated subsidiaries 1,905 2,526 4,800 5,154 Segment income $ 152,590 $ 42,426 $ 233,295 $ 66,065 Segment adjusted EBITDA $ 240,497 $ 135,902 $ 409,228 $ 246,484 Combined segment adjusted EBITDA (Non-GAAP) $ 240,497 $ 135,902 $ 409,228 $ 246,484 Raw material processed (mmts) 3.1 3.1 6.2 6.2 *Unaudited
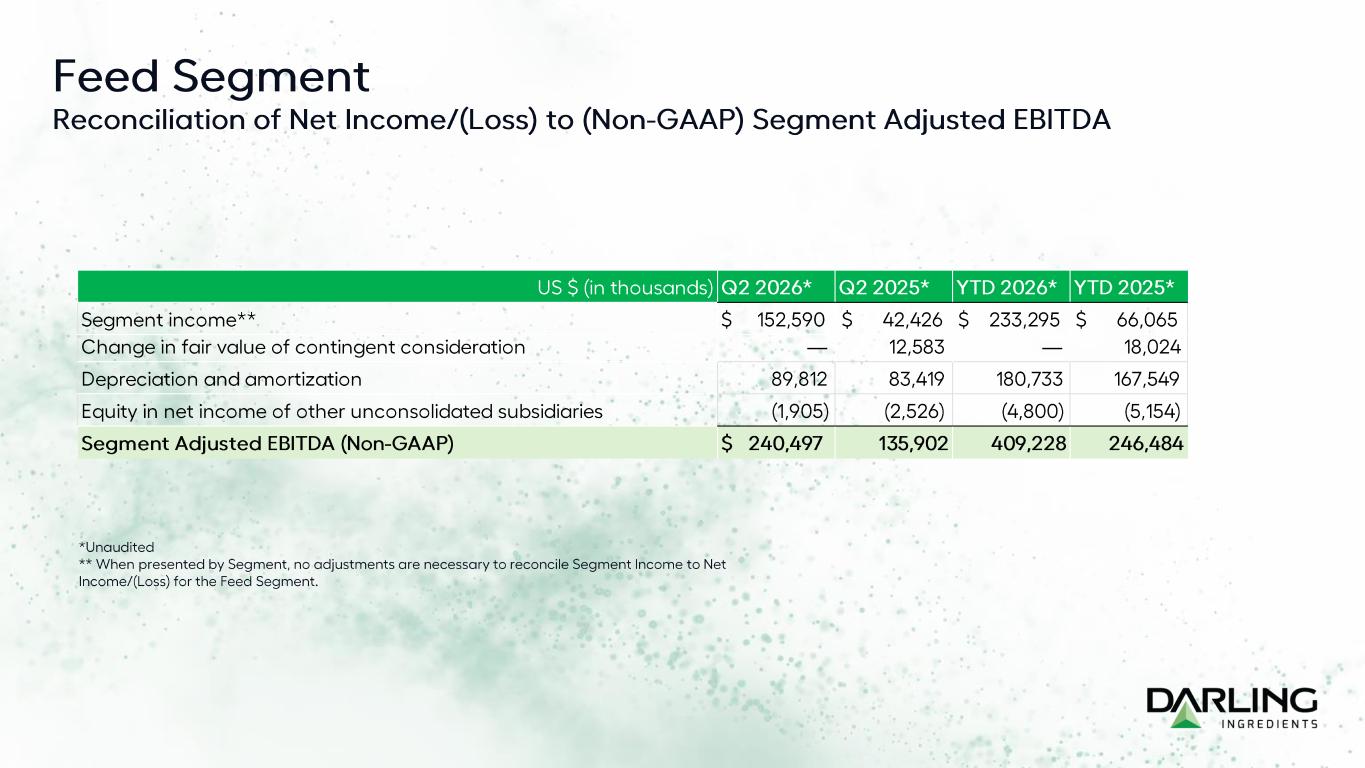
Feed Segment Reconciliation of Net Income/(Loss) to (Non -GAAP) Segment Adjusted EBITDA *Unaudited ** When presented by Segment, no adjustments are necessary to reconcile Segment Income to Net Income/(Loss) for the Feed Segment. US $ (in thousands) Q2 2026* Q2 2025* YTD 2026* YTD 2025* Segment income** 152,590$ 42,426$ 233,295$ 66,065$ Change in fair value of contingent consideration — 12,583 — 18,024 Depreciation and amortization 89,812 83,419 180,733 167,549 Equity in net income of other unconsolidated subsidiaries (1,905) (2,526) (4,800) (5,154) Segment Adjusted EBITDA (Non-GAAP) $ 240,497 135,902 409,228 246,484
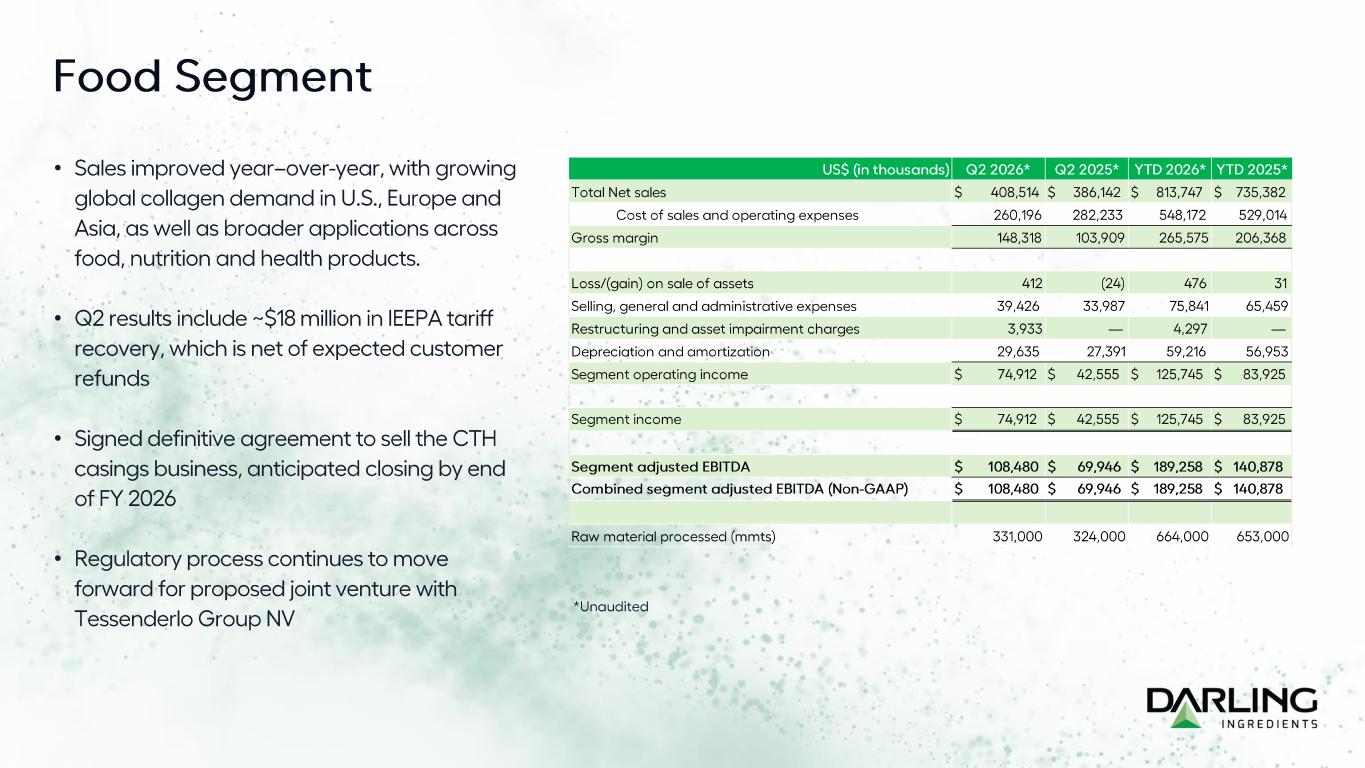
Food Segment *Unaudited • Sales improved year –over-year, with growing global collagen demand in U.S., Europe and Asia, as well as broader applications across food, nutrition and health products. • Q2 results include ~$18 million in IEEPA tariff recovery, which is net of expected customer refunds • Signed definitive agreement to sell the CTH casings business, anticipated closing by end of FY 2026 • Regulatory process continues to move forward for proposed joint venture with Tessenderlo Group NV US$ (in thousands) Q2 2026* Q2 2025* YTD 2026* YTD 2025* Total Net sales $ 408,514 $ 386,142 $ 813,747 $ 735,382 Cost of sales and operating expenses 260,196 282,233 548,172 529,014 Gross margin 148,318 103,909 265,575 206,368 Loss/(gain) on sale of assets 412 (24) 476 31 Selling, general and administrative expenses 39,426 33,987 75,841 65,459 Restructuring and asset impairment charges 3,933 — 4,297 — Depreciation and amortization 29,635 27,391 59,216 56,953 Segment operating income $ 74,912 $ 42,555 $ 125,745 $ 83,925 Segment income $ 74,912 $ 42,555 $ 125,745 $ 83,925 Segment adjusted EBITDA $ 108,480 $ 69,946 $ 189,258 $ 140,878 Combined segment adjusted EBITDA (Non-GAAP) $ 108,480 $ 69,946 $ 189,258 $ 140,878 Raw material processed (mmts) 331,000 324,000 664,000 653,000
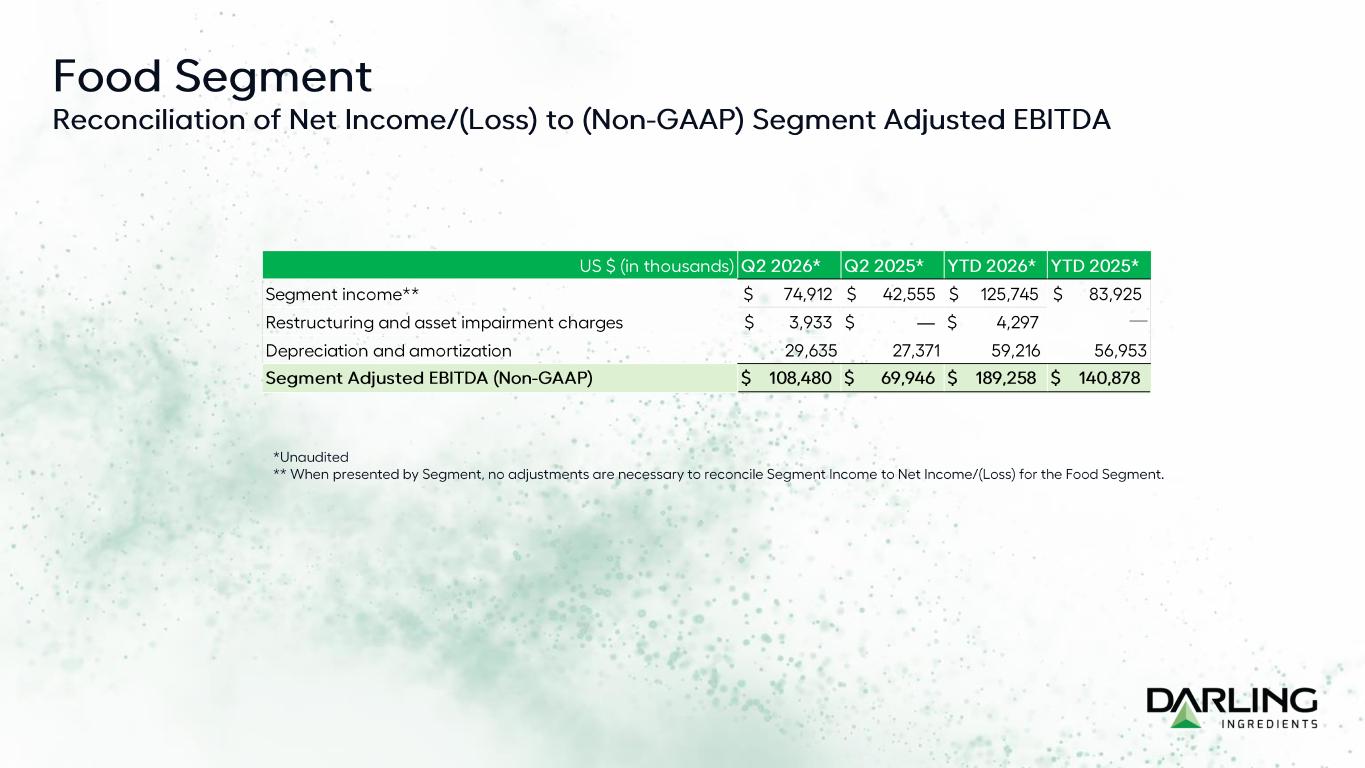
Food Segment Reconciliation of Net Income/(Loss) to (Non -GAAP) Segment Adjusted EBITDA *Unaudited ** When presented by Segment, no adjustments are necessary to reconcile Segment Income to Net Income/(Loss) for the Food Segm ent . US $ (in thousands) Q2 2026* Q2 2025* YTD 2026* YTD 2025* Segment income** 74,912$ 42,555$ 125,745$ 83,925$ Restructuring and asset impairment charges 3,933$ —$ 4,297$ — Depreciation and amortization 29,635 27,371 59,216 56,953 Segment Adjusted EBITDA (Non-GAAP) $ 108,480 $ 69,946 $ 189,258 $ 140,878
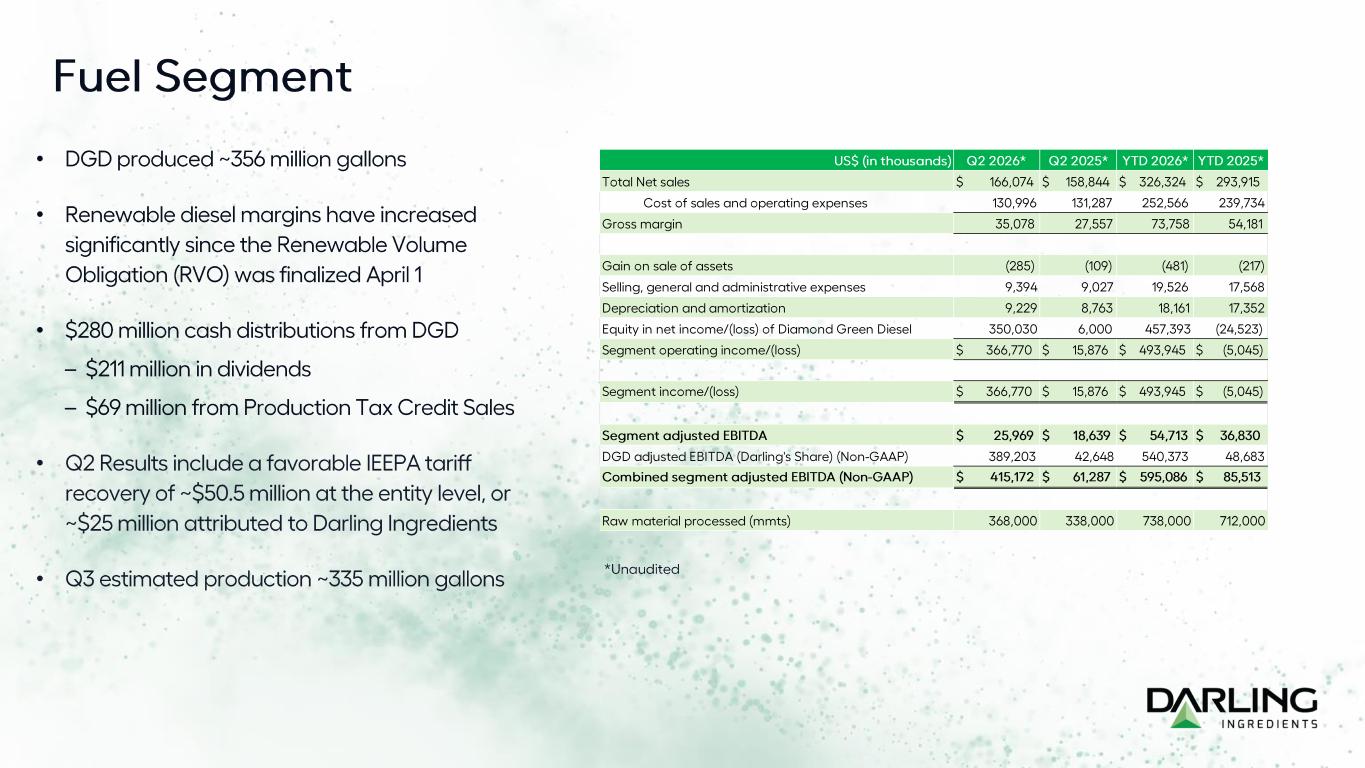
Fuel Segment US$ (in thousands) Q2 2026* Q2 2025* YTD 2026* YTD 2025* Total Net sales $ 166,074 $ 158,844 $ 326,324 $ 293,915 Cost of sales and operating expenses 130,996 131,287 252,566 239,734 Gross margin 35,078 27,557 73,758 54,181 Gain on sale of assets (285) (109) (481) (217) Selling, general and administrative expenses 9,394 9,027 19,526 17,568 Depreciation and amortization 9,229 8,763 18,161 17,352 Equity in net income/(loss) of Diamond Green Diesel 350,030 6,000 457,393 (24,523) Segment operating income/(loss) $ 366,770 $ 15,876 $ 493,945 $ (5,045) Segment income/(loss) $ 366,770 $ 15,876 $ 493,945 $ (5,045) Segment adjusted EBITDA $ 25,969 $ 18,639 $ 54,713 $ 36,830 DGD adjusted EBITDA (Darling's Share) (Non-GAAP) 389,203 42,648 540,373 48,683 Combined segment adjusted EBITDA (Non-GAAP) $ 415,172 $ 61,287 $ 595,086 $ 85,513 Raw material processed (mmts) 368,000 338,000 738,000 712,000 *Unaudited • DGD produced ~356 million gallons • Renewable diesel margins have increased significantly since the Renewable Volume Obligation (RVO) was finalized April 1 • $280 million cash distributions from DGD – $211 million in dividends – $69 million from Production Tax Credit Sales • Q2 Results include a favorable IEEPA tariff recovery of ~$50.5 million at the entity level, or ~$25 million attributed to Darling Ingredients • Q3 estimated production ~335 million gallons
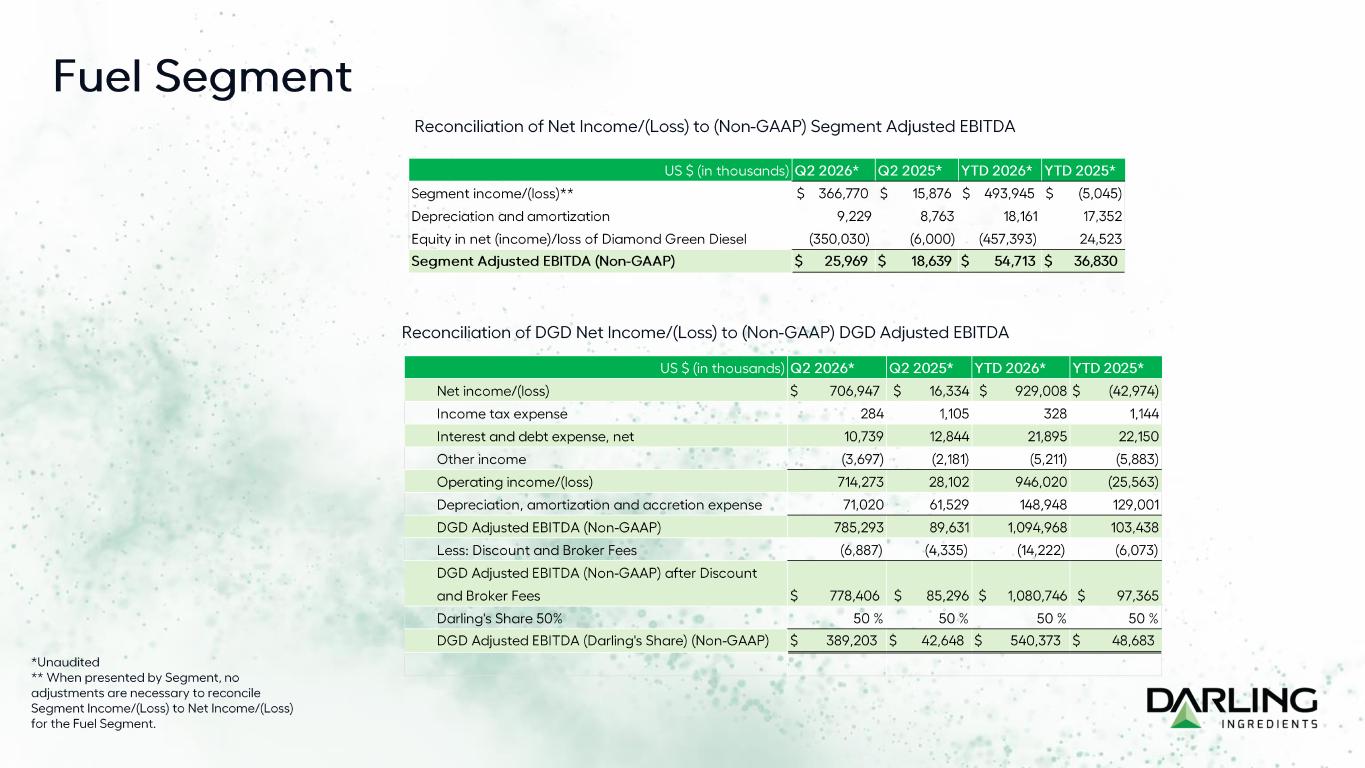
Fuel Segment *Unaudited ** When presented by Segment, no adjustments are necessary to reconcile Segment Income/(Loss) to Net Income/(Loss) for the Fuel Segment. Reconciliation of Net Income/(Loss) to (Non -GAAP) Segment Adjusted EBITDA Reconciliation of DGD Net Income/(Loss) to (Non -GAAP) DGD Adjusted EBITDA US $ (in thousands) Q2 2026* Q2 2025* YTD 2026* YTD 2025* Segment income/(loss)** 366,770$ 15,876$ 493,945$ (5,045)$ Depreciation and amortization 9,229 8,763 18,161 17,352 Equity in net (income)/loss of Diamond Green Diesel (350,030) (6,000) (457,393) 24,523 Segment Adjusted EBITDA (Non-GAAP) $ 25,969 $ 18,639 $ 54,713 $ 36,830 US $ (in thousands) Q2 2026* Q2 2025* YTD 2026* YTD 2025* Net income/(loss) 706,947$ $ 16,334 $ 929,008 $ (42,974) Income tax expense 284 1,105 328 1,144 Interest and debt expense, net 10,739 12,844 21,895 22,150 Other income (3,697) (2,181) (5,211) (5,883) Operating income/(loss) 714,273 28,102 946,020 (25,563) Depreciation, amortization and accretion expense 71,020 61,529 148,948 129,001 DGD Adjusted EBITDA (Non-GAAP) 785,293 89,631 1,094,968 103,438 Less: Discount and Broker Fees (6,887) (4,335) (14,222) (6,073) DGD Adjusted EBITDA (Non-GAAP) after Discount and Broker Fees 778,406$ $ 85,296 $ 1,080,746 $ 97,365 Darling's Share 50% 50 % 50 % 50 % 50 % DGD Adjusted EBITDA (Darling's Share) (Non-GAAP) $ 389,203 $ 42,648 $ 540,373 $ 48,683
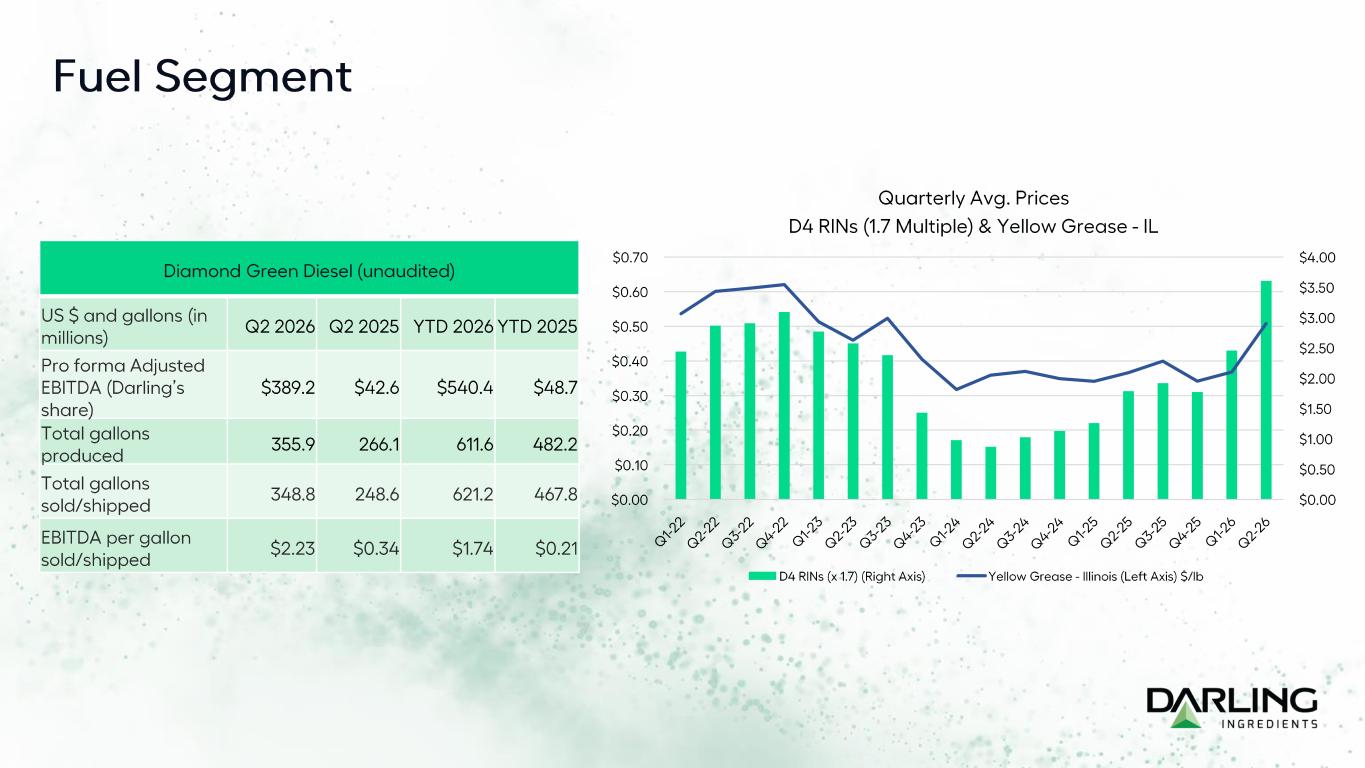
Fuel Segment $0.00 $0.50 $1.00 $1.50 $2.00 $2.50 $3.00 $3.50 $4.00 $0.00 $0.10 $0.20 $0.30 $0.40 $0.50 $0.60 $0.70 Quarterly Avg. Prices D4 RINs (1.7 Multiple) & Yellow Grease - IL D4 RINs (x 1.7) (Right Axis) Yellow Grease - Illinois (Left Axis) $/lb Diamond Green Diesel (unaudited) US $ and gallons (in millions) Q2 2026 Q2 2025 YTD 2026 YTD 2025 Pro forma Adjusted EBITDA (Darling’s share) $389.2 $42.6 $540.4 $48.7 Total gallons produced 355.9 266.1 611.6 482.2 Total gallons sold/shipped 348.8 248.6 621.2 467.8 EBITDA per gallon sold/shipped $2.23 $0.34 $1.74 $0.21

Appendix
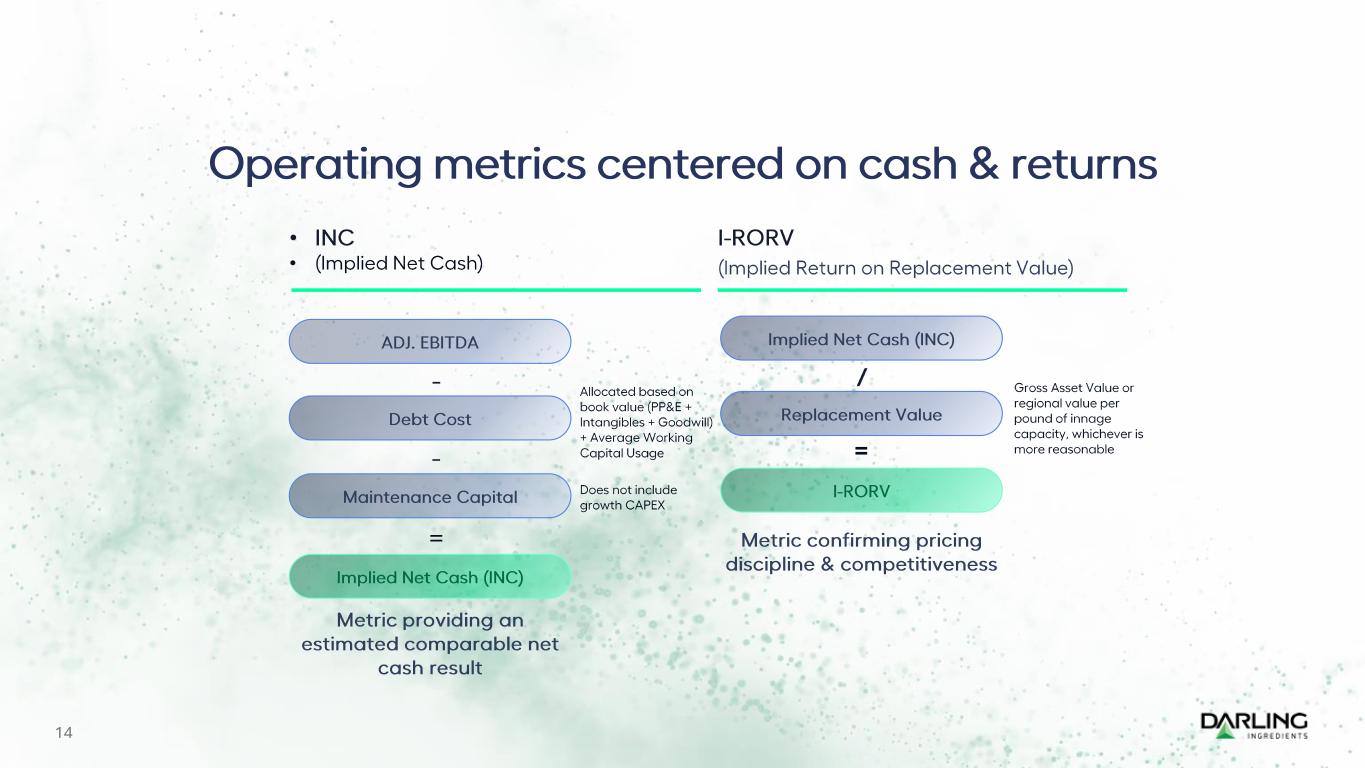
14 • INC • (Implied Net Cash) Allocated based on book value (PP&E + Intangibles + Goodwill) + Average Working Capital Usage = Does not include growth CAPEX Metric providing an estimated comparable net cash result Metric confirming pricing discipline & competitiveness I-RORV (Implied Return on Replacement Value) Debt Cost Implied Net Cash (INC) ADJ. EBITDA Maintenance Capital - - = Gross Asset Value or regional value per pound of innage capacity, whichever is more reasonable Implied Net Cash (INC) I-RORV Replacement Value / Operating metrics centered on cash & returns
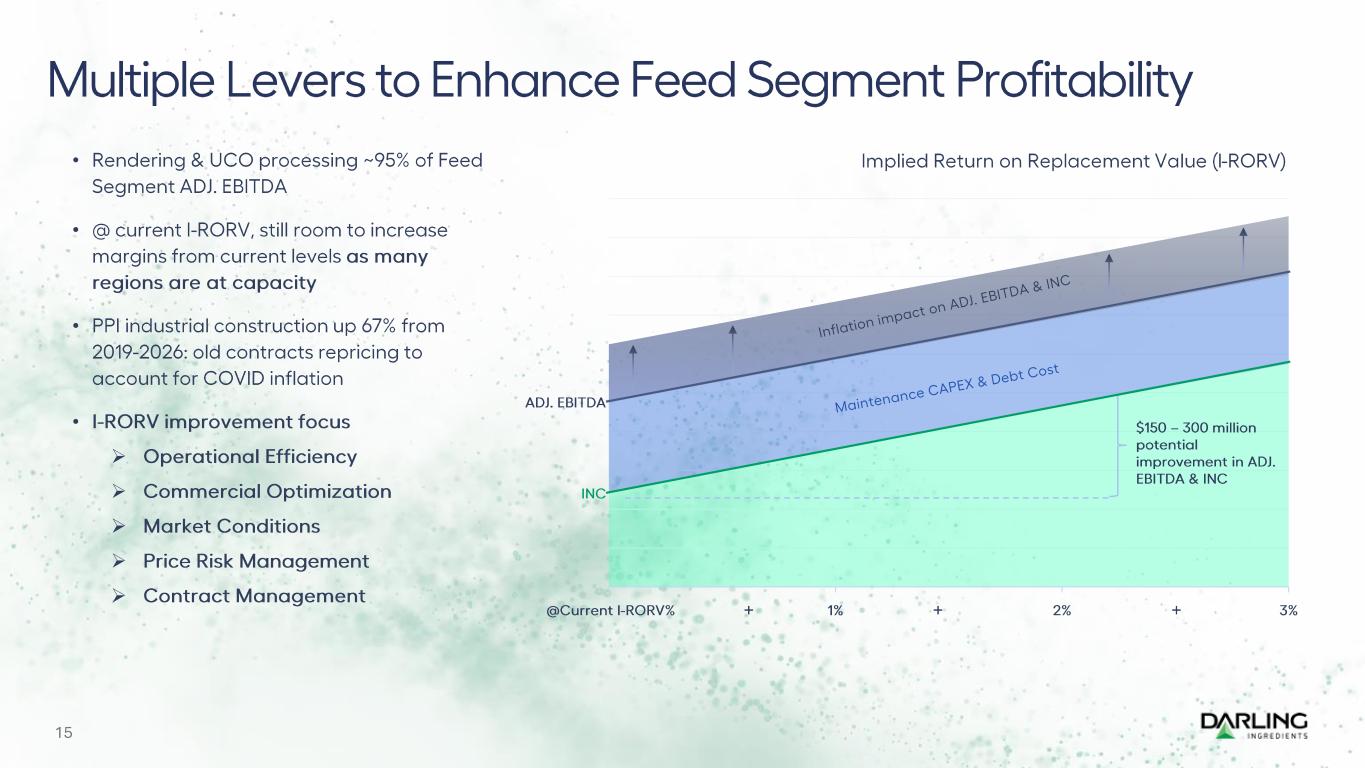
Multiple Levers to Enhance Feed Segment Profitability 15 • Rendering & UCO processing ~95% of Feed Segment ADJ. EBITDA • @ current I -RORV, still room to increase margins from current levels as many regions are at capacity • PPI industrial construction up 67% from 2019-2026: old contracts repricing to account for COVID inflation • I-RORV improvement focus ➢ Operational Efficiency ➢ Commercial Optimization ➢ Market Conditions ➢ Price Risk Management ➢ Contract Management @Current I-RORV% 1% 2% 3% Implied Return on Replacement Value (I -RORV) + + + ADJ. EBITDA INC $150 – 300 million potential improvement in ADJ. EBITDA & INC
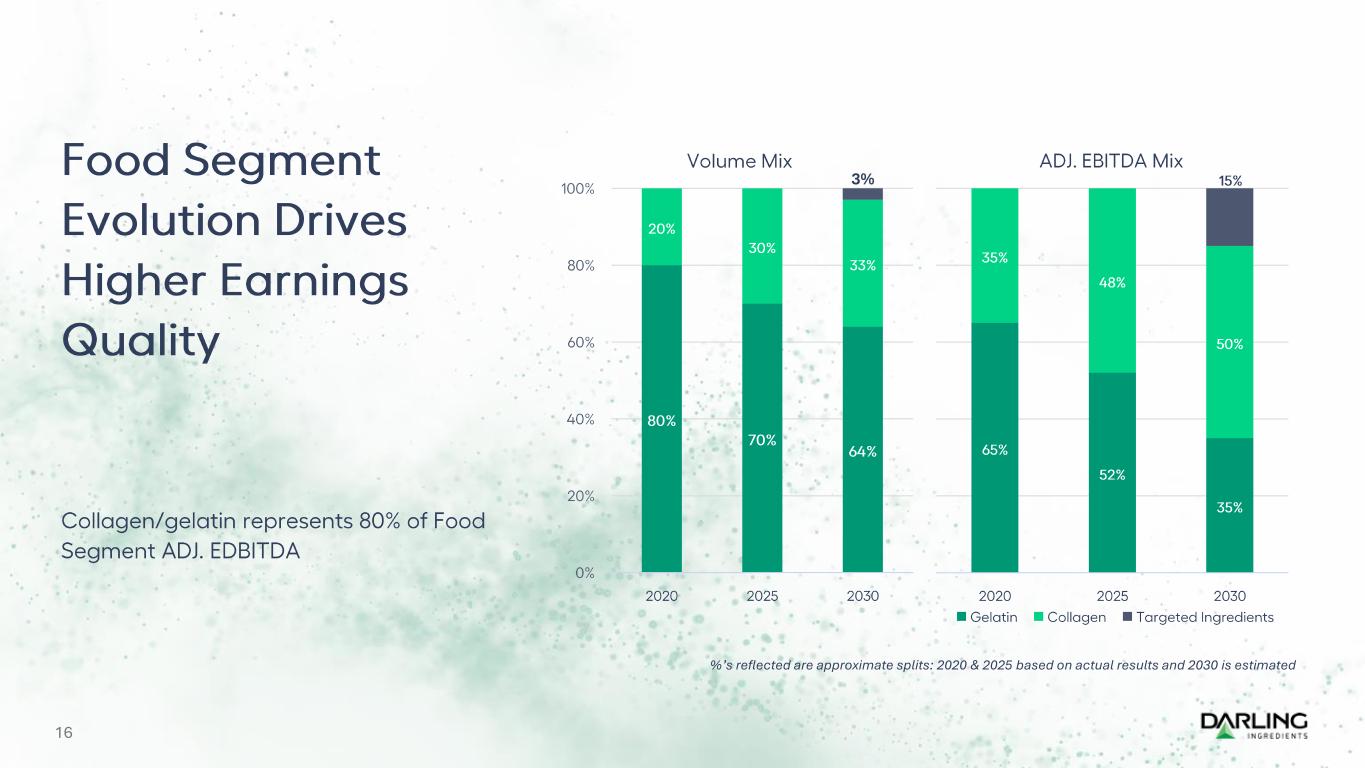
16 65% 52% 35% 35% 48% 50% 15% 2020 2025 2030 ADJ. EBITDA Mix Gelatin Collagen Targeted Ingredients 80% 70% 64% 20% 30% 33% 3% 0% 20% 40% 60% 80% 100% 2020 2025 2030 Volume Mix Collagen/gelatin represents 80% of Food Segment ADJ. EDBITDA %’s reflected are approximate splits: 2020 & 2025 based on actual results and 2030 is estimated Food Segment Evolution Drives Higher Earnings Quality
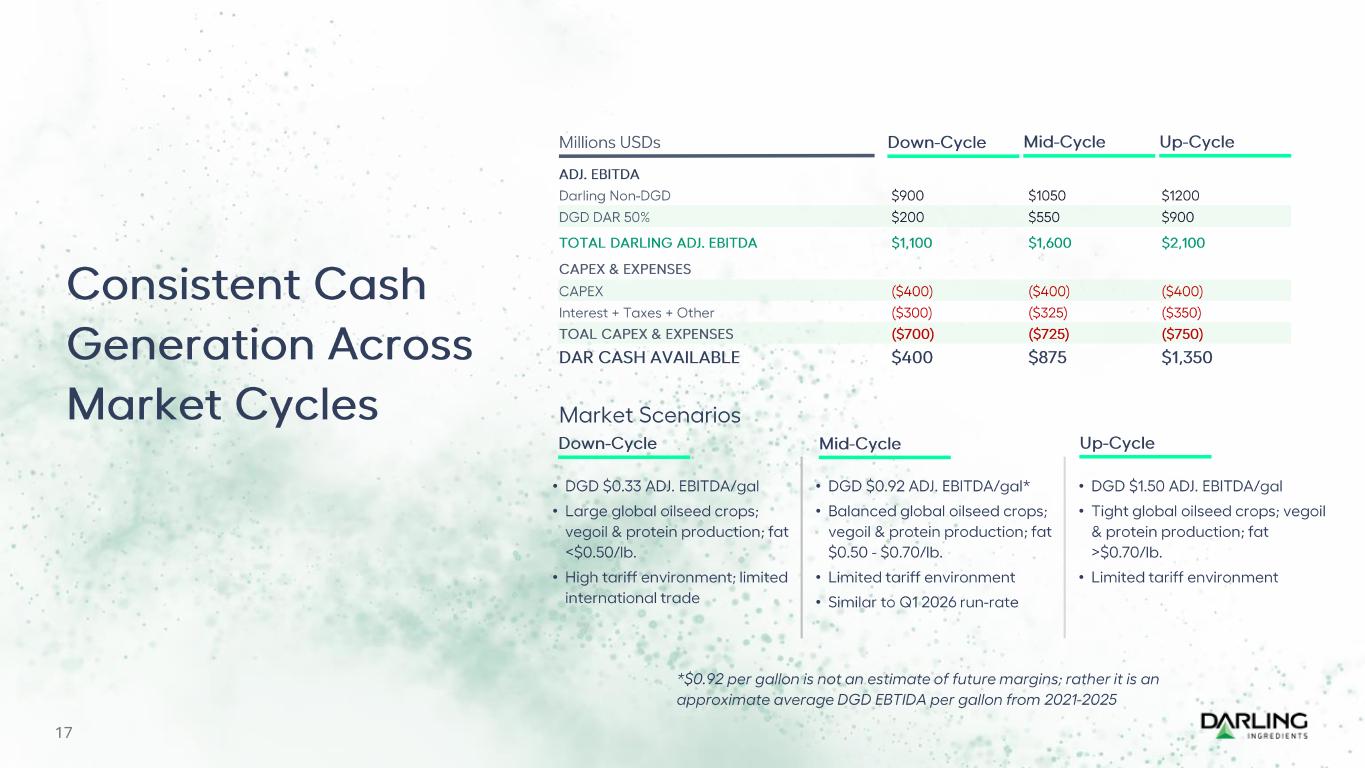
17 Consistent Cash Generation Across Market Cycles ADJ. EBITDA Darling Non -DGD $900 $1050 $1200 DGD DAR 50% $200 $550 $900 TOTAL DARLING ADJ. EBITDA $1,100 $1,600 $2,100 CAPEX & EXPENSES CAPEX ($400) ($400) ($400) Interest + Taxes + Other ($300) ($325) ($350) TOAL CAPEX & EXPENSES ($700) ($725) ($750) DAR CASH AVAILABLE $400 $875 $1,350 Down -Cycle Mid -Cycle Up -CycleMillions USDs Market Scenarios • DGD $1.50 ADJ. EBITDA/gal • Tight global oilseed crops; vegoil & protein production; fat >$0.70/lb. • Limited tariff environment • DGD $0.92 ADJ. EBITDA/gal* • Balanced global oilseed crops; vegoil & protein production; fat $0.50 - $0.70/lb. • Limited tariff environment • Similar to Q1 2026 run -rate • DGD $0.33 ADJ. EBITDA/gal • Large global oilseed crops; vegoil & protein production; fat <$0.50/lb. • High tariff environment; limited international trade Down -Cycle Mid -Cycle Up -Cycle *$0.92 per gallon is not an estimate of future margins; rather it is an approximate average DGD EBTIDA per gallon from 2021 -2025
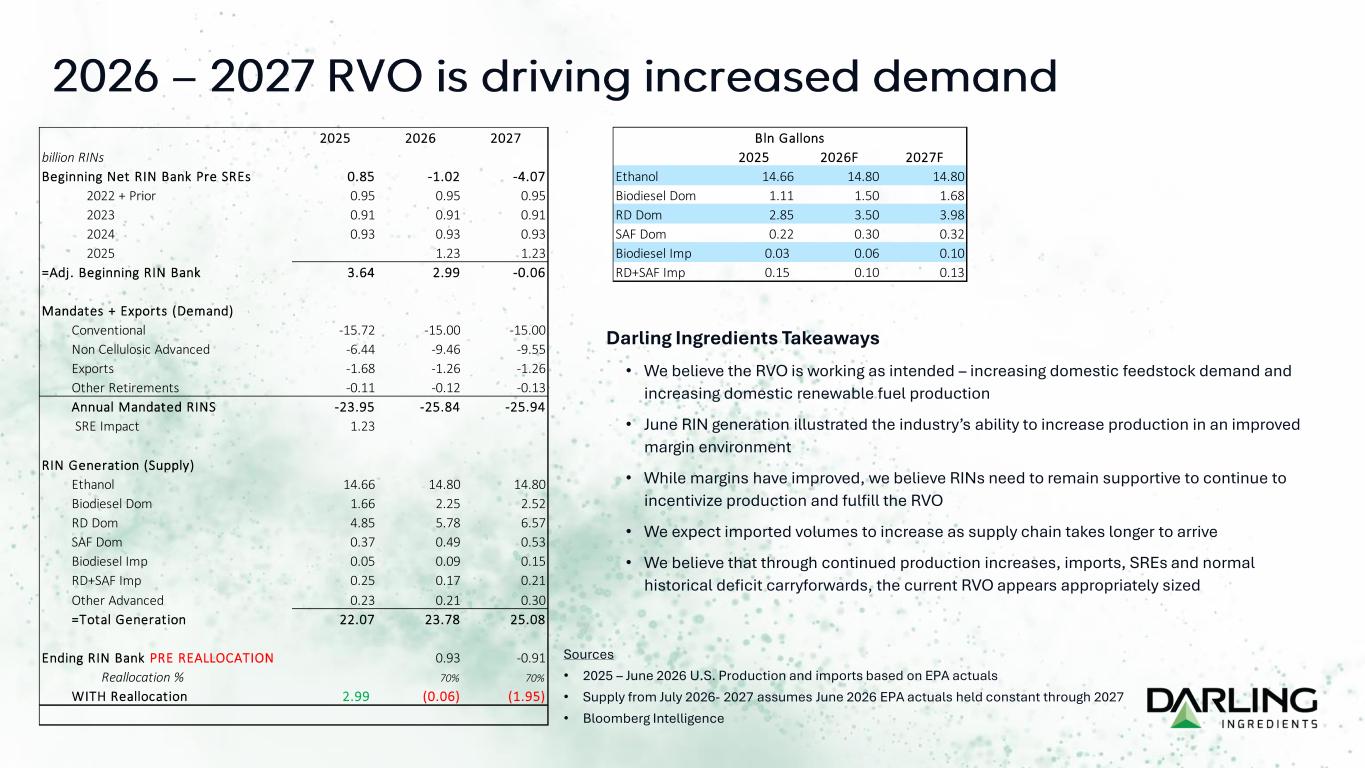
2026 – 2027 RVO is driving increased demand Darling Ingredients Takeaways • We believe the RVO is working as intended – increasing domestic feedstock demand and increasing domestic renewable fuel production • June RIN generation illustrated the industry’s ability to increase production in an improved margin environment • While margins have improved, we believe RINs need to remain supportive to continue to incentivize production and fulfill the RVO • We expect imported volumes to increase as supply chain takes longer to arrive • We believe that through continued production increases, imports, SREs and normal historical deficit carryforwards, the current RVO appears appropriately sized Sources • 2025 – June 2026 U.S. Production and imports based on EPA actuals • Supply from July 2026- 2027 assumes June 2026 EPA actuals held constant through 2027 • Bloomberg Intelligence 2025 2026 2027 billion RINs Beginning Net RIN Bank Pre SREs 0.85 -1.02 -4.07 2022 + Prior 0.95 0.95 0.95 2023 0.91 0.91 0.91 2024 0.93 0.93 0.93 2025 1.23 1.23 =Adj. Beginning RIN Bank 3.64 2.99 -0.06 Mandates + Exports (Demand) Conventional -15.72 -15.00 -15.00 Non Cellulosic Advanced -6.44 -9.46 -9.55 Exports -1.68 -1.26 -1.26 Other Retirements -0.11 -0.12 -0.13 Annual Mandated RINS -23.95 -25.84 -25.94 SRE Impact 1.23 RIN Generation (Supply) Ethanol 14.66 14.80 14.80 Biodiesel Dom 1.66 2.25 2.52 RD Dom 4.85 5.78 6.57 SAF Dom 0.37 0.49 0.53 Biodiesel Imp 0.05 0.09 0.15 RD+SAF Imp 0.25 0.17 0.21 Other Advanced 0.23 0.21 0.30 =Total Generation 22.07 23.78 25.08 Ending RIN Bank PRE REALLOCATION 0.93 -0.91 Reallocation % 70% 70% WITH Reallocation 2.99 (0.06) (1.95) 2025 2026F 2027F Ethanol 14.66 14.80 14.80 Biodiesel Dom 1.11 1.50 1.68 RD Dom 2.85 3.50 3.98 SAF Dom 0.22 0.30 0.32 Biodiesel Imp 0.03 0.06 0.10 RD+SAF Imp 0.15 0.10 0.13 Bln Gallons
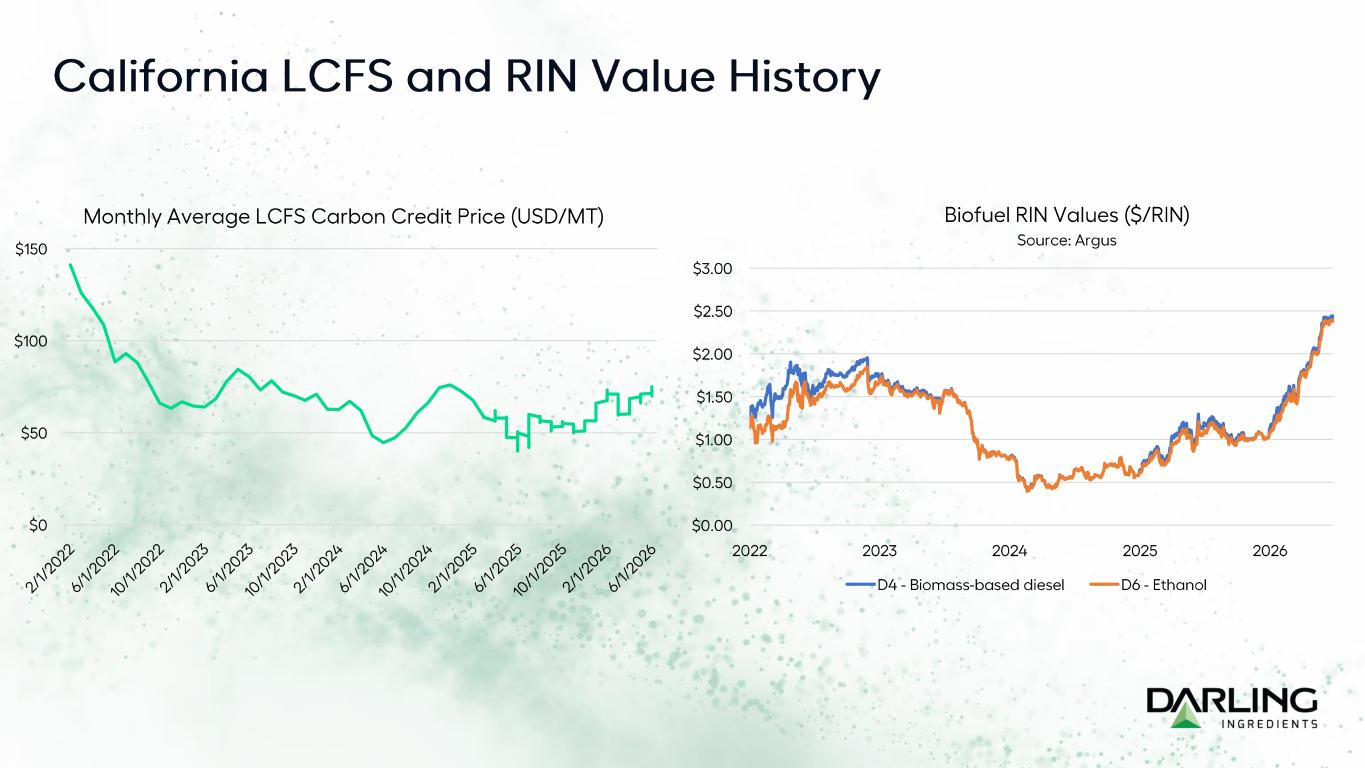
California LCFS and RIN Value History $0.00 $0.50 $1.00 $1.50 $2.00 $2.50 $3.00 2022 2023 2024 2025 2026 Biofuel RIN Values ($/RIN) Source: Argus D4 - Biomass-based diesel D6 - Ethanol $0 $50 $100 $150 Monthly Average LCFS Carbon Credit Price (USD/MT)
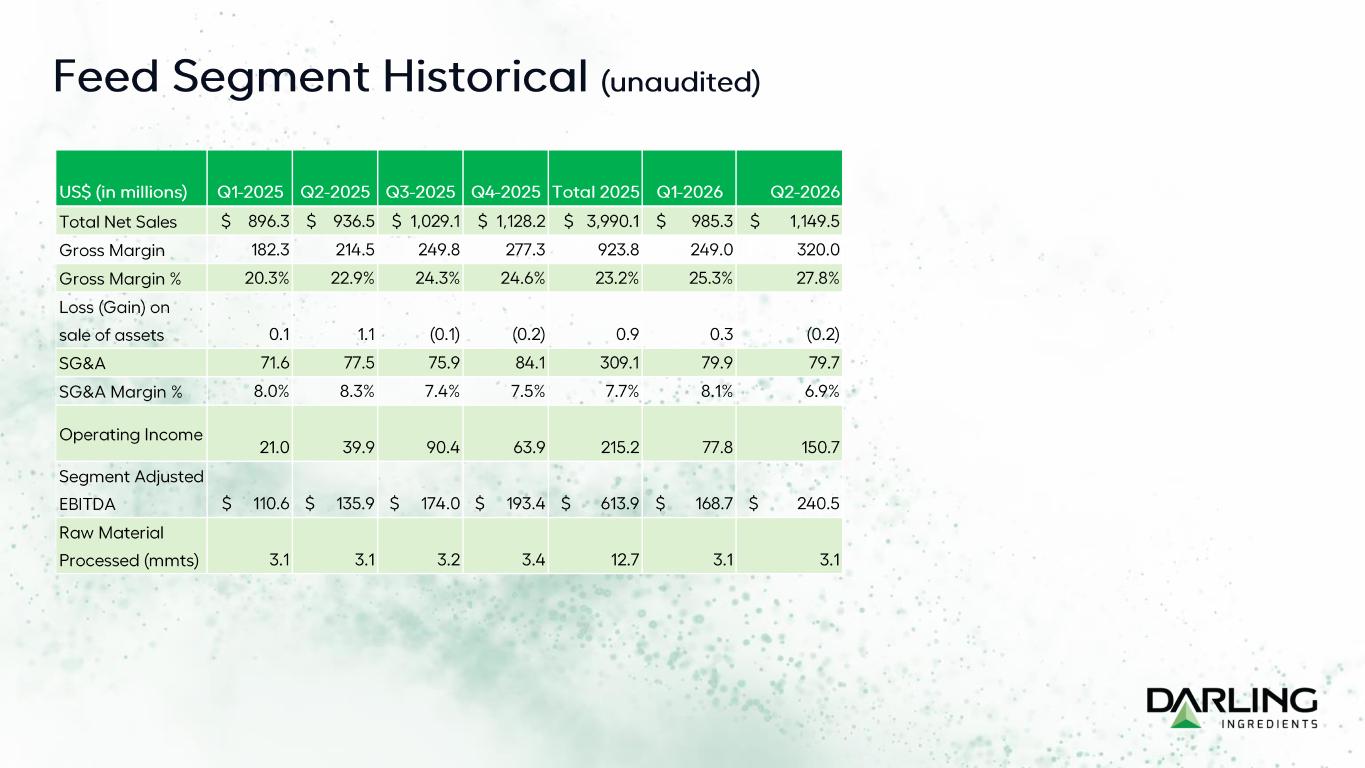
Feed Segment Historical (unaudited) US$ (in millions) Q1-2025 Q2-2025 Q3-2025 Q4-2025 Total 2025 Q1-2026 Q2-2026 Total Net Sales $ 896.3 $ 936.5 $ 1,029.1 $ 1,128.2 $ 3,990.1 $ 985.3 $ 1,149.5 Gross Margin 182.3 214.5 249.8 277.3 923.8 249.0 320.0 Gross Margin % 20.3% 22.9% 24.3% 24.6% 23.2% 25.3% 27.8% Loss (Gain) on sale of assets 0.1 1.1 (0.1) (0.2) 0.9 0.3 (0.2) SG&A 71.6 77.5 75.9 84.1 309.1 79.9 79.7 SG&A Margin % 8.0% 8.3% 7.4% 7.5% 7.7% 8.1% 6.9% Operating Income 21.0 39.9 90.4 63.9 215.2 77.8 150.7 Segment Adjusted EBITDA $ 110.6 $ 135.9 $ 174.0 $ 193.4 $ 613.9 $ 168.7 $ 240.5 Raw Material Processed (mmts) 3.1 3.1 3.2 3.4 12.7 3.1 3.1
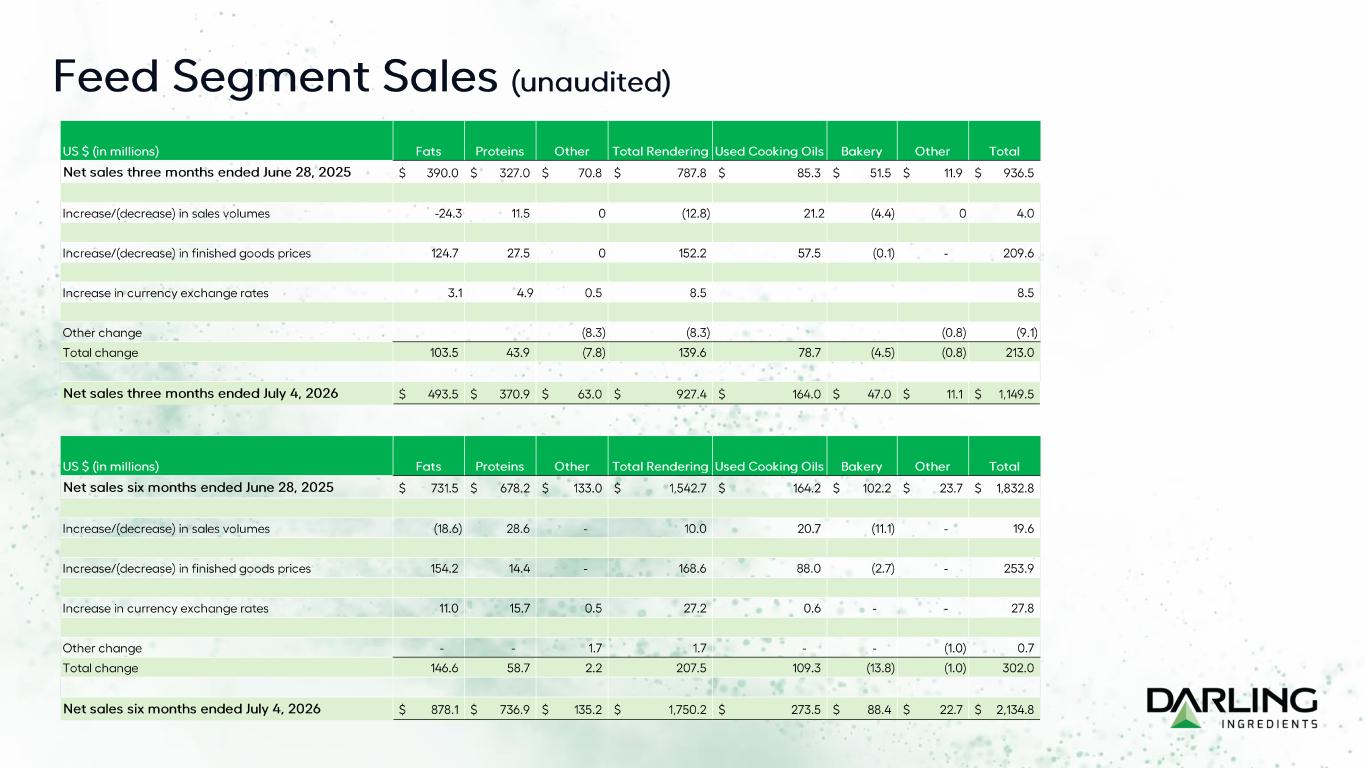
Feed Segment Sales (unaudited) US $ (in millions) Fats Proteins Other Total Rendering Used Cooking Oils Bakery Other Total Net sales three months ended June 28, 2025 390.0$ 327.0$ 70.8$ 787.8$ 85.3$ 51.5$ 11.9$ 936.5$ Increase/(decrease) in sales volumes -24.3 11.5 0 (12.8) 21.2 (4.4) 0 4.0 Increase/(decrease) in finished goods prices 124.7 27.5 0 152.2 57.5 (0.1) - 209.6 Increase in currency exchange rates 3.1 4.9 0.5 8.5 8.5 Other change (8.3) (8.3) (0.8) (9.1) Total change 103.5 43.9 (7.8) 139.6 78.7 (4.5) (0.8) 213.0 Net sales three months ended July 4, 2026 493.5$ 370.9$ 63.0$ 927.4$ 164.0$ 47.0$ 11.1$ 1,149.5$ US $ (in millions) Fats Proteins Other Total Rendering Used Cooking Oils Bakery Other Total Net sales six months ended June 28, 2025 731.5$ 678.2$ 133.0$ 1,542.7$ 164.2$ 102.2$ 23.7$ 1,832.8$ Increase/(decrease) in sales volumes (18.6) 28.6 - 10.0 20.7 (11.1) - 19.6 Increase/(decrease) in finished goods prices 154.2 14.4 - 168.6 88.0 (2.7) - 253.9 Increase in currency exchange rates 11.0 15.7 0.5 27.2 0.6 - - 27.8 Other change - - 1.7 1.7 - - (1.0) 0.7 Total change 146.6 58.7 2.2 207.5 109.3 (13.8) (1.0) 302.0 Net sales six months ended July 4, 2026 878.1$ 736.9$ 135.2$ 1,750.2$ 273.5$ 88.4$ 22.7$ 2,134.8$
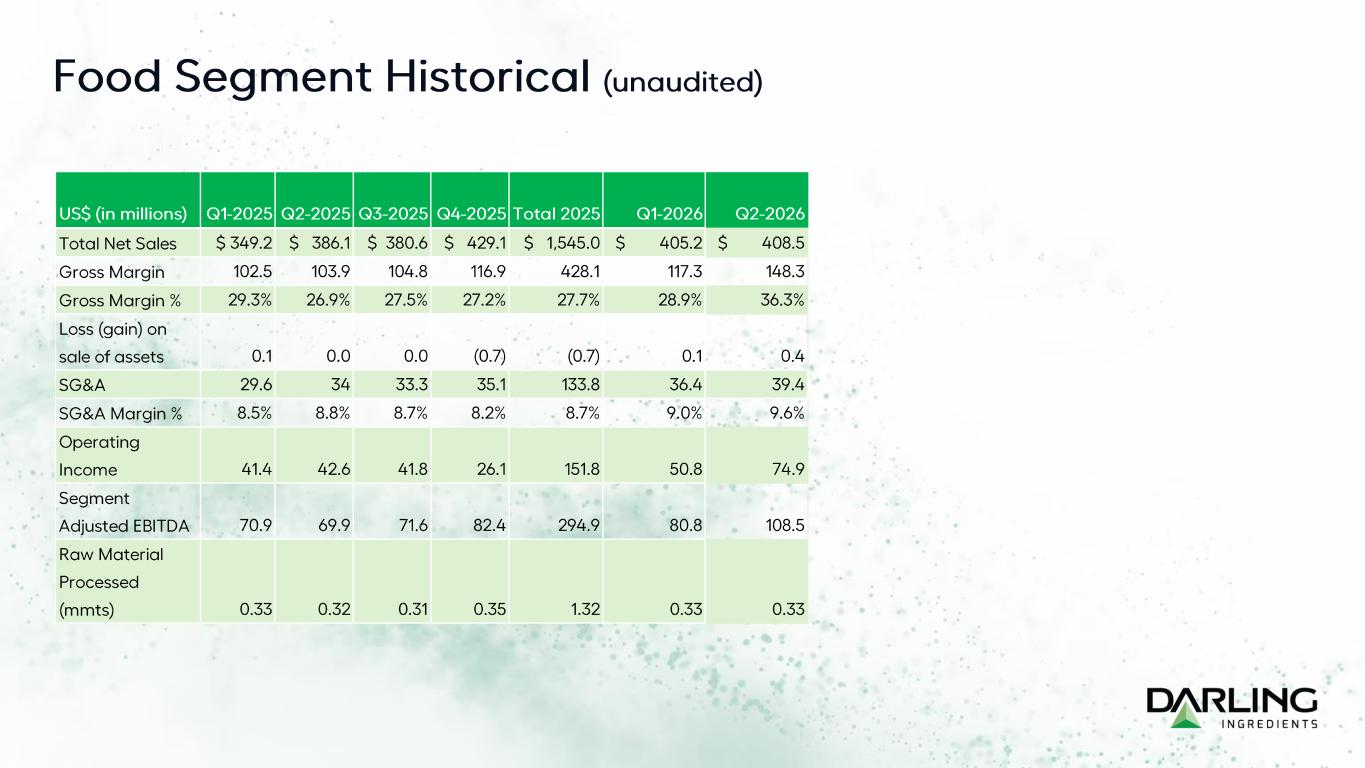
Food Segment Historical (unaudited) US$ (in millions) Q1-2025 Q2-2025 Q3-2025 Q4-2025 Total 2025 Q1-2026 Q2-2026 Total Net Sales $ 349.2 $ 386.1 $ 380.6 $ 429.1 $ 1,545.0 $ 405.2 $ 408.5 Gross Margin 102.5 103.9 104.8 116.9 428.1 117.3 148.3 Gross Margin % 29.3% 26.9% 27.5% 27.2% 27.7% 28.9% 36.3% Loss (gain) on sale of assets 0.1 0.0 0.0 (0.7) (0.7) 0.1 0.4 SG&A 29.6 34 33.3 35.1 133.8 36.4 39.4 SG&A Margin % 8.5% 8.8% 8.7% 8.2% 8.7% 9.0% 9.6% Operating Income 41.4 42.6 41.8 26.1 151.8 50.8 74.9 Segment Adjusted EBITDA 70.9 69.9 71.6 82.4 294.9 80.8 108.5 Raw Material Processed (mmts) 0.33 0.32 0.31 0.35 1.32 0.33 0.33
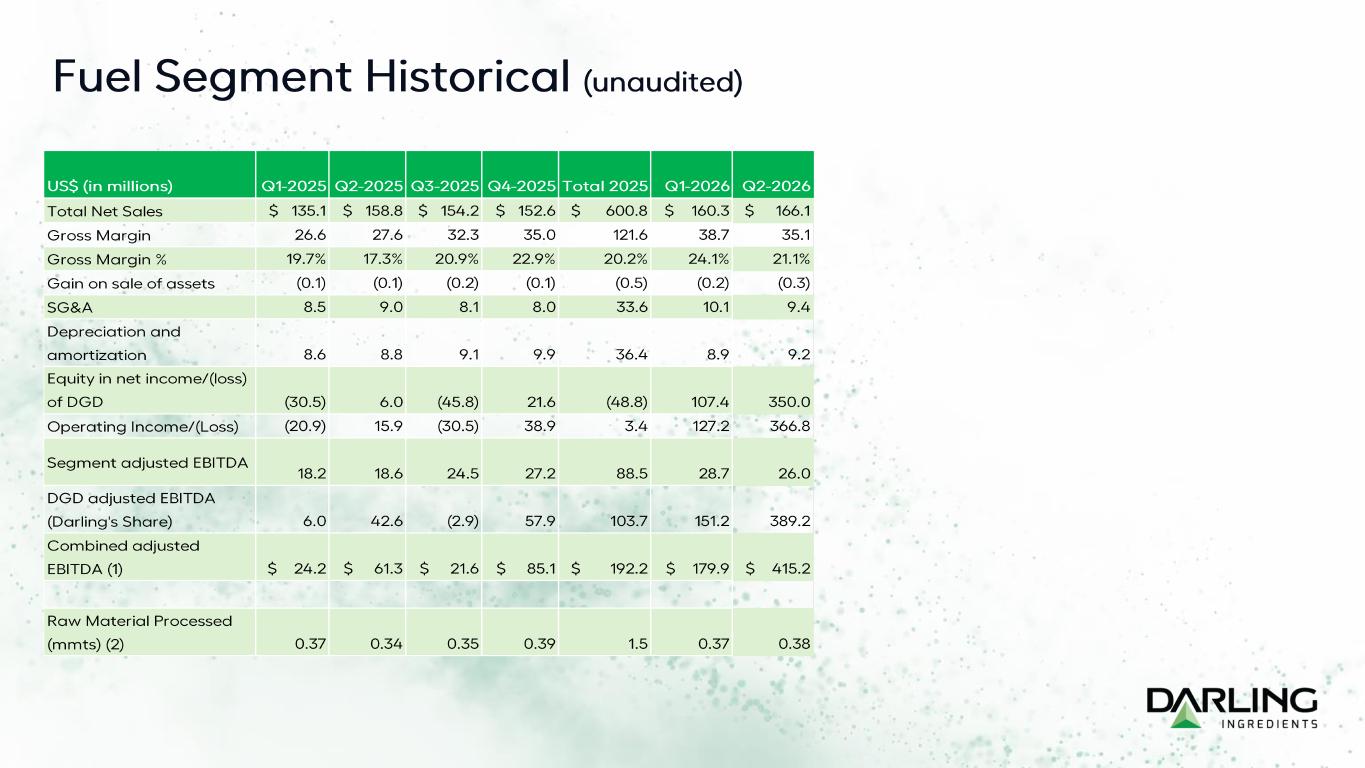
Fuel Segment Historical (unaudited) US$ (in millions) Q1-2025 Q2-2025 Q3-2025 Q4-2025 Total 2025 Q1-2026 Q2-2026 Total Net Sales $ 135.1 $ 158.8 $ 154.2 $ 152.6 $ 600.8 $ 160.3 $ 166.1 Gross Margin 26.6 27.6 32.3 35.0 121.6 38.7 35.1 Gross Margin % 19.7% 17.3% 20.9% 22.9% 20.2% 24.1% 21.1% Gain on sale of assets (0.1) (0.1) (0.2) (0.1) (0.5) (0.2) (0.3) SG&A 8.5 9.0 8.1 8.0 33.6 10.1 9.4 Depreciation and amortization 8.6 8.8 9.1 9.9 36.4 8.9 9.2 Equity in net income/(loss) of DGD (30.5) 6.0 (45.8) 21.6 (48.8) 107.4 350.0 Operating Income/(Loss) (20.9) 15.9 (30.5) 38.9 3.4 127.2 366.8 Segment adjusted EBITDA 18.2 18.6 24.5 27.2 88.5 28.7 26.0 DGD adjusted EBITDA (Darling's Share) 6.0 42.6 (2.9) 57.9 103.7 151.2 389.2 Combined adjusted EBITDA (1) $ 24.2 $ 61.3 $ 21.6 $ 85.1 $ 192.2 $ 179.9 $ 415.2 Raw Material Processed (mmts) (2) 0.37 0.34 0.35 0.39 1.5 0.37 0.38
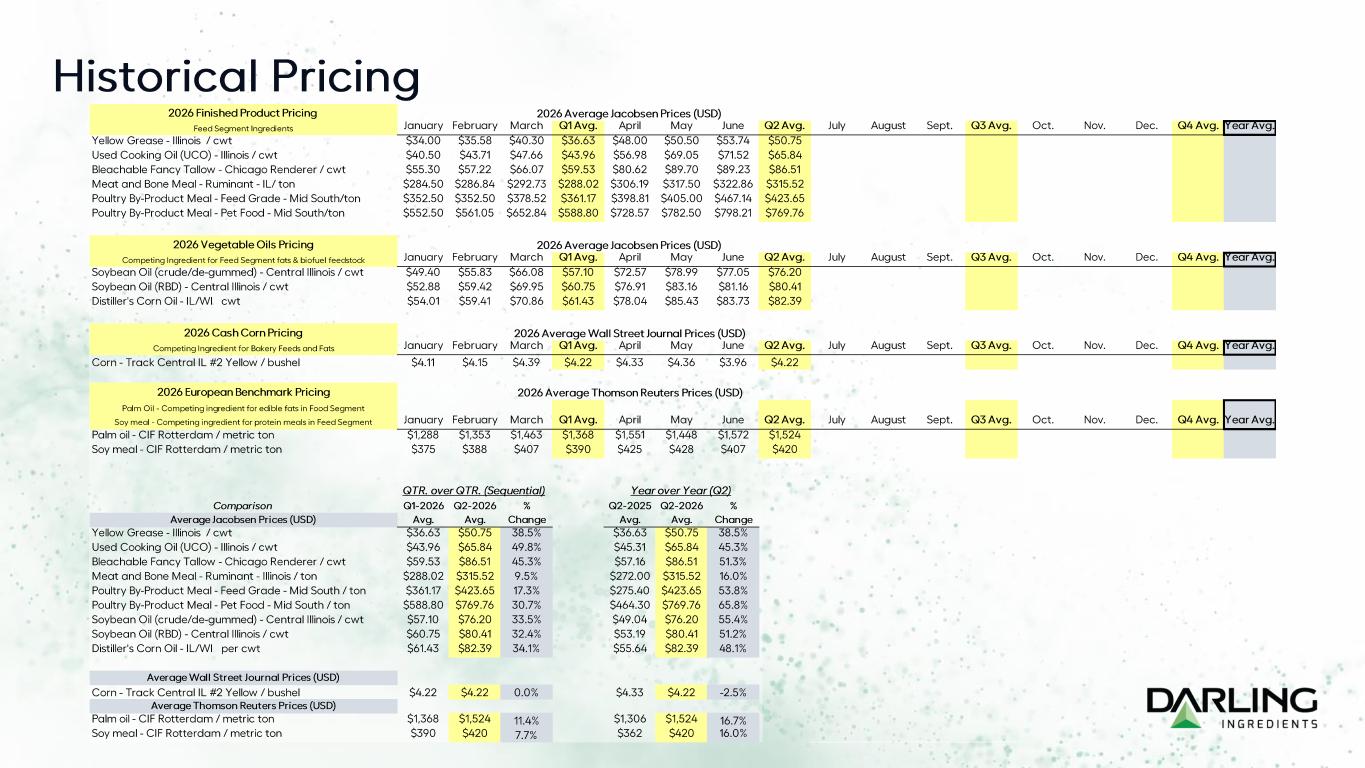
2026 Finished Product Pricing Feed Segment Ingredients January February March Q1 Avg. April May June Q2 Avg. July August Sept. Q3 Avg. Oct. Nov. Dec. Q4 Avg. Year Avg. Yellow Grease - Illinois / cwt $34.00 $35.58 $40.30 $36.63 $48.00 $50.50 $53.74 $50.75 Used Cooking Oil (UCO) - Illinois / cwt $40.50 $43.71 $47.66 $43.96 $56.98 $69.05 $71.52 $65.84 Bleachable Fancy Tallow - Chicago Renderer / cwt $55.30 $57.22 $66.07 $59.53 $80.62 $89.70 $89.23 $86.51 Meat and Bone Meal - Ruminant - IL/ ton $284.50 $286.84 $292.73 $288.02 $306.19 $317.50 $322.86 $315.52 Poultry By-Product Meal - Feed Grade - Mid South/ton $352.50 $352.50 $378.52 $361.17 $398.81 $405.00 $467.14 $423.65 Poultry By-Product Meal - Pet Food - Mid South/ton $552.50 $561.05 $652.84 $588.80 $728.57 $782.50 $798.21 $769.76 2026 Vegetable Oils Pricing Competing Ingredient for Feed Segment fats & biofuel feedstock January February March Q1 Avg. April May June Q2 Avg. July August Sept. Q3 Avg. Oct. Nov. Dec. Q4 Avg. Year Avg. Soybean Oil (crude/de-gummed) - Central Illinois / cwt $49.40 $55.83 $66.08 $57.10 $72.57 $78.99 $77.05 $76.20 Soybean Oil (RBD) - Central Illinois / cwt $52.88 $59.42 $69.95 $60.75 $76.91 $83.16 $81.16 $80.41 Distiller's Corn Oil - IL/WI cwt $54.01 $59.41 $70.86 $61.43 $78.04 $85.43 $83.73 $82.39 2026 Cash Corn Pricing Competing Ingredient for Bakery Feeds and Fats January February March Q1 Avg. April May June Q2 Avg. July August Sept. Q3 Avg. Oct. Nov. Dec. Q4 Avg. Year Avg. Corn - Track Central IL #2 Yellow / bushel $4.11 $4.15 $4.39 $4.22 $4.33 $4.36 $3.96 $4.22 2026 European Benchmark Pricing Palm Oil - Competing ingredient for edible fats in Food Segment Soy meal - Competing ingredient for protein meals in Feed Segment January February March Q1 Avg. April May June Q2 Avg. July August Sept. Q3 Avg. Oct. Nov. Dec. Q4 Avg. Year Avg. Palm oil - CIF Rotterdam / metric ton $1,288 $1,353 $1,463 $1,368 $1,551 $1,448 $1,572 $1,524 Soy meal - CIF Rotterdam / metric ton $375 $388 $407 $390 $425 $428 $407 $420 QTR. over QTR. (Sequential) Year over Year (Q2) Comparison Q1-2026 Q2-2026 % Q2-2025 Q2-2026 % Average Jacobsen Prices (USD) Avg. Avg. Change Avg. Avg. Change Yellow Grease - Illinois / cwt $36.63 $50.75 38.5% $36.63 $50.75 38.5% Used Cooking Oil (UCO) - Illinois / cwt $43.96 $65.84 49.8% $45.31 $65.84 45.3% Bleachable Fancy Tallow - Chicago Renderer / cwt $59.53 $86.51 45.3% $57.16 $86.51 51.3% Meat and Bone Meal - Ruminant - Illinois / ton $288.02 $315.52 9.5% $272.00 $315.52 16.0% Poultry By-Product Meal - Feed Grade - Mid South / ton $361.17 $423.65 17.3% $275.40 $423.65 53.8% Poultry By-Product Meal - Pet Food - Mid South / ton $588.80 $769.76 30.7% $464.30 $769.76 65.8% Soybean Oil (crude/de-gummed) - Central Illinois / cwt $57.10 $76.20 33.5% $49.04 $76.20 55.4% Soybean Oil (RBD) - Central Illinois / cwt $60.75 $80.41 32.4% $53.19 $80.41 51.2% Distiller's Corn Oil - IL/WI per cwt $61.43 $82.39 34.1% $55.64 $82.39 48.1% Average Wall Street Journal Prices (USD) Corn - Track Central IL #2 Yellow / bushel $4.22 $4.22 0.0% $4.33 $4.22 -2.5% Average Thomson Reuters Prices (USD) Palm oil - CIF Rotterdam / metric ton $1,368 $1,524 11.4% $1,306 $1,524 16.7% Soy meal - CIF Rotterdam / metric ton $390 $420 7.7% $362 $420 16.0% 2026 Average Jacobsen Prices (USD) 2026 Average Jacobsen Prices (USD) 2026 Average Wall Street Journal Prices (USD) 2026 Average Thomson Reuters Prices (USD) Historical Pricing
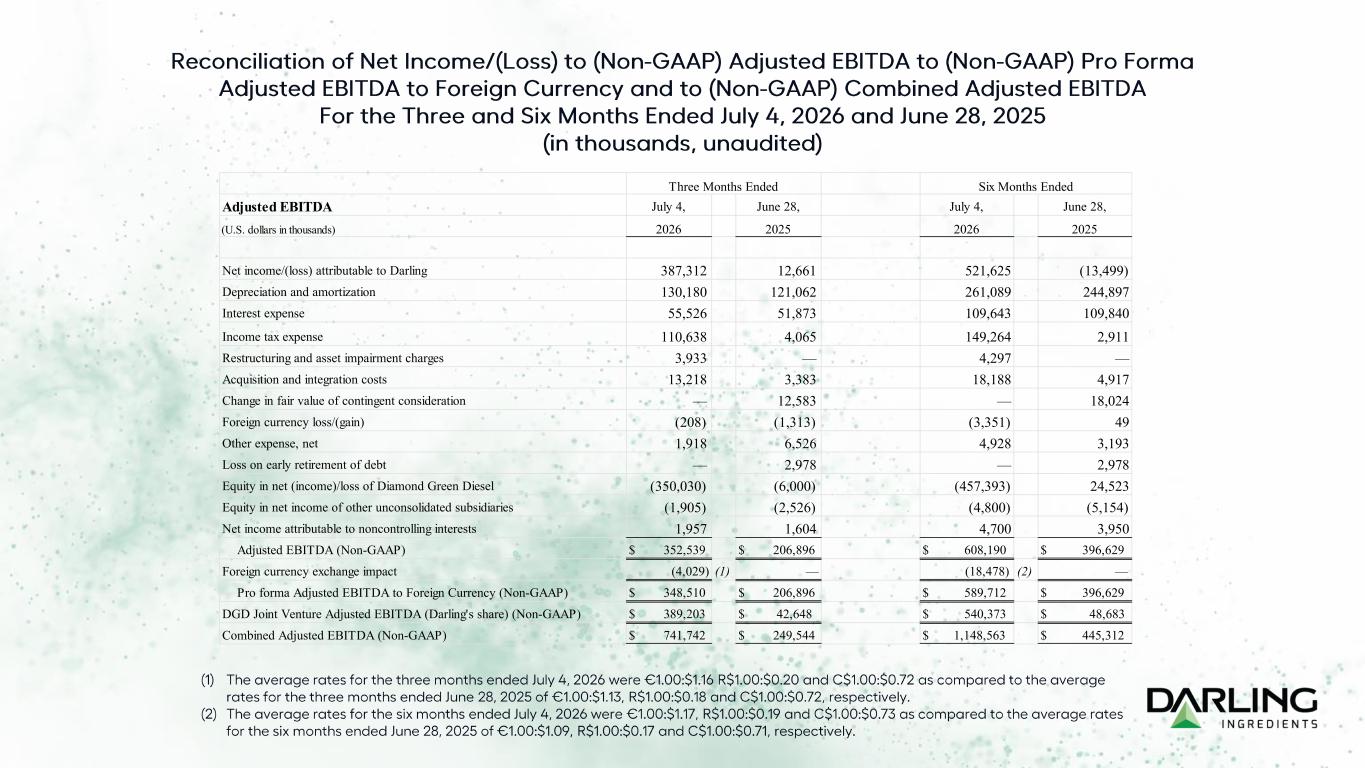
Reconciliation of Net Income/(Loss) to (Non -GAAP) Adjusted EBITDA to (Non -GAAP) Pro Forma Adjusted EBITDA to Foreign Currency and to (Non -GAAP) Combined Adjusted EBITDA For the Three and Six Months Ended July 4, 2026 and June 28, 2025 (in thousands, unaudited) (1) The average rates for the three months ended July 4, 2026 were €1.00:$1.16 R$1.00:$0.20 and C$1.00:$0.72 as compared to the a ver age rates for the three months ended June 28, 2025 of €1.00:$1.13, R$1.00:$0.18 and C$1.00:$0.72, respectively. (2) The average rates for the six months ended July 4, 2026 were €1.00:$1.17, R$1.00:$0.19 and C$1.00:$0.73 as compared to the av era ge rates for the six months ended June 28, 2025 of €1.00:$1.09, R$1.00:$0.17 and C$1.00:$0.71, respectively. Adjusted EBITDA July 4, June 28, July 4, June 28, (U.S. dollars in thousands) 2026 2025 2026 2025 Net income/(loss) attributable to Darling 387,312 12,661 521,625 (13,499) Depreciation and amortization 130,180 121,062 261,089 244,897 Interest expense 55,526 51,873 109,643 109,840 Income tax expense 110,638 4,065 149,264 2,911 Restructuring and asset impairment charges 3,933 — 4,297 — Acquisition and integration costs 13,218 3,383 18,188 4,917 Change in fair value of contingent consideration — 12,583 — 18,024 Foreign currency loss/(gain) (208) (1,313) (3,351) 49 Other expense, net 1,918 6,526 4,928 3,193 Loss on early retirement of debt — 2,978 — 2,978 Equity in net (income)/loss of Diamond Green Diesel (350,030) (6,000) (457,393) 24,523 Equity in net income of other unconsolidated subsidiaries (1,905) (2,526) (4,800) (5,154) Net income attributable to noncontrolling interests 1,957 1,604 4,700 3,950 Adjusted EBITDA (Non-GAAP) $ 352,539 $ 206,896 $ 608,190 $ 396,629 Foreign currency exchange impact (4,029) (1) — (18,478) (2) — Pro forma Adjusted EBITDA to Foreign Currency (Non-GAAP) $ 348,510 $ 206,896 $ 589,712 $ 396,629 DGD Joint Venture Adjusted EBITDA (Darling's share) (Non-GAAP) $ 389,203 $ 42,648 $ 540,373 $ 48,683 Combined Adjusted EBITDA (Non-GAAP) $ 741,742 $ 249,544 $ 1,148,563 $ 445,312 Three Months Ended Six Months Ended
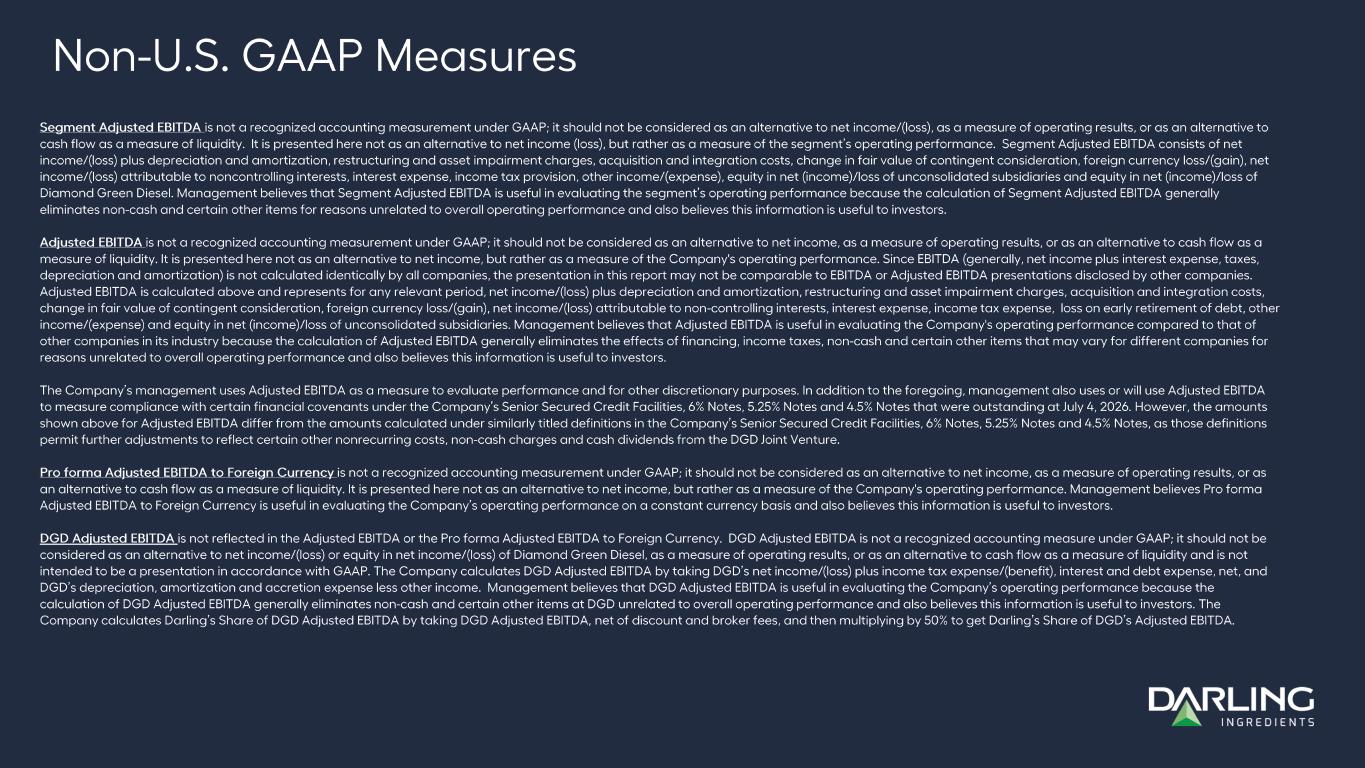
Segment Adjusted EBITDA is not a recognized accounting measurement under GAAP; it should not be considered as an alternative to net income/(loss), as a measure of operating results, or as an alternative to cash flow as a measure of liquidity. It is presented here not as an alternative to net income (loss), but rather as a measur e o f the segment’s operating performance. Segment Adjusted EBITDA consists of net income/(loss) plus depreciation and amortization, restructuring and asset impairment charges, acquisition and integration cos ts, change in fair value of contingent consideration, foreign currency loss/(gain), net income/(loss) attributable to noncontrolling interests, interest expense, income tax provision, other income/(expense), equit y in net (income)/loss of unconsolidated subsidiaries and equity in net (income)/loss of Diamond Green Diesel. Management believes that Segment Adjusted EBITDA is useful in evaluating the segment’s operating perfor man ce because the calculation of Segment Adjusted EBITDA generally eliminates non -cash and certain other items for reasons unrelated to overall operating performance and also believes this inform ation is useful to investors. Adjusted EBITDA is not a recognized accounting measurement under GAAP; it should not be considered as an alternative to net income, as a meas ure of operating results, or as an alternative to cash flow as a measure of liquidity. It is presented here not as an alternative to net income, but rather as a measure of the Company's oper ati ng performance. Since EBITDA (generally, net income plus interest expense, taxes, depreciation and amortization) is not calculated identically by all companies, the presentation in this report may not be com par able to EBITDA or Adjusted EBITDA presentations disclosed by other companies. Adjusted EBITDA is calculated above and represents for any relevant period, net income/(loss) plus depreciation and amortizat ion, restructuring and asset impairment charges, acquisition and integration costs, change in fair value of contingent consideration, foreign currency loss/(gain), net income/(loss) attributable to non -controllin g interests, interest expense, income tax expense, loss on early retirement of debt, other income/(expense) and equity in net (income)/loss of unconsolidated subsidiaries. Management believes that Adjusted EBITDA is use ful in evaluating the Company's operating performance compared to that of other companies in its industry because the calculation of Adjusted EBITDA generally eliminates the effects of financing, inc ome taxes, non -cash and certain other items that may vary for different companies for reasons unrelated to overall operating performance and also believes this information is useful to investors. The Company’s management uses Adjusted EBITDA as a measure to evaluate performance and for other discretionary purposes. In a ddi tion to the foregoing, management also uses or will use Adjusted EBITDA to measure compliance with certain financial covenants under the Company’s Senior Secured Credit Facilities, 6% Notes, 5.25% Not es and 4.5% Notes that were outstanding at July 4, 2026. However, the amounts shown above for Adjusted EBITDA differ from the amounts calculated under similarly titled definitions in the Company’s Senior Se cured Credit Facilities, 6% Notes, 5.25% Notes and 4.5% Notes, as those definitions permit further adjustments to reflect certain other nonrecurring costs, non -cash charges and cash dividends from the DGD Joint V enture. Pro forma Adjusted EBITDA to Foreign Currency is not a recognized accounting measurement under GAAP; it should not be considered as an alternative to net income, as a meas ure of operating results, or as an alternative to cash flow as a measure of liquidity. It is presented here not as an alternative to net income, but rather a s a measure of the Company's operating performance. Management believes Pro forma Adjusted EBITDA to Foreign Currency is useful in evaluating the Company’s operating performance on a constant currency basis and also believes this information is useful to investors. DGD Adjusted EBITDA is not reflected in the Adjusted EBITDA or the Pro forma Adjusted EBITDA to Foreign Currency. DGD Adjusted EBITDA is not a r eco gnized accounting measure under GAAP; it should not be considered as an alternative to net income/(loss) or equity in net income/(loss) of Diamond Green Diesel, as a measure of ope rat ing results, or as an alternative to cash flow as a measure of liquidity and is not intended to be a presentation in accordance with GAAP. The Company calculates DGD Adjusted EBITDA by taking DGD’s net income/ (loss) plus income tax expense/(benefit), interest and debt expense, net, and DGD’s depreciation, amortization and accretion expense less other income. Management believes that DGD Adjusted EBITDA is us efu l in evaluating the Company’s operating performance because the calculation of DGD Adjusted EBITDA generally eliminates non -cash and certain other items at DGD unrelated to overall operating p erformance and also believes this information is useful to investors. The Company calculates Darling’s Share of DGD Adjusted EBITDA by taking DGD Adjusted EBITDA, net of discount and broker fees, and then multiplying by 50% to get Darling’s Share of DGD’s Adjusted EBITDA. Non -U.S. GAAP Measures
Combined Adjusted EBITDA is not a recognized accounting measurement under GAAP; it should not be considered as an alternative to net income, as a meas ure of operating results, or as an alternative to cash flow as a measure of liquidity. It is presented here not as an alternative to net income, but rather as a measure of the Com pan y’s operating performance. Combined Adjusted EBITDA consists of Adjusted EBITDA plus DGD Adjusted EBITDA (Darling’s Share). When Combined Adjusted EBITDA is presented by segment, Combined Adjusted EBITDA con sists of Segment Adjusted EBITDA plus DGD Adjusted EBITDA (Darling’s Share). Management believes that Combined Adjusted EBITDA is useful in evaluating the Company's operating performance compar ed to that of other companies in its industry because the calculation of Combined Adjusted EBITDA generally eliminates the effects of financing, income taxes, non -cash and certain other items that may vary for different companies for reasons unrelated to overall operating performance and also believes this information is useful to investors. Adjusted EBITDA per gallon is not a recognized accounting measurement under GAAP; it should not be considered as an alternative to net income or equity in income of Diamond Green Diesel, as a measure of operating results, or as an alternative to cash flow as a measure of liquidity and is not intended to be a presentation in ac cor dance with GAAP. Adjusted EBITDA per gallon is presented here not as an alternative to net income or equity in income of Diamond Green Diesel, but rather as a measure of Diamond Green Diesel's operating performan ce. Since Adjusted EBITDA per gallon (generally, net income plus interest expense, taxes, depreciation and amortization divided by total gallons sold) is not calculated identically by all companies, this pres ent ation may not be comparable to Adjusted EBITDA per gallon presentations disclosed by other companies. Management believes that Adjusted EBITDA per gallon is useful in evaluating Diamond Green Diesel's operating pe rformance compared to that of other companies in its industry because the calculation of Adjusted EBITDA per gallon generally eliminates the effects of financing, income taxes and non -cash and certain other items presented on a per gallon basis that may vary for different companies for reasons unrelated to overall operating performance. Non -U.S. GAAP Measures

FINANCIAL RESULTS Q2 2026 July 30, 2026