Shareholder Report
May 31, 2026
USD ($)
$ / shares
This report describes changes to the Fund that occurred during the reporting period.
WHAT WERE THE FUND COSTS FOR THE LAST YEAR? (based on a hypothetical $10,000 investment)
|
Class Name
|
Costs of a $10,000 investment
|
Costs paid as a percentage of a $10,000 investment*
|
|
Class A
|
$89
|
0.86%
|
HOW DID THE FUND PERFORM LAST YEAR AND WHAT AFFECTED ITS PERFORMANCE?
For the twelve months ended May 31, 2026, Class A shares of Putnam Mortgage Opportunities Fund returned 7.19%. The Fund compares its performance to the ICE BofA U.S. Treasury Bill Index and the Bloomberg U.S. MBS Index, which returned 4.00% and 6.85%, respectively, for the same period.
PERFORMANCE HIGHLIGHTS
|
Top contributors to performance:
|
|
|
↑
|
Commercial mortgage-backed securities (CMBS) contributed during the period, particularly cash bond holdings. The outlook for commercial real estate (CRE) has improved, fundamentals have stabilized and supply and demand technicals remained positive.
|
|
↑
|
Non-agency residential mortgage-backed securities (RMBS) also contributed. Homeowner balance sheets remained well positioned, supported by locked in home price appreciation, lower household leverage, and strong underwriting standards.
|
|
↑
|
Prepayment strategies contributed as a whole, driven by tactical mortgage basis positioning as well exposure to interest-only (IO) securities which benefited as prepayment speeds remained below historical averages with many borrowers not having an incentive to refinance.
|
|
Top detractors from performance:
|
|
|
↓
|
Inverse IO securities detracted overall from performance, particularly higher coupon inverse IOs as the rate rally in 2025 increased the likelihood that newer collateral with higher rates would prepay.
|
Use of derivatives and the impact on performance:
The Fund utilized interest-rate swaps to hedge term structure risk and for yield curve positioning. Options were used to hedge duration and convexity, isolate prepayment risk, and manage downside risks. In addition, commercial real estate derivatives were used to gain exposure to the CMBS sector and hedge credit and market risks. Futures were used for hedging Treasury term structure risk and for yield curve positioning. In aggregate, these derivatives contributed to performance.
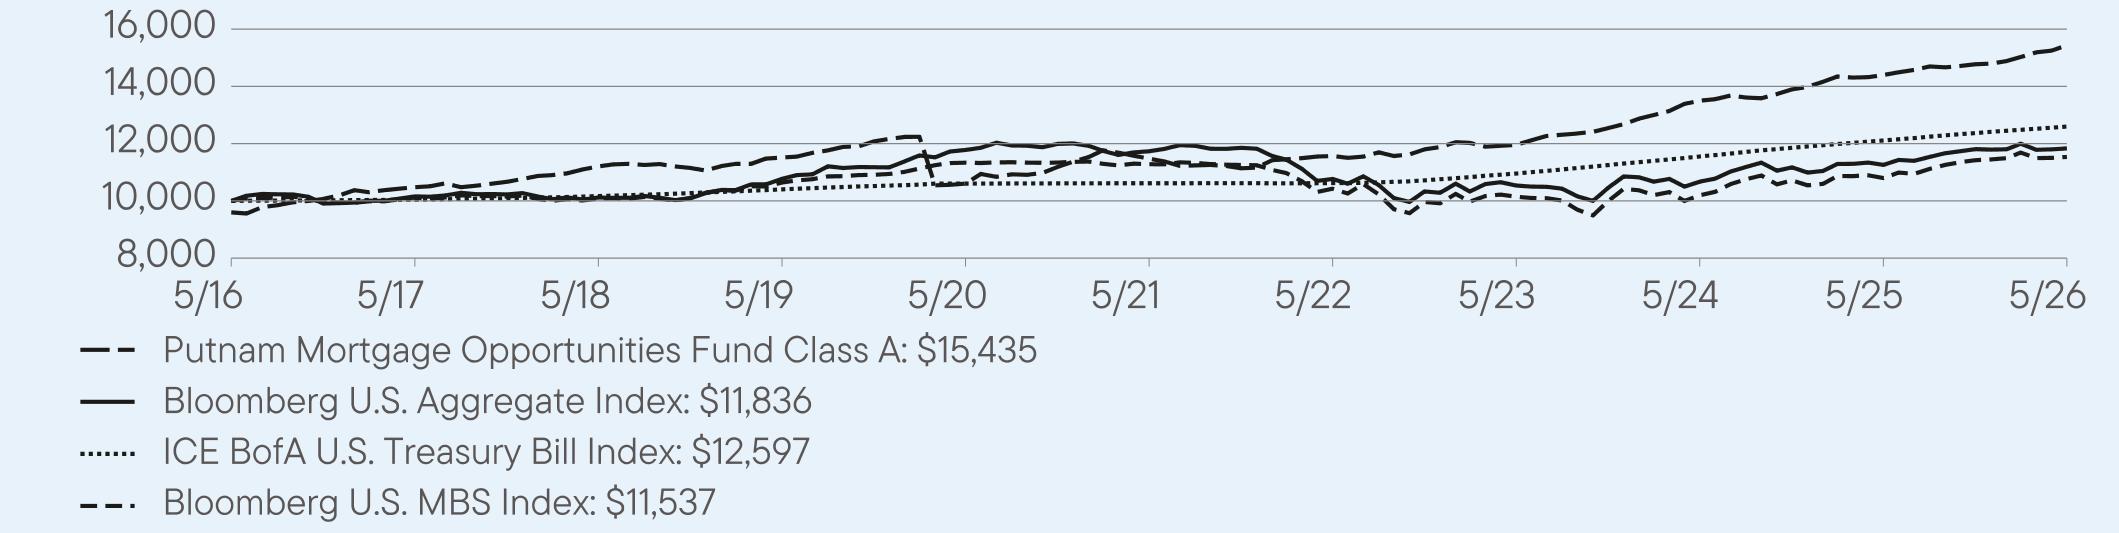
AVERAGE ANNUAL TOTAL RETURNS (%) Period Ended May 31, 2026
|
|
1 Year
|
5 Year
|
10 Year
|
|
Class A
|
7.19
|
6.11
|
4.86
|
|
Class A (with sales charge)
|
2.91
|
5.25
|
4.44
|
|
Bloomberg U.S. Aggregate Index
|
5.13
|
0.17
|
1.70
|
|
ICE BofA U.S. Treasury Bill Index
|
4.00
|
3.48
|
2.34
|
|
Bloomberg U.S. MBS Index
|
6.85
|
0.45
|
1.44
|
For current month-end performance, please call Franklin Templeton at (800) 225-1581 or visit
https://www.franklintempleton.com/investments/options/mutual-funds.
https://www.franklintempleton.com/investments/options/mutual-funds.
Important data provider notices and terms available at www.franklintempletondatasources.com.
KEY FUND STATISTICS (as of May 31, 2026)
|
Total Net Assets
|
$479,937,056
|
|
Total Number of Portfolio Holdings (excludes derivatives, except purchased options, if any)
|
419
|
|
Total Management Fee Paid
|
$1,876,082
|
|
Portfolio Turnover Rate
|
559%
|
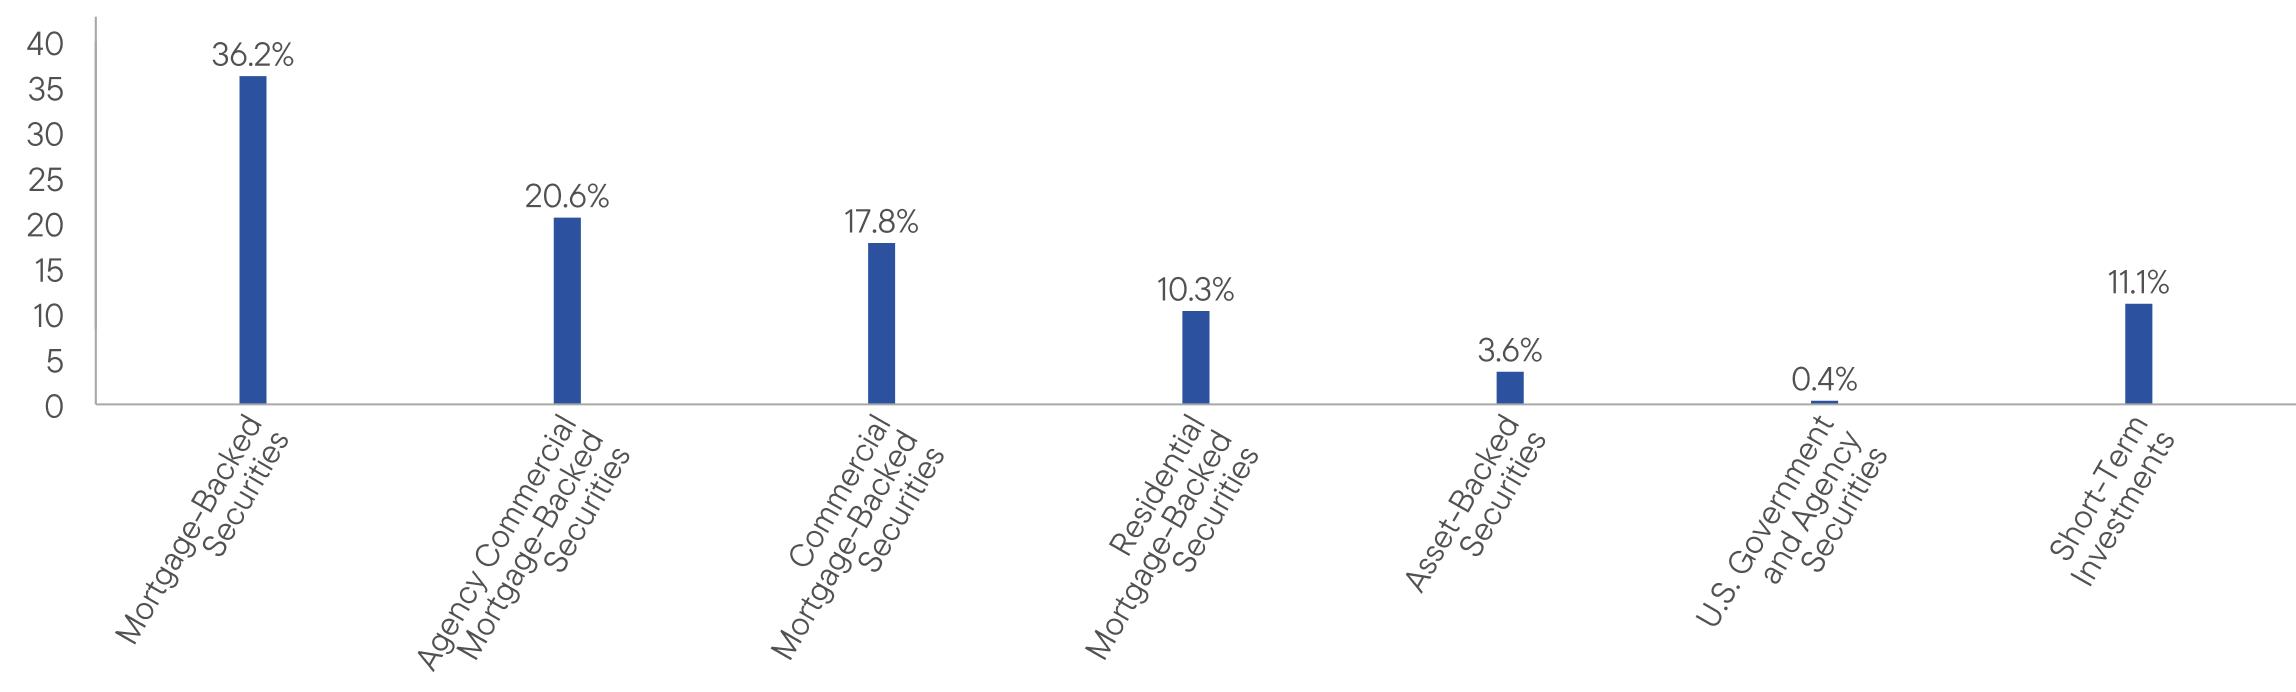
WHAT DID THE FUND INVEST IN? (as of May 31, 2026)
Portfolio Composition* (% of Total Investments)
HOW HAS THE FUND CHANGED?
Effective December 31, 2025, the portfolio managers primarily responsible for the day-to-day management of the Fund are Neil Dhruv, Jatin Misra, PhD, CFA, and Michael V. Salm.
At a meeting on May 21, 2026, the Fund’s Board of Trustees (the “Board”) approved, and recommended that shareholders approve, the conversion of the Fund from a mutual fund into an exchange traded fund through the reorganization of the Fund with and into a newly-organized exchange traded fund (the “ETF”). Pursuant to an Agreement and Plan of Reorganization (the “Plan”) approved by the Board, the proposed reorganization, if approved by shareholders of the Fund, will consist of (1) the transfer of substantially all of the Fund’s assets, subject to its liabilities, to the ETF in return for shares of the ETF; and (2) the distribution of the ETF shares to the Fund’s shareholders in complete liquidation of the Fund. Completion of the proposed reorganization is subject to a number of conditions under the Plan, including shareholder approval. Fund shareholders will receive on or around September 3, 2026, a prospectus/proxy statement describing in detail: (i) information about voting on the proposed reorganization, (ii) details regarding the proposed reorganization and the ETF, and (iii) a summary of the Board’s considerations in approving the proposed reorganization. If shareholders of the Fund do not approve the proposed reorganization, the reorganization will not proceed. It is anticipated that the proposed reorganization, if approved by shareholders, would occur in or around the first quarter of 2027.
This is a summary of certain changes to the Fund since June 1, 2025. For more complete information, you may review the Fund’s current prospectus and any applicable supplements and the Fund’s next prospectus, which we expect to be available by October 1, 2026, at https://www.franklintempleton.com/regulatory-fund-documents or upon request at (800) 225-1581 or
funddocuments@putnam.com.
funddocuments@putnam.com.
This report describes changes to the Fund that occurred during the reporting period.
WHAT WERE THE FUND COSTS FOR THE LAST YEAR? (based on a hypothetical $10,000 investment)
|
Class Name
|
Costs of a $10,000 investment
|
Costs paid as a percentage of a $10,000 investment*
|
|
Class C
|
$166
|
1.61%
|
HOW DID THE FUND PERFORM LAST YEAR AND WHAT AFFECTED ITS PERFORMANCE?
For the twelve months ended May 31, 2026, Class C shares of Putnam Mortgage Opportunities Fund returned 6.26%. The Fund compares its performance to the ICE BofA U.S. Treasury Bill Index and the Bloomberg U.S. MBS Index, which returned 4.00% and 6.85%, respectively, for the same period.
PERFORMANCE HIGHLIGHTS
|
Top contributors to performance:
|
|
|
↑
|
Commercial mortgage-backed securities (CMBS) contributed during the period, particularly cash bond holdings. The outlook for commercial real estate (CRE) has improved, fundamentals have stabilized and supply and demand technicals remained positive.
|
|
↑
|
Non-agency residential mortgage-backed securities (RMBS) also contributed. Homeowner balance sheets remained well positioned, supported by locked in home price appreciation, lower household leverage, and strong underwriting standards.
|
|
↑
|
Prepayment strategies contributed as a whole, driven by tactical mortgage basis positioning as well exposure to interest-only (IO) securities which benefited as prepayment speeds remained below historical averages with many borrowers not having an incentive to refinance.
|
|
Top detractors from performance:
|
|
|
↓
|
Inverse IO securities detracted overall from performance, particularly higher coupon inverse IOs as the rate rally in 2025 increased the likelihood that newer collateral with higher rates would prepay.
|
Use of derivatives and the impact on performance:
The Fund utilized interest-rate swaps to hedge term structure risk and for yield curve positioning. Options were used to hedge duration and convexity, isolate prepayment risk, and manage downside risks. In addition, commercial real estate derivatives were used to gain exposure to the CMBS sector and hedge credit and market risks. Futures were used for hedging Treasury term structure risk and for yield curve positioning. In aggregate, these derivatives contributed to performance.
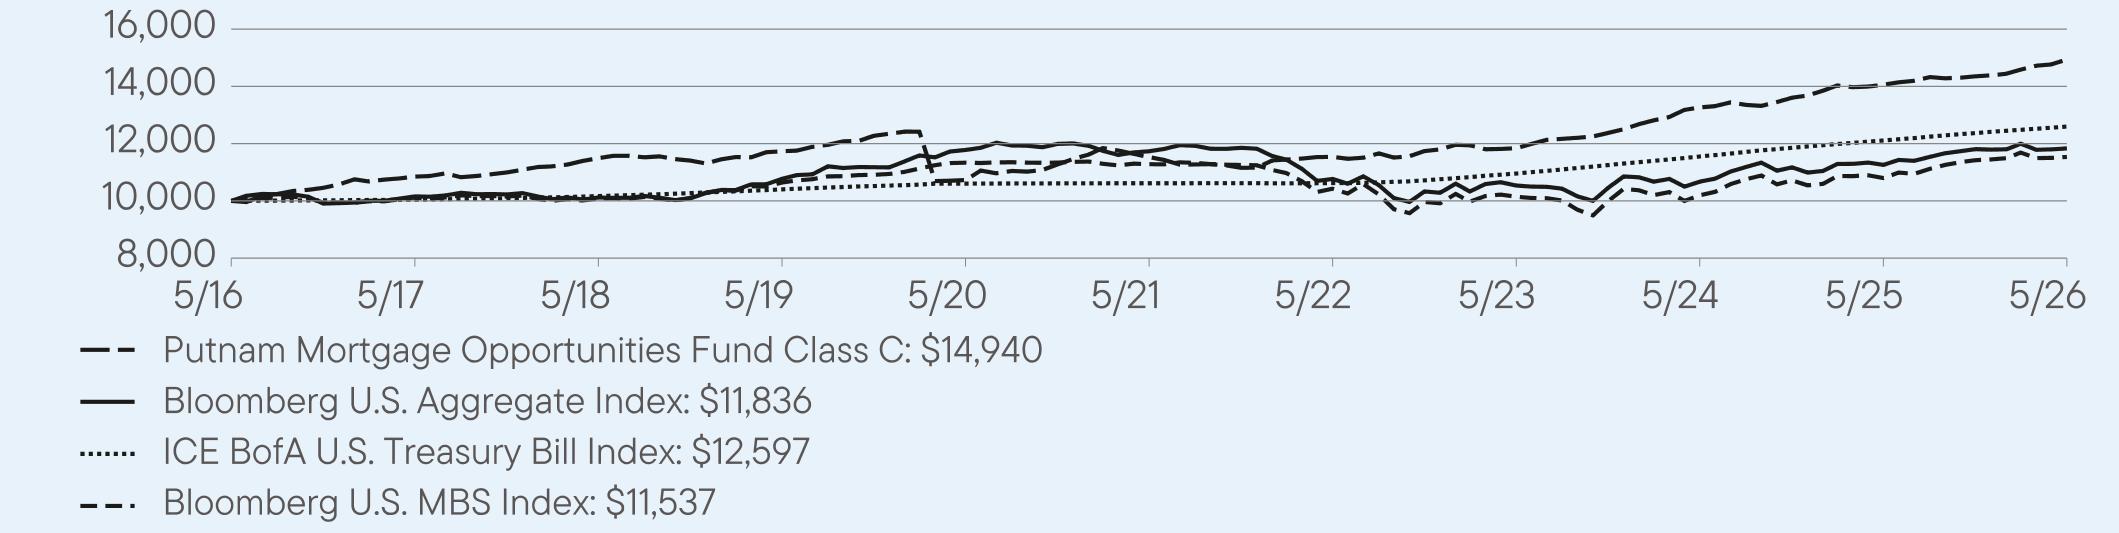
AVERAGE ANNUAL TOTAL RETURNS (%) Period Ended May 31, 2026
|
|
1 Year
|
5 Year
|
10 Year
|
|
Class C
|
6.26
|
5.32
|
4.25
|
|
Class C (with sales charge)
|
5.26
|
5.32
|
4.25
|
|
Bloomberg U.S. Aggregate Index
|
5.13
|
0.17
|
1.70
|
|
ICE BofA U.S. Treasury Bill Index
|
4.00
|
3.48
|
2.34
|
|
Bloomberg U.S. MBS Index
|
6.85
|
0.45
|
1.44
|
For current month-end performance, please call Franklin Templeton at (800) 225-1581 or visit
https://www.franklintempleton.com/investments/options/mutual-funds.
https://www.franklintempleton.com/investments/options/mutual-funds.
Important data provider notices and terms available at www.franklintempletondatasources.com.
KEY FUND STATISTICS (as of May 31, 2026)
|
Total Net Assets
|
$479,937,056
|
|
Total Number of Portfolio Holdings (excludes derivatives, except purchased options, if any)
|
419
|
|
Total Management Fee Paid
|
$1,876,082
|
|
Portfolio Turnover Rate
|
559%
|
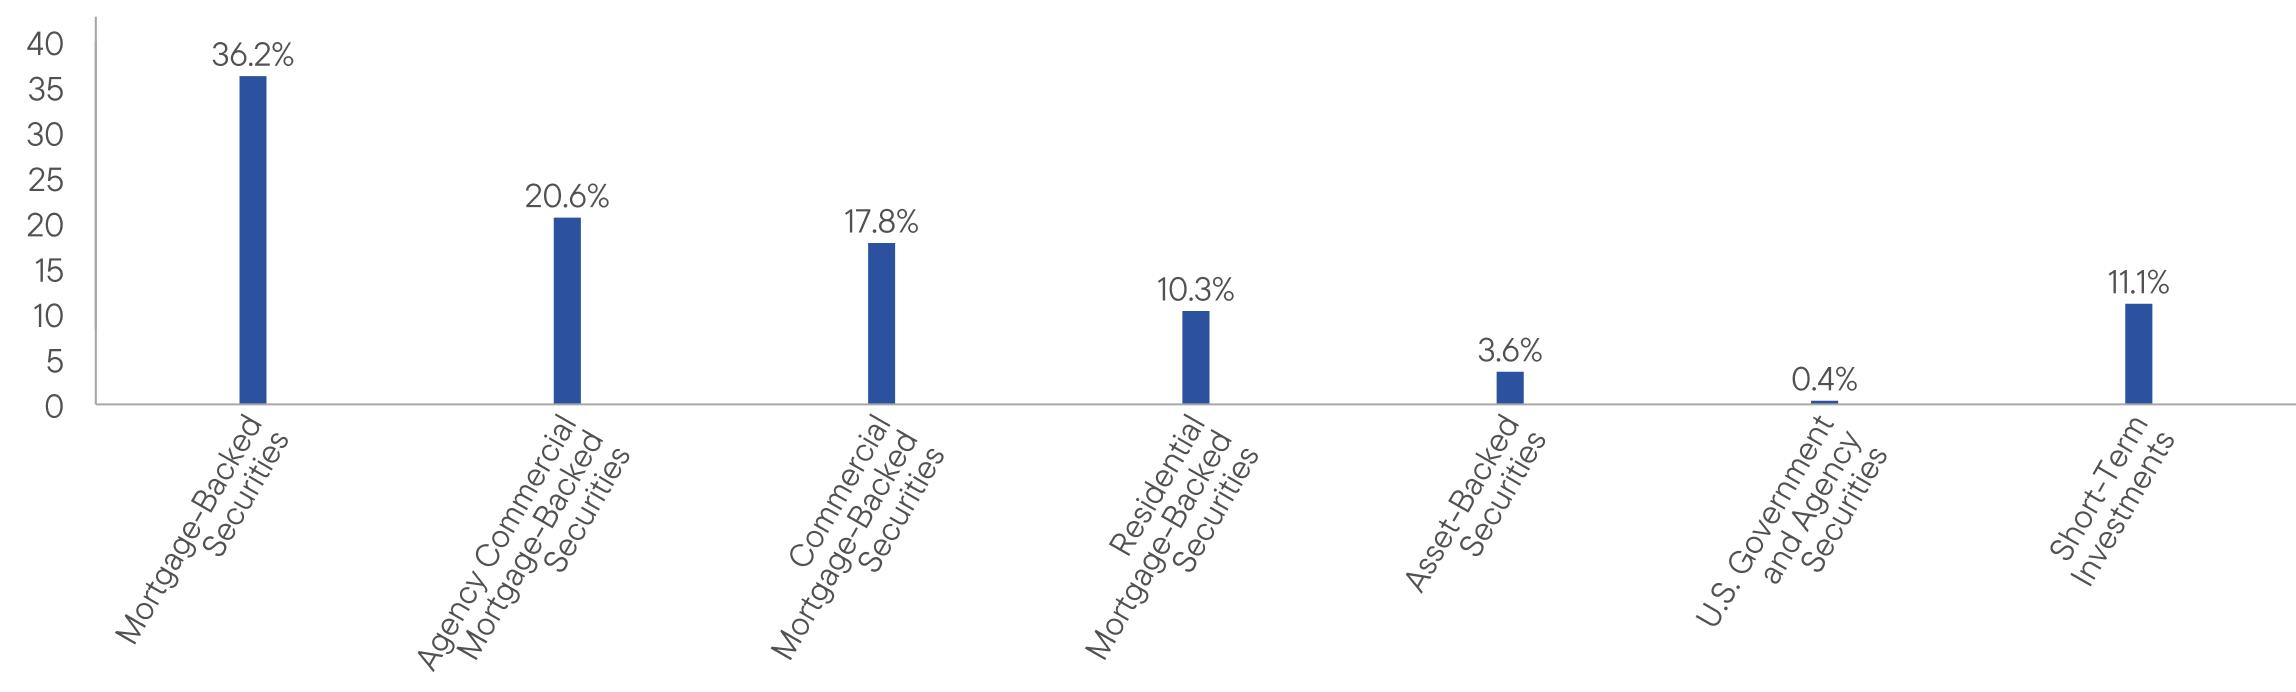
WHAT DID THE FUND INVEST IN? (as of May 31, 2026)
Portfolio Composition* (% of Total Investments)
HOW HAS THE FUND CHANGED?
Effective December 31, 2025, the portfolio managers primarily responsible for the day-to-day management of the Fund are Neil Dhruv, Jatin Misra, PhD, CFA, and Michael V. Salm.
At a meeting on May 21, 2026, the Fund’s Board of Trustees (the “Board”) approved, and recommended that shareholders approve, the conversion of the Fund from a mutual fund into an exchange traded fund through the reorganization of the Fund with and into a newly-organized exchange traded fund (the “ETF”). Pursuant to an Agreement and Plan of Reorganization (the “Plan”) approved by the Board, the proposed reorganization, if approved by shareholders of the Fund, will consist of (1) the transfer of substantially all of the Fund’s assets, subject to its liabilities, to the ETF in return for shares of the ETF; and (2) the distribution of the ETF shares to the Fund’s shareholders in complete liquidation of the Fund. Completion of the proposed reorganization is subject to a number of conditions under the Plan, including shareholder approval. Fund shareholders will receive on or around September 3, 2026, a prospectus/proxy statement describing in detail: (i) information about voting on the proposed reorganization, (ii) details regarding the proposed reorganization and the ETF, and (iii) a summary of the Board’s considerations in approving the proposed reorganization. If shareholders of the Fund do not approve the proposed reorganization, the reorganization will not proceed. It is anticipated that the proposed reorganization, if approved by shareholders, would occur in or around the first quarter of 2027.
This is a summary of certain changes to the Fund since June 1, 2025. For more complete information, you may review the Fund’s current prospectus and any applicable supplements and the Fund’s next prospectus, which we expect to be available by October 1, 2026, at https://www.franklintempleton.com/regulatory-fund-documents or upon request at (800) 225-1581 or
funddocuments@putnam.com.
funddocuments@putnam.com.
This report describes changes to the Fund that occurred during the reporting period.
WHAT WERE THE FUND COSTS FOR THE LAST YEAR? (based on a hypothetical $10,000 investment)
|
Class Name
|
Costs of a $10,000 investment
|
Costs paid as a percentage of a $10,000 investment*
|
|
Class I
|
$49
|
0.47%
|
HOW DID THE FUND PERFORM LAST YEAR AND WHAT AFFECTED ITS PERFORMANCE?
For the twelve months ended May 31, 2026, Class I shares of Putnam Mortgage Opportunities Fund returned 7.60%. The Fund compares its performance to the ICE BofA U.S. Treasury Bill Index and the Bloomberg U.S. MBS Index, which returned 4.00% and 6.85%, respectively, for the same period.
PERFORMANCE HIGHLIGHTS
|
Top contributors to performance:
|
|
|
↑
|
Commercial mortgage-backed securities (CMBS) contributed during the period, particularly cash bond holdings. The outlook for commercial real estate (CRE) has improved, fundamentals have stabilized and supply and demand technicals remained positive.
|
|
↑
|
Non-agency residential mortgage-backed securities (RMBS) also contributed. Homeowner balance sheets remained well positioned, supported by locked in home price appreciation, lower household leverage, and strong underwriting standards.
|
|
↑
|
Prepayment strategies contributed as a whole, driven by tactical mortgage basis positioning as well exposure to interest-only (IO) securities which benefited as prepayment speeds remained below historical averages with many borrowers not having an incentive to refinance.
|
|
Top detractors from performance:
|
|
|
↓
|
Inverse IO securities detracted overall from performance, particularly higher coupon inverse IOs as the rate rally in 2025 increased the likelihood that newer collateral with higher rates would prepay.
|
Use of derivatives and the impact on performance:
The Fund utilized interest-rate swaps to hedge term structure risk and for yield curve positioning. Options were used to hedge duration and convexity, isolate prepayment risk, and manage downside risks. In addition, commercial real estate derivatives were used to gain exposure to the CMBS sector and hedge credit and market risks. Futures were used for hedging Treasury term structure risk and for yield curve positioning. In aggregate, these derivatives contributed to performance.
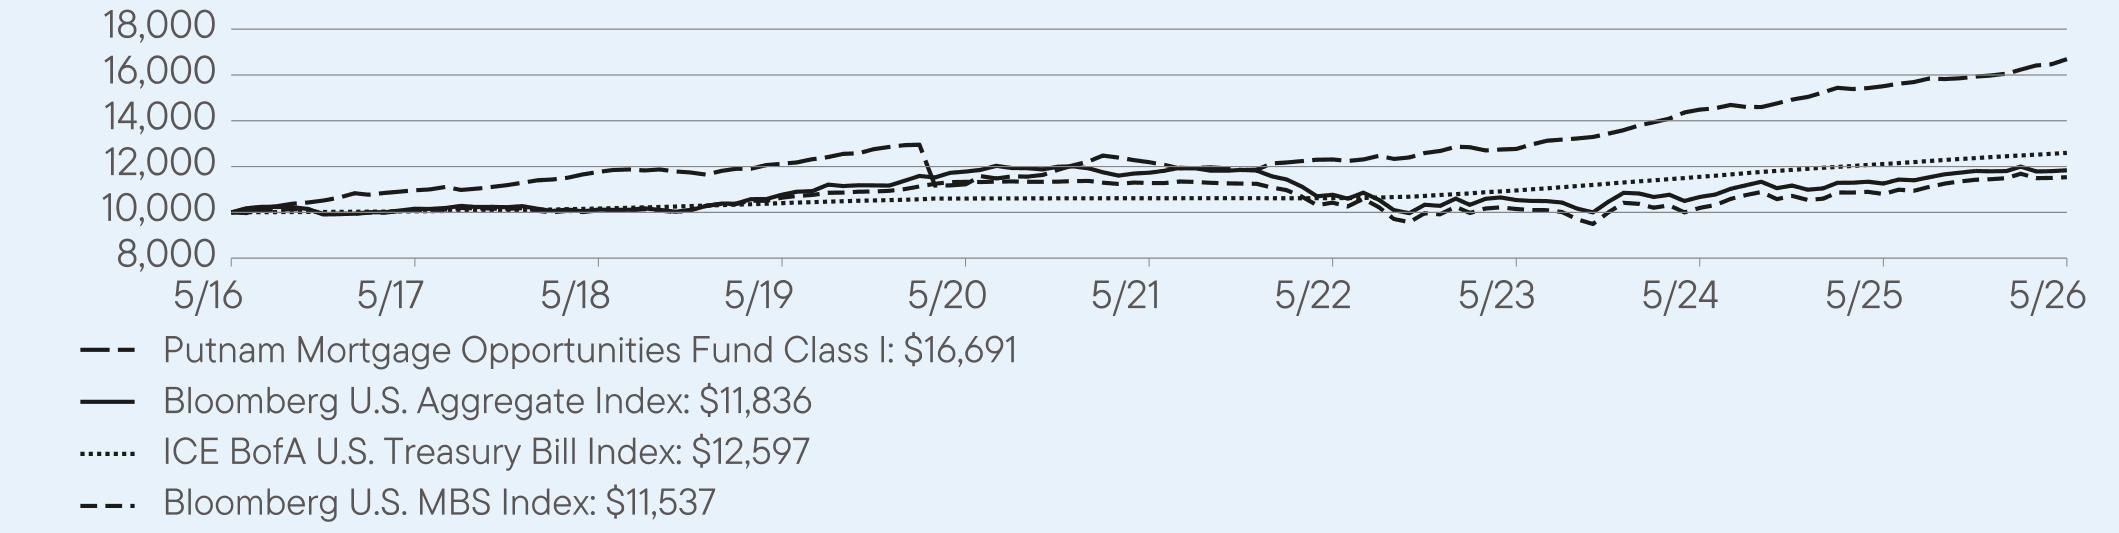
AVERAGE ANNUAL TOTAL RETURNS (%) Period Ended May 31, 2026
|
|
1 Year
|
5 Year
|
10 Year
|
|
Class I
|
7.60
|
6.49
|
5.26
|
|
Bloomberg U.S. Aggregate Index
|
5.13
|
0.17
|
1.70
|
|
ICE BofA U.S. Treasury Bill Index
|
4.00
|
3.48
|
2.34
|
|
Bloomberg U.S. MBS Index
|
6.85
|
0.45
|
1.44
|
For current month-end performance, please call Franklin Templeton at (800) 225-1581 or visit
https://www.franklintempleton.com/investments/options/mutual-funds.
https://www.franklintempleton.com/investments/options/mutual-funds.
Important data provider notices and terms available at www.franklintempletondatasources.com.
KEY FUND STATISTICS (as of May 31, 2026)
|
Total Net Assets
|
$479,937,056
|
|
Total Number of Portfolio Holdings (excludes derivatives, except purchased options, if any)
|
419
|
|
Total Management Fee Paid
|
$1,876,082
|
|
Portfolio Turnover Rate
|
559%
|
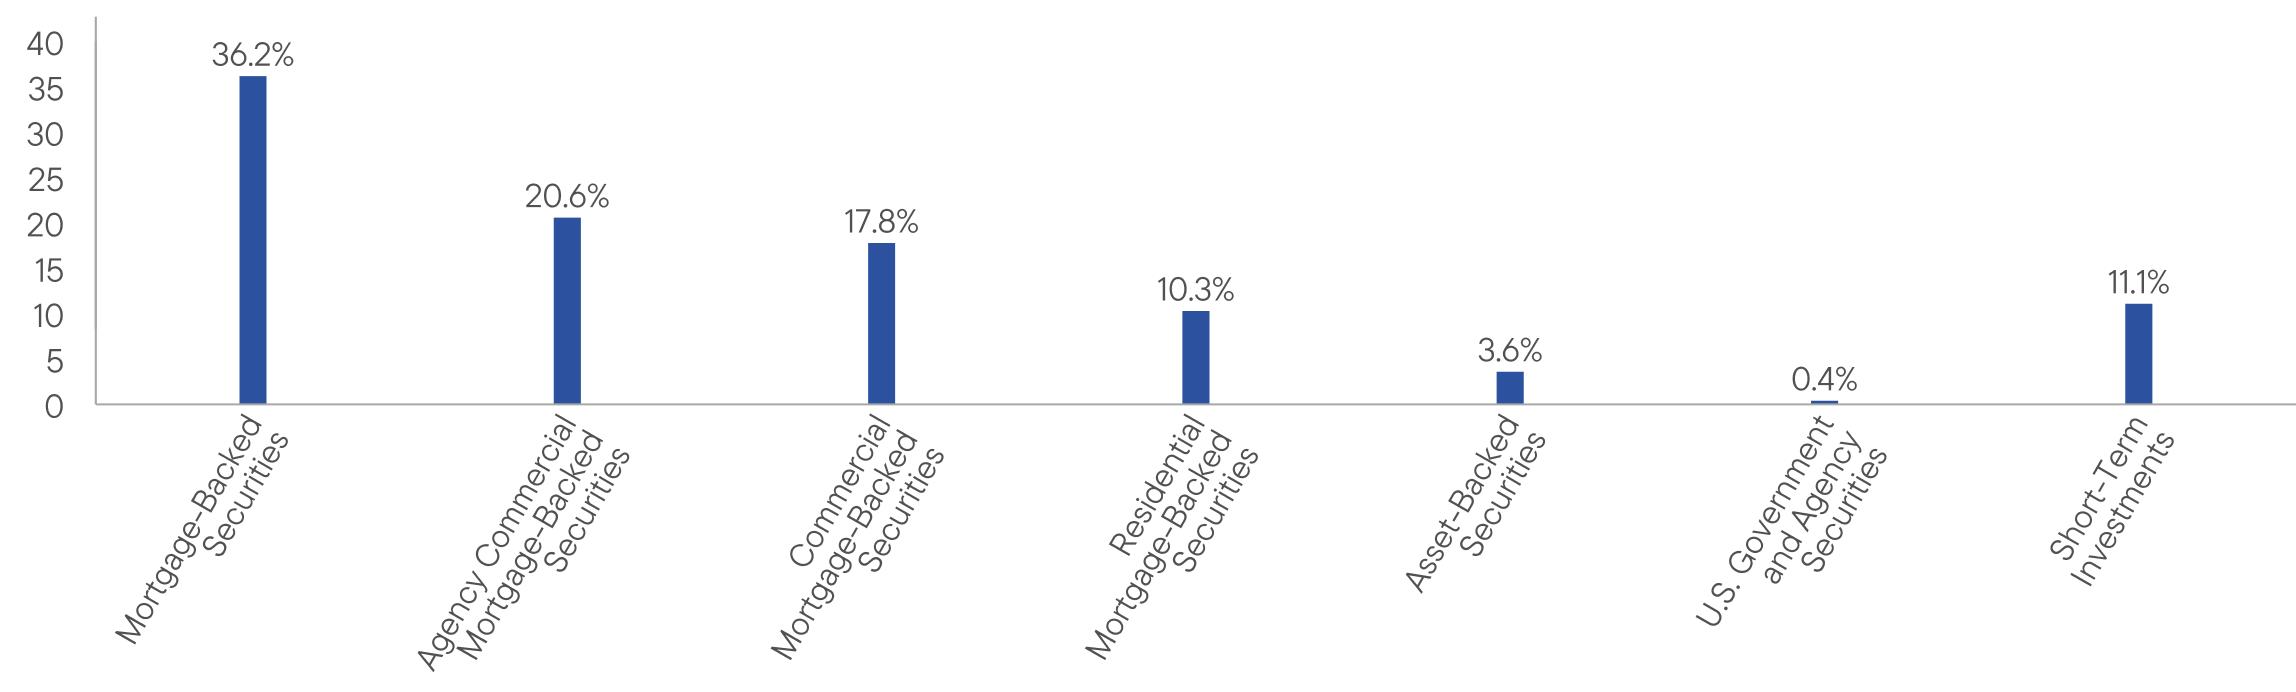
WHAT DID THE FUND INVEST IN? (as of May 31, 2026)
Portfolio Composition* (% of Total Investments)
HOW HAS THE FUND CHANGED?
Effective December 31, 2025, the portfolio managers primarily responsible for the day-to-day management of the Fund are Neil Dhruv, Jatin Misra, PhD, CFA, and Michael V. Salm.
At a meeting on May 21, 2026, the Fund’s Board of Trustees (the “Board”) approved, and recommended that shareholders approve, the conversion of the Fund from a mutual fund into an exchange traded fund through the reorganization of the Fund with and into a newly-organized exchange traded fund (the “ETF”). Pursuant to an Agreement and Plan of Reorganization (the “Plan”) approved by the Board, the proposed reorganization, if approved by shareholders of the Fund, will consist of (1) the transfer of substantially all of the Fund’s assets, subject to its liabilities, to the ETF in return for shares of the ETF; and (2) the distribution of the ETF shares to the Fund’s shareholders in complete liquidation of the Fund. Completion of the proposed reorganization is subject to a number of conditions under the Plan, including shareholder approval. Fund shareholders will receive on or around September 3, 2026, a prospectus/proxy statement describing in detail: (i) information about voting on the proposed reorganization, (ii) details regarding the proposed reorganization and the ETF, and (iii) a summary of the Board’s considerations in approving the proposed reorganization. If shareholders of the Fund do not approve the proposed reorganization, the reorganization will not proceed. It is anticipated that the proposed reorganization, if approved by shareholders, would occur in or around the first quarter of 2027.
This is a summary of certain changes to the Fund since June 1, 2025. For more complete information, you may review the Fund’s current prospectus and any applicable supplements and the Fund’s next prospectus, which we expect to be available by October 1, 2026, at https://www.franklintempleton.com/regulatory-fund-documents or upon request at (800) 225-1581 or
funddocuments@putnam.com.
funddocuments@putnam.com.
This report describes changes to the Fund that occurred during the reporting period.
WHAT WERE THE FUND COSTS FOR THE LAST YEAR? (based on a hypothetical $10,000 investment)
|
Class Name
|
Costs of a $10,000 investment
|
Costs paid as a percentage of a $10,000 investment*
|
|
Class R6
|
$52
|
0.50%
|
HOW DID THE FUND PERFORM LAST YEAR AND WHAT AFFECTED ITS PERFORMANCE?
For the twelve months ended May 31, 2026, Class R6 shares of Putnam Mortgage Opportunities Fund returned 7.55%. The Fund compares its performance to the ICE BofA U.S. Treasury Bill Index and the Bloomberg U.S. MBS Index, which returned 4.00% and 6.85%, respectively, for the same period.
PERFORMANCE HIGHLIGHTS
|
Top contributors to performance:
|
|
|
↑
|
Commercial mortgage-backed securities (CMBS) contributed during the period, particularly cash bond holdings. The outlook for commercial real estate (CRE) has improved, fundamentals have stabilized and supply and demand technicals remained positive.
|
|
↑
|
Non-agency residential mortgage-backed securities (RMBS) also contributed. Homeowner balance sheets remained well positioned, supported by locked in home price appreciation, lower household leverage, and strong underwriting standards.
|
|
↑
|
Prepayment strategies contributed as a whole, driven by tactical mortgage basis positioning as well exposure to interest-only (IO) securities which benefited as prepayment speeds remained below historical averages with many borrowers not having an incentive to refinance.
|
|
Top detractors from performance:
|
|
|
↓
|
Inverse IO securities detracted overall from performance, particularly higher coupon inverse IOs as the rate rally in 2025 increased the likelihood that newer collateral with higher rates would prepay.
|
Use of derivatives and the impact on performance:
The Fund utilized interest-rate swaps to hedge term structure risk and for yield curve positioning. Options were used to hedge duration and convexity, isolate prepayment risk, and manage downside risks. In addition, commercial real estate derivatives were used to gain exposure to the CMBS sector and hedge credit and market risks. Futures were used for hedging Treasury term structure risk and for yield curve positioning. In aggregate, these derivatives contributed to performance.
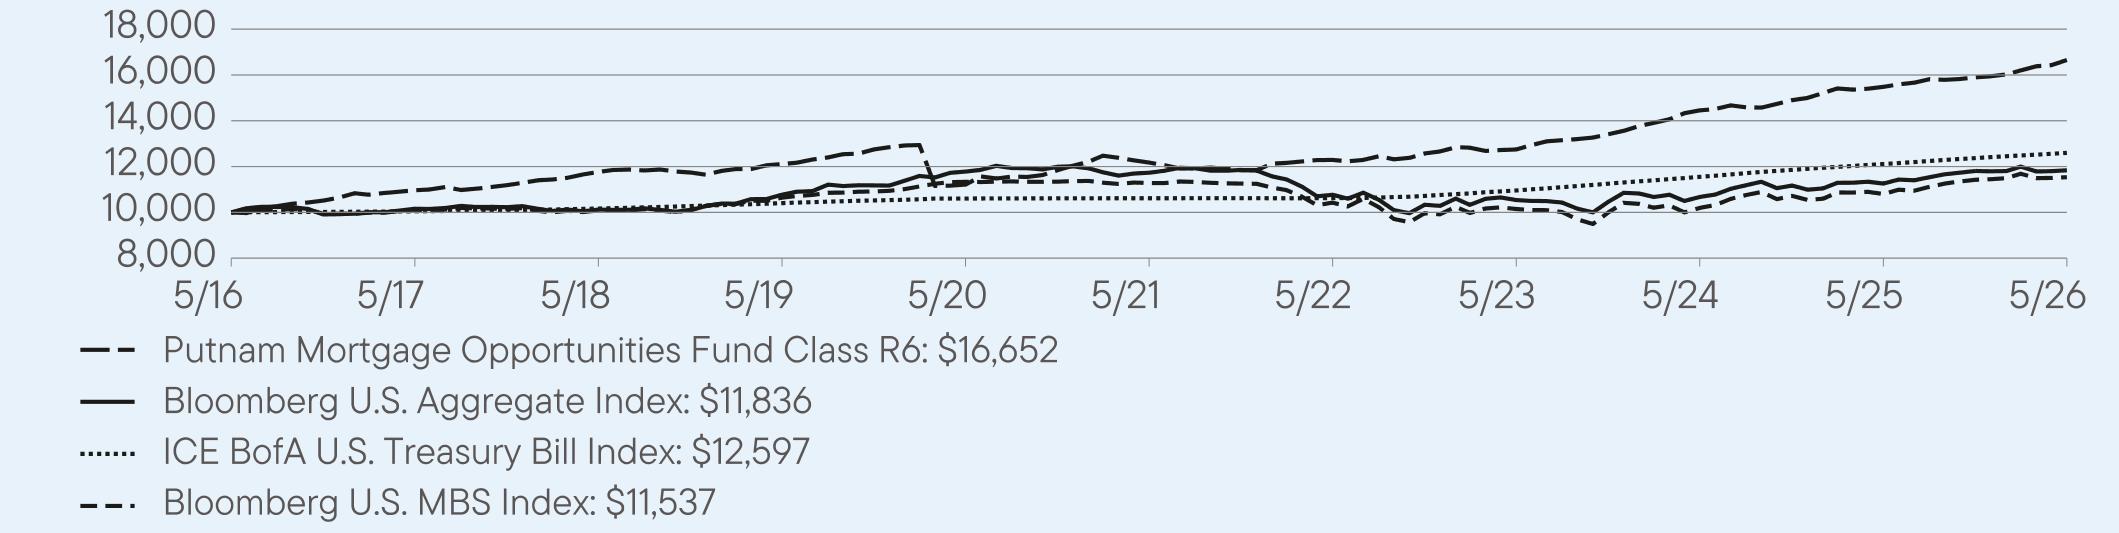
AVERAGE ANNUAL TOTAL RETURNS (%) Period Ended May 31, 2026
|
|
1 Year
|
5 Year
|
10 Year
|
|
Class R6
|
7.55
|
6.47
|
5.23
|
|
Bloomberg U.S. Aggregate Index
|
5.13
|
0.17
|
1.70
|
|
ICE BofA U.S. Treasury Bill Index
|
4.00
|
3.48
|
2.34
|
|
Bloomberg U.S. MBS Index
|
6.85
|
0.45
|
1.44
|
For current month-end performance, please call Franklin Templeton at (800) 225-1581 or visit
https://www.franklintempleton.com/investments/options/mutual-funds.
https://www.franklintempleton.com/investments/options/mutual-funds.
Important data provider notices and terms available at www.franklintempletondatasources.com.
KEY FUND STATISTICS (as of May 31, 2026)
|
Total Net Assets
|
$479,937,056
|
|
Total Number of Portfolio Holdings (excludes derivatives, except purchased options, if any)
|
419
|
|
Total Management Fee Paid
|
$1,876,082
|
|
Portfolio Turnover Rate
|
559%
|
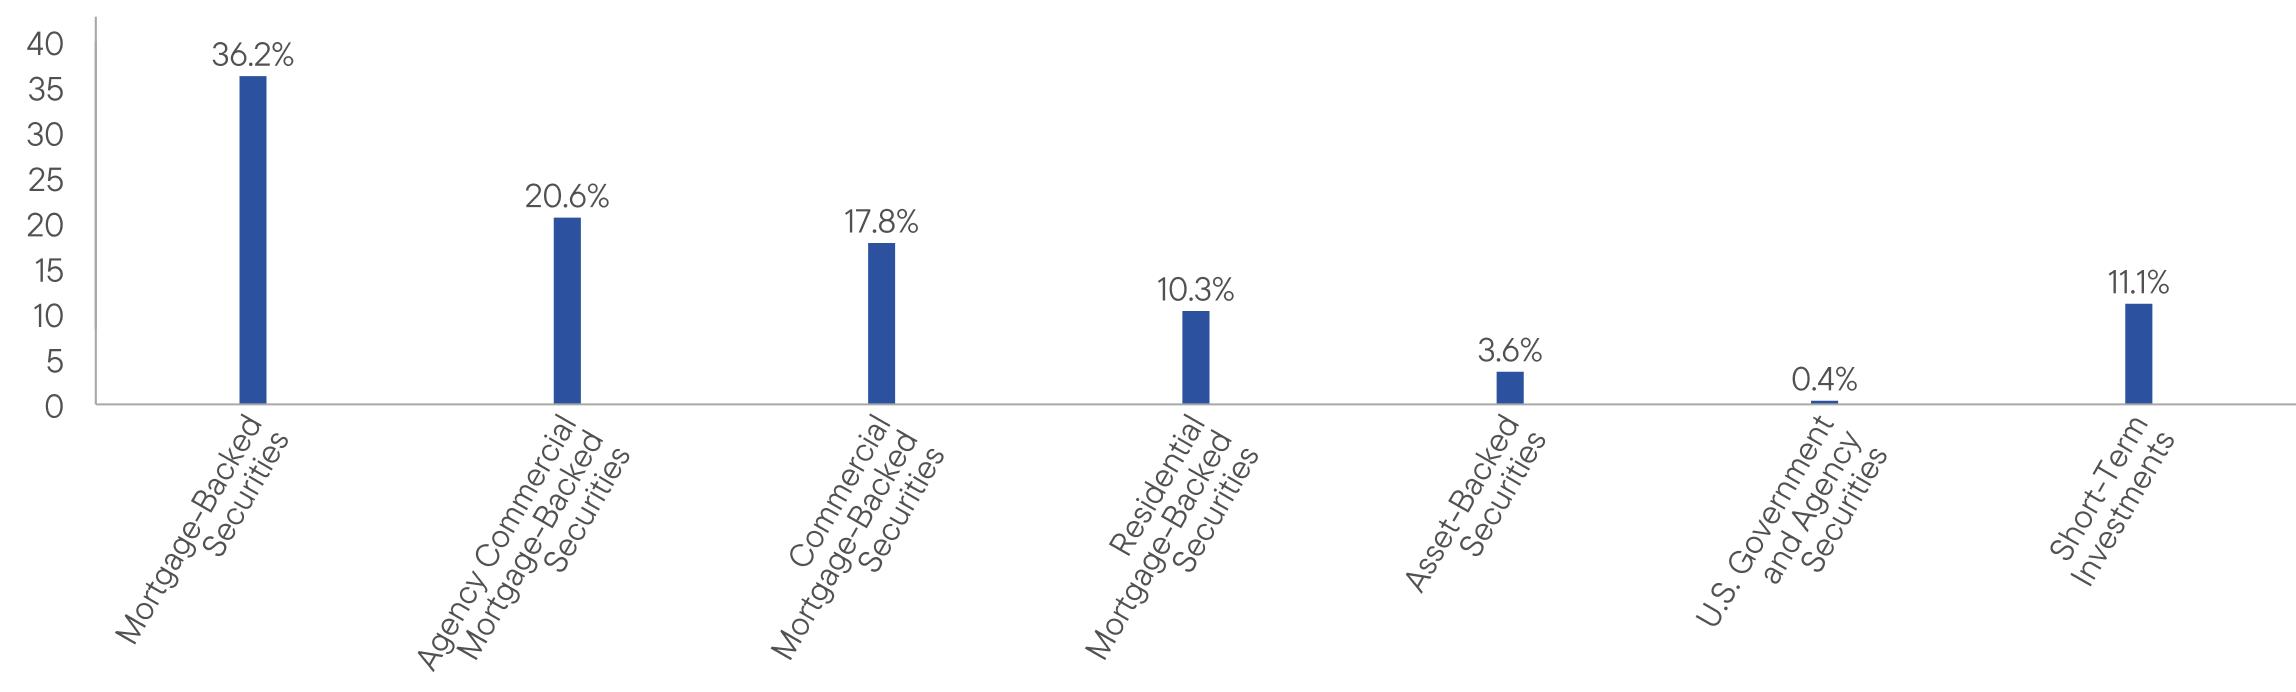
WHAT DID THE FUND INVEST IN? (as of May 31, 2026)
Portfolio Composition* (% of Total Investments)
HOW HAS THE FUND CHANGED?
Effective December 31, 2025, the portfolio managers primarily responsible for the day-to-day management of the Fund are Neil Dhruv, Jatin Misra, PhD, CFA, and Michael V. Salm.
At a meeting on May 21, 2026, the Fund’s Board of Trustees (the “Board”) approved, and recommended that shareholders approve, the conversion of the Fund from a mutual fund into an exchange traded fund through the reorganization of the Fund with and into a newly-organized exchange traded fund (the “ETF”). Pursuant to an Agreement and Plan of Reorganization (the “Plan”) approved by the Board, the proposed reorganization, if approved by shareholders of the Fund, will consist of (1) the transfer of substantially all of the Fund’s assets, subject to its liabilities, to the ETF in return for shares of the ETF; and (2) the distribution of the ETF shares to the Fund’s shareholders in complete liquidation of the Fund. Completion of the proposed reorganization is subject to a number of conditions under the Plan, including shareholder approval. Fund shareholders will receive on or around September 3, 2026, a prospectus/proxy statement describing in detail: (i) information about voting on the proposed reorganization, (ii) details regarding the proposed reorganization and the ETF, and (iii) a summary of the Board’s considerations in approving the proposed reorganization. If shareholders of the Fund do not approve the proposed reorganization, the reorganization will not proceed. It is anticipated that the proposed reorganization, if approved by shareholders, would occur in or around the first quarter of 2027.
This is a summary of certain changes to the Fund since June 1, 2025. For more complete information, you may review the Fund’s current prospectus and any applicable supplements and the Fund’s next prospectus, which we expect to be available by October 1, 2026, at https://www.franklintempleton.com/regulatory-fund-documents or upon request at (800) 225-1581 or
funddocuments@putnam.com.
funddocuments@putnam.com.
This report describes changes to the Fund that occurred during the reporting period.
WHAT WERE THE FUND COSTS FOR THE LAST YEAR? (based on a hypothetical $10,000 investment)
|
Class Name
|
Costs of a $10,000 investment
|
Costs paid as a percentage of a $10,000 investment*
|
|
Class Y
|
$63
|
0.61%
|
HOW DID THE FUND PERFORM LAST YEAR AND WHAT AFFECTED ITS PERFORMANCE?
For the twelve months ended May 31, 2026, Class Y shares of Putnam Mortgage Opportunities Fund returned 7.34%. The Fund compares its performance to the ICE BofA U.S. Treasury Bill Index and the Bloomberg U.S. MBS Index, which returned 4.00% and 6.85%, respectively, for the same period.
PERFORMANCE HIGHLIGHTS
|
Top contributors to performance:
|
|
|
↑
|
Commercial mortgage-backed securities (CMBS) contributed during the period, particularly cash bond holdings. The outlook for commercial real estate (CRE) has improved, fundamentals have stabilized and supply and demand technicals remained positive.
|
|
↑
|
Non-agency residential mortgage-backed securities (RMBS) also contributed. Homeowner balance sheets remained well positioned, supported by locked in home price appreciation, lower household leverage, and strong underwriting standards.
|
|
↑
|
Prepayment strategies contributed as a whole, driven by tactical mortgage basis positioning as well exposure to interest-only (IO) securities which benefited as prepayment speeds remained below historical averages with many borrowers not having an incentive to refinance.
|
|
Top detractors from performance:
|
|
|
↓
|
Inverse IO securities detracted overall from performance, particularly higher coupon inverse IOs as the rate rally in 2025 increased the likelihood that newer collateral with higher rates would prepay.
|
Use of derivatives and the impact on performance:
The Fund utilized interest-rate swaps to hedge term structure risk and for yield curve positioning. Options were used to hedge duration and convexity, isolate prepayment risk, and manage downside risks. In addition, commercial real estate derivatives were used to gain exposure to the CMBS sector and hedge credit and market risks. Futures were used for hedging Treasury term structure risk and for yield curve positioning. In aggregate, these derivatives contributed to performance.
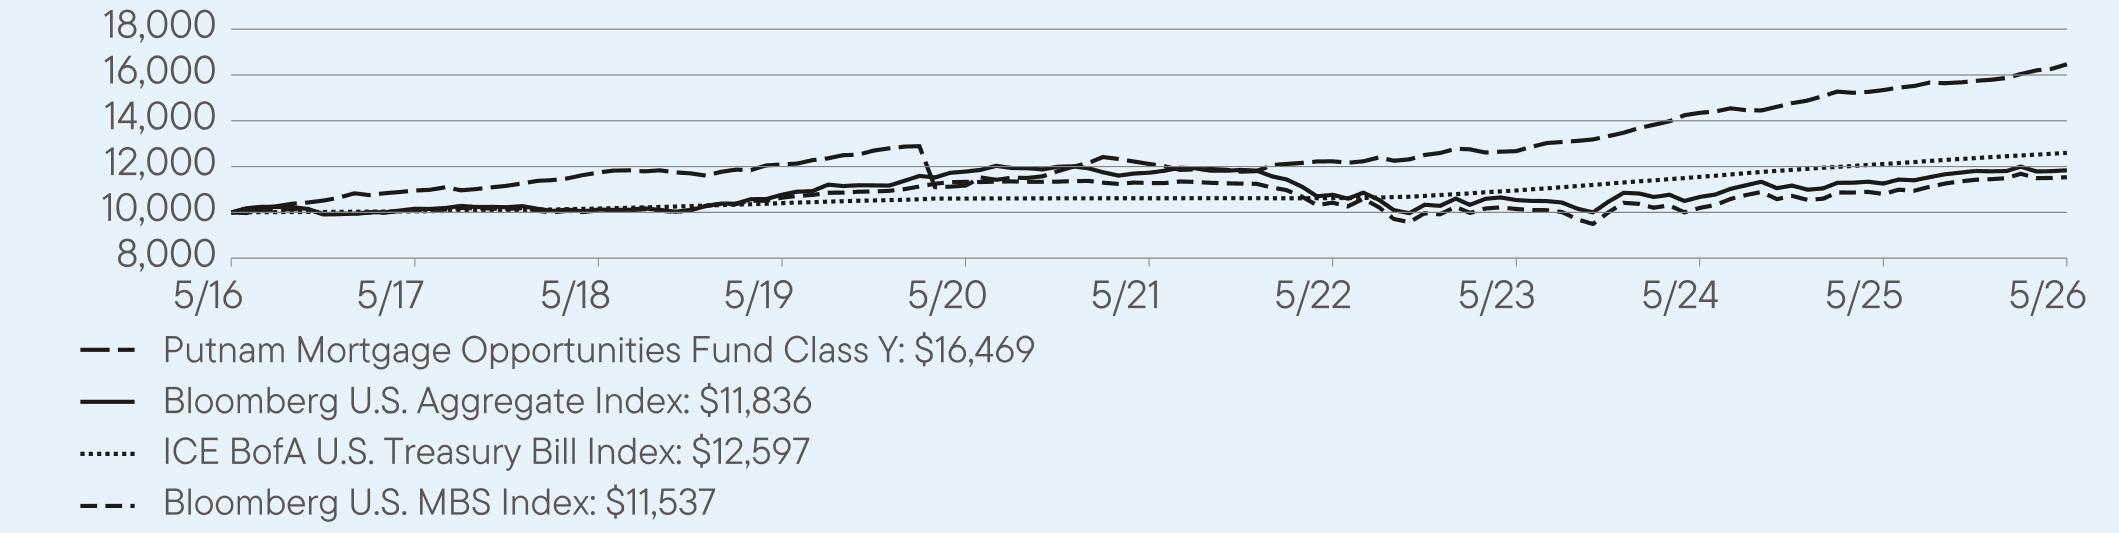
AVERAGE ANNUAL TOTAL RETURNS (%) Period Ended May 31, 2026
|
|
1 Year
|
5 Year
|
10 Year
|
|
Class Y
|
7.34
|
6.36
|
5.13
|
|
Bloomberg U.S. Aggregate Index
|
5.13
|
0.17
|
1.70
|
|
ICE BofA U.S. Treasury Bill Index
|
4.00
|
3.48
|
2.34
|
|
Bloomberg U.S. MBS Index
|
6.85
|
0.45
|
1.44
|
For current month-end performance, please call Franklin Templeton at (800) 225-1581 or visit
https://www.franklintempleton.com/investments/options/mutual-funds.
https://www.franklintempleton.com/investments/options/mutual-funds.
Important data provider notices and terms available at www.franklintempletondatasources.com.
KEY FUND STATISTICS (as of May 31, 2026)
|
Total Net Assets
|
$479,937,056
|
|
Total Number of Portfolio Holdings (excludes derivatives, except purchased options, if any)
|
419
|
|
Total Management Fee Paid
|
$1,876,082
|
|
Portfolio Turnover Rate
|
559%
|
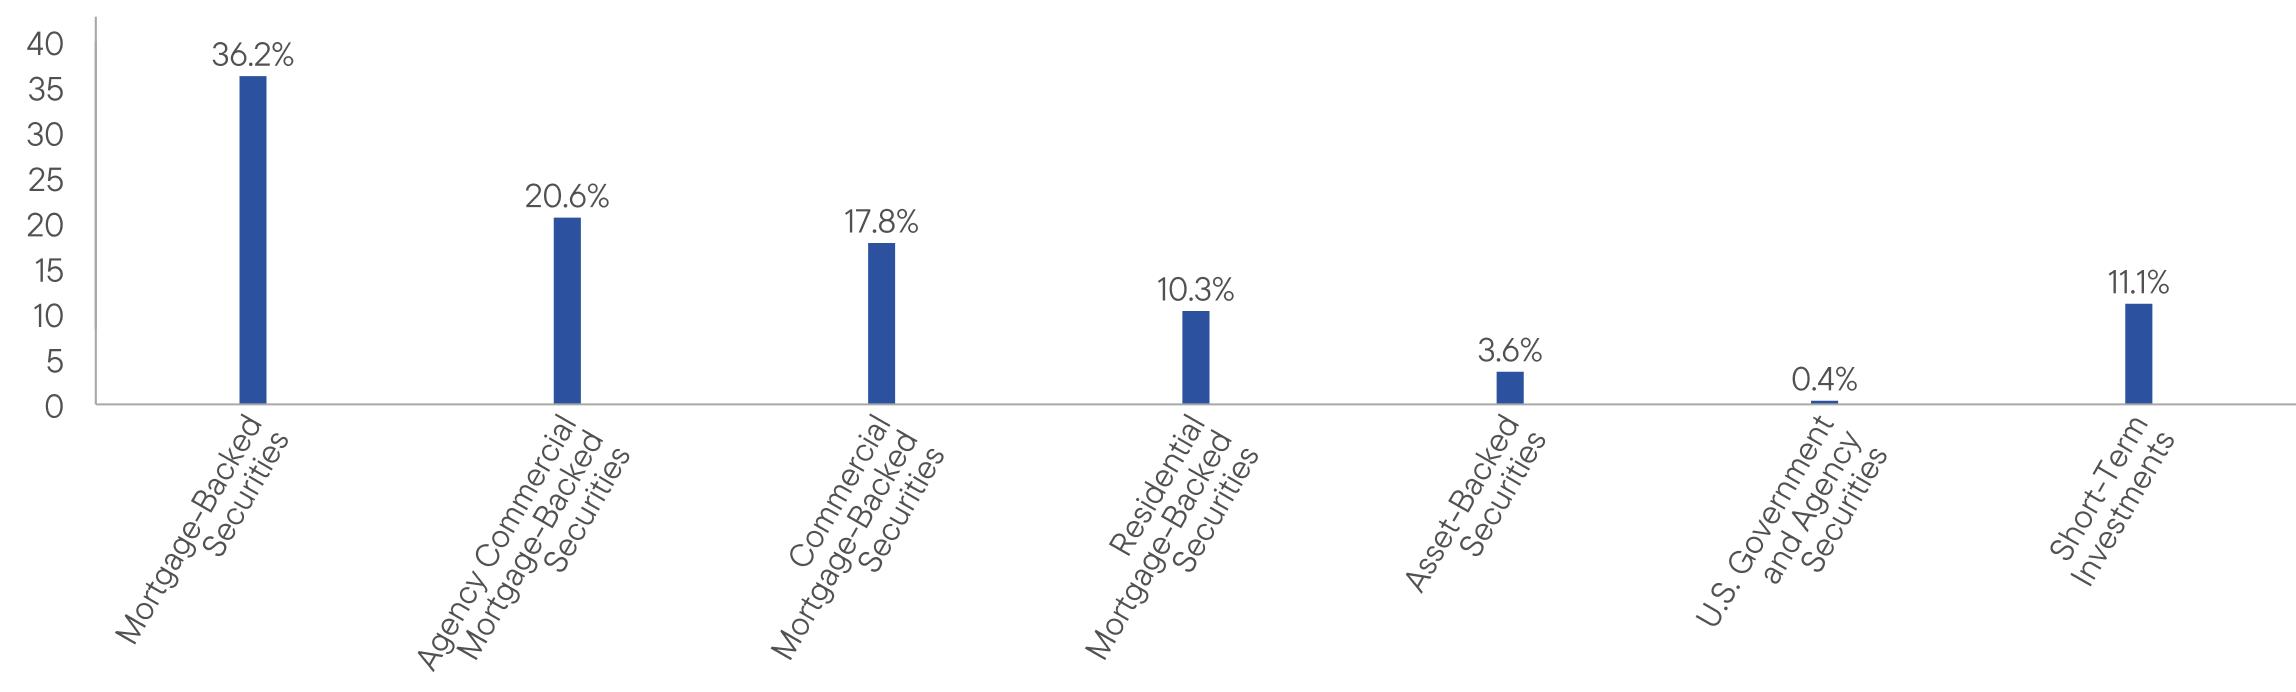
WHAT DID THE FUND INVEST IN? (as of May 31, 2026)
Portfolio Composition* (% of Total Investments)
HOW HAS THE FUND CHANGED?
Effective December 31, 2025, the portfolio managers primarily responsible for the day-to-day management of the Fund are Neil Dhruv, Jatin Misra, PhD, CFA, and Michael V. Salm.
At a meeting on May 21, 2026, the Fund’s Board of Trustees (the “Board”) approved, and recommended that shareholders approve, the conversion of the Fund from a mutual fund into an exchange traded fund through the reorganization of the Fund with and into a newly-organized exchange traded fund (the “ETF”). Pursuant to an Agreement and Plan of Reorganization (the “Plan”) approved by the Board, the proposed reorganization, if approved by shareholders of the Fund, will consist of (1) the transfer of substantially all of the Fund’s assets, subject to its liabilities, to the ETF in return for shares of the ETF; and (2) the distribution of the ETF shares to the Fund’s shareholders in complete liquidation of the Fund. Completion of the proposed reorganization is subject to a number of conditions under the Plan, including shareholder approval. Fund shareholders will receive on or around September 3, 2026, a prospectus/proxy statement describing in detail: (i) information about voting on the proposed reorganization, (ii) details regarding the proposed reorganization and the ETF, and (iii) a summary of the Board’s considerations in approving the proposed reorganization. If shareholders of the Fund do not approve the proposed reorganization, the reorganization will not proceed. It is anticipated that the proposed reorganization, if approved by shareholders, would occur in or around the first quarter of 2027.
This is a summary of certain changes to the Fund since June 1, 2025. For more complete information, you may review the Fund’s current prospectus and any applicable supplements and the Fund’s next prospectus, which we expect to be available by October 1, 2026, at https://www.franklintempleton.com/regulatory-fund-documents or upon request at (800) 225-1581 or
funddocuments@putnam.com.
funddocuments@putnam.com.
| [1] |
|
||
| [2] |
|
||
| [3] |
|
||
| [4] |
|
||
| [5] |
|
||
| [6] |
|
||
| [7] |
|
||
| [8] |
|
||
| [9] |
|
||
| [10] |
|