1 Earnings Supplement Second Quarter 2026 July 30, 2026
2 Forward-Looking Statements – Cautionary Language Certain statements made in this presentation and in other written or oral statements made by Lincoln or on Lincoln’s behalf are “forward-looking statements” within the meaning of the Private Securities Litigation Reform Act of 1995 (“PSLRA”). A forward-looking statement is a statement that is not a historical fact and, without limitation, includes any statement that may predict, forecast, indicate or imply future results, performance or achievements. Forward-looking statements may contain words like: “anticipate,” “believe,” “estimate,” “expect,” “project,” “shall,” “will” and other words or phrases with similar meaning in connection with a discussion of future operating or financial performance. In particular, these include statements relating to future actions, trends in Lincoln’s businesses, prospective services or products, future performance or financial results. Lincoln claims the protection afforded by the safe harbor for forward-looking statements provided by the PSLRA. Forward-looking statements are subject to risks and uncertainties. Actual results could differ materially from those expressed in or implied by such forward-looking statements due to a variety of factors, including: • Weak general economic and business conditions that may affect demand for our products, account balances, investment results, guaranteed benefit liabilities, premium levels and claims experience; • Adverse global capital and credit market conditions that may affect our ability to raise capital, if necessary, and may cause us to realize impairments on investments and certain intangible assets, including goodwill and the valuation allowance against deferred tax assets, which may reduce future earnings and/or affect our financial condition and ability to raise additional capital or refinance existing debt as it matures; • The inability of our subsidiaries to pay dividends to the holding company in sufficient amounts, which could harm the holding company’s ability to meet its obligations; • Legislative, regulatory or tax changes, both domestic and foreign, that affect: the cost of, or demand for, our subsidiaries’ products; the required amount of reserves and/or surplus; our ability to conduct business; and our affiliate reinsurance arrangements; • Changes in tax law or the interpretation of or application of existing tax laws that could impact our tax costs and the products that we sell; • The impact of regulations adopted by the Securities and Exchange Commission (“SEC”), the Department of Labor or other federal or state regulators or self-regulatory organizations that could adversely affect our distribution model and sales of our products and result in additional disclosure and other requirements related to the sale and delivery of our products; • The impact of existing and emerging rules and regulations relating to privacy, cybersecurity and artificial intelligence (“AI”) that may lead to increased compliance costs, reputation risk and/or changes in business practices, and challenges with properly managing the use of AI that could result in reputational harm, competitive harm and legal liability; • Continued scrutiny and evolving expectations and regulations regarding ESG matters that may adversely affect our reputation and our investment portfolio; • Actions taken by reinsurers to raise rates on in-force business; • Declines in or sustained low interest rates causing a reduction in investment income, the interest margins of our businesses and demand for our products; • Increasing or sustained higher interest rates that may negatively affect our profitability, value of our investment portfolio and capital position and may cause policyholders to surrender annuity and life insurance policies, thereby causing realized investment losses; • The initiation of legal or regulatory proceedings against us, and the outcome of any legal or regulatory proceedings, such as: adverse actions related to present or past business practices common in businesses in which we compete; adverse decisions in significant actions including, but not limited to, actions brought by federal and state authorities and class action cases; new decisions that result in changes in law; and unexpected trial court rulings; • A decline or continued volatility in the equity markets causing a reduction in the sales of our subsidiaries’ products; a reduction of asset-based fees that our subsidiaries charge on various investment and insurance products; and an increase in liabilities related to guaranteed benefits, including riders on certain of our annuity products and secondary guarantees on certain variable universal life insurance products; • Ineffectiveness of our risk management policies and procedures, including our various hedging strategies; A deviation in actual experience regarding future policyholder behavior, mortality, morbidity, interest rates or equity market returns from the assumptions used in pricing our subsidiaries’ products and in establishing related insurance reserves, which may reduce future earnings; Changes in accounting principles that may affect our consolidated financial statements; • Lowering of one or more of our debt ratings issued by nationally recognized statistical rating organizations and the adverse effect such action may have on our ability to raise capital and on our liquidity and financial condition; • Lowering of one or more of the insurer financial strength ratings of our insurance subsidiaries and the adverse effect such action may have on the premium writings, policy retention and profitability of our insurance subsidiaries and liquidity; • Significant credit, accounting, fraud, corporate governance or other issues that may adversely affect the value of certain financial assets, as well as counterparties to which we are exposed to credit risk, requiring that we realize losses on financial assets; • Interruption in or failure of the telecommunication, information technology or other operational systems of the company or the third parties on whom we rely or failure to safeguard the confidentiality or privacy of sensitive data on such systems, including from cyberattacks or other breaches in security of such systems; • The effect of acquisitions and divestitures, including the inability to realize the anticipated benefits of acquisitions and dispositions of businesses and potential operating difficulties and unforeseen liabilities relating thereto, as well as the effect of restructurings, product withdrawals and other unusual items; • The inability to realize or sustain the benefits we expect from, greater than expected investments in, and the potential impact of efforts related to, our strategic initiatives; The adequacy and collectability of reinsurance that we have obtained; • Pandemics, acts of terrorism, war or other man-made and natural catastrophes that may adversely impact liabilities for policyholder claims and adversely affect our businesses and the cost and availability of reinsurance; • Competitive conditions, including pricing pressures, new product offerings and the emergence of new competitors, that may affect the level of premiums and fees that our subsidiaries can charge for their products; • The unknown effect on our subsidiaries’ businesses resulting from evolving market preferences and the changing demographics of our client base; and • The unanticipated loss of key management or wholesalers. The risks and uncertainties included here are not exhaustive. Our most recent Form 10-K, as well as other reports that we file with the SEC, include additional factors that could affect our businesses and financial performance. Moreover, we operate in a rapidly changing and competitive environment. New risk factors emerge from time to time, and it is not possible for management to predict all such risk factors. Further, it is not possible to assess the effect of all risk factors on our businesses or the extent to which any factor, or combination of factors, may cause actual results to differ materially from those contained in any forward-looking statements. Given these risks and uncertainties, investors should not place undue reliance on forward-looking statements as a prediction of actual results. In addition, Lincoln disclaims any obligation to correct or update any forward-looking statements to reflect events or circumstances that occur after the date of this presentation. The reporting of Risk-Based Capital (“RBC”) measures is not intended for the purpose of ranking any insurance company or for use in connection with any marketing, advertising or promotional activities.
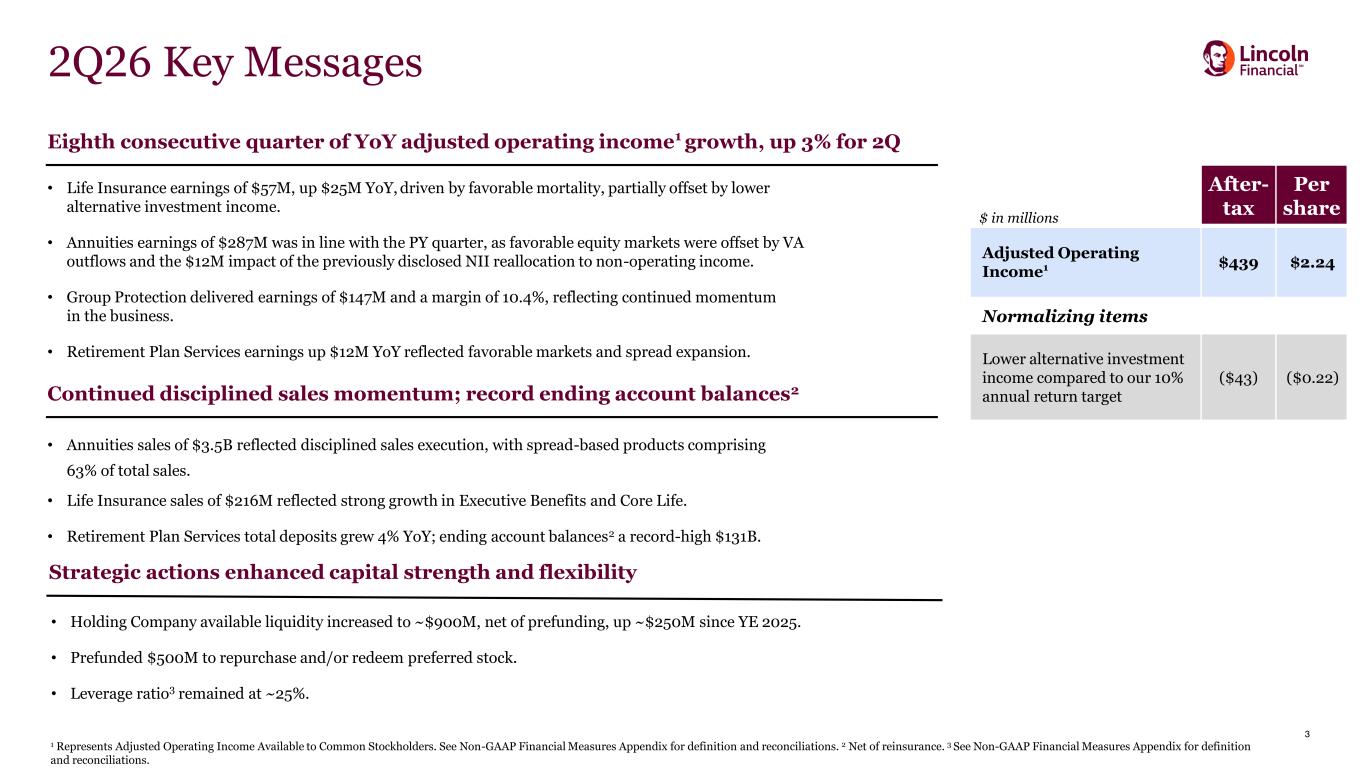
3 2Q26 Key Messages • Annuities sales of $3.5B reflected disciplined sales execution, with spread-based products comprising 63% of total sales. • Life Insurance sales of $216M reflected strong growth in Executive Benefits and Core Life. • Retirement Plan Services total deposits grew 4% YoY; ending account balances2 a record-high $131B. $ in millions After- tax Per share Adjusted Operating Income1 $439 $2.24 Normalizing items Lower alternative investment income compared to our 10% annual return target ($43) ($0.22) Eighth consecutive quarter of YoY adjusted operating income1 growth, up 3% for 2Q • Life Insurance earnings of $57M, up $25M YoY, driven by favorable mortality, partially offset by lower alternative investment income. • Annuities earnings of $287M was in line with the PY quarter, as favorable equity markets were offset by VA outflows and the $12M impact of the previously disclosed NII reallocation to non-operating income. • Group Protection delivered earnings of $147M and a margin of 10.4%, reflecting continued momentum in the business. • Retirement Plan Services earnings up $12M YoY reflected favorable markets and spread expansion. Continued disciplined sales momentum; record ending account balances2 Strategic actions enhanced capital strength and flexibility • Holding Company available liquidity increased to ~$900M, net of prefunding, up ~$250M since YE 2025. • Prefunded $500M to repurchase and/or redeem preferred stock. • Leverage ratio3 remained at ~25%. 1 Represents Adjusted Operating Income Available to Common Stockholders. See Non-GAAP Financial Measures Appendix for definition and reconciliations. 2 Net of reinsurance. 3 See Non-GAAP Financial Measures Appendix for definition and reconciliations.
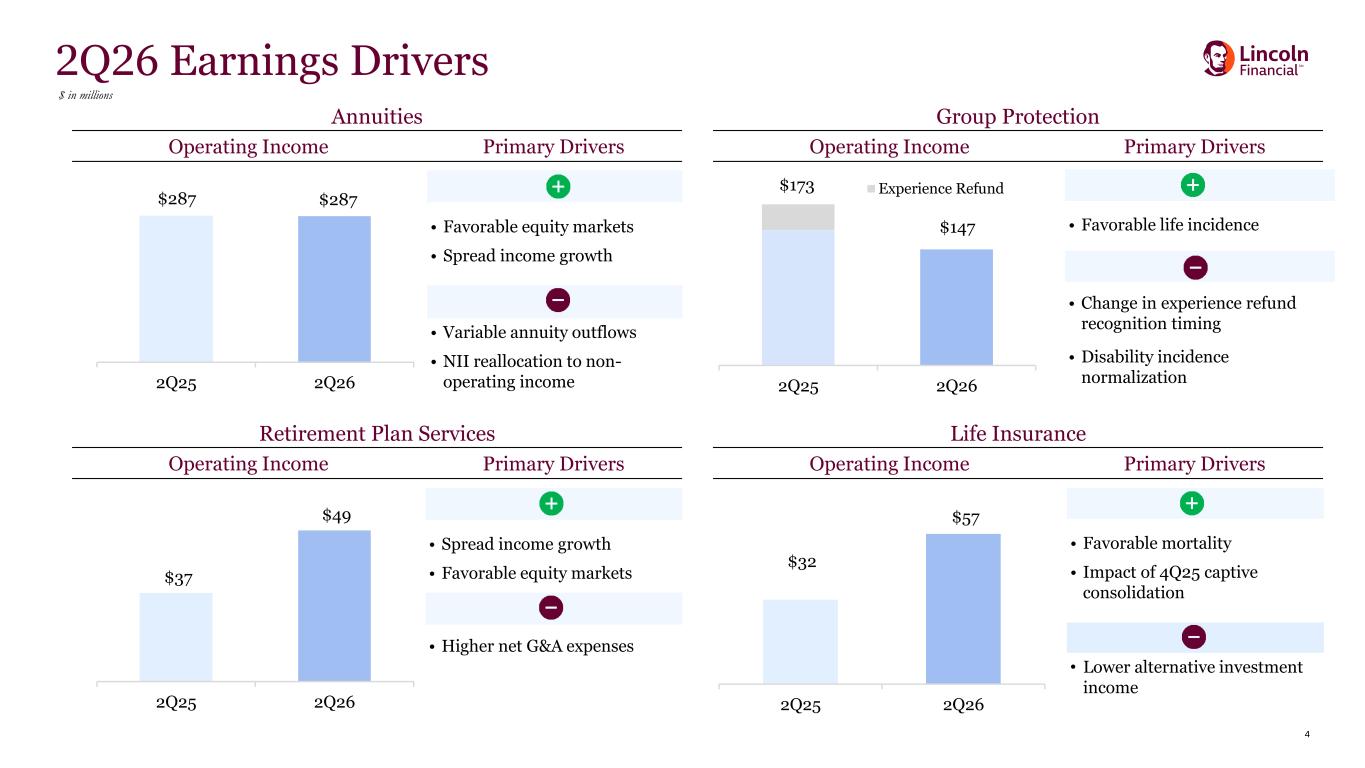
4 Annuities Group Protection Operating Income Primary Drivers Operating Income Primary Drivers Retirement Plan Services Life Insurance Operating Income Primary Drivers Operating Income Primary Drivers • Favorable equity markets • Spread income growth • Variable annuity outflows • NII reallocation to non- operating income • Favorable life incidence • Change in experience refund recognition timing • Disability incidence normalization 2Q26 Earnings Drivers $ in millions • Spread income growth • Favorable equity markets • Higher net G&A expenses • Favorable mortality • Impact of 4Q25 captive consolidation • Lower alternative investment income $287 $287 2Q25 2Q26 $173 $147 2Q25 2Q26 Experience Refund $37 $49 2Q25 2Q26 $32 $57 2Q25 2Q26
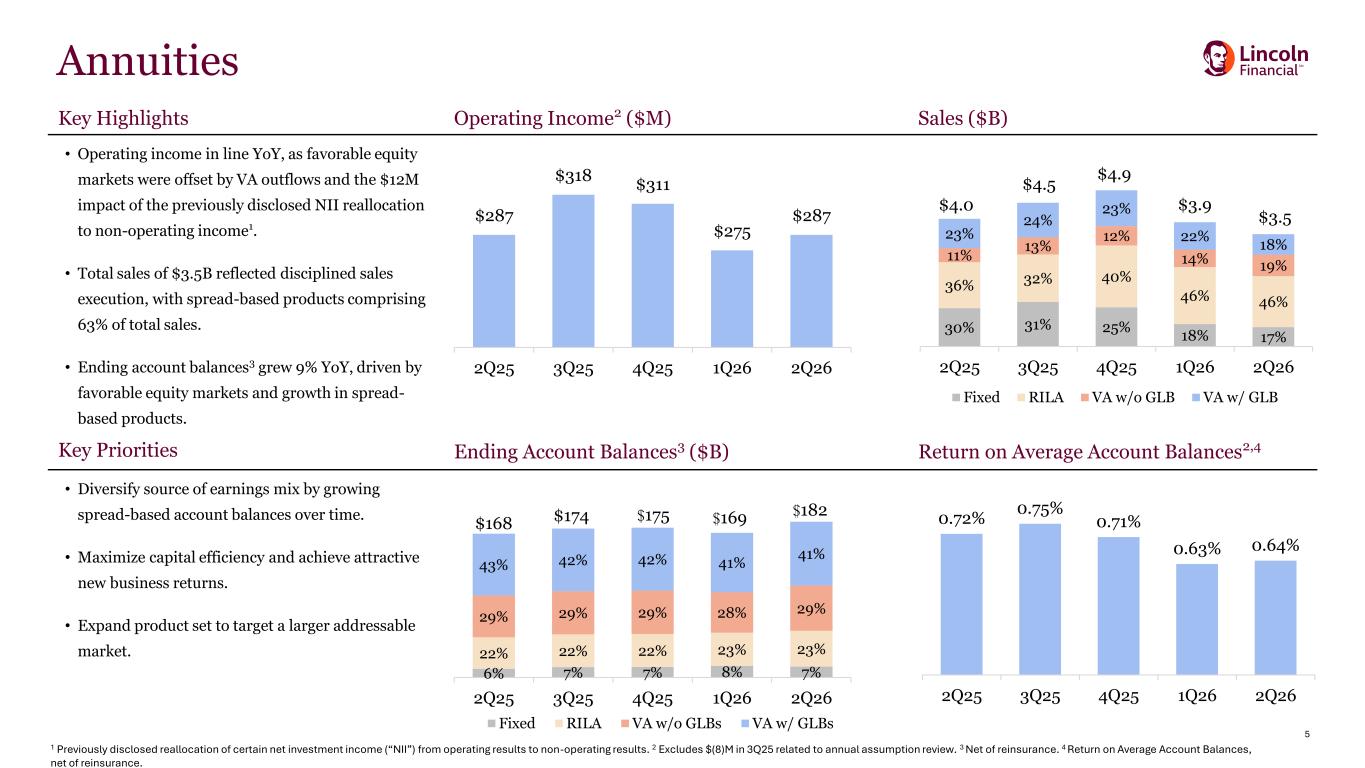
5 Key Highlights Operating Income2 ($M) Sales ($B) • Operating income in line YoY, as favorable equity markets were offset by VA outflows and the $12M impact of the previously disclosed NII reallocation to non-operating income1. • Total sales of $3.5B reflected disciplined sales execution, with spread-based products comprising 63% of total sales. • Ending account balances3 grew 9% YoY, driven by favorable equity markets and growth in spread- based products. Key Priorities Ending Account Balances3 ($B) Return on Average Account Balances2,4 • Diversify source of earnings mix by growing spread-based account balances over time. • Maximize capital efficiency and achieve attractive new business returns. • Expand product set to target a larger addressable market. $168 $174 $175 $169 $182 6% 7% 7% 8% 7% 22% 22% 22% 23% 23% 29% 29% 29% 28% 29% 43% 42% 42% 41% 41% 2Q25 3Q25 4Q25 1Q26 2Q26 Fixed RILA VA w/o GLBs VA w/ GLBs 30% 31% 25% 18% 17% 36% 32% 40% 46% 46% 11% 13% 12% 14% 19% 23% 24% 23% 22% 18% 2Q25 3Q25 4Q25 1Q26 2Q26 Fixed RILA VA w/o GLB VA w/ GLB Annuities 0.72% 0.75% 0.71% 0.63% 0.64% 2Q25 3Q25 4Q25 1Q26 2Q26 $287 $318 $311 $275 $287 2Q25 3Q25 4Q25 1Q26 2Q26 $4.0 $4.5 $4.9 1 Previously disclosed reallocation of certain net investment income (“NII”) from operating results to non-operating results. 2 Excludes $(8)M in 3Q25 related to annual assumption review. 3 Net of reinsurance. 4 Return on Average Account Balances, net of reinsurance. $3.9 $3.5
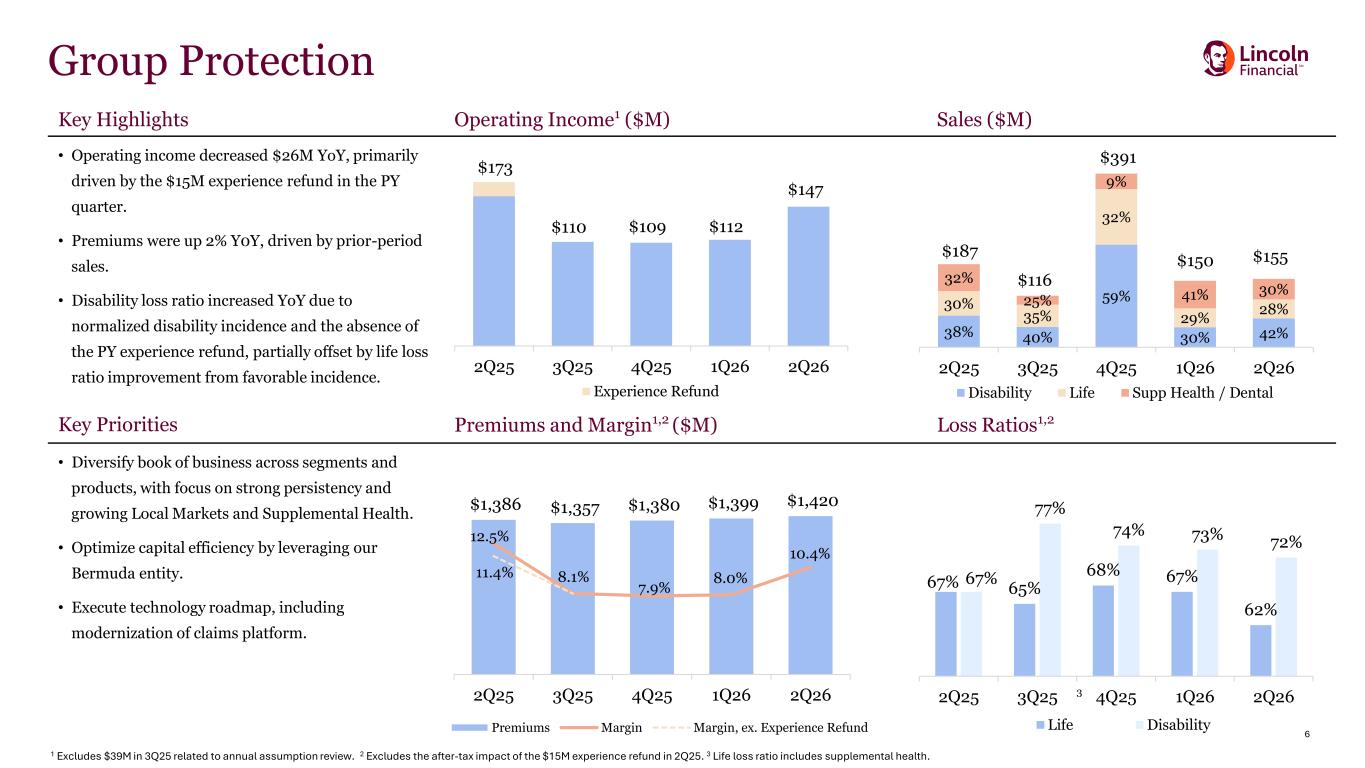
6 Key Highlights Operating Income1 ($M) Sales ($M) • Operating income decreased $26M YoY, primarily driven by the $15M experience refund in the PY quarter. • Premiums were up 2% Y0Y, driven by prior-period sales. • Disability loss ratio increased YoY due to normalized disability incidence and the absence of the PY experience refund, partially offset by life loss ratio improvement from favorable incidence. Key Priorities Premiums and Margin1,2 ($M) Loss Ratios1,2 • Diversify book of business across segments and products, with focus on strong persistency and growing Local Markets and Supplemental Health. • Optimize capital efficiency by leveraging our Bermuda entity. • Execute technology roadmap, including modernization of claims platform. $1,386 $1,357 $1,380 $1,399 $1,420 12.5% 10.4% 11.4% 8.1% 7.9% 8.0% 1.0% 3.0% 5.0% 7.0% 9.0% 11.0% 13.0% 15.0% $- $200 $400 $600 $800 $1,000 $1,200 $1,400 2Q25 3Q25 4Q25 1Q26 2Q26 Premiums Margin Margin, ex. Experience Refund 38% 40% 59% 30% 42% 30% 35% 32% 29% 28% 32% 25% 9% 41% 30% 2Q25 3Q25 4Q25 1Q26 2Q26 Disability Life Supp Health / Dental 67% 65% 68% 67% 62% 67% 77% 74% 73% 72% 2Q25 3Q25 4Q25 1Q26 2Q26 Life Disability 3 2Q25 3Q25 4Q25 1Q26 2Q26 Experience Refund $173 $187 $116 $391 Group Protection 1 Excludes $39M in 3Q25 related to annual assumption review. 2 Excludes the after-tax impact of the $15M experience refund in 2Q25. 3 Life loss ratio includes supplemental health. $150 $110 $109 $112 $147 $155
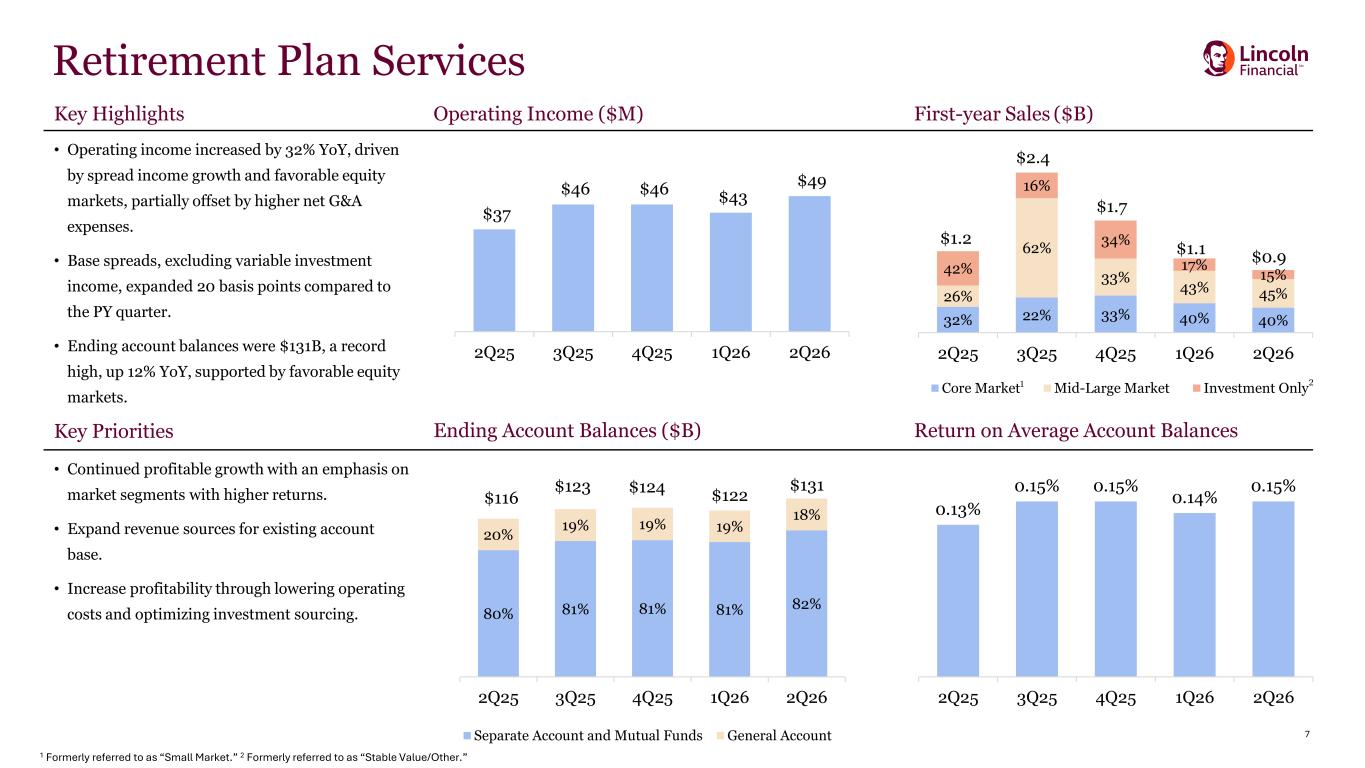
7 Retirement Plan Services Key Highlights Operating Income ($M) First-year Sales ($B) • Operating income increased by 32% YoY, driven by spread income growth and favorable equity markets, partially offset by higher net G&A expenses. • Base spreads, excluding variable investment income, expanded 20 basis points compared to the PY quarter. • Ending account balances were $131B, a record high, up 12% YoY, supported by favorable equity markets. Key Priorities Ending Account Balances ($B) Return on Average Account Balances • Continued profitable growth with an emphasis on market segments with higher returns. • Expand revenue sources for existing account base. • Increase profitability through lowering operating costs and optimizing investment sourcing. 80% 81% 81% 81% 82% 20% 19% 19% 19% 18% $116 $123 $124 $122 $131 2Q25 3Q25 4Q25 1Q26 2Q26 Separate Account and Mutual Funds General Account $37 $46 $46 $43 $49 2Q25 3Q25 4Q25 1Q26 2Q26 0.13% 0.15% 0.15% 0.14% 0.15% 2Q25 3Q25 4Q25 1Q26 2Q26 32% 22% 33% 40% 40% 26% 62% 33% 43% 45% 42% 16% 34% 17% 15% 2Q25 3Q25 4Q25 1Q26 2Q26 Core Market Mid-Large Market Investment Only $0.9 $1.2 $2.4 $1.7 $1.1 1 Formerly referred to as “Small Market.” 2 Formerly referred to as “Stable Value/Other.” 1 2
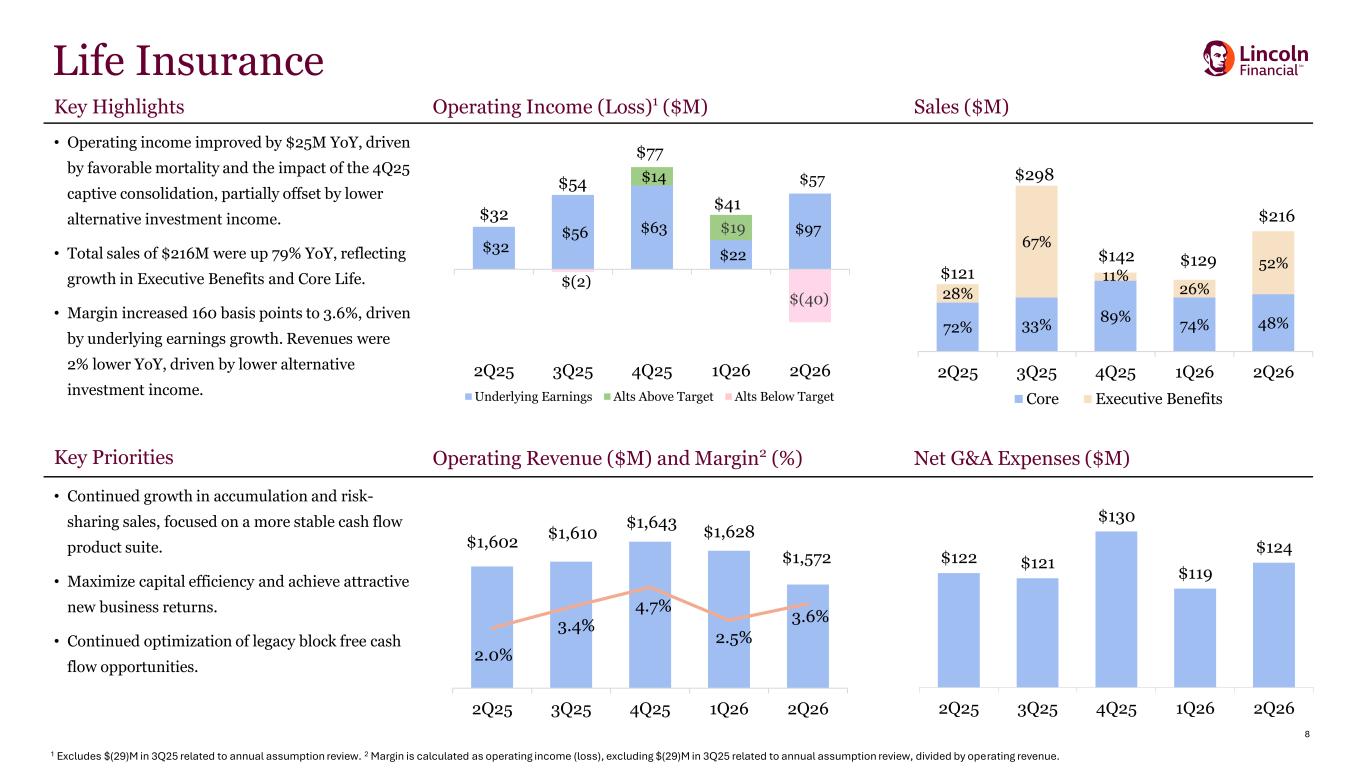
8 Key Highlights Operating Income (Loss)1 ($M) Sales ($M) • Operating income improved by $25M YoY, driven by favorable mortality and the impact of the 4Q25 captive consolidation, partially offset by lower alternative investment income. • Total sales of $216M were up 79% YoY, reflecting growth in Executive Benefits and Core Life. • Margin increased 160 basis points to 3.6%, driven by underlying earnings growth. Revenues were 2% lower YoY, driven by lower alternative investment income. Key Priorities Operating Revenue ($M) and Margin2 (%) Net G&A Expenses ($M) • Continued growth in accumulation and risk- sharing sales, focused on a more stable cash flow product suite. • Maximize capital efficiency and achieve attractive new business returns. • Continued optimization of legacy block free cash flow opportunities. 92% 91% 85% 80% 83% 8% 9% 15% 20% 17% 13% 8% 14% 19% 13% 19% 14% 1Q24 2Q24 3Q24 4Q24 1Q25 Underlying Earnings Alts Above Target Alts Below Target $32 $56 $63 $22 $57 $(2) $14 $19 $(40) 2Q25 3Q25 4Q25 1Q26 2Q26 $97 Life Insurance 72% 33% 89% 74% 48% 28% 67% 11% 26% 52% $121 $298 $142 $129 $216 2Q25 3Q25 4Q25 1Q26 2Q26 Core Executive Benefits $54 $77 $122 $121 $130 $119 $124 2Q25 3Q25 4Q25 1Q26 2Q26 1 Excludes $(29)M in 3Q25 related to annual assumption review. 2 Margin is calculated as operating income (loss), excluding $(29)M in 3Q25 related to annual assumption review, divided by operating revenue. $1,602 $1,610 $1,643 $1,628 $1,572 2.0% 3.4% 4.7% 2.5% 3.6% -2.0% 0.0 % 2.0% 4.0% 6.0% 8.0% 10.0% 1400 1450 1500 1550 1600 1650 1700 2Q25 3Q25 4Q25 1Q26 2Q26 $41 $32
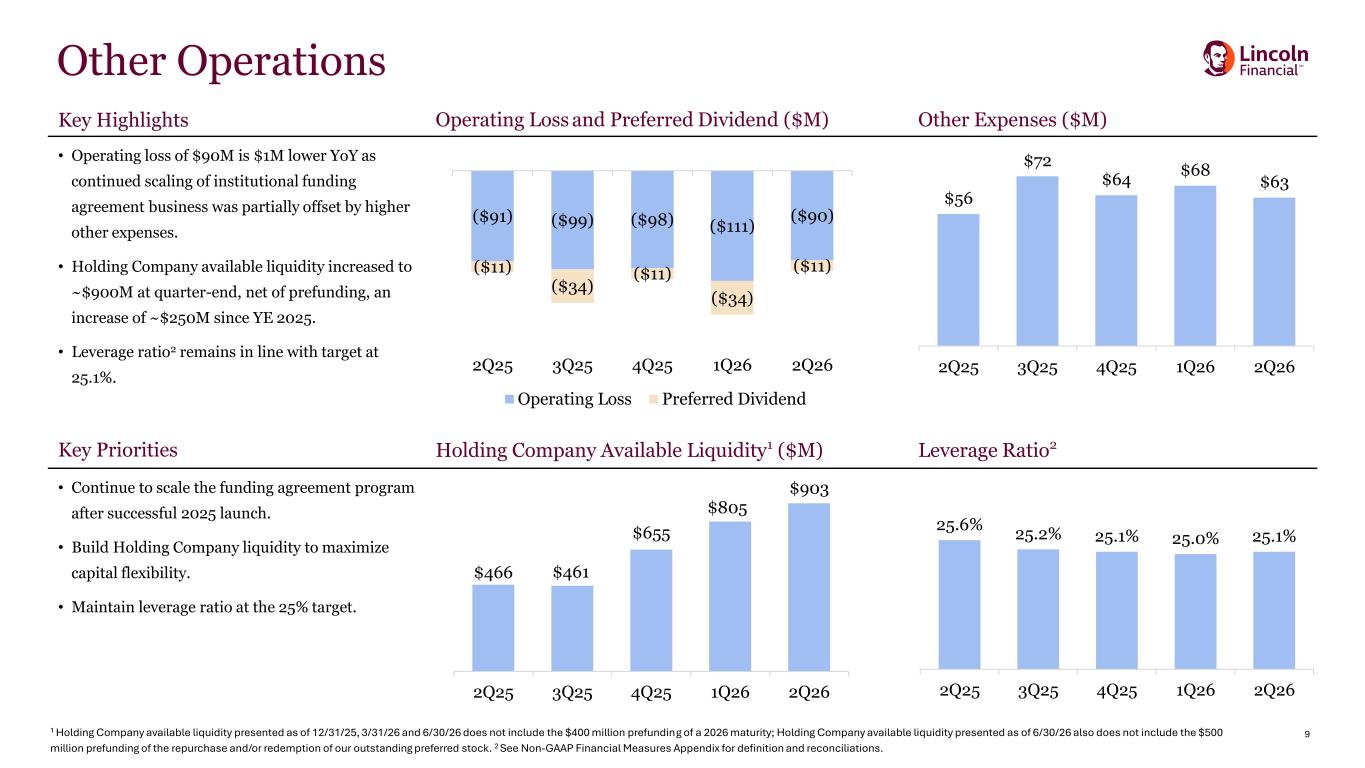
9 Key Highlights Operating Loss and Preferred Dividend ($M) Other Expenses ($M) • Operating loss of $90M is $1M lower YoY as continued scaling of institutional funding agreement business was partially offset by higher other expenses. • Holding Company available liquidity increased to ~$900M at quarter-end, net of prefunding, an increase of ~$250M since YE 2025. • Leverage ratio2 remains in line with target at 25.1%. Key Priorities Holding Company Available Liquidity1 ($M) Leverage Ratio2 • Continue to scale the funding agreement program after successful 2025 launch. • Build Holding Company liquidity to maximize capital flexibility. • Maintain leverage ratio at the 25% target. Other Operations ($91) ($99) ($98) ($111) ($90) ($11) ($34) ($11) ($34) ($11) 2Q25 3Q25 4Q25 1Q26 2Q26 Operating Loss Preferred Dividend $466 $461 $655 $805 $903 2Q25 3Q25 4Q25 1Q26 2Q26 25.6% 25.2% 25.1% 25.0% 25.1% 2Q25 3Q25 4Q25 1Q26 2Q26 $56 $72 $64 $68 $63 2Q25 3Q25 4Q25 1Q26 2Q26 1 Holding Company available liquidity presented as of 12/31/25, 3/31/26 and 6/30/26 does not include the $400 million prefunding of a 2026 maturity; Holding Company available liquidity presented as of 6/30/26 also does not include the $500 million prefunding of the repurchase and/or redemption of our outstanding preferred stock. 2 See Non-GAAP Financial Measures Appendix for definition and reconciliations.
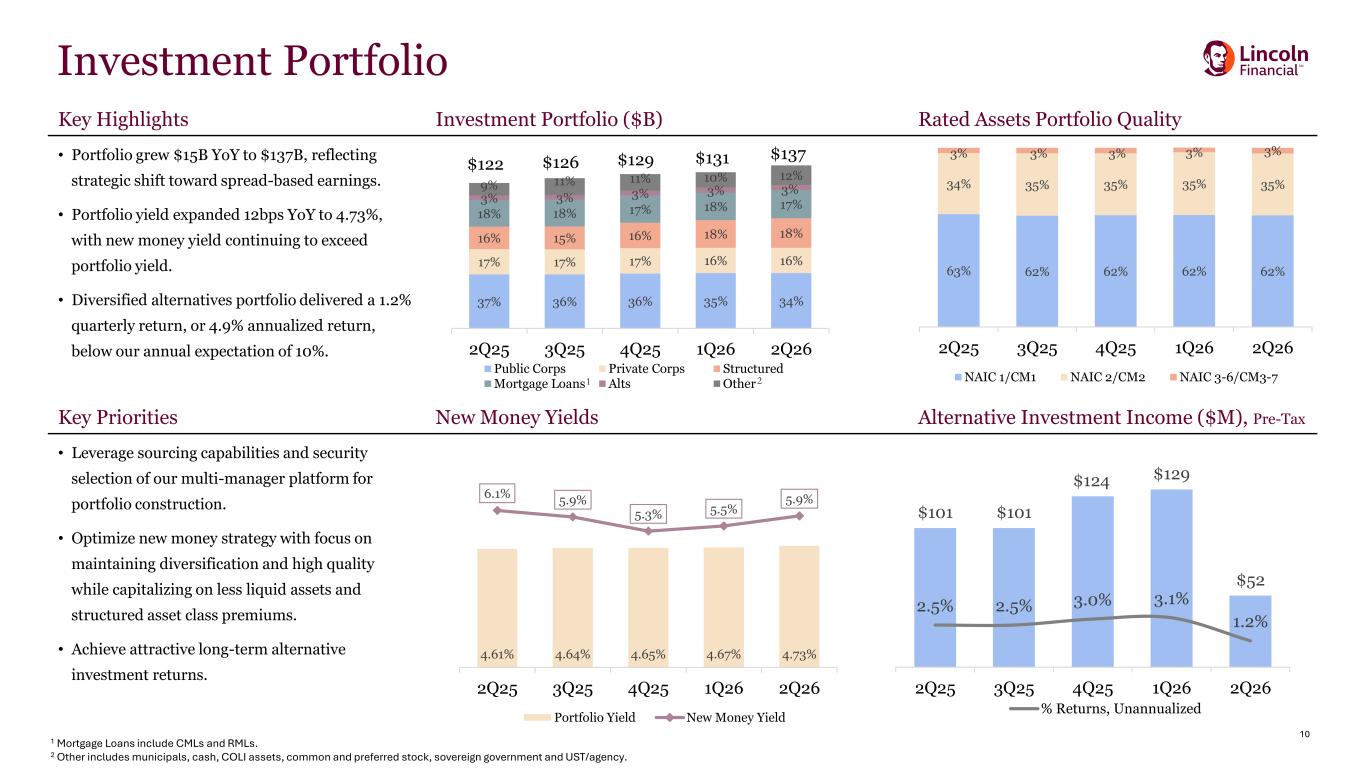
10 Key Highlights Investment Portfolio ($B) Rated Assets Portfolio Quality • Portfolio grew $15B YoY to $137B, reflecting strategic shift toward spread-based earnings. • Portfolio yield expanded 12bps YoY to 4.73%, with new money yield continuing to exceed portfolio yield. • Diversified alternatives portfolio delivered a 1.2% quarterly return, or 4.9% annualized return, below our annual expectation of 10%. Key Priorities New Money Yields Alternative Investment Income ($M), Pre-Tax • Leverage sourcing capabilities and security selection of our multi-manager platform for portfolio construction. • Optimize new money strategy with focus on maintaining diversification and high quality while capitalizing on less liquid assets and structured asset class premiums. • Achieve attractive long-term alternative investment returns. 37% 36% 36% 35% 34% 17% 17% 17% 16% 16% 16% 15% 16% 18% 18% 18% 18% 17% 18% 17% 3% 3% 3% 3% 3%9% 11% 11% 10% 12% 2Q25 3Q25 4Q25 1Q26 2Q26 Public Corps Private Corps Structured Mortgage Loans Alts Other Investment Portfolio 4.61% 4.64% 4.65% 4.67% 4.73% 6.1% 5.9% 5.3% 5.5% 5.9% 2Q25 3Q25 4Q25 1Q26 2Q26 Portfolio Yield New Money Yield $101 $101 $124 $129 $52 2.5% 2.5% 3.0% 3.1% 1.2% 0 20 40 60 80 100 120 140 2Q25 3Q25 4Q25 1Q26 2Q26 % Returns, Unannualized 63% 62% 62% 62% 62% 34% 35% 35% 35% 35% 3% 3% 3% 3% 3% 2Q25 3Q25 4Q25 1Q26 2Q26 NAIC 1/CM1 NAIC 2/CM2 NAIC 3-6/CM3-7 $137 $122 $126 1 2 $129 1 Mortgage Loans include CMLs and RMLs. 2 Other includes municipals, cash, COLI assets, common and preferred stock, sovereign government and UST/agency. $131
11 Appendix
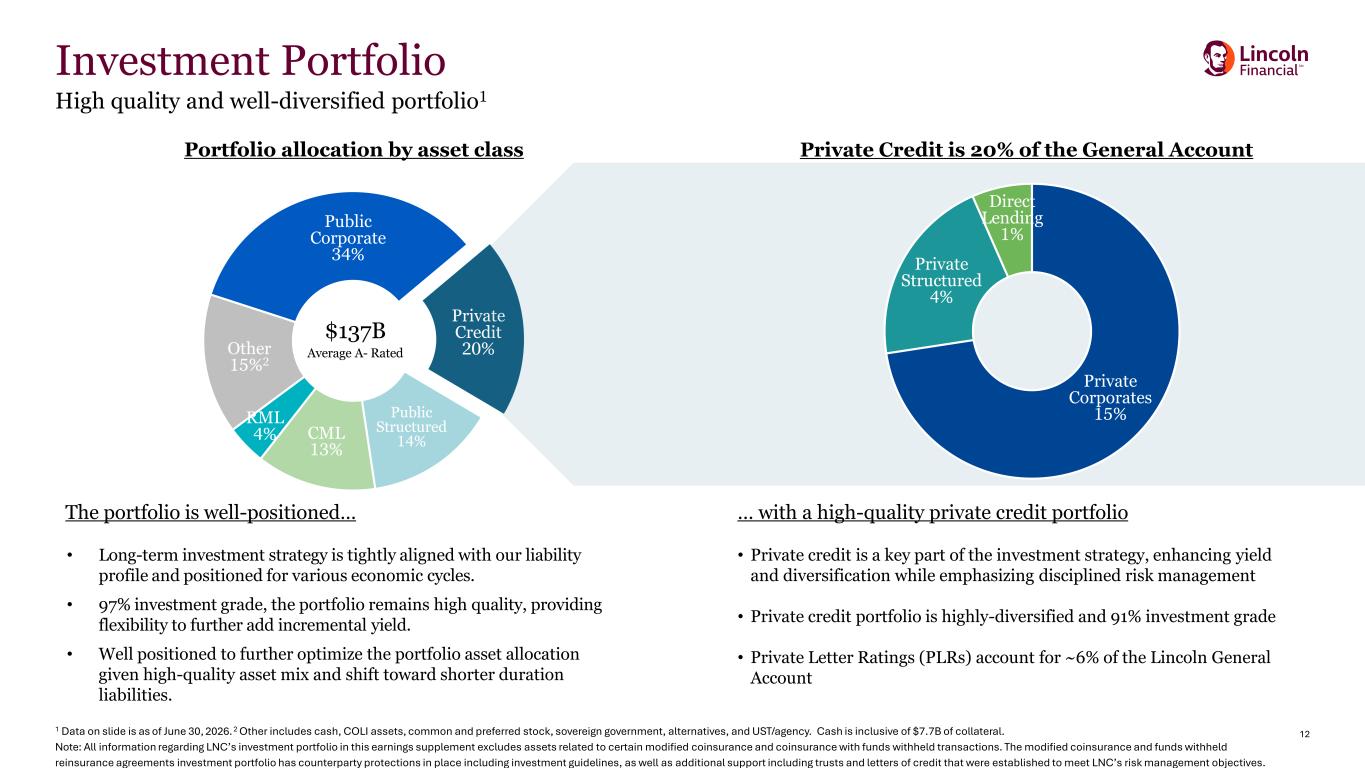
12 Public Corporate 34% Private Credit 20% Public Structured 14% CML 13% RML 4% Other 15%2 Investment Portfolio High quality and well-diversified portfolio1 $137B Average A- Rated Portfolio allocation by asset class 1 Data on slide is as of June 30, 2026. 2 Other includes cash, COLI assets, common and preferred stock, sovereign government, alternatives, and UST/agency. Cash is inclusive of $7.7B of collateral. Note: All information regarding LNC’s investment portfolio in this earnings supplement excludes assets related to certain modified coinsurance and coinsurance with funds withheld transactions. The modified coinsurance and funds withheld reinsurance agreements investment portfolio has counterparty protections in place including investment guidelines, as well as additional support including trusts and letters of credit that were established to meet LNC’s risk management objectives. … with a high-quality private credit portfolio • Private credit is a key part of the investment strategy, enhancing yield and diversification while emphasizing disciplined risk management • Private credit portfolio is highly-diversified and 91% investment grade • Private Letter Ratings (PLRs) account for ~6% of the Lincoln General Account The portfolio is well-positioned… • Long-term investment strategy is tightly aligned with our liability profile and positioned for various economic cycles. • 97% investment grade, the portfolio remains high quality, providing flexibility to further add incremental yield. • Well positioned to further optimize the portfolio asset allocation given high-quality asset mix and shift toward shorter duration liabilities. Private Credit is 20% of the General Account Private Corporates 15% Private Structured 4% Direct Lending 1%
13 Non-GAAP Financial Measures Appendix
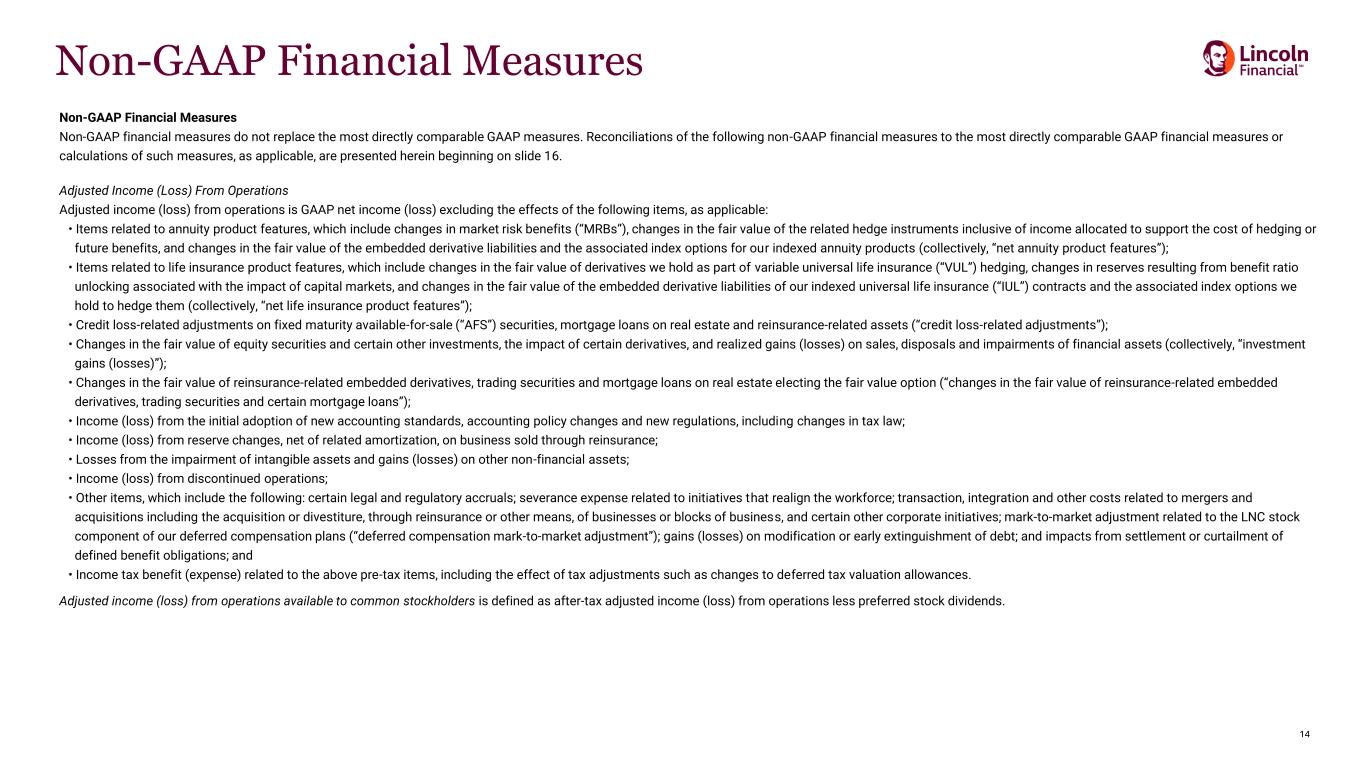
14 Non-GAAP Financial Measures Non-GAAP Financial Measures Non-GAAP financial measures do not replace the most directly comparable GAAP measures. Reconciliations of the following non-GAAP financial measures to the most directly comparable GAAP financial measures or calculations of such measures, as applicable, are presented herein beginning on slide 16. Adjusted Income (Loss) From Operations Adjusted income (loss) from operations is GAAP net income (loss) excluding the effects of the following items, as applicable: • Items related to annuity product features, which include changes in market risk benefits (“MRBs”), changes in the fair value of the related hedge instruments inclusive of income allocated to support the cost of hedging or future benefits, and changes in the fair value of the embedded derivative liabilities and the associated index options for our indexed annuity products (collectively, “net annuity product features”); • Items related to life insurance product features, which include changes in the fair value of derivatives we hold as part of variable universal life insurance (“VUL”) hedging, changes in reserves resulting from benefit ratio unlocking associated with the impact of capital markets, and changes in the fair value of the embedded derivative liabilities of our indexed universal life insurance (“IUL”) contracts and the associated index options we hold to hedge them (collectively, “net life insurance product features”); • Credit loss-related adjustments on fixed maturity available-for-sale (“AFS”) securities, mortgage loans on real estate and reinsurance-related assets (“credit loss-related adjustments”); • Changes in the fair value of equity securities and certain other investments, the impact of certain derivatives, and realized gains (losses) on sales, disposals and impairments of financial assets (collectively, “investment gains (losses)”); • Changes in the fair value of reinsurance-related embedded derivatives, trading securities and mortgage loans on real estate electing the fair value option (“changes in the fair value of reinsurance-related embedded derivatives, trading securities and certain mortgage loans”); • Income (loss) from the initial adoption of new accounting standards, accounting policy changes and new regulations, including changes in tax law; • Income (loss) from reserve changes, net of related amortization, on business sold through reinsurance; • Losses from the impairment of intangible assets and gains (losses) on other non-financial assets; • Income (loss) from discontinued operations; • Other items, which include the following: certain legal and regulatory accruals; severance expense related to initiatives that realign the workforce; transaction, integration and other costs related to mergers and acquisitions including the acquisition or divestiture, through reinsurance or other means, of businesses or blocks of business, and certain other corporate initiatives; mark-to-market adjustment related to the LNC stock component of our deferred compensation plans (“deferred compensation mark-to-market adjustment”); gains (losses) on modification or early extinguishment of debt; and impacts from settlement or curtailment of defined benefit obligations; and • Income tax benefit (expense) related to the above pre-tax items, including the effect of tax adjustments such as changes to deferred tax valuation allowances. Adjusted income (loss) from operations available to common stockholders is defined as after-tax adjusted income (loss) from operations less preferred stock dividends.
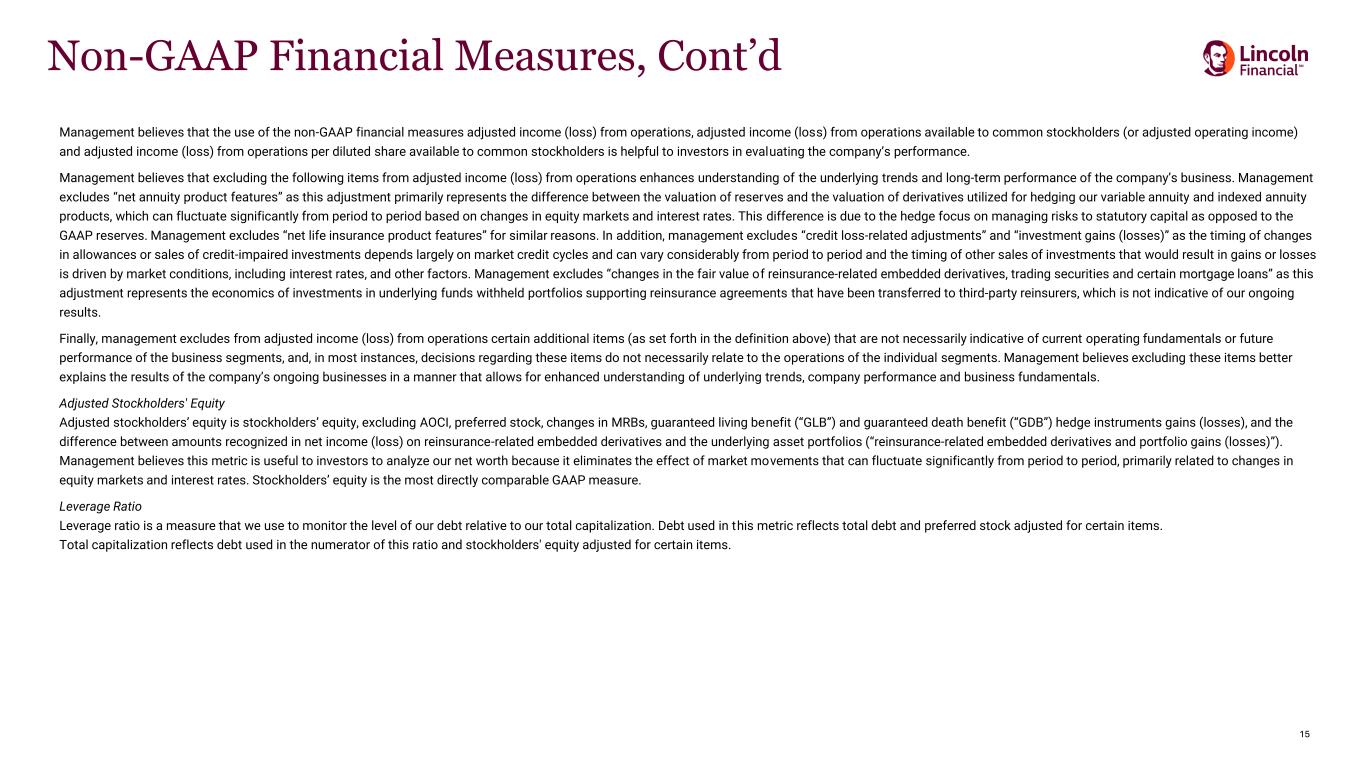
15 Non-GAAP Financial Measures, Cont’d Management believes that the use of the non-GAAP financial measures adjusted income (loss) from operations, adjusted income (loss) from operations available to common stockholders (or adjusted operating income) and adjusted income (loss) from operations per diluted share available to common stockholders is helpful to investors in evaluating the company’s performance. Management believes that excluding the following items from adjusted income (loss) from operations enhances understanding of the underlying trends and long-term performance of the company’s business. Management excludes “net annuity product features” as this adjustment primarily represents the difference between the valuation of reserves and the valuation of derivatives utilized for hedging our variable annuity and indexed annuity products, which can fluctuate significantly from period to period based on changes in equity markets and interest rates. This difference is due to the hedge focus on managing risks to statutory capital as opposed to the GAAP reserves. Management excludes “net life insurance product features” for similar reasons. In addition, management excludes “credit loss-related adjustments” and “investment gains (losses)” as the timing of changes in allowances or sales of credit-impaired investments depends largely on market credit cycles and can vary considerably from period to period and the timing of other sales of investments that would result in gains or losses is driven by market conditions, including interest rates, and other factors. Management excludes “changes in the fair value of reinsurance-related embedded derivatives, trading securities and certain mortgage loans” as this adjustment represents the economics of investments in underlying funds withheld portfolios supporting reinsurance agreements that have been transferred to third-party reinsurers, which is not indicative of our ongoing results. Finally, management excludes from adjusted income (loss) from operations certain additional items (as set forth in the definition above) that are not necessarily indicative of current operating fundamentals or future performance of the business segments, and, in most instances, decisions regarding these items do not necessarily relate to the operations of the individual segments. Management believes excluding these items better explains the results of the company’s ongoing businesses in a manner that allows for enhanced understanding of underlying trends, company performance and business fundamentals. Adjusted Stockholders' Equity Adjusted stockholders’ equity is stockholders’ equity, excluding AOCI, preferred stock, changes in MRBs, guaranteed living benefit (“GLB”) and guaranteed death benefit (“GDB”) hedge instruments gains (losses), and the difference between amounts recognized in net income (loss) on reinsurance-related embedded derivatives and the underlying asset portfolios (“reinsurance-related embedded derivatives and portfolio gains (losses)”). Management believes this metric is useful to investors to analyze our net worth because it eliminates the effect of market movements that can fluctuate significantly from period to period, primarily related to changes in equity markets and interest rates. Stockholders’ equity is the most directly comparable GAAP measure. Leverage Ratio Leverage ratio is a measure that we use to monitor the level of our debt relative to our total capitalization. Debt used in this metric reflects total debt and preferred stock adjusted for certain items. Total capitalization reflects debt used in the numerator of this ratio and stockholders' equity adjusted for certain items.
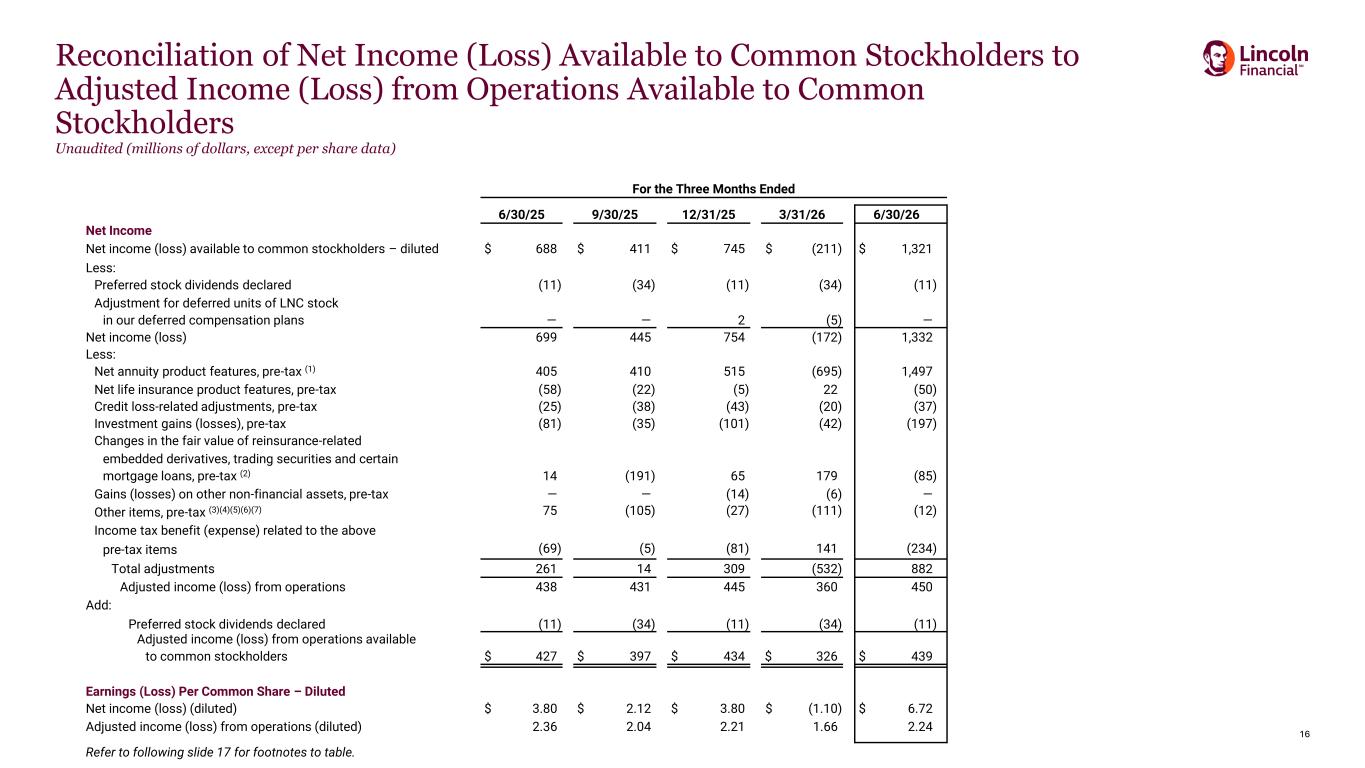
16 Reconciliation of Net Income (Loss) Available to Common Stockholders to Adjusted Income (Loss) from Operations Available to Common Stockholders Unaudited (millions of dollars, except per share data) For the Three Months Ended 6/30/25 9/30/25 12/31/25 3/31/26 6/30/26 Net Income Net income (loss) available to common stockholders – diluted $ 688 $ 411 $ 745 $ (211) $ 1,321 Less: Preferred stock dividends declared (11) (34) (11) (34) (11) Adjustment for deferred units of LNC stock in our deferred compensation plans — — 2 (5) — Net income (loss) 699 445 754 (172) 1,332 Less: Net annuity product features, pre-tax (1) 405 410 515 (695) 1,497 Net life insurance product features, pre-tax (58) (22) (5) 22 (50) Credit loss-related adjustments, pre-tax (25) (38) (43) (20) (37) Investment gains (losses), pre-tax (81) (35) (101) (42) (197) Changes in the fair value of reinsurance-related embedded derivatives, trading securities and certain mortgage loans, pre-tax (2) 14 (191) 65 179 (85) Gains (losses) on other non-financial assets, pre-tax — — (14) (6) — Other items, pre-tax (3)(4)(5)(6)(7) 75 (105) (27) (111) (12) Income tax benefit (expense) related to the above pre-tax items (69) (5) (81) 141 (234) Total adjustments 261 14 309 (532) 882 Adjusted income (loss) from operations 438 431 445 360 450 Add: Preferred stock dividends declared (11) (34) (11) (34) (11) Adjusted income (loss) from operations available to common stockholders $ 427 $ 397 $ 434 $ 326 $ 439 Earnings (Loss) Per Common Share – Diluted Net income (loss) (diluted) $ 3.80 $ 2.12 $ 3.80 $ (1.10) $ 6.72 Adjusted income (loss) from operations (diluted) 2.36 2.04 2.21 1.66 2.24 Refer to following slide 17 for footnotes to table.
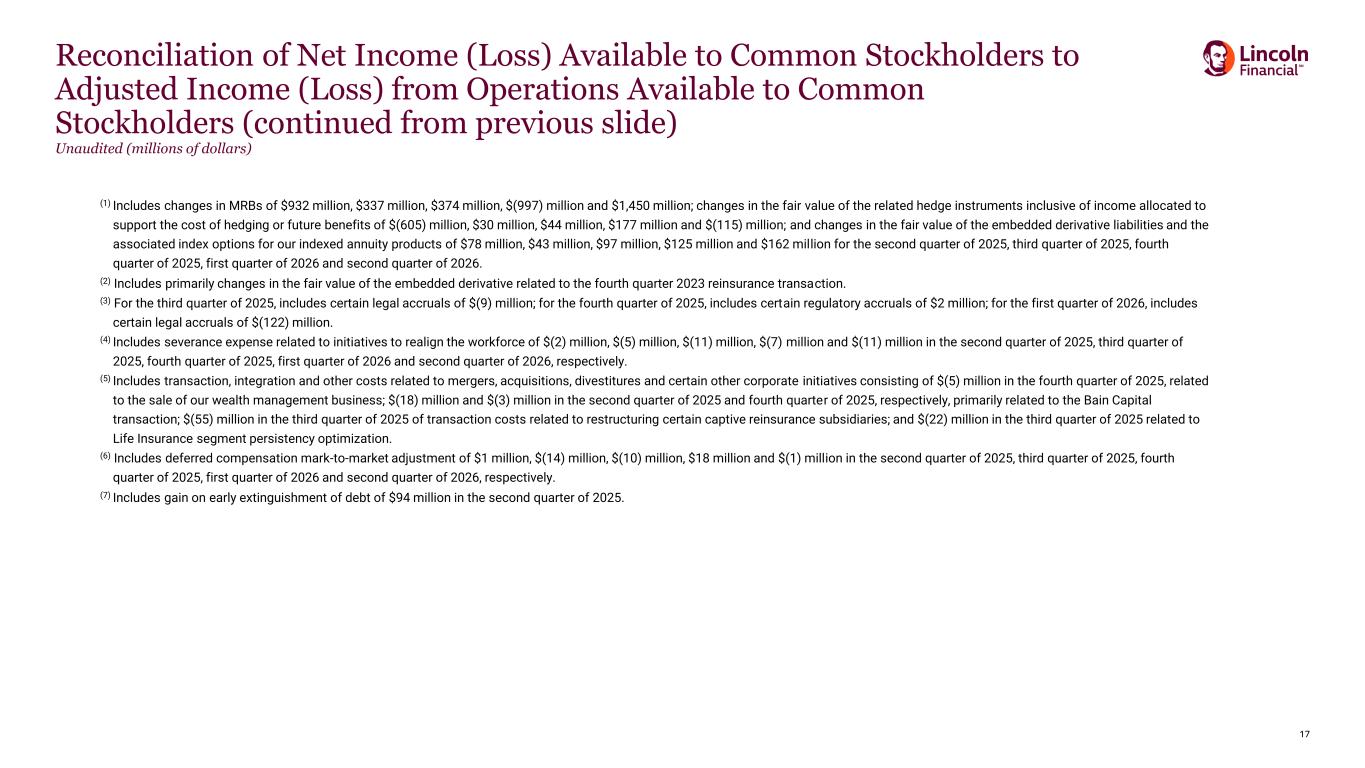
17 Reconciliation of Net Income (Loss) Available to Common Stockholders to Adjusted Income (Loss) from Operations Available to Common Stockholders (continued from previous slide) Unaudited (millions of dollars) (1) Includes changes in MRBs of $932 million, $337 million, $374 million, $(997) million and $1,450 million; changes in the fair value of the related hedge instruments inclusive of income allocated to support the cost of hedging or future benefits of $(605) million, $30 million, $44 million, $177 million and $(115) million; and changes in the fair value of the embedded derivative liabilities and the associated index options for our indexed annuity products of $78 million, $43 million, $97 million, $125 million and $162 million for the second quarter of 2025, third quarter of 2025, fourth quarter of 2025, first quarter of 2026 and second quarter of 2026. (2) Includes primarily changes in the fair value of the embedded derivative related to the fourth quarter 2023 reinsurance transaction. (3) For the third quarter of 2025, includes certain legal accruals of $(9) million; for the fourth quarter of 2025, includes certain regulatory accruals of $2 million; for the first quarter of 2026, includes certain legal accruals of $(122) million. (4) Includes severance expense related to initiatives to realign the workforce of $(2) million, $(5) million, $(11) million, $(7) million and $(11) million in the second quarter of 2025, third quarter of 2025, fourth quarter of 2025, first quarter of 2026 and second quarter of 2026, respectively. (5) Includes transaction, integration and other costs related to mergers, acquisitions, divestitures and certain other corporate initiatives consisting of $(5) million in the fourth quarter of 2025, related to the sale of our wealth management business; $(18) million and $(3) million in the second quarter of 2025 and fourth quarter of 2025, respectively, primarily related to the Bain Capital transaction; $(55) million in the third quarter of 2025 of transaction costs related to restructuring certain captive reinsurance subsidiaries; and $(22) million in the third quarter of 2025 related to Life Insurance segment persistency optimization. (6) Includes deferred compensation mark-to-market adjustment of $1 million, $(14) million, $(10) million, $18 million and $(1) million in the second quarter of 2025, third quarter of 2025, fourth quarter of 2025, first quarter of 2026 and second quarter of 2026, respectively. (7) Includes gain on early extinguishment of debt of $94 million in the second quarter of 2025.
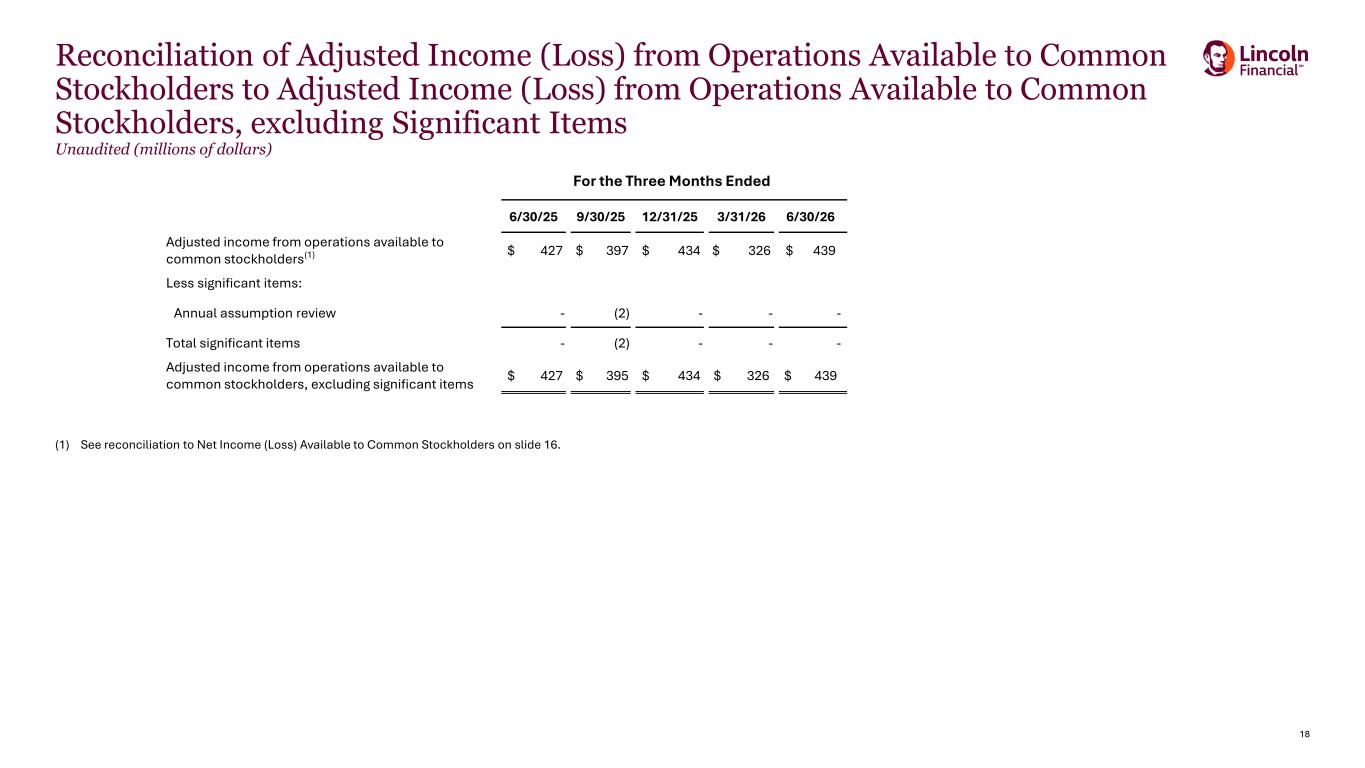
18 Reconciliation of Adjusted Income (Loss) from Operations Available to Common Stockholders to Adjusted Income (Loss) from Operations Available to Common Stockholders, excluding Significant Items Unaudited (millions of dollars) (1) See reconciliation to Net Income (Loss) Available to Common Stockholders on slide 16. For the Three Months Ended 6/30/25 9/30/25 12/31/25 3/31/26 6/30/26 Adjusted income from operations available to common stockholders(1) $ 427 $ 397 $ 434 $ 326 $ 439 Less significant items: Annual assumption review - (2) - - - Total significant items - (2) - - - Adjusted income from operations available to common stockholders, excluding significant items $ 427 $ 395 $ 434 $ 326 $ 439
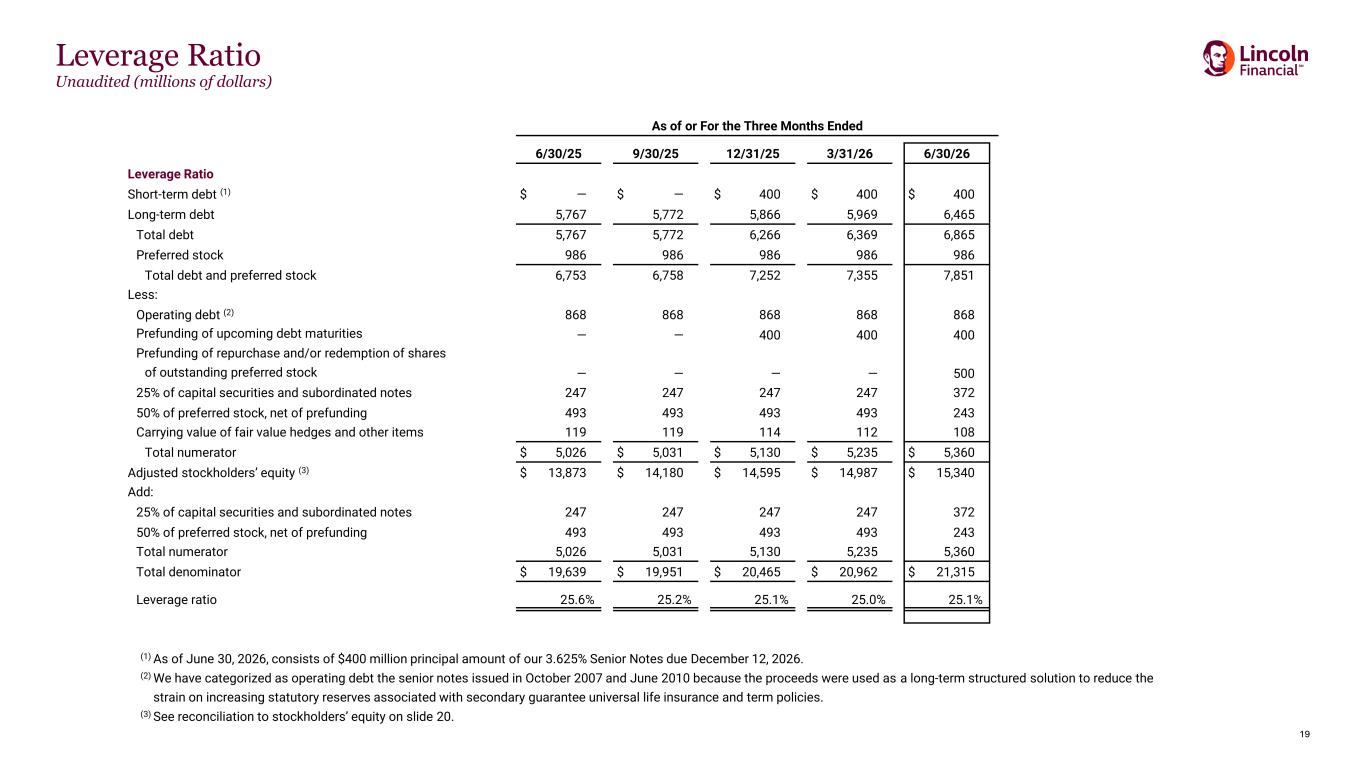
19 Leverage Ratio Unaudited (millions of dollars) As of or For the Three Months Ended 6/30/25 9/30/25 12/31/25 3/31/26 6/30/26 Leverage Ratio Short-term debt (1) $ — $ — $ 400 $ 400 $ 400 Long-term debt 5,767 5,772 5,866 5,969 6,465 Total debt 5,767 5,772 6,266 6,369 6,865 Preferred stock 986 986 986 986 986 Total debt and preferred stock 6,753 6,758 7,252 7,355 7,851 Less: Operating debt (2) 868 868 868 868 868 Prefunding of upcoming debt maturities — — 400 400 400 Prefunding of repurchase and/or redemption of shares of outstanding preferred stock — — — — 500 25% of capital securities and subordinated notes 247 247 247 247 372 50% of preferred stock, net of prefunding 493 493 493 493 243 Carrying value of fair value hedges and other items 119 119 114 112 108 Total numerator $ 5,026 $ 5,031 $ 5,130 $ 5,235 $ 5,360 Adjusted stockholders’ equity (3) $ 13,873 $ 14,180 $ 14,595 $ 14,987 $ 15,340 Add: 25% of capital securities and subordinated notes 247 247 247 247 372 50% of preferred stock, net of prefunding 493 493 493 493 243 Total numerator 5,026 5,031 5,130 5,235 5,360 Total denominator $ 19,639 $ 19,951 $ 20,465 $ 20,962 $ 21,315 Leverage ratio 25.6% 25.2% 25.1% 25.0% 25.1% (1) As of June 30, 2026, consists of $400 million principal amount of our 3.625% Senior Notes due December 12, 2026. (2) We have categorized as operating debt the senior notes issued in October 2007 and June 2010 because the proceeds were used as a long-term structured solution to reduce the strain on increasing statutory reserves associated with secondary guarantee universal life insurance and term policies. (3) See reconciliation to stockholders’ equity on slide 20.
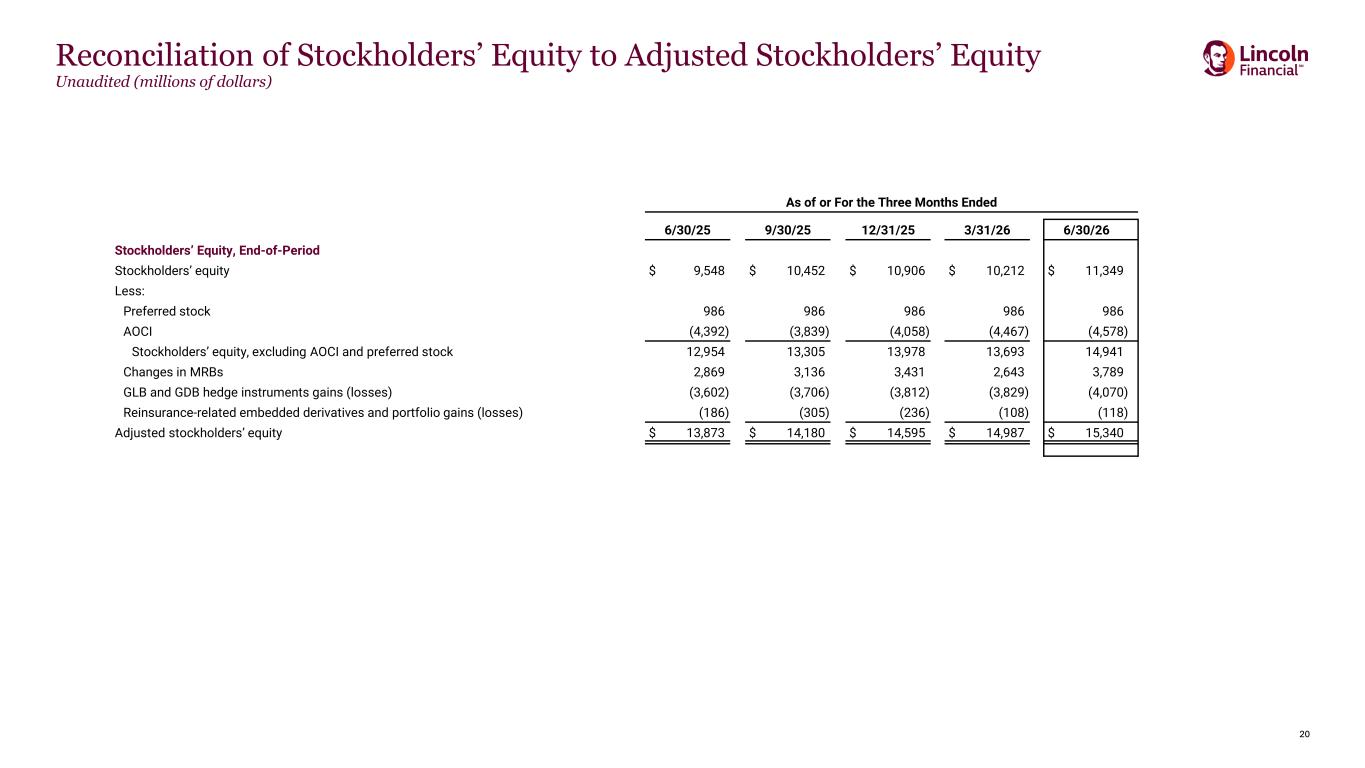
20 Reconciliation of Stockholders’ Equity to Adjusted Stockholders’ Equity Unaudited (millions of dollars) As of or For the Three Months Ended 6/30/25 9/30/25 12/31/25 3/31/26 6/30/26 Stockholders’ Equity, End-of-Period Stockholders’ equity $ 9,548 $ 10,452 $ 10,906 $ 10,212 $ 11,349 Less: Preferred stock 986 986 986 986 986 AOCI (4,392) (3,839) (4,058) (4,467) (4,578) Stockholders’ equity, excluding AOCI and preferred stock 12,954 13,305 13,978 13,693 14,941 Changes in MRBs 2,869 3,136 3,431 2,643 3,789 GLB and GDB hedge instruments gains (losses) (3,602) (3,706) (3,812) (3,829) (4,070) Reinsurance-related embedded derivatives and portfolio gains (losses) (186) (305) (236) (108) (118) Adjusted stockholders’ equity $ 13,873 $ 14,180 $ 14,595 $ 14,987 $ 15,340