
Q1 Fiscal 2027 Financial Results Conference Call July 30, 2026

Safe Harbor Statement 2 This presentation and the accompanying oral discussion contains “forward-looking statements” within the meaning of the Section 27A of the Securities Act of 1933, as amended, and Section 21E of the Securities Exchange Act of 1934, as amended. Such forward looking statements are generally identified by the use of forward-looking terminology, including the terms "anticipate," “believe,” “continue,” “could,” “estimate,” “expect,” “illustrative,” “intend,” “likely,” “may,” “opportunity,” “plan,” “possible,” “potential,” “predict,” “project,” “shall,” “should,” “target,” “will,” “would” and, in each case, their negative or other various or comparable terminology. Such forward-looking statements include, among others, statements regarding: (1) our strategy, outlook and growth prospects, including the Company's full year fiscal 2027 guidance, consisting of net sales, Adjusted EBITDA and Adjusted EPS for fiscal 2027, as well as the associated assumed inputs for fiscal 2027 regarding interest expense, including the amount of non-cash amortization of deferred financing fees, amortization expense, depreciation expense, effective tax rate and Adjusted Diluted Shares Outstanding; (2) our operational and financial targets and capital distribution policy, including regarding our expectation that the dividends payable on the Preferred Shares (as defined herein) will be accrued, accumulated and compounded, rather than being paid in cash, during fiscal 2027 (3) general economic trends and trends in our industry and markets; (4) our ability to successfully integrate the Kito Crosby Acquisition and achieve targeted net cost synergies and leverage reduction targets; (5) our ability to expand margins in future periods; and (6) the competitive environment in which we operate. Forward-looking statements are not based on historical facts, but instead represent our current expectations and assumptions regarding our business, the economy and other future conditions, and involve known and unknown risks, uncertainties and other factors that could cause the actual results, performance or achievements of the Company to differ materially from any future results, performance or achievements expressed or implied by the forward-looking statements. It is not possible to predict or identify all such risks. These risks include, but are not limited to, (1) risks relating to the competitive environment in which we operate; (2) the risk that the integration of Kito Crosby's business and operations into the Company will be more costly or difficult to complete than expected, or that the Company is otherwise unable to achieve its target synergies or that the timeline of such net cost synergy realization may be delayed, including as a result of unexpected factors or events; (3) risks related to the general competitive, economic, political and market conditions and other factors that may affect future results of the Company; and (4) the other risk factors that are described under the section titled “Risk Factors” in our Annual Report on Form 10-K for the fiscal year ended March 31, 2026 as well as in our other filings with the Securities and Exchange Commission, which are available on its website at www.sec.gov. Given these uncertainties, you should not place undue reliance on these forward-looking statements. Forward looking statements speak only as of the date they are made. Columbus McKinnon undertakes no duty to update publicly any such forward-looking statement, whether as a result of new information, future events or otherwise, except as may be required by applicable law, regulation or other competent legal authority. Non-GAAP Financial Measures and Forward-looking Non-GAAP Financial Measures This presentation will discuss some non-GAAP (“adjusted”) financial measures which we believe are useful in evaluating Columbus McKinnon’s performance. You should not consider the presentation of this additional information in isolation or as a substitute for results prepared in accordance with GAAP. The non-GAAP financial measures are noted and reconciliations of comparable historical GAAP measures with historical non-GAAP financial measures can be found in tables either included in the Supplemental Information portion of this presentation or our filings with the Securities and Exchange Commission.
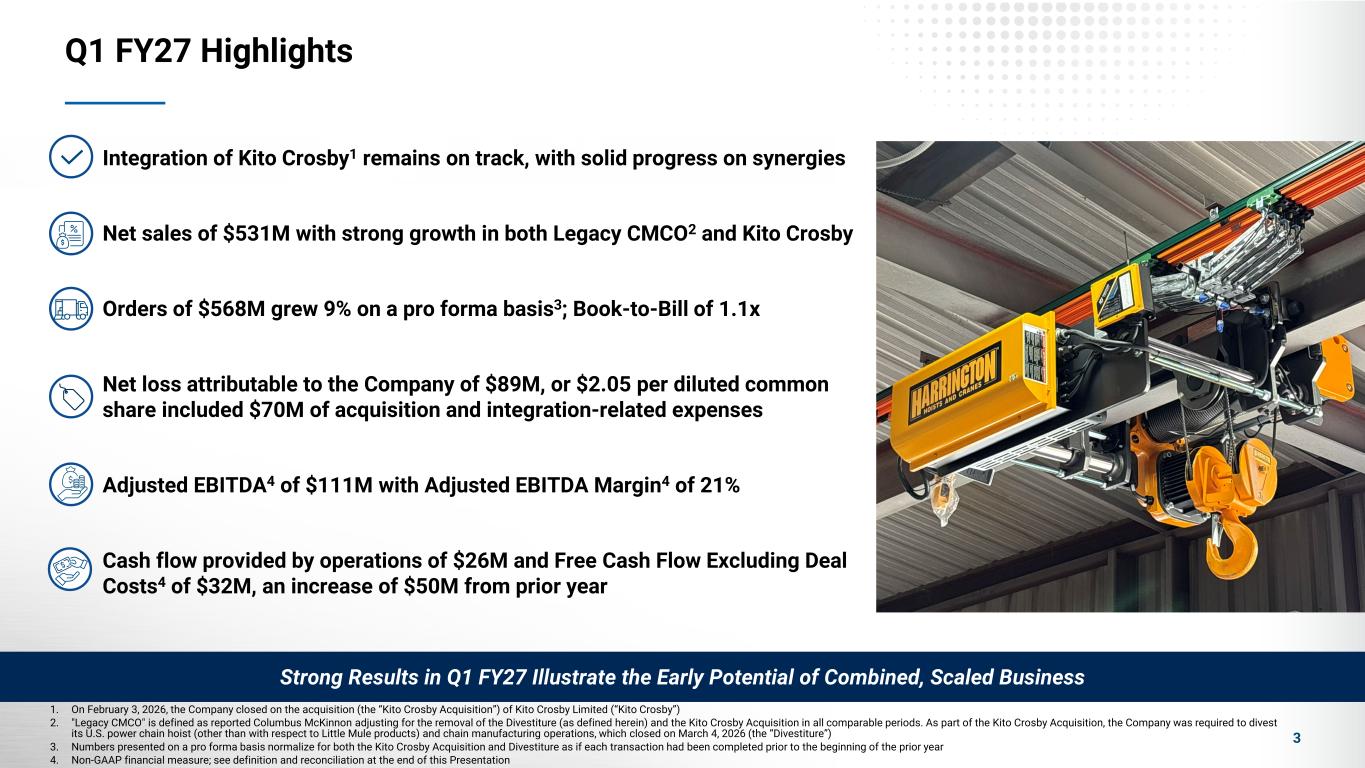
Q1 FY27 Highlights 3 1. On February 3, 2026, the Company closed on the acquisition (the “Kito Crosby Acquisition”) of Kito Crosby Limited (“Kito Crosby”) 2. "Legacy CMCO" is defined as reported Columbus McKinnon adjusting for the removal of the Divestiture (as defined herein) and the Kito Crosby Acquisition in all comparable periods. As part of the Kito Crosby Acquisition, the Company was required to divest its U.S. power chain hoist (other than with respect to Little Mule products) and chain manufacturing operations, which closed on March 4, 2026 (the “Divestiture”) 3. Numbers presented on a pro forma basis normalize for both the Kito Crosby Acquisition and Divestiture as if each transaction had been completed prior to the beginning of the prior year 4. Non-GAAP financial measure; see definition and reconciliation at the end of this Presentation Integration of Kito Crosby1 remains on track, with solid progress on synergies Net sales of $531M with strong growth in both Legacy CMCO2 and Kito Crosby Orders of $568M grew 9% on a pro forma basis3; Book-to-Bill of 1.1x Net loss attributable to the Company of $89M, or $2.05 per diluted common share included $70M of acquisition and integration-related expenses Adjusted EBITDA4 of $111M with Adjusted EBITDA Margin4 of 21% Cash flow provided by operations of $26M and Free Cash Flow Excluding Deal Costs4 of $32M, an increase of $50M from prior year Strong Results in Q1 FY27 Illustrate the Early Potential of Combined, Scaled Business
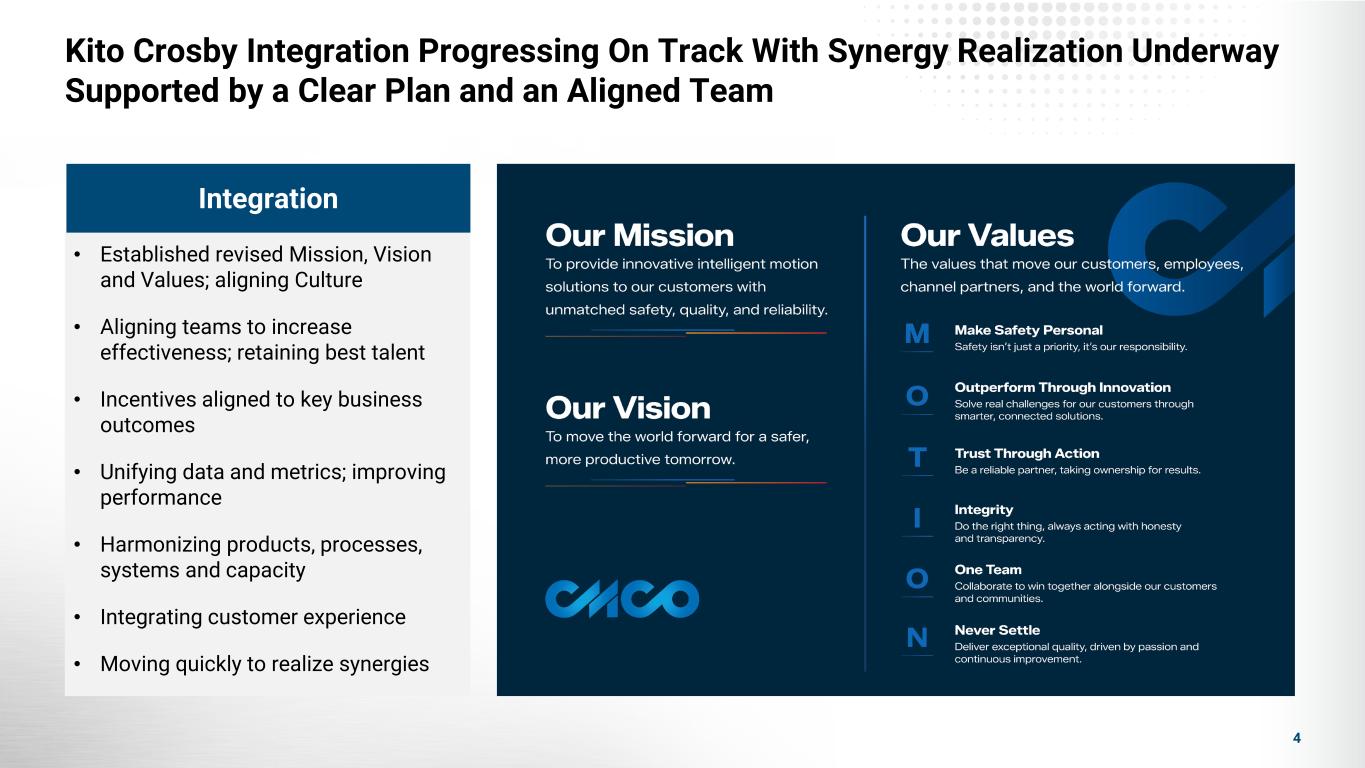
Kito Crosby Integration Progressing On Track With Synergy Realization Underway Supported by a Clear Plan and an Aligned Team Integration • Established revised Mission, Vision and Values; aligning Culture • Aligning teams to increase effectiveness; retaining best talent • Incentives aligned to key business outcomes • Unifying data and metrics; improving performance • Harmonizing products, processes, systems and capacity • Integrating customer experience • Moving quickly to realize synergies 4
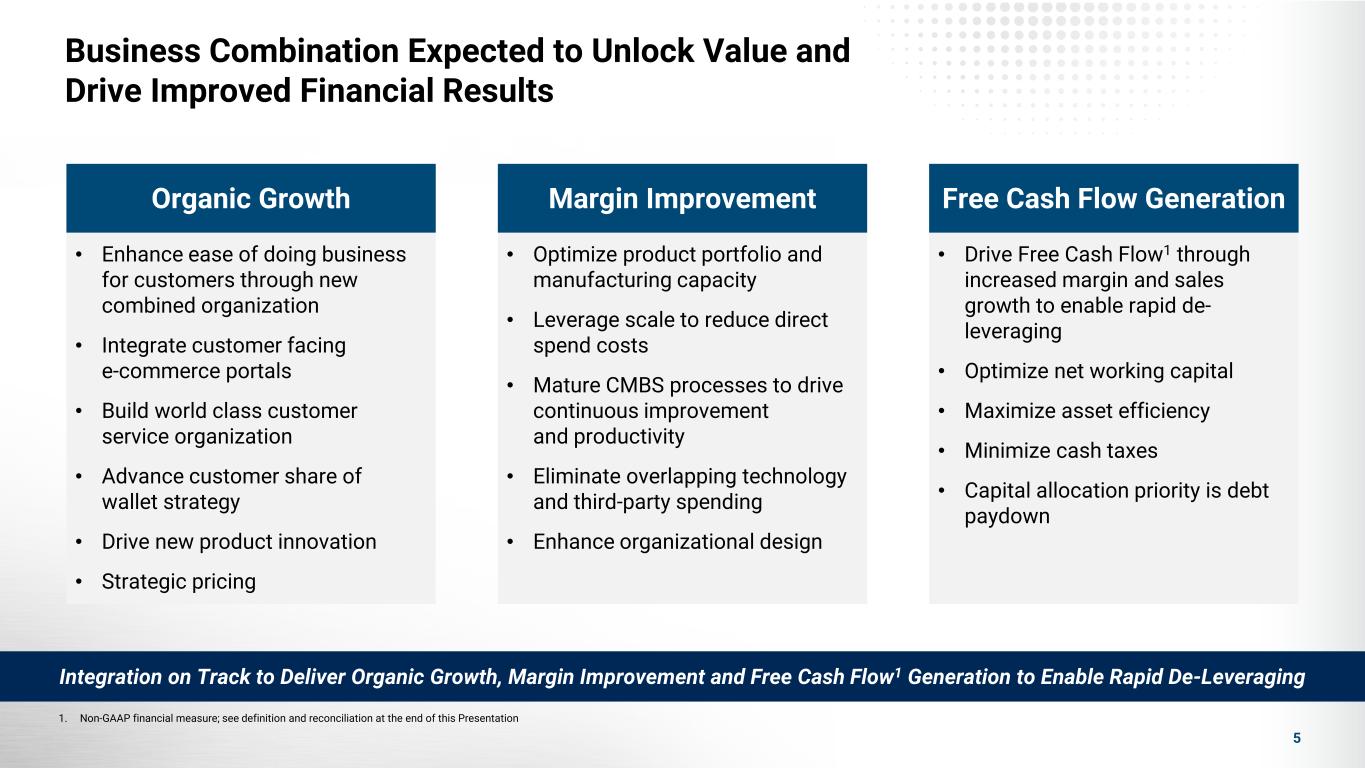
Business Combination Expected to Unlock Value and Drive Improved Financial Results Organic Growth • Enhance ease of doing business for customers through new combined organization • Integrate customer facing e-commerce portals • Build world class customer service organization • Advance customer share of wallet strategy • Drive new product innovation • Strategic pricing 1. Non-GAAP financial measure; see definition and reconciliation at the end of this Presentation Integration on Track to Deliver Organic Growth, Margin Improvement and Free Cash Flow1 Generation to Enable Rapid De-Leveraging 5 Margin Improvement Free Cash Flow Generation • Optimize product portfolio and manufacturing capacity • Leverage scale to reduce direct spend costs • Mature CMBS processes to drive continuous improvement and productivity • Eliminate overlapping technology and third-party spending • Enhance organizational design • Drive Free Cash Flow1 through increased margin and sales growth to enable rapid de- leveraging • Optimize net working capital • Maximize asset efficiency • Minimize cash taxes • Capital allocation priority is debt paydown
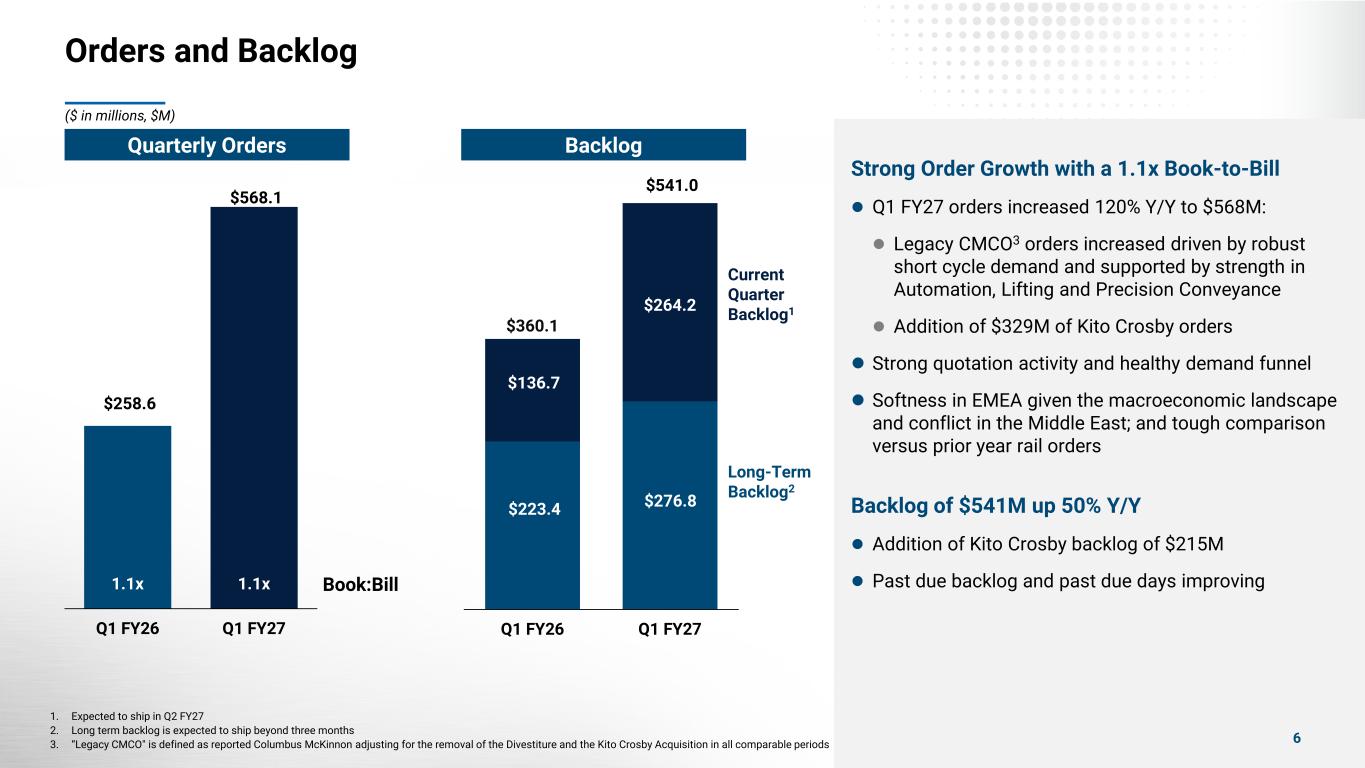
Strong Order Growth with a 1.1x Book-to-Bill Q1 FY27 orders increased 120% Y/Y to $568M: Legacy CMCO3 orders increased driven by robust short cycle demand and supported by strength in Automation, Lifting and Precision Conveyance Addition of $329M of Kito Crosby orders Strong quotation activity and healthy demand funnel Softness in EMEA given the macroeconomic landscape and conflict in the Middle East; and tough comparison versus prior year rail orders Backlog of $541M up 50% Y/Y Addition of Kito Crosby backlog of $215M Past due backlog and past due days improving Orders and Backlog 6 $223.4 $276.8 $136.7 $264.2 $360.1 $541.0 Q1 FY26 Q1 FY27 Book:Bill $258.6 $568.1 1.1x 1.1x Q1 FY26 Q1 FY27 Current Quarter Backlog1 Long-Term Backlog2 1. Expected to ship in Q2 FY27 2. Long term backlog is expected to ship beyond three months 3. “Legacy CMCO" is defined as reported Columbus McKinnon adjusting for the removal of the Divestiture and the Kito Crosby Acquisition in all comparable periods ($ in millions, $M) BacklogQuarterly Orders
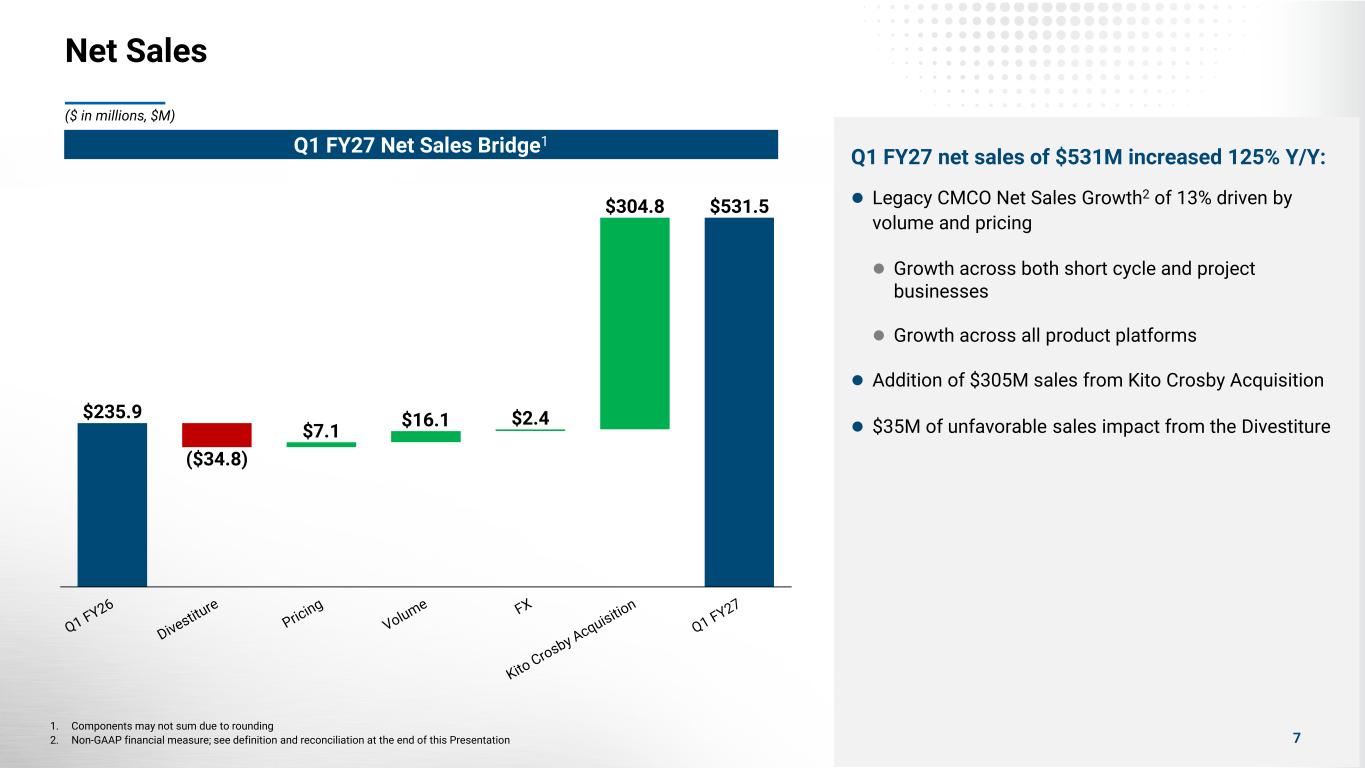
Q1 FY27 net sales of $531M increased 125% Y/Y: Legacy CMCO Net Sales Growth2 of 13% driven by volume and pricing Growth across both short cycle and project businesses Growth across all product platforms Addition of $305M sales from Kito Crosby Acquisition $35M of unfavorable sales impact from the Divestiture $235.9 $7.1 $16.1 $2.4 $304.8 $531.5 ($34.8) Q1 FY27 Net Sales Bridge1 Net Sales 7 ($ in millions, $M) 1. Components may not sum due to rounding 2. Non-GAAP financial measure; see definition and reconciliation at the end of this Presentation
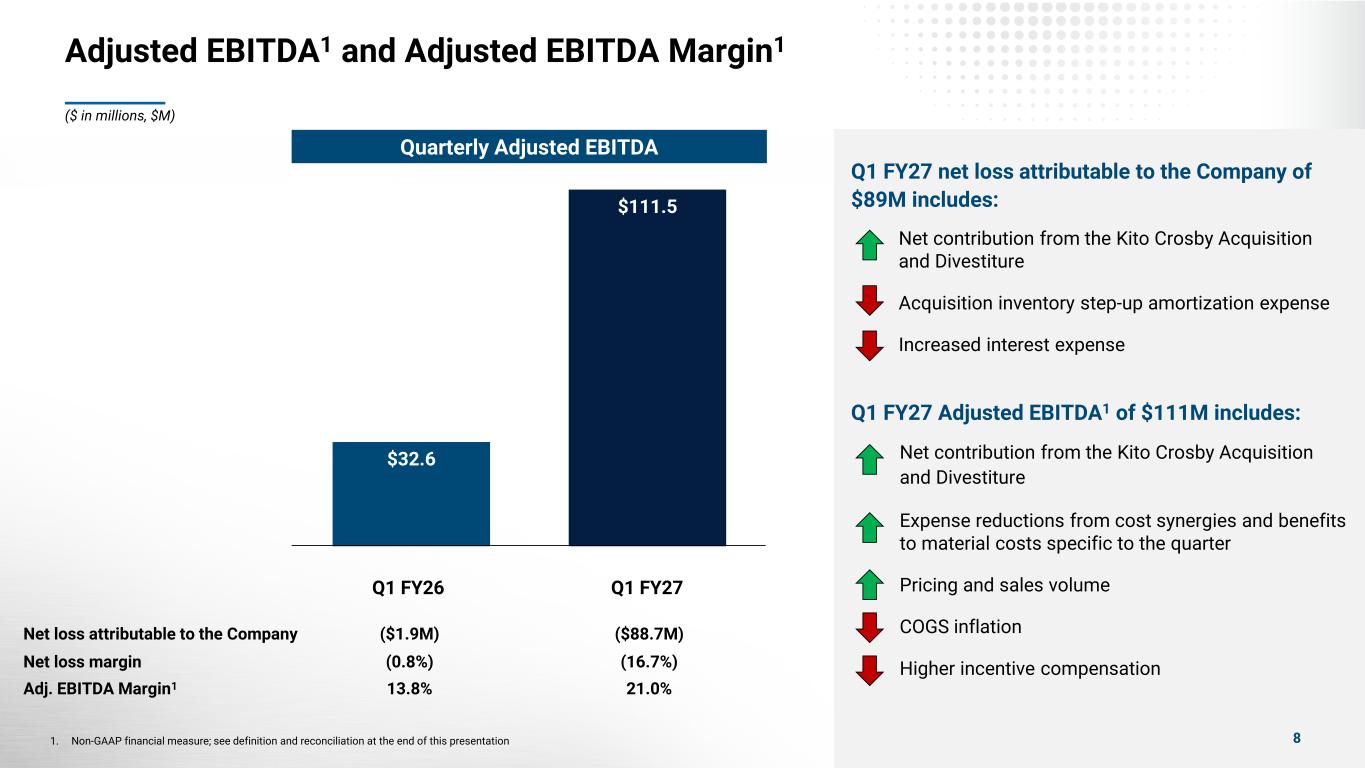
Q1 FY27 net loss attributable to the Company of $89M includes: Net contribution from the Kito Crosby Acquisition and Divestiture Acquisition inventory step-up amortization expense Increased interest expense Q1 FY27 Adjusted EBITDA1 of $111M includes: Net contribution from the Kito Crosby Acquisition and Divestiture Expense reductions from cost synergies and benefits to material costs specific to the quarter Pricing and sales volume COGS inflation Higher incentive compensation Adjusted EBITDA1 and Adjusted EBITDA Margin1 ($ in millions, $M) $32.6 $111.5 Q1 FY26 Q1 FY27 Net loss attributable to the Company ($1.9M) ($88.7M) Net loss margin (0.8%) (16.7%) Adj. EBITDA Margin1 13.8% 21.0% 81. Non-GAAP financial measure; see definition and reconciliation at the end of this presentation Quarterly Adjusted EBITDA
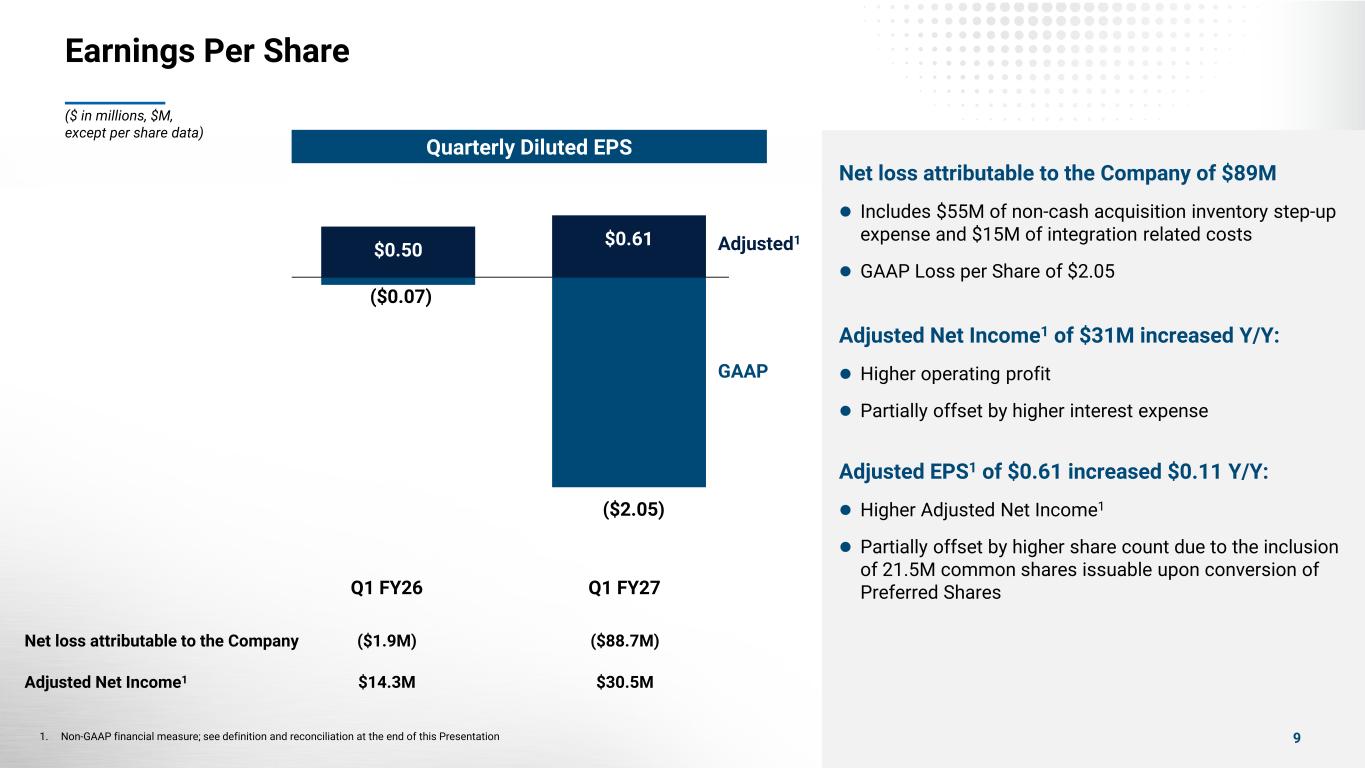
Earnings Per Share ($ in millions, $M, except per share data) Q1 FY26 Q1 FY27 1. Non-GAAP financial measure; see definition and reconciliation at the end of this Presentation Net loss attributable to the Company ($1.9M) ($88.7M) Adjusted Net Income1 $14.3M $30.5M Adjusted1 GAAP Quarterly Diluted EPS ($0.07) ($2.05) $0.50 $0.61 Net loss attributable to the Company of $89M Includes $55M of non-cash acquisition inventory step-up expense and $15M of integration related costs GAAP Loss per Share of $2.05 Adjusted Net Income1 of $31M increased Y/Y: Higher operating profit Partially offset by higher interest expense Adjusted EPS1 of $0.61 increased $0.11 Y/Y: Higher Adjusted Net Income1 Partially offset by higher share count due to the inclusion of 21.5M common shares issuable upon conversion of Preferred Shares 9
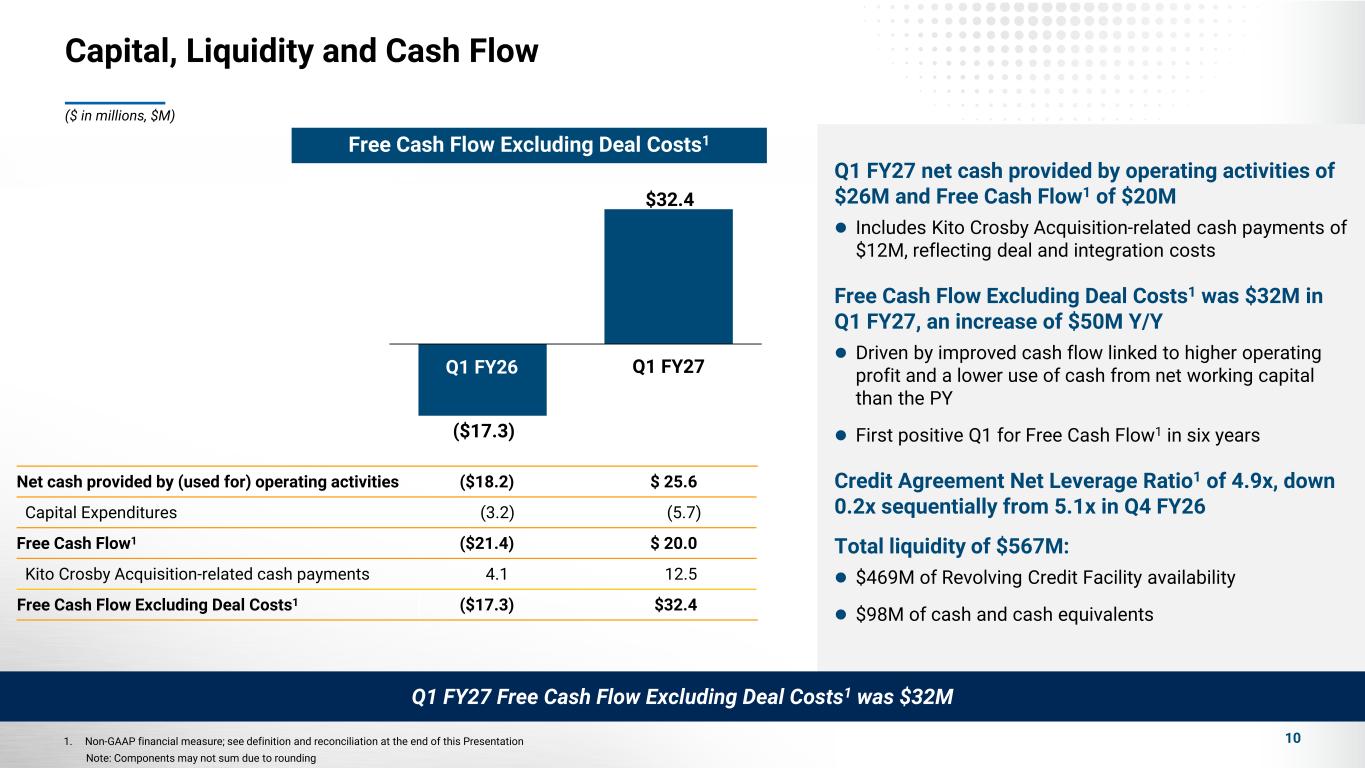
Capital, Liquidity and Cash Flow 10 Net cash provided by (used for) operating activities ($18.2) $ 25.6 Capital Expenditures (3.2) (5.7) Free Cash Flow1 ($21.4) $ 20.0 Kito Crosby Acquisition-related cash payments 4.1 12.5 Free Cash Flow Excluding Deal Costs1 ($17.3) $32.4 Note: Components may not sum due to rounding Q1 FY27 net cash provided by operating activities of $26M and Free Cash Flow1 of $20M Includes Kito Crosby Acquisition-related cash payments of $12M, reflecting deal and integration costs Free Cash Flow Excluding Deal Costs1 was $32M in Q1 FY27, an increase of $50M Y/Y Driven by improved cash flow linked to higher operating profit and a lower use of cash from net working capital than the PY First positive Q1 for Free Cash Flow1 in six years Credit Agreement Net Leverage Ratio1 of 4.9x, down 0.2x sequentially from 5.1x in Q4 FY26 Total liquidity of $567M: $469M of Revolving Credit Facility availability $98M of cash and cash equivalents Q1 FY27 Free Cash Flow Excluding Deal Costs1 was $32M 1. Non-GAAP financial measure; see definition and reconciliation at the end of this Presentation ($ in millions, $M) Free Cash Flow Excluding Deal Costs1 ($17.3) $32.4 Q1 FY26 Q1 FY27
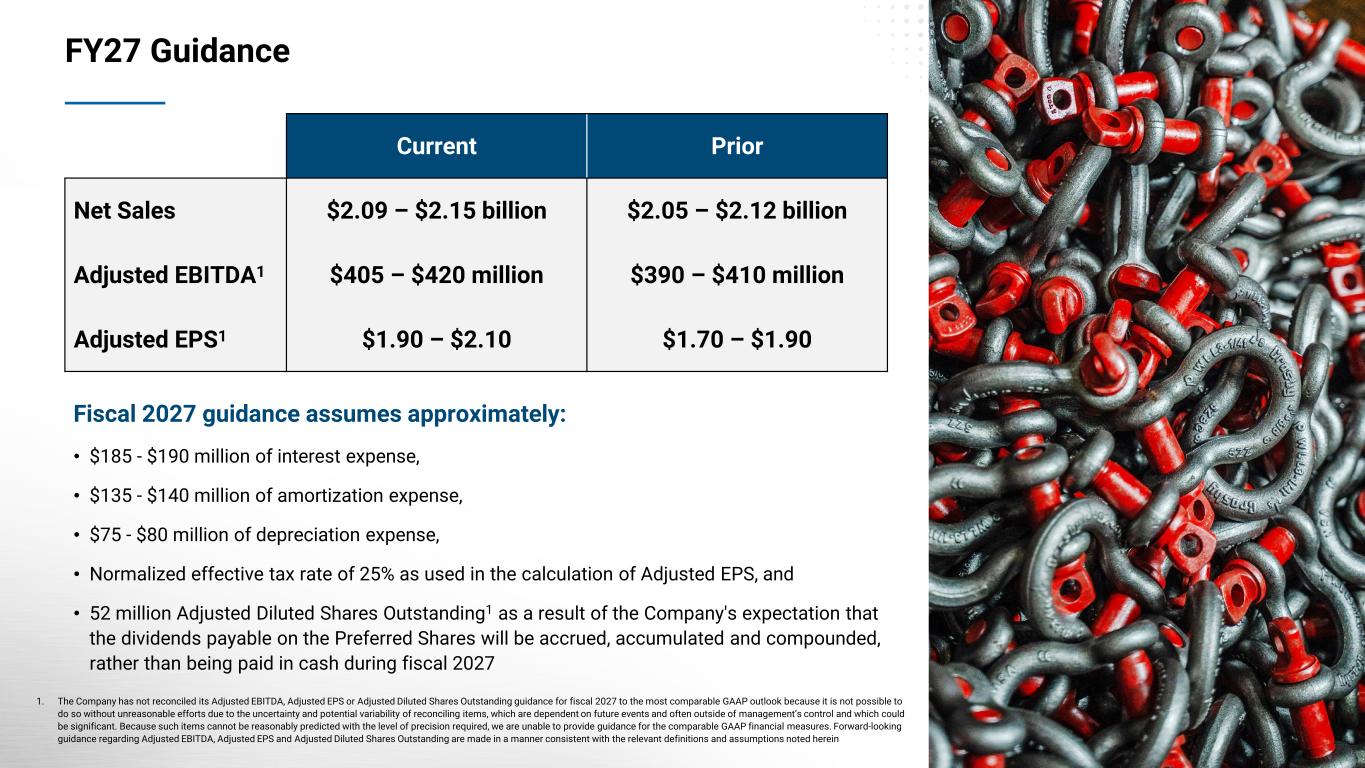
FY27 Guidance 11 Current Prior Net Sales $2.09 – $2.15 billion $2.05 – $2.12 billion Adjusted EBITDA1 $405 – $420 million $390 – $410 million Adjusted EPS1 $1.90 – $2.10 $1.70 – $1.90 1. The Company has not reconciled its Adjusted EBITDA, Adjusted EPS or Adjusted Diluted Shares Outstanding guidance for fiscal 2027 to the most comparable GAAP outlook because it is not possible to do so without unreasonable efforts due to the uncertainty and potential variability of reconciling items, which are dependent on future events and often outside of management’s control and which could be significant. Because such items cannot be reasonably predicted with the level of precision required, we are unable to provide guidance for the comparable GAAP financial measures. Forward-looking guidance regarding Adjusted EBITDA, Adjusted EPS and Adjusted Diluted Shares Outstanding are made in a manner consistent with the relevant definitions and assumptions noted herein Fiscal 2027 guidance assumes approximately: • $185 - $190 million of interest expense, • $135 - $140 million of amortization expense, • $75 - $80 million of depreciation expense, • Normalized effective tax rate of 25% as used in the calculation of Adjusted EPS, and • 52 million Adjusted Diluted Shares Outstanding1 as a result of the Company's expectation that the dividends payable on the Preferred Shares will be accrued, accumulated and compounded, rather than being paid in cash during fiscal 2027

Confidential and Proprietary SUPPLEMENT
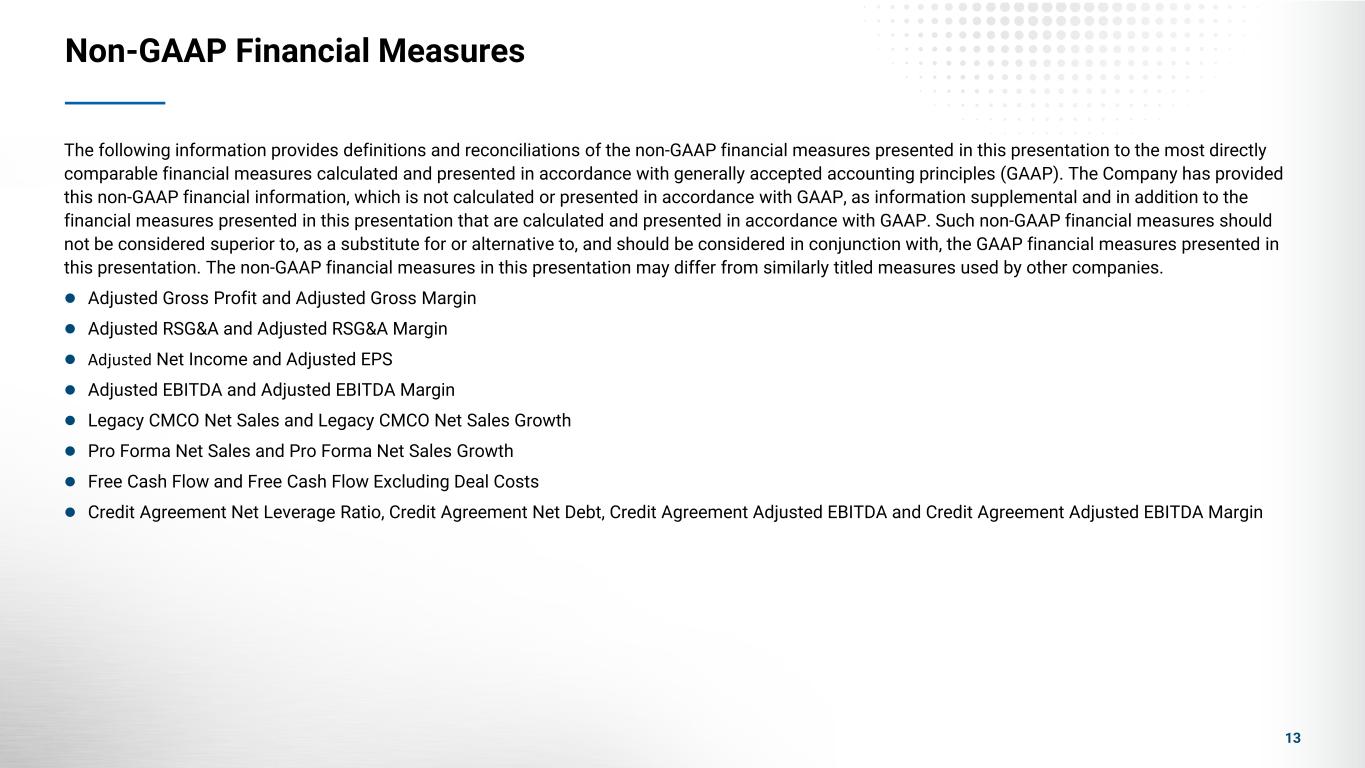
Non-GAAP Financial Measures 13 The following information provides definitions and reconciliations of the non-GAAP financial measures presented in this presentation to the most directly comparable financial measures calculated and presented in accordance with generally accepted accounting principles (GAAP). The Company has provided this non-GAAP financial information, which is not calculated or presented in accordance with GAAP, as information supplemental and in addition to the financial measures presented in this presentation that are calculated and presented in accordance with GAAP. Such non-GAAP financial measures should not be considered superior to, as a substitute for or alternative to, and should be considered in conjunction with, the GAAP financial measures presented in this presentation. The non-GAAP financial measures in this presentation may differ from similarly titled measures used by other companies. Adjusted Gross Profit and Adjusted Gross Margin Adjusted RSG&A and Adjusted RSG&A Margin Adjusted Net Income and Adjusted EPS Adjusted EBITDA and Adjusted EBITDA Margin Legacy CMCO Net Sales and Legacy CMCO Net Sales Growth Pro Forma Net Sales and Pro Forma Net Sales Growth Free Cash Flow and Free Cash Flow Excluding Deal Costs Credit Agreement Net Leverage Ratio, Credit Agreement Net Debt, Credit Agreement Adjusted EBITDA and Credit Agreement Adjusted EBITDA Margin
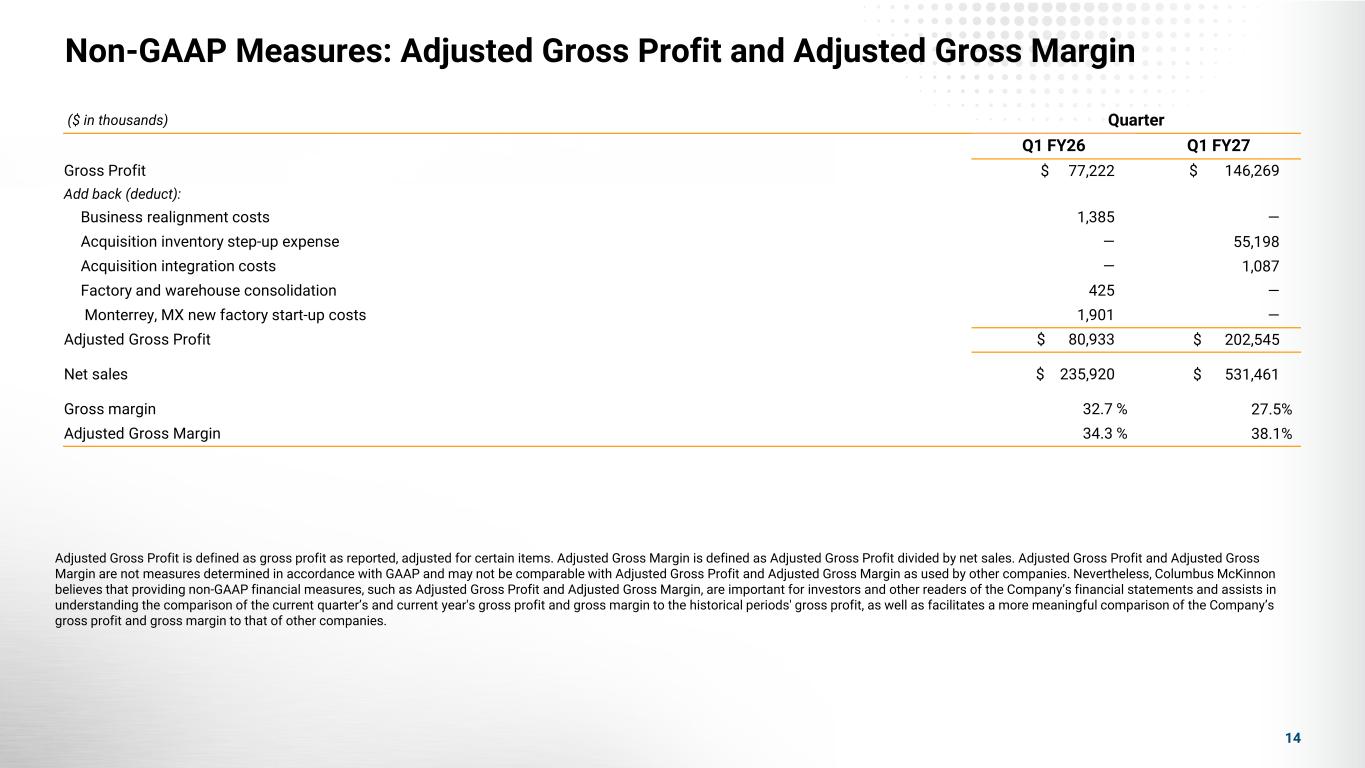
Non-GAAP Measures: Adjusted Gross Profit and Adjusted Gross Margin 14 Adjusted Gross Profit is defined as gross profit as reported, adjusted for certain items. Adjusted Gross Margin is defined as Adjusted Gross Profit divided by net sales. Adjusted Gross Profit and Adjusted Gross Margin are not measures determined in accordance with GAAP and may not be comparable with Adjusted Gross Profit and Adjusted Gross Margin as used by other companies. Nevertheless, Columbus McKinnon believes that providing non-GAAP financial measures, such as Adjusted Gross Profit and Adjusted Gross Margin, are important for investors and other readers of the Company’s financial statements and assists in understanding the comparison of the current quarter’s and current year's gross profit and gross margin to the historical periods' gross profit, as well as facilitates a more meaningful comparison of the Company’s gross profit and gross margin to that of other companies. ($ in thousands) Quarter Q1 FY26 Q1 FY27 Gross Profit $ 77,222 $ 146,269 Add back (deduct): Business realignment costs 1,385 — Acquisition inventory step-up expense — 55,198 Acquisition integration costs — 1,087 Factory and warehouse consolidation 425 — Monterrey, MX new factory start-up costs 1,901 — Adjusted Gross Profit $ 80,933 $ 202,545 Net sales $ 235,920 $ 531,461 Gross margin 32.7 % 27.5% Adjusted Gross Margin 34.3 % 38.1%
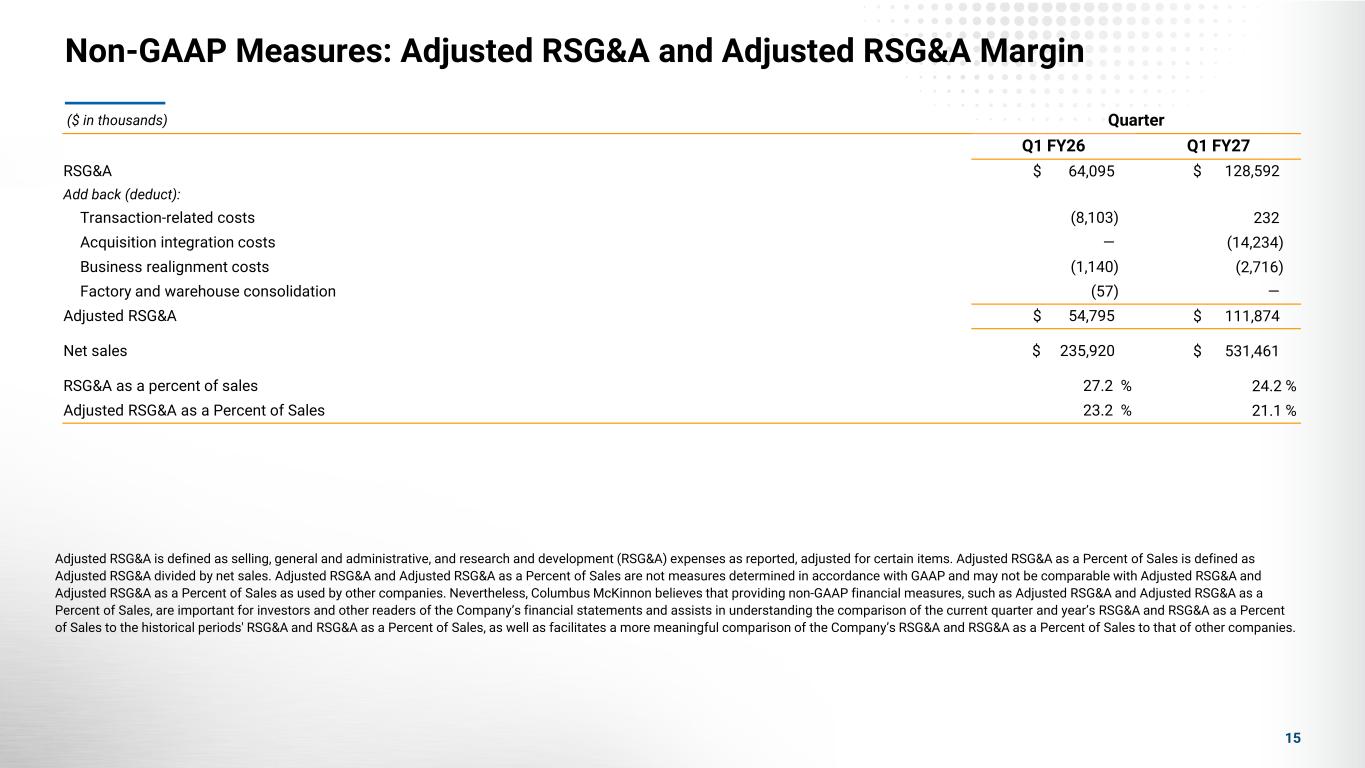
Non-GAAP Measures: Adjusted RSG&A and Adjusted RSG&A Margin 15 ($ in thousands) Quarter Q1 FY26 Q1 FY27 RSG&A $ 64,095 $ 128,592 Add back (deduct): Transaction-related costs (8,103) 232 Acquisition integration costs — (14,234) Business realignment costs (1,140) (2,716) Factory and warehouse consolidation (57) — Adjusted RSG&A $ 54,795 $ 111,874 Net sales $ 235,920 $ 531,461 RSG&A as a percent of sales 27.2 % 24.2 % Adjusted RSG&A as a Percent of Sales 23.2 % 21.1 % Adjusted RSG&A is defined as selling, general and administrative, and research and development (RSG&A) expenses as reported, adjusted for certain items. Adjusted RSG&A as a Percent of Sales is defined as Adjusted RSG&A divided by net sales. Adjusted RSG&A and Adjusted RSG&A as a Percent of Sales are not measures determined in accordance with GAAP and may not be comparable with Adjusted RSG&A and Adjusted RSG&A as a Percent of Sales as used by other companies. Nevertheless, Columbus McKinnon believes that providing non-GAAP financial measures, such as Adjusted RSG&A and Adjusted RSG&A as a Percent of Sales, are important for investors and other readers of the Company’s financial statements and assists in understanding the comparison of the current quarter and year’s RSG&A and RSG&A as a Percent of Sales to the historical periods' RSG&A and RSG&A as a Percent of Sales, as well as facilitates a more meaningful comparison of the Company’s RSG&A and RSG&A as a Percent of Sales to that of other companies.
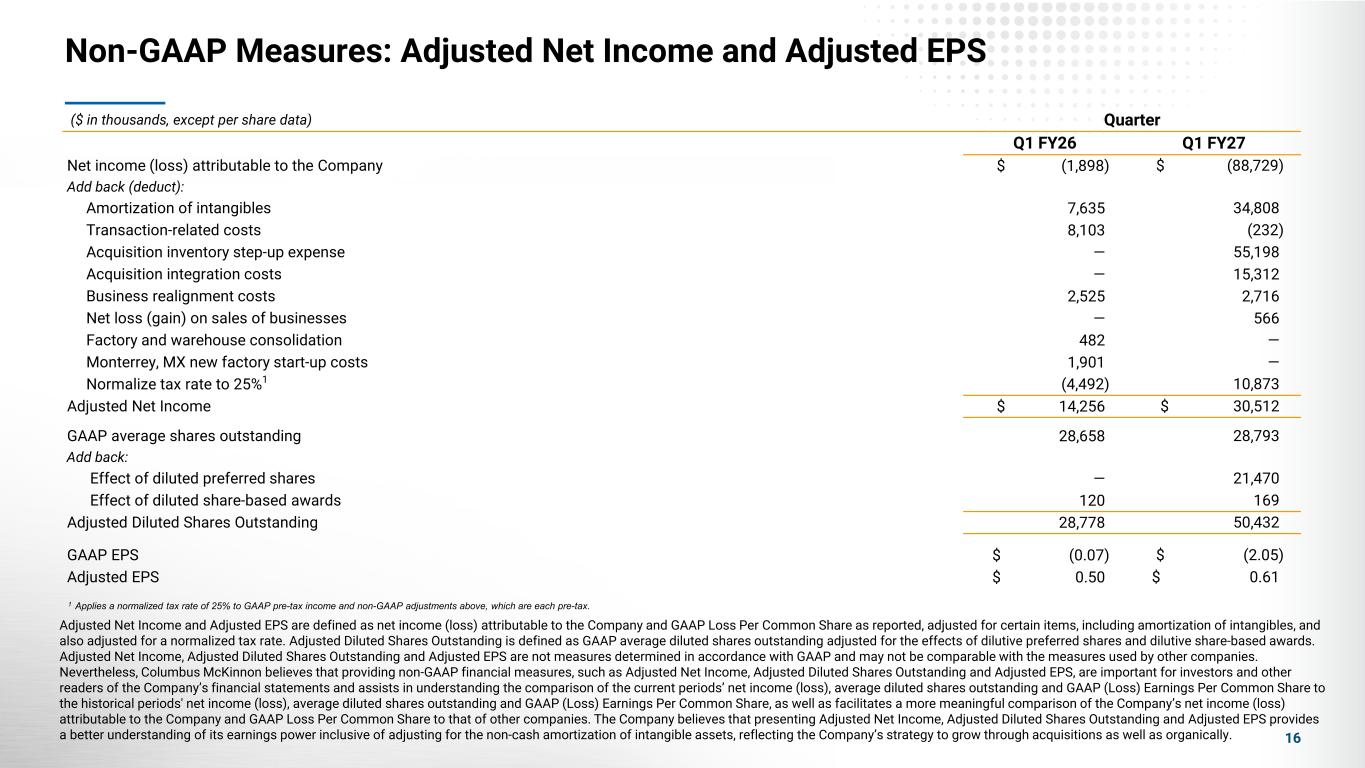
Adjusted Net Income and Adjusted EPS are defined as net income (loss) attributable to the Company and GAAP Loss Per Common Share as reported, adjusted for certain items, including amortization of intangibles, and also adjusted for a normalized tax rate. Adjusted Diluted Shares Outstanding is defined as GAAP average diluted shares outstanding adjusted for the effects of dilutive preferred shares and dilutive share-based awards. Adjusted Net Income, Adjusted Diluted Shares Outstanding and Adjusted EPS are not measures determined in accordance with GAAP and may not be comparable with the measures used by other companies. Nevertheless, Columbus McKinnon believes that providing non-GAAP financial measures, such as Adjusted Net Income, Adjusted Diluted Shares Outstanding and Adjusted EPS, are important for investors and other readers of the Company’s financial statements and assists in understanding the comparison of the current periods’ net income (loss), average diluted shares outstanding and GAAP (Loss) Earnings Per Common Share to the historical periods' net income (loss), average diluted shares outstanding and GAAP (Loss) Earnings Per Common Share, as well as facilitates a more meaningful comparison of the Company’s net income (loss) attributable to the Company and GAAP Loss Per Common Share to that of other companies. The Company believes that presenting Adjusted Net Income, Adjusted Diluted Shares Outstanding and Adjusted EPS provides a better understanding of its earnings power inclusive of adjusting for the non-cash amortization of intangible assets, reflecting the Company’s strategy to grow through acquisitions as well as organically. Non-GAAP Measures: Adjusted Net Income and Adjusted EPS ($ in thousands, except per share data) Quarter Q1 FY26 Q1 FY27 Net income (loss) attributable to the Company $ (1,898) $ (88,729) Add back (deduct): Amortization of intangibles 7,635 34,808 Transaction-related costs 8,103 (232) Acquisition inventory step-up expense — 55,198 Acquisition integration costs — 15,312 Business realignment costs 2,525 2,716 Net loss (gain) on sales of businesses — 566 Factory and warehouse consolidation 482 — Monterrey, MX new factory start-up costs 1,901 — Normalize tax rate to 25%1 (4,492) 10,873 Adjusted Net Income $ 14,256 $ 30,512 GAAP average shares outstanding 28,658 28,793 Add back: Effect of diluted preferred shares — 21,470 Effect of diluted share-based awards 120 169 Adjusted Diluted Shares Outstanding 28,778 50,432 GAAP EPS $ (0.07) $ (2.05) Adjusted EPS $ 0.50 $ 0.61 16 1 Applies a normalized tax rate of 25% to GAAP pre-tax income and non-GAAP adjustments above, which are each pre-tax.
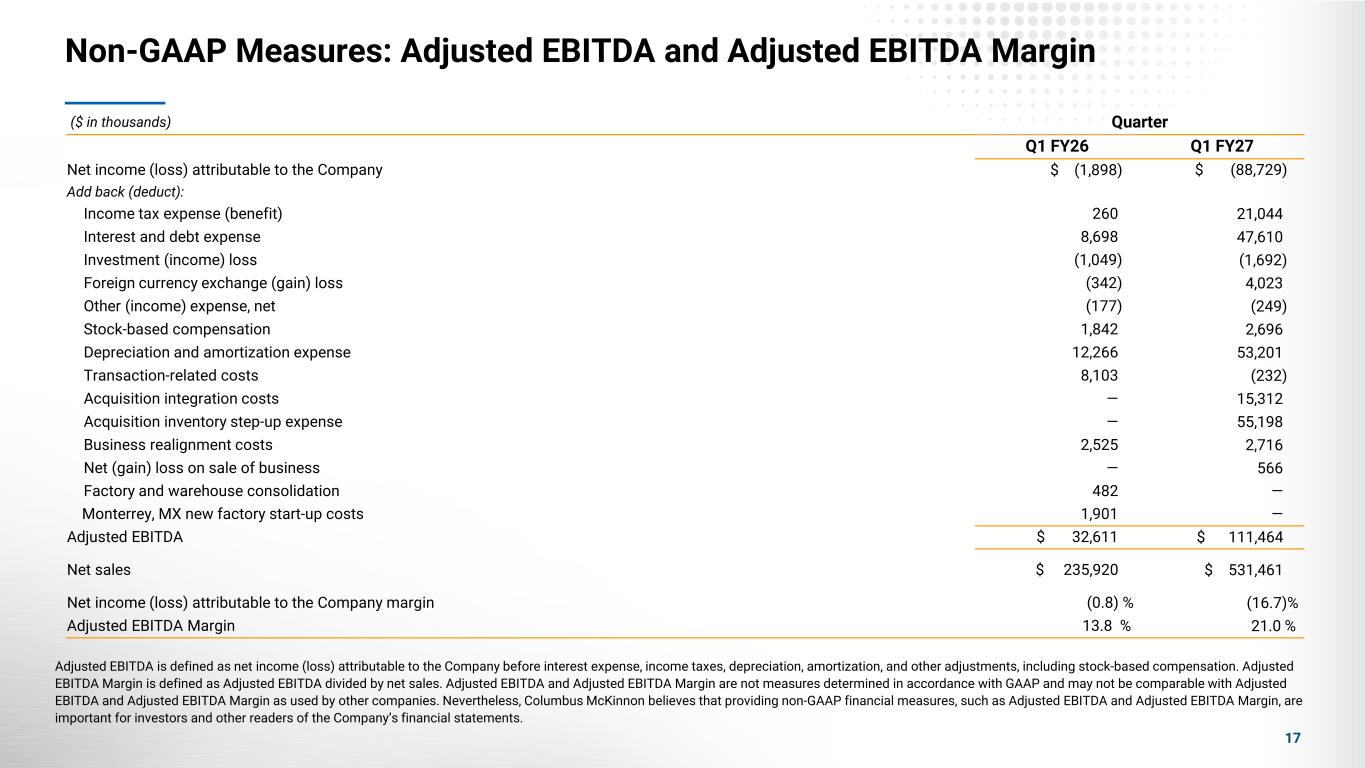
Non-GAAP Measures: Adjusted EBITDA and Adjusted EBITDA Margin 17 ($ in thousands) Quarter Q1 FY26 Q1 FY27 Net income (loss) attributable to the Company $ (1,898) $ (88,729) Add back (deduct): Income tax expense (benefit) 260 21,044 Interest and debt expense 8,698 47,610 Investment (income) loss (1,049) (1,692) Foreign currency exchange (gain) loss (342) 4,023 Other (income) expense, net (177) (249) Stock-based compensation 1,842 2,696 Depreciation and amortization expense 12,266 53,201 Transaction-related costs 8,103 (232) Acquisition integration costs — 15,312 Acquisition inventory step-up expense — 55,198 Business realignment costs 2,525 2,716 Net (gain) loss on sale of business — 566 Factory and warehouse consolidation 482 — Monterrey, MX new factory start-up costs 1,901 — Adjusted EBITDA $ 32,611 $ 111,464 Net sales $ 235,920 $ 531,461 Net income (loss) attributable to the Company margin (0.8) % (16.7)% Adjusted EBITDA Margin 13.8 % 21.0 % Adjusted EBITDA is defined as net income (loss) attributable to the Company before interest expense, income taxes, depreciation, amortization, and other adjustments, including stock-based compensation. Adjusted EBITDA Margin is defined as Adjusted EBITDA divided by net sales. Adjusted EBITDA and Adjusted EBITDA Margin are not measures determined in accordance with GAAP and may not be comparable with Adjusted EBITDA and Adjusted EBITDA Margin as used by other companies. Nevertheless, Columbus McKinnon believes that providing non-GAAP financial measures, such as Adjusted EBITDA and Adjusted EBITDA Margin, are important for investors and other readers of the Company’s financial statements.
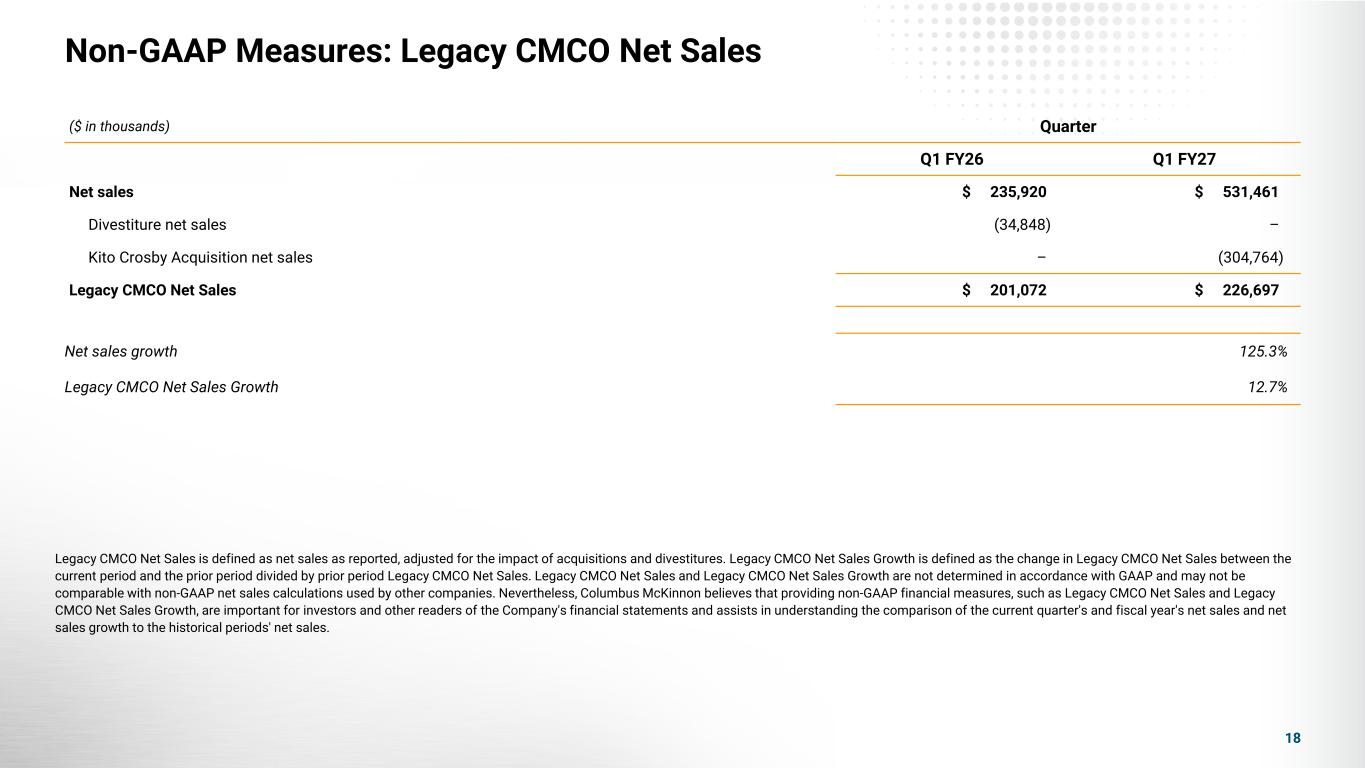
Non-GAAP Measures: Legacy CMCO Net Sales 18 ($ in thousands) Quarter Q1 FY26 Q1 FY27 Net sales $ 235,920 $ 531,461 Divestiture net sales (34,848) – Kito Crosby Acquisition net sales – (304,764) Legacy CMCO Net Sales $ 201,072 $ 226,697 Net sales growth 125.3% Legacy CMCO Net Sales Growth 12.7% Legacy CMCO Net Sales is defined as net sales as reported, adjusted for the impact of acquisitions and divestitures. Legacy CMCO Net Sales Growth is defined as the change in Legacy CMCO Net Sales between the current period and the prior period divided by prior period Legacy CMCO Net Sales. Legacy CMCO Net Sales and Legacy CMCO Net Sales Growth are not determined in accordance with GAAP and may not be comparable with non-GAAP net sales calculations used by other companies. Nevertheless, Columbus McKinnon believes that providing non-GAAP financial measures, such as Legacy CMCO Net Sales and Legacy CMCO Net Sales Growth, are important for investors and other readers of the Company's financial statements and assists in understanding the comparison of the current quarter's and fiscal year's net sales and net sales growth to the historical periods' net sales.
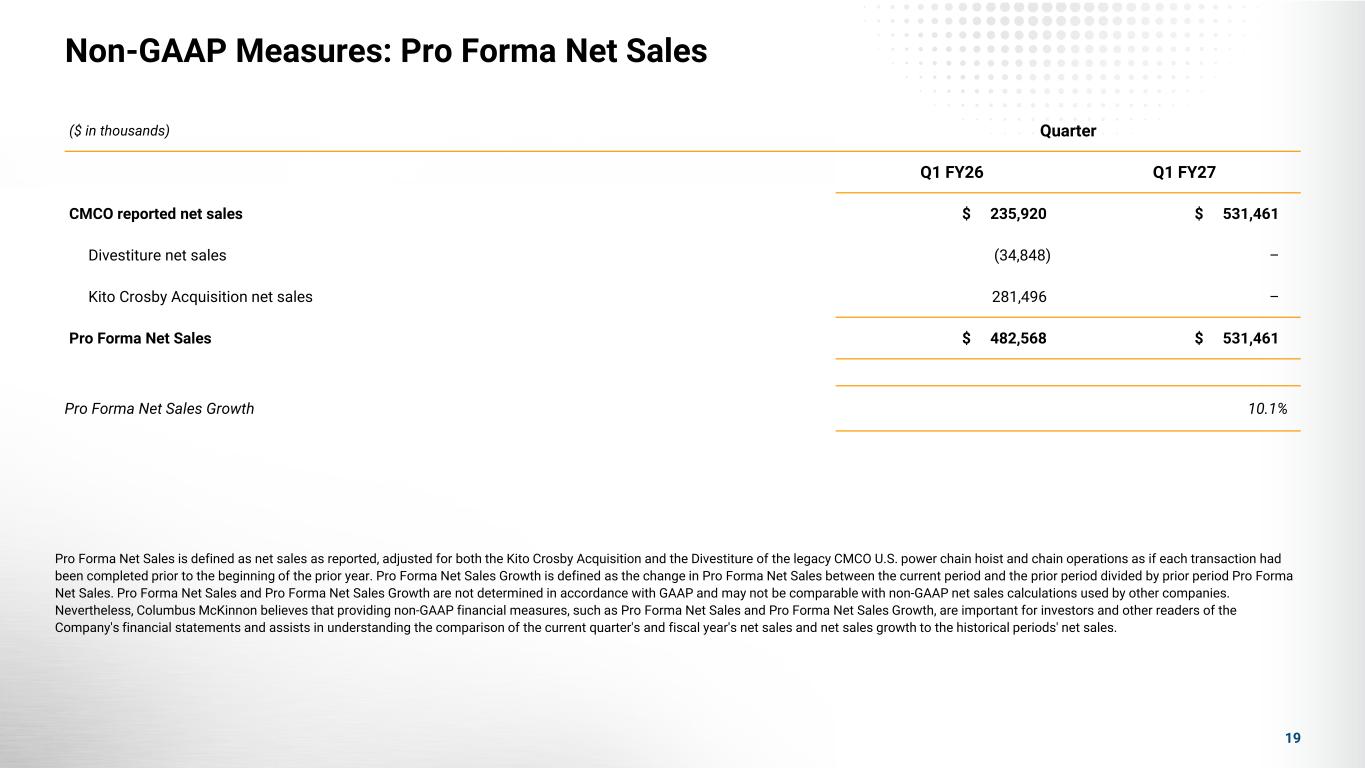
Non-GAAP Measures: Pro Forma Net Sales 19 ($ in thousands) Quarter Q1 FY26 Q1 FY27 CMCO reported net sales $ 235,920 $ 531,461 Divestiture net sales (34,848) – Kito Crosby Acquisition net sales 281,496 – Pro Forma Net Sales $ 482,568 $ 531,461 Pro Forma Net Sales Growth 10.1% Pro Forma Net Sales is defined as net sales as reported, adjusted for both the Kito Crosby Acquisition and the Divestiture of the legacy CMCO U.S. power chain hoist and chain operations as if each transaction had been completed prior to the beginning of the prior year. Pro Forma Net Sales Growth is defined as the change in Pro Forma Net Sales between the current period and the prior period divided by prior period Pro Forma Net Sales. Pro Forma Net Sales and Pro Forma Net Sales Growth are not determined in accordance with GAAP and may not be comparable with non-GAAP net sales calculations used by other companies. Nevertheless, Columbus McKinnon believes that providing non-GAAP financial measures, such as Pro Forma Net Sales and Pro Forma Net Sales Growth, are important for investors and other readers of the Company's financial statements and assists in understanding the comparison of the current quarter's and fiscal year's net sales and net sales growth to the historical periods' net sales.
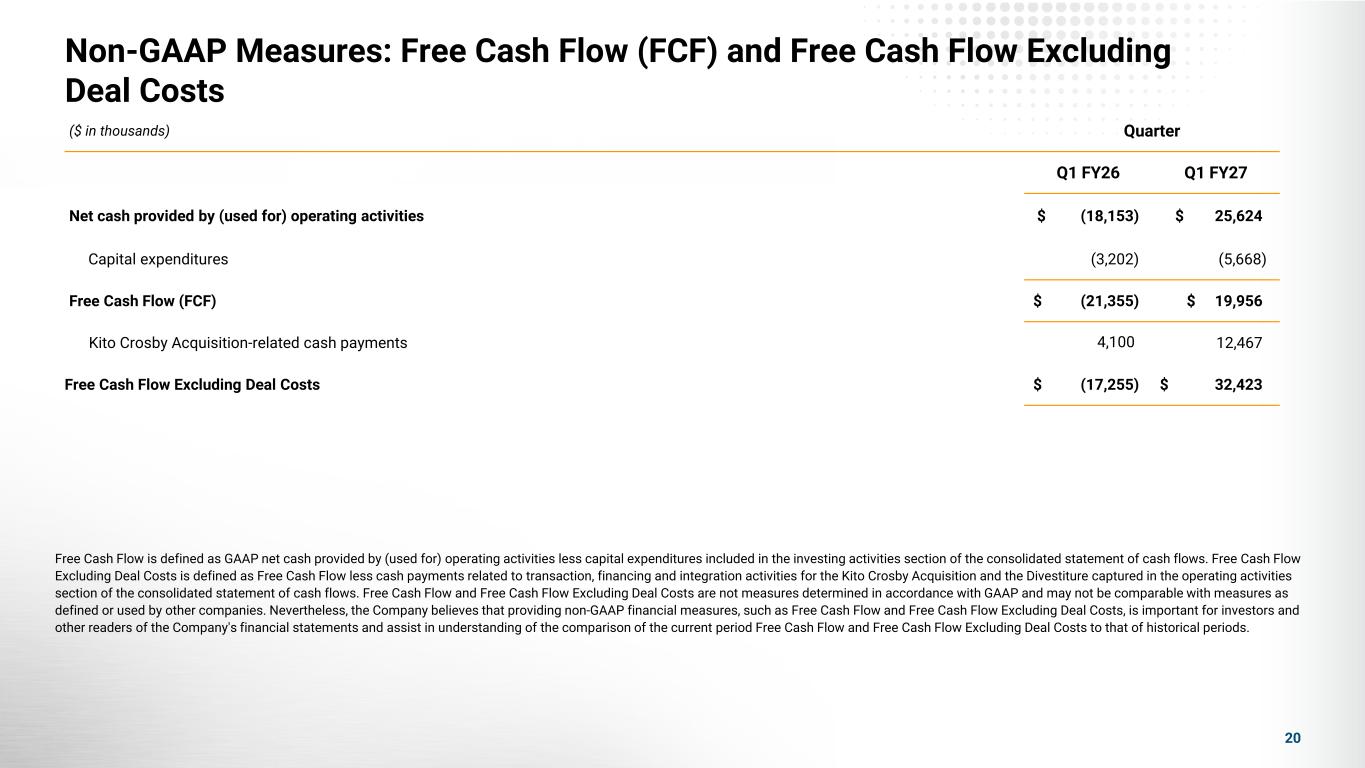
Non-GAAP Measures: Free Cash Flow (FCF) and Free Cash Flow Excluding Deal Costs 20 ($ in thousands) Quarter Q1 FY26 Q1 FY27 Net cash provided by (used for) operating activities $ (18,153) $ 25,624 Capital expenditures (3,202) (5,668) Free Cash Flow (FCF) $ (21,355) $ 19,956 Kito Crosby Acquisition-related cash payments 4,100 12,467 Free Cash Flow Excluding Deal Costs $ (17,255) $ 32,423 Free Cash Flow is defined as GAAP net cash provided by (used for) operating activities less capital expenditures included in the investing activities section of the consolidated statement of cash flows. Free Cash Flow Excluding Deal Costs is defined as Free Cash Flow less cash payments related to transaction, financing and integration activities for the Kito Crosby Acquisition and the Divestiture captured in the operating activities section of the consolidated statement of cash flows. Free Cash Flow and Free Cash Flow Excluding Deal Costs are not measures determined in accordance with GAAP and may not be comparable with measures as defined or used by other companies. Nevertheless, the Company believes that providing non-GAAP financial measures, such as Free Cash Flow and Free Cash Flow Excluding Deal Costs, is important for investors and other readers of the Company's financial statements and assist in understanding of the comparison of the current period Free Cash Flow and Free Cash Flow Excluding Deal Costs to that of historical periods.
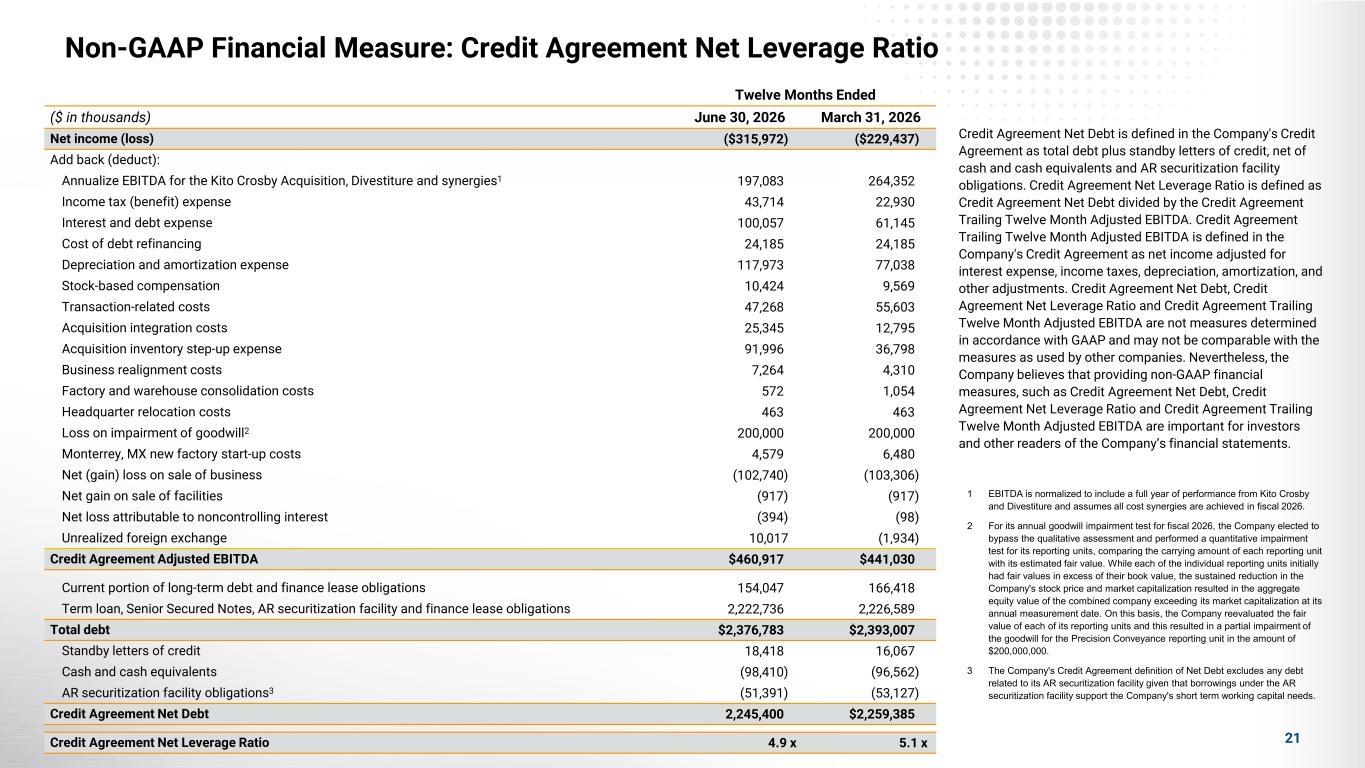
Non-GAAP Financial Measure: Credit Agreement Net Leverage Ratio Twelve Months Ended ($ in thousands) June 30, 2026 March 31, 2026 Net income (loss) ($315,972) ($229,437) Add back (deduct): Annualize EBITDA for the Kito Crosby Acquisition, Divestiture and synergies1 197,083 264,352 Income tax (benefit) expense 43,714 22,930 Interest and debt expense 100,057 61,145 Cost of debt refinancing 24,185 24,185 Depreciation and amortization expense 117,973 77,038 Stock-based compensation 10,424 9,569 Transaction-related costs 47,268 55,603 Acquisition integration costs 25,345 12,795 Acquisition inventory step-up expense 91,996 36,798 Business realignment costs 7,264 4,310 Factory and warehouse consolidation costs 572 1,054 Headquarter relocation costs 463 463 Loss on impairment of goodwill2 200,000 200,000 Monterrey, MX new factory start-up costs 4,579 6,480 Net (gain) loss on sale of business (102,740) (103,306) Net gain on sale of facilities (917) (917) Net loss attributable to noncontrolling interest (394) (98) Unrealized foreign exchange 10,017 (1,934) Credit Agreement Adjusted EBITDA $460,917 $441,030 Current portion of long-term debt and finance lease obligations 154,047 166,418 Term loan, Senior Secured Notes, AR securitization facility and finance lease obligations 2,222,736 2,226,589 Total debt $2,376,783 $2,393,007 Standby letters of credit 18,418 16,067 Cash and cash equivalents (98,410) (96,562) AR securitization facility obligations3 (51,391) (53,127) Credit Agreement Net Debt 2,245,400 $2,259,385 Credit Agreement Net Leverage Ratio 4.9 x 5.1 x Credit Agreement Net Debt is defined in the Company's Credit Agreement as total debt plus standby letters of credit, net of cash and cash equivalents and AR securitization facility obligations. Credit Agreement Net Leverage Ratio is defined as Credit Agreement Net Debt divided by the Credit Agreement Trailing Twelve Month Adjusted EBITDA. Credit Agreement Trailing Twelve Month Adjusted EBITDA is defined in the Company's Credit Agreement as net income adjusted for interest expense, income taxes, depreciation, amortization, and other adjustments. Credit Agreement Net Debt, Credit Agreement Net Leverage Ratio and Credit Agreement Trailing Twelve Month Adjusted EBITDA are not measures determined in accordance with GAAP and may not be comparable with the measures as used by other companies. Nevertheless, the Company believes that providing non-GAAP financial measures, such as Credit Agreement Net Debt, Credit Agreement Net Leverage Ratio and Credit Agreement Trailing Twelve Month Adjusted EBITDA are important for investors and other readers of the Company’s financial statements. 21 1 EBITDA is normalized to include a full year of performance from Kito Crosby and Divestiture and assumes all cost synergies are achieved in fiscal 2026. 2 For its annual goodwill impairment test for fiscal 2026, the Company elected to bypass the qualitative assessment and performed a quantitative impairment test for its reporting units, comparing the carrying amount of each reporting unit with its estimated fair value. While each of the individual reporting units initially had fair values in excess of their book value, the sustained reduction in the Company's stock price and market capitalization resulted in the aggregate equity value of the combined company exceeding its market capitalization at its annual measurement date. On this basis, the Company reevaluated the fair value of each of its reporting units and this resulted in a partial impairment of the goodwill for the Precision Conveyance reporting unit in the amount of $200,000,000. 3 The Company's Credit Agreement definition of Net Debt excludes any debt related to its AR securitization facility given that borrowings under the AR securitization facility support the Company's short term working capital needs.