Not for Product Promotional Use Q2 2026 Results July 30, 2026
Not for Product Promotional UseQ2 2026 Results Forward Looking Statements and Non-GAAP Financial Information 2 This presentation (as well as the oral statements made with respect to information contained herein) contains statements about Bristol-Myers Squibb Company’s (the “Company”) future financial results, plans, business development strategy, anticipated clinical trials, results and regulatory approvals that constitute forward-looking statements for purposes of the safe harbor provisions under the Private Securities Litigation Reform Act of 1995. All statements that are not statements of historical facts are, or may be deemed to be, forward-looking statements. Actual results may differ materially from those expressed in, or implied by, these statements as a result of various factors, including, but not limited to: (i) new laws, government actions, agreements and regulations, including with respect to pricing controls and market access and the imposition of new tariffs, trade restrictions and export regulations, including the potential for international reference pricing and most-favored nation drug pricing for our products, (ii) our ability to obtain, protect and maintain market exclusivity rights and enforce patents and other intellectual property rights, (iii) our ability to achieve expected clinical, regulatory and contractual milestones on expected timelines or at all, (iv) difficulties or delays in the development and commercialization of new products, (v) difficulties or delays in our clinical trials and the manufacturing, distribution and sale of our products, (vi) adverse outcomes in legal or regulatory proceedings, (vii) risks relating to acquisitions, divestitures, alliances, joint ventures and other portfolio actions and (viii) political and financial instability, including changes in general economic conditions, and (viii) risks related to the use of artificial intelligence or other emerging technologies in various facets of the company's operations, including partnerships related to the use of, or the sharing of such technologies with third parties, which may exacerbate competitive, regulatory, litigation, cybersecurity, and other risk. These and other important factors are discussed in the Company’s most recent annual report on Form 10-K and reports on Forms 10-Q and 8-K. These documents are available on the U.S. Securities and Exchange Commission’s website, on the Company’s website or from Bristol- Myers Squibb Investor Relations. No forward-looking statements can be guaranteed. In addition, any forward-looking statements and clinical data included herein are presented only as of the date hereof. Except as otherwise required by applicable law, the Company undertakes no obligation to publicly update any of the provided information, whether as a result of new information, future events, changed circumstances or otherwise. This presentation includes certain non-generally accepted accounting principles (“GAAP”) financial measures that we use to describe the Company’s performance. The non-GAAP financial measures are provided as supplemental information and are presented because management has evaluated the Company’s financial results both including and excluding the adjusted items or the effects of foreign currency translation, as applicable, and believes that the non-GAAP financial measures presented portray the results of the Company’s baseline performance, supplement or enhance management’s, analysts’ and investors’ overall understanding of the Company’s underlying financial performance and trends and facilitate comparisons among current, past and future periods. This presentation also provides certain revenues and expenses excluding the impact of foreign exchange (“Ex-FX”). We calculate foreign exchange impacts by converting our current-period local currency financial results using the prior period average currency rates and comparing these adjusted amounts to our current- period results. Ex-FX financial measures are not accounted for according to GAAP because they remove the effects of currency movements from GAAP results. The non-GAAP information presented herein provides investors with additional useful information but should not be considered in isolation or as substitutes for the related GAAP measures. Moreover, other companies may define non-GAAP measures differently, which limits the usefulness of these measures for comparisons with such other companies. We encourage investors to review our financial statements and publicly filed reports in their entirety and not to rely on any single financial measure. An explanation of these non-GAAP financial measures and a reconciliation to the most directly comparable financial measure are available on our website at www.bms.com/investors. Also note that a reconciliation of forward-looking non-GAAP measures, including non-GAAP earnings per share (EPS), to the most directly comparable GAAP measures is not provided because comparable GAAP measures for such measures are not reasonably accessible or reliable due to the inherent difficulty in forecasting and quantifying measures that would be necessary for such reconciliation. Namely, we are not, without unreasonable effort, able to reliably predict the impact of accelerated depreciation and impairment charges, legal and other settlements, gains and losses from equity investments and other adjustments. In addition, the Company believes such a reconciliation would imply a degree of precision and certainty that could be confusing to investors. These items are uncertain, depend on various factors and may have a material impact on our future GAAP results. Certain information presented in the accompanying presentation may not add due to the use of rounded numbers.
3 Q2 2026 Results Chris Boerner, PhD Board Chair and Chief Executive Officer
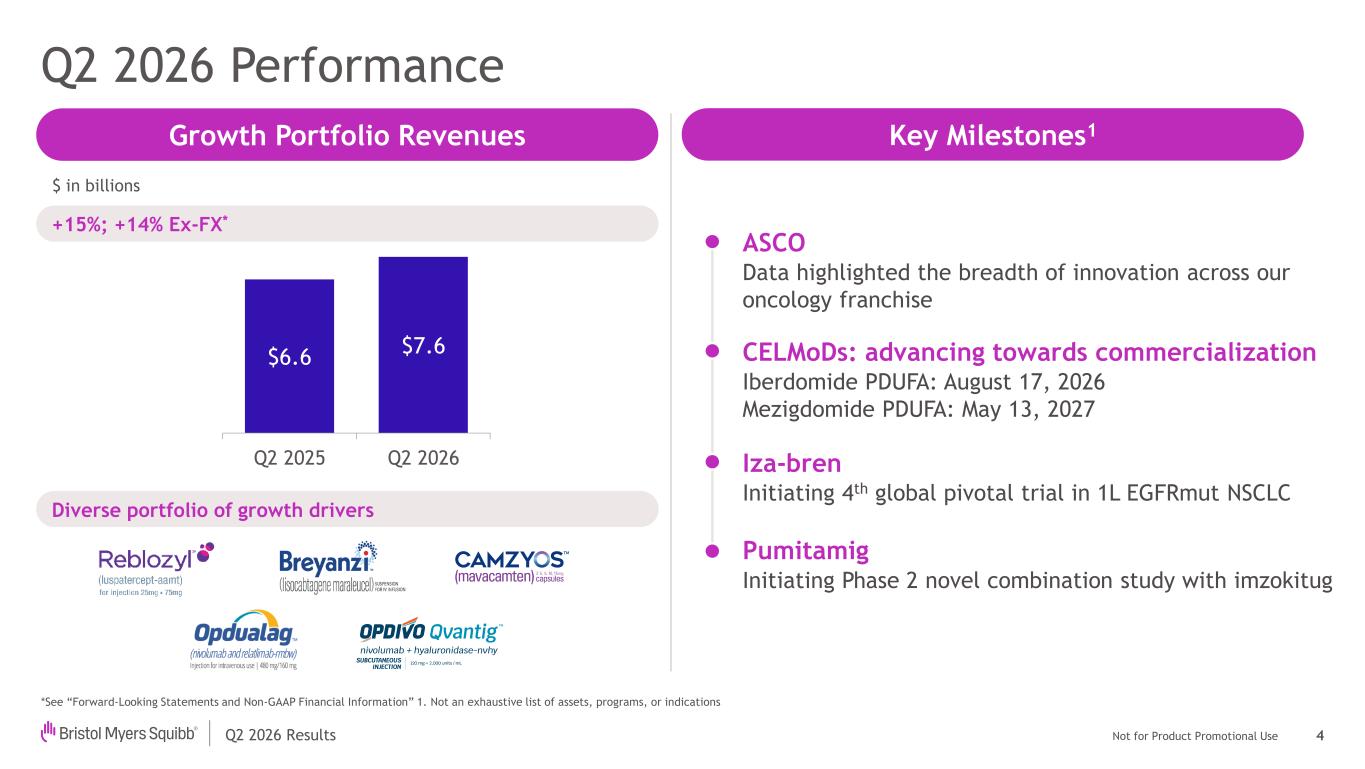
Not for Product Promotional UseQ2 2026 Results Q2 2026 Performance *See “Forward-Looking Statements and Non-GAAP Financial Information” 1. Not an exhaustive list of assets, programs, or indications $6.6 $7.6 Q2 2025 Q2 2026 $ in billions 4 Growth Portfolio Revenues Key Milestones1 +15%; +14% Ex-FX* Diverse portfolio of growth drivers ASCO Data highlighted the breadth of innovation across our oncology franchise CELMoDs: advancing towards commercialization Iberdomide PDUFA: August 17, 2026 Mezigdomide PDUFA: May 13, 2027 Iza-bren Initiating 4th global pivotal trial in 1L EGFRmut NSCLC Pumitamig Initiating Phase 2 novel combination study with imzokitug
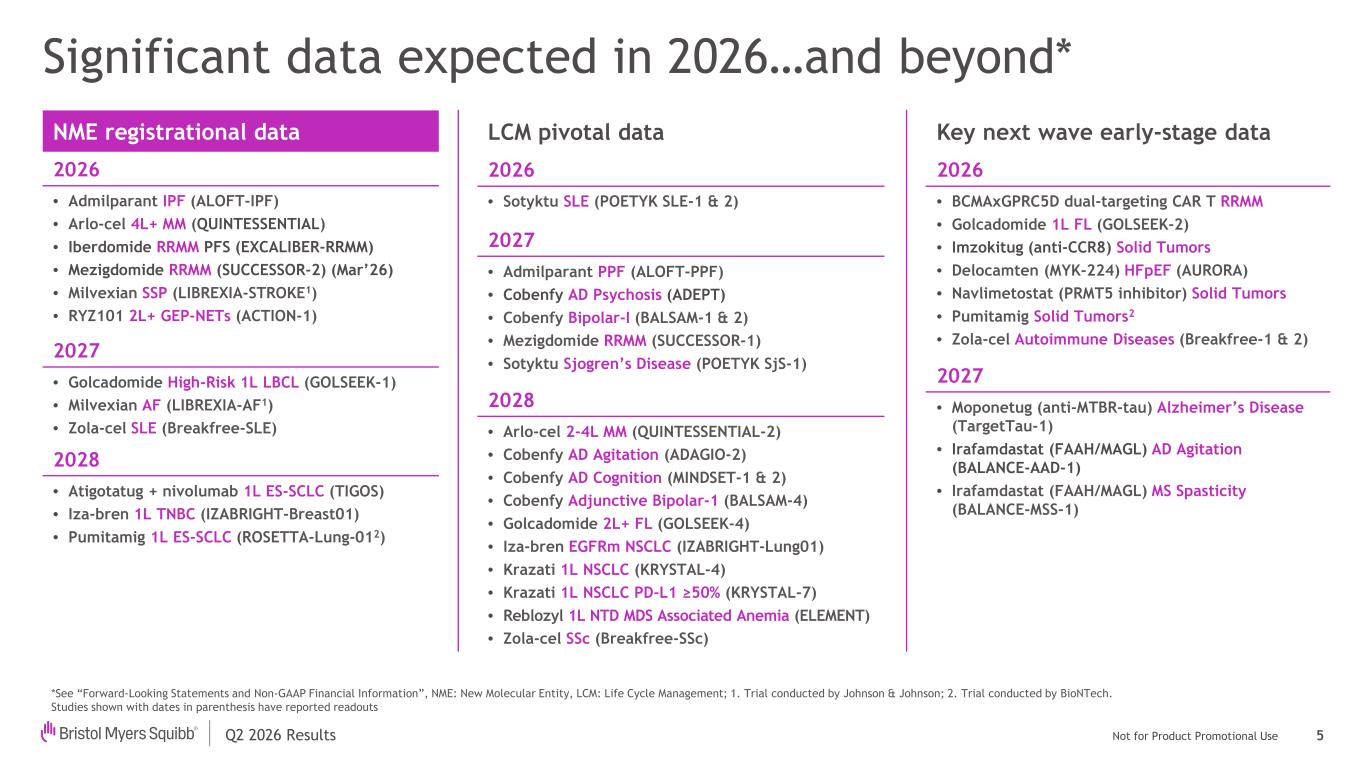
Q2 2026 Results Not for Product Promotional Use Significant data expected in 2026…and beyond* NME registrational data 2026 • Admilparant IPF (ALOFT-IPF) • Arlo-cel 4L+ MM (QUINTESSENTIAL) • Iberdomide RRMM PFS (EXCALIBER-RRMM) • Mezigdomide RRMM (SUCCESSOR-2) (Mar’26) • Milvexian SSP (LIBREXIA-STROKE1) • RYZ101 2L+ GEP-NETs (ACTION-1) 2027 • Golcadomide High-Risk 1L LBCL (GOLSEEK-1) • Milvexian AF (LIBREXIA-AF1) • Zola-cel SLE (Breakfree-SLE) 2028 • Atigotatug + nivolumab 1L ES-SCLC (TIGOS) • Iza-bren 1L TNBC (IZABRIGHT-Breast01) • Pumitamig 1L ES-SCLC (ROSETTA-Lung-012) LCM pivotal data 2026 • Sotyktu SLE (POETYK SLE-1 & 2) 2027 • Admilparant PPF (ALOFT-PPF) • Cobenfy AD Psychosis (ADEPT) • Cobenfy Bipolar-I (BALSAM-1 & 2) • Mezigdomide RRMM (SUCCESSOR-1) • Sotyktu Sjogren’s Disease (POETYK SjS-1) 2028 • Arlo-cel 2-4L MM (QUINTESSENTIAL-2) • Cobenfy AD Agitation (ADAGIO-2) • Cobenfy AD Cognition (MINDSET-1 & 2) • Cobenfy Adjunctive Bipolar-1 (BALSAM-4) • Golcadomide 2L+ FL (GOLSEEK-4) • Iza-bren EGFRm NSCLC (IZABRIGHT-Lung01) • Krazati 1L NSCLC (KRYSTAL-4) • Krazati 1L NSCLC PD-L1 ≥50% (KRYSTAL-7) • Reblozyl 1L NTD MDS Associated Anemia (ELEMENT) • Zola-cel SSc (Breakfree-SSc) Key next wave early-stage data 2026 • BCMAxGPRC5D dual-targeting CAR T RRMM • Golcadomide 1L FL (GOLSEEK-2) • Imzokitug (anti-CCR8) Solid Tumors • Delocamten (MYK-224) HFpEF (AURORA) • Navlimetostat (PRMT5 inhibitor) Solid Tumors • Pumitamig Solid Tumors2 • Zola-cel Autoimmune Diseases (Breakfree-1 & 2) 2027 • Moponetug (anti-MTBR-tau) Alzheimer’s Disease (TargetTau-1) • Irafamdastat (FAAH/MAGL) AD Agitation (BALANCE-AAD-1) • Irafamdastat (FAAH/MAGL) MS Spasticity (BALANCE-MSS-1) *See “Forward-Looking Statements and Non-GAAP Financial Information”, NME: New Molecular Entity, LCM: Life Cycle Management; 1. Trial conducted by Johnson & Johnson; 2. Trial conducted by BioNTech. Studies shown with dates in parenthesis have reported readouts 5
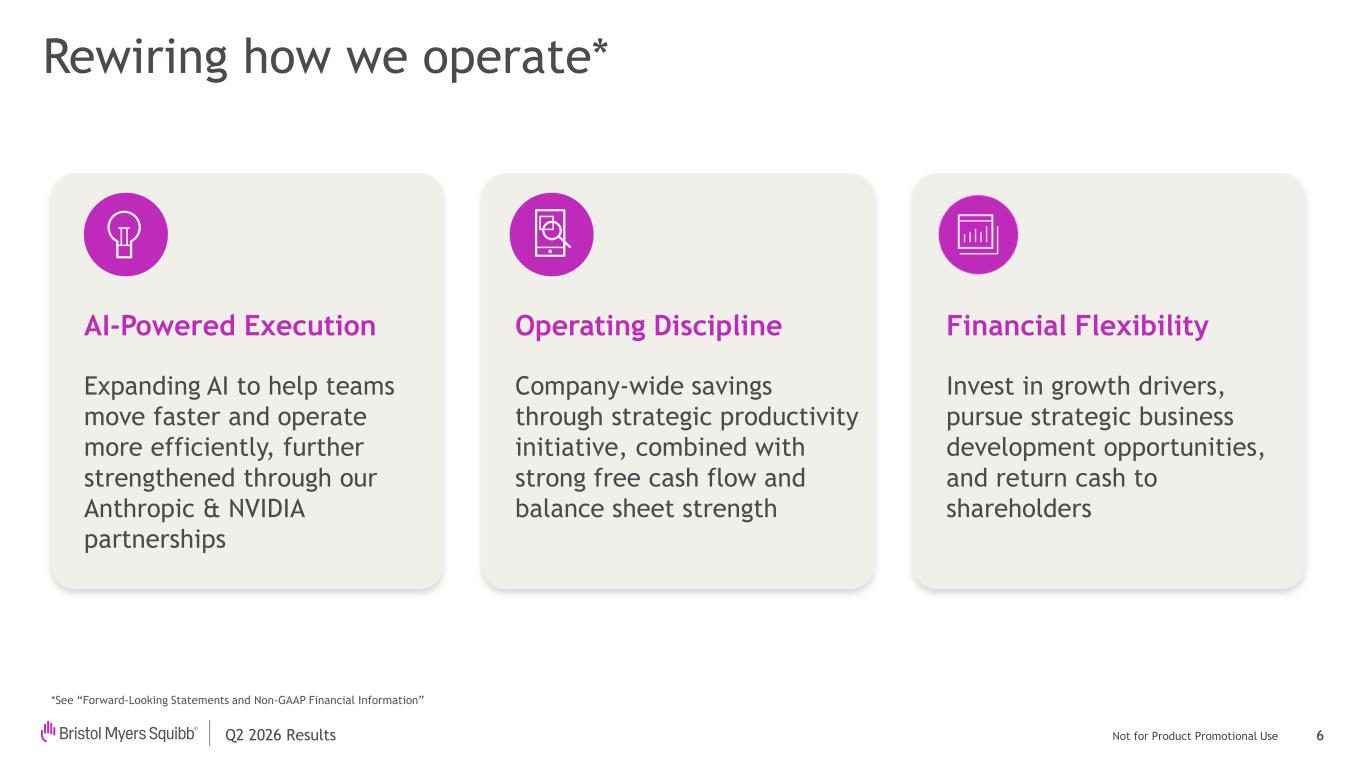
Q2 2026 Results Not for Product Promotional Use Rewiring how we operate* AI-Powered Execution Expanding AI to help teams move faster and operate more efficiently, further strengthened through our Anthropic & NVIDIA partnerships Operating Discipline Company-wide savings through strategic productivity initiative, combined with strong free cash flow and balance sheet strength Financial Flexibility Invest in growth drivers, pursue strategic business development opportunities, and return cash to shareholders 6 *See “Forward-Looking Statements and Non-GAAP Financial Information”
7 Q2 2026 Results David Elkins Executive Vice President and Chief Financial Officer
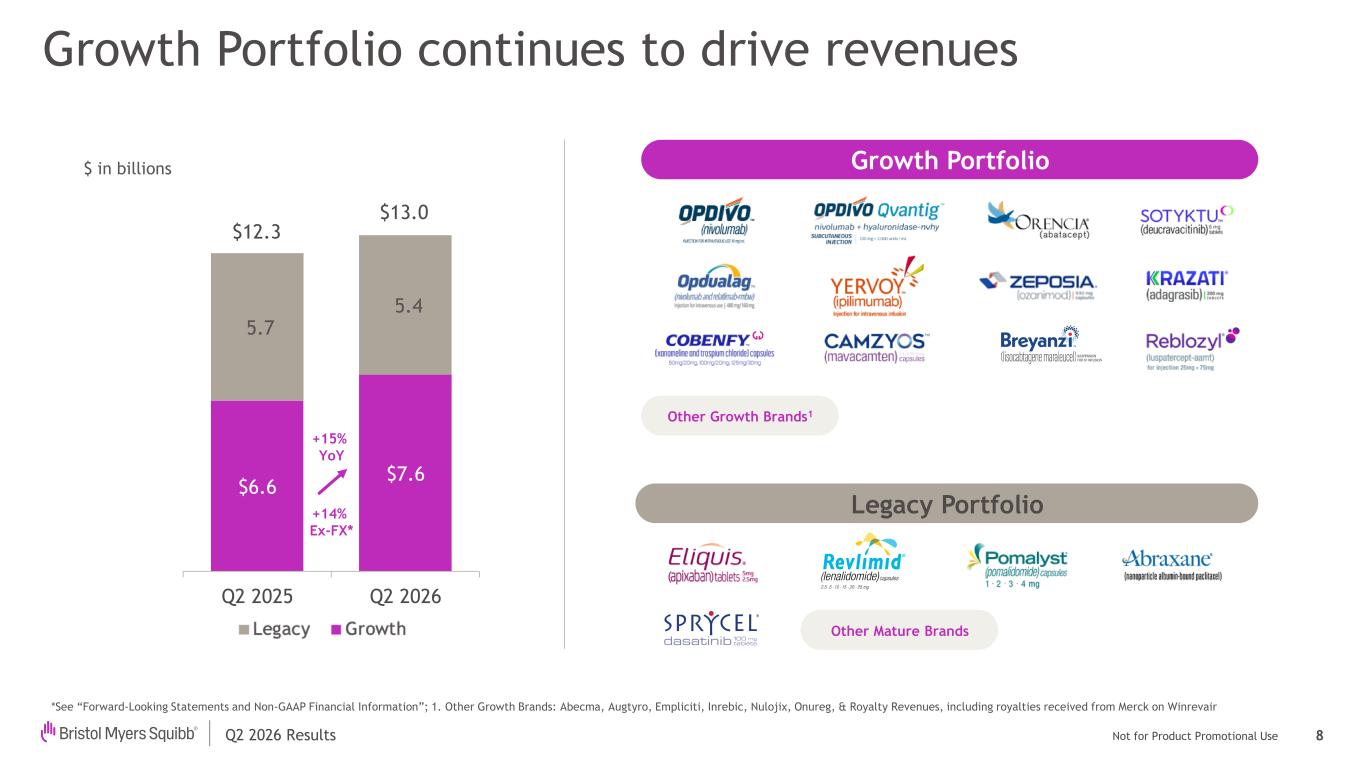
Q2 2026 Results Not for Product Promotional Use $ in billions Growth Portfolio continues to drive revenues Other Growth Brands1 Growth Portfolio Legacy Portfolio Other Mature Brands $6.6 $7.6 5.7 5.4 Q2 2025 Q2 2026 $12.3 $13.0 +15% YoY +14% Ex-FX* 8 *See “Forward-Looking Statements and Non-GAAP Financial Information”; 1. Other Growth Brands: Abecma, Augtyro, Empliciti, Inrebic, Nulojix, Onureg, & Royalty Revenues, including royalties received from Merck on Winrevair
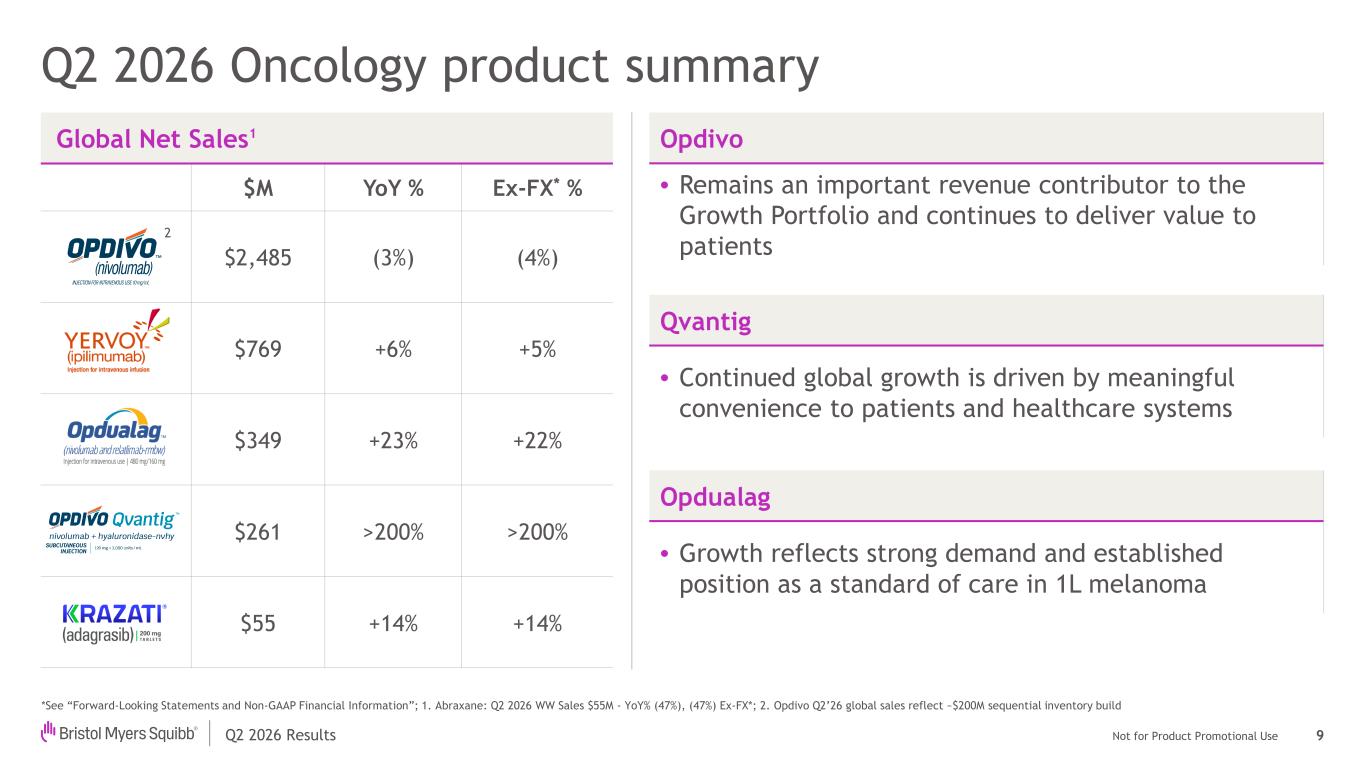
Not for Product Promotional UseQ2 2026 Results Q2 2026 Oncology product summary *See “Forward-Looking Statements and Non-GAAP Financial Information”; 1. Abraxane: Q2 2026 WW Sales $55M - YoY% (47%), (47%) Ex-FX*; 2. Opdivo Q2’26 global sales reflect ~$200M sequential inventory build Global Net Sales1 $M YoY % Ex-FX* % $2,485 (3%) (4%) $769 +6% +5% $349 +23% +22% $261 >200% >200% $55 +14% +14% Opdivo • Remains an important revenue contributor to the Growth Portfolio and continues to deliver value to patients 9 Qvantig • Continued global growth is driven by meaningful convenience to patients and healthcare systems Opdualag • Growth reflects strong demand and established position as a standard of care in 1L melanoma 2
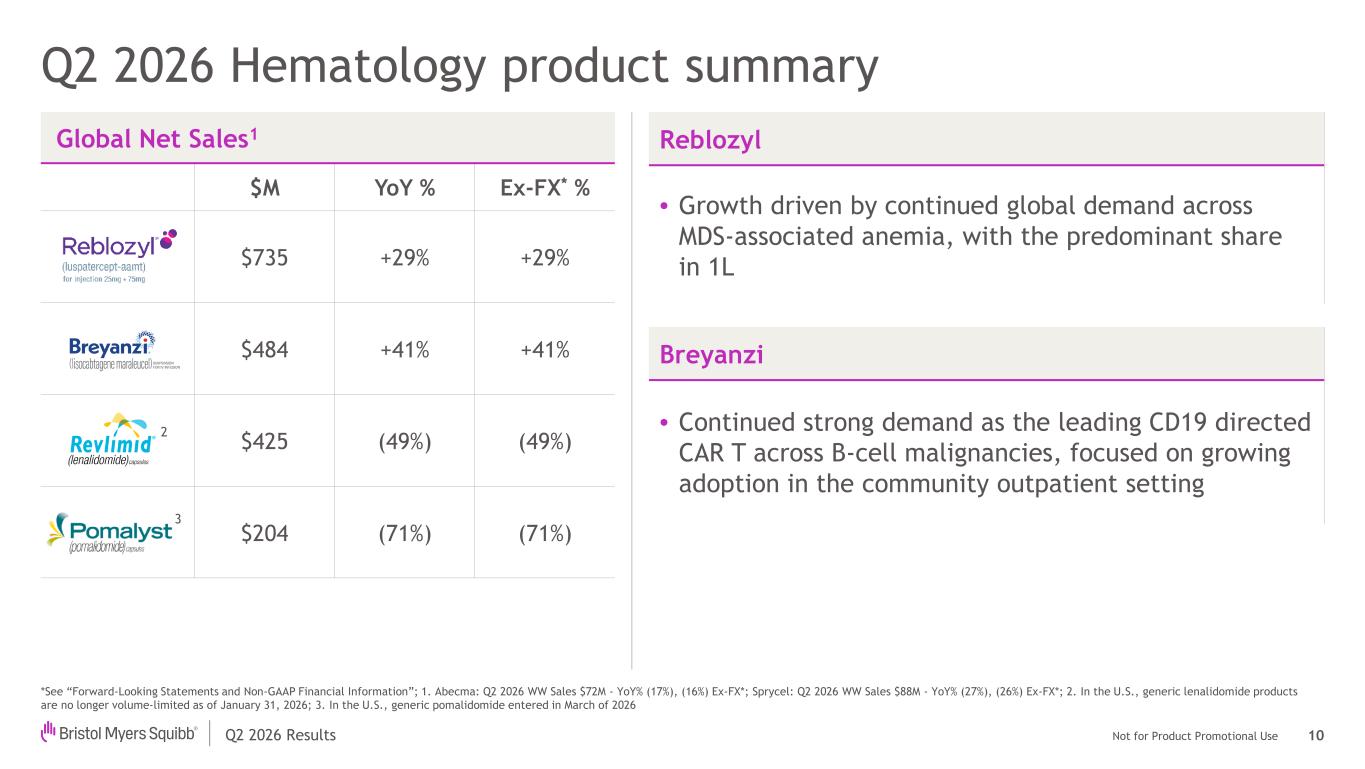
Not for Product Promotional UseQ2 2026 Results Global Net Sales1 $M YoY % Ex-FX* % $735 +29% +29% $484 +41% +41% $425 (49%) (49%) $204 (71%) (71%) Q2 2026 Hematology product summary *See “Forward-Looking Statements and Non-GAAP Financial Information”; 1. Abecma: Q2 2026 WW Sales $72M - YoY% (17%), (16%) Ex-FX*; Sprycel: Q2 2026 WW Sales $88M - YoY% (27%), (26%) Ex-FX*; 2. In the U.S., generic lenalidomide products are no longer volume-limited as of January 31, 2026; 3. In the U.S., generic pomalidomide entered in March of 2026 Reblozyl • Growth driven by continued global demand across MDS-associated anemia, with the predominant share in 1L 10 3 2 Breyanzi • Continued strong demand as the leading CD19 directed CAR T across B-cell malignancies, focused on growing adoption in the community outpatient setting
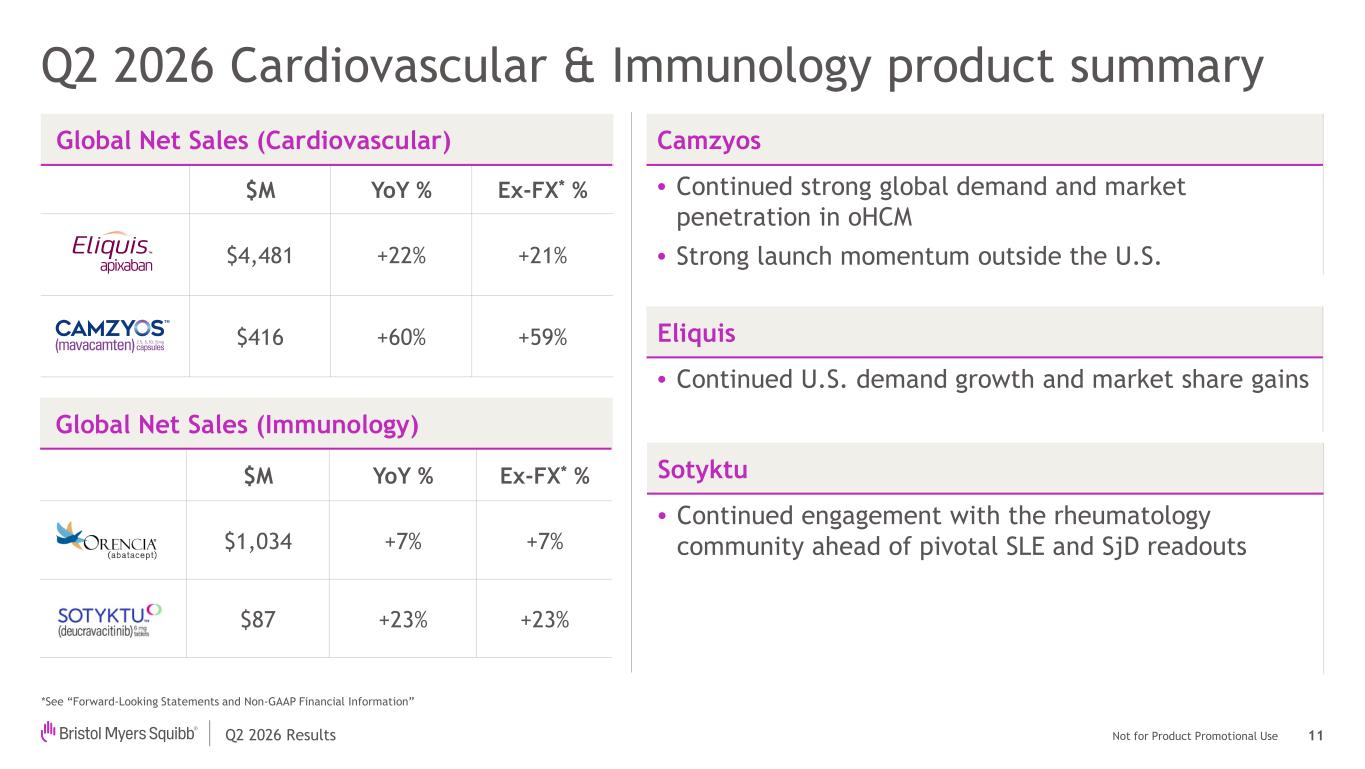
Not for Product Promotional UseQ2 2026 Results Q2 2026 Cardiovascular & Immunology product summary Global Net Sales (Cardiovascular) $M YoY % Ex-FX* % $4,481 +22% +21% $416 +60% +59% *See “Forward-Looking Statements and Non-GAAP Financial Information” Eliquis • Continued U.S. demand growth and market share gains Camzyos • Continued strong global demand and market penetration in oHCM • Strong launch momentum outside the U.S. 11 Global Net Sales (Immunology) $M YoY % Ex-FX* % $1,034 +7% +7% $87 +23% +23% Sotyktu • Continued engagement with the rheumatology community ahead of pivotal SLE and SjD readouts
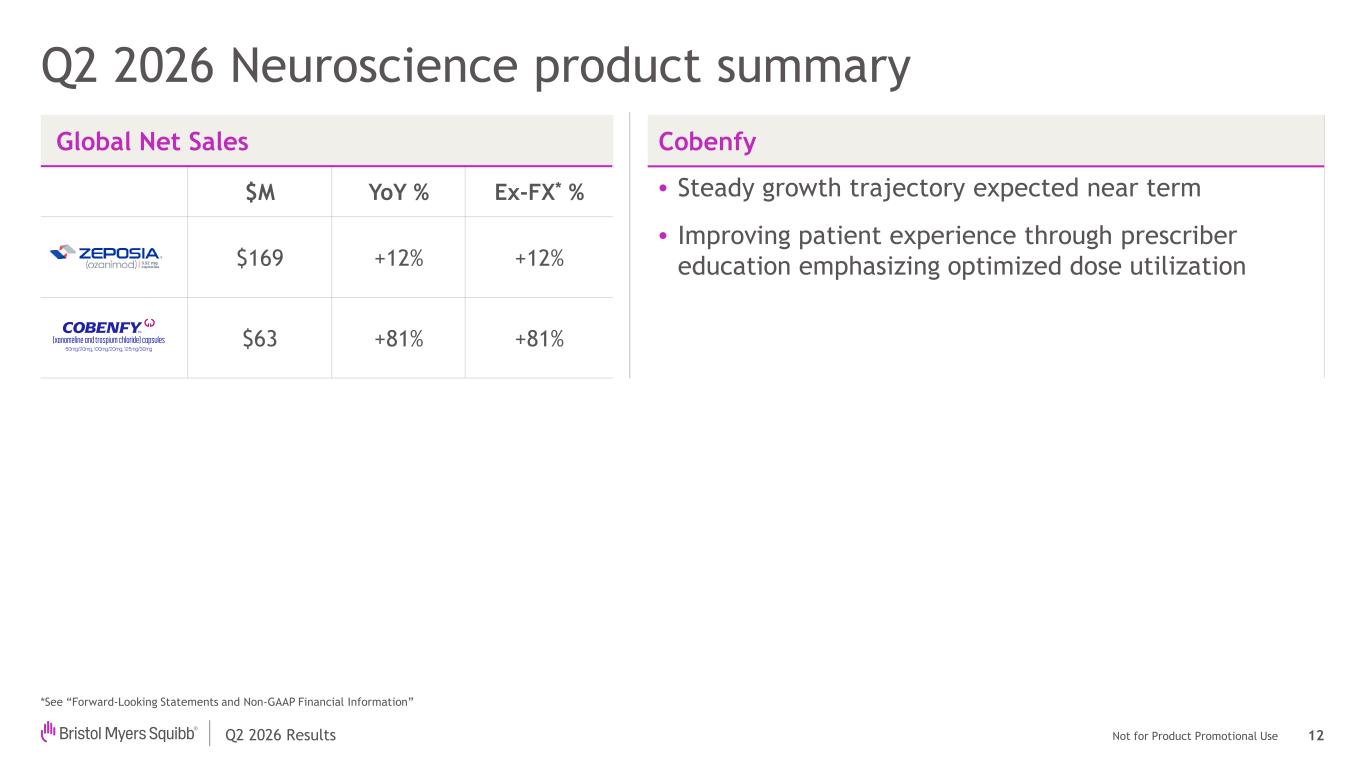
Not for Product Promotional UseQ2 2026 Results Q2 2026 Neuroscience product summary Global Net Sales $M YoY % Ex-FX* % $169 +12% +12% $63 +81% +81% Cobenfy • Steady growth trajectory expected near term • Improving patient experience through prescriber education emphasizing optimized dose utilization *See “Forward-Looking Statements and Non-GAAP Financial Information” 12
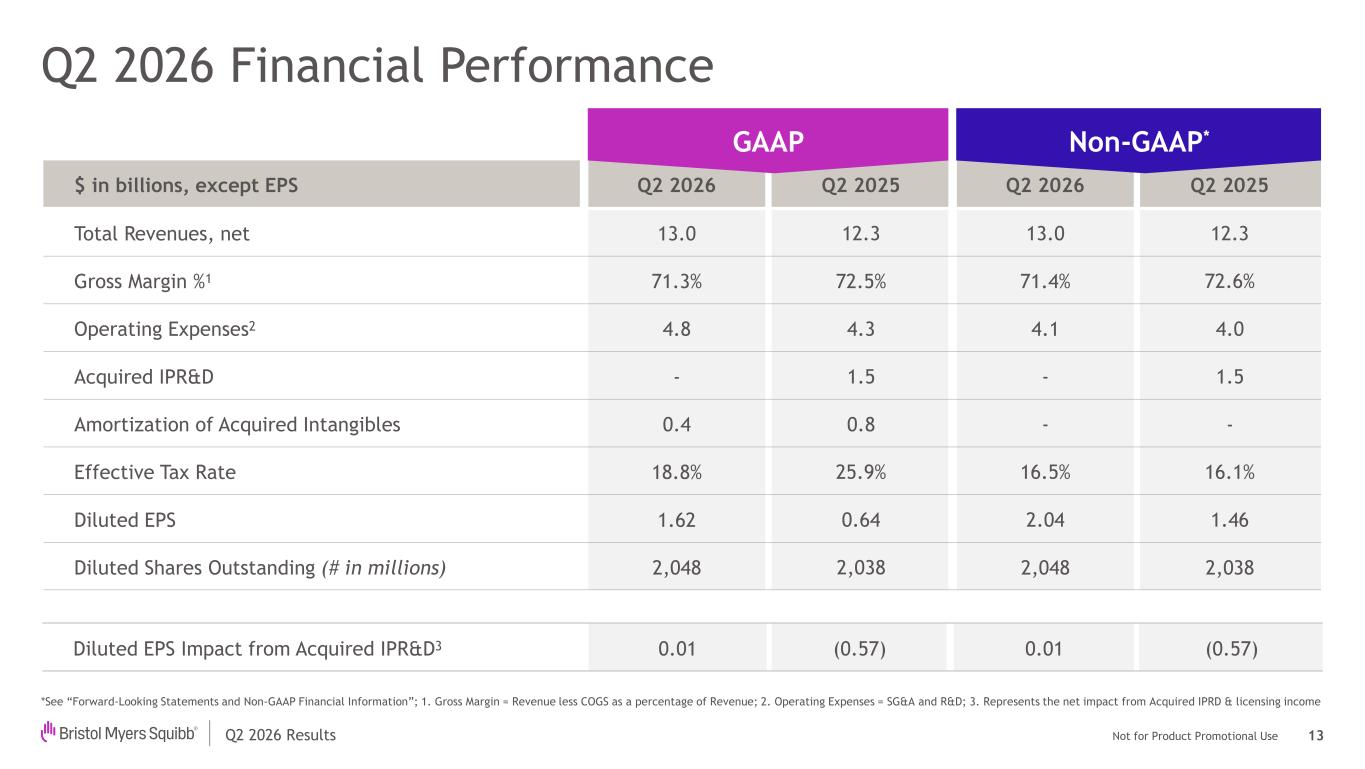
Not for Product Promotional UseQ2 2026 Results US GAAP Non-GAAP $ in billions, except EPS Q2 2026 Q2 2025 Q2 2026 Q2 2025 Total Revenues, net 13.0 12.3 13.0 12.3 Gross Margin %1 71.3% 72.5% 71.4% 72.6% Operating Expenses2 4.8 4.3 4.1 4.0 Acquired IPR&D - 1.5 - 1.5 Amortization of Acquired Intangibles 0.4 0.8 - - Effective Tax Rate 18.8% 25.9% 16.5% 16.1% Diluted EPS 1.62 0.64 2.04 1.46 Diluted Shares Outstanding (# in millions) 2,048 2,038 2,048 2,038 Q2 2026 Financial Performance GA P Non- P* Diluted EPS Impact from Acquired IPR&D3 0.01 (0.57) 0.01 (0.57) *See “Forward-Looking Statements and Non-GAAP Financial Information”; 1. Gross Margin = Revenue less COGS as a percentage of Revenue; 2. Operating Expenses = SG&A and R&D; 3. Represents the net impact from Acquired IPRD & licensing income 13
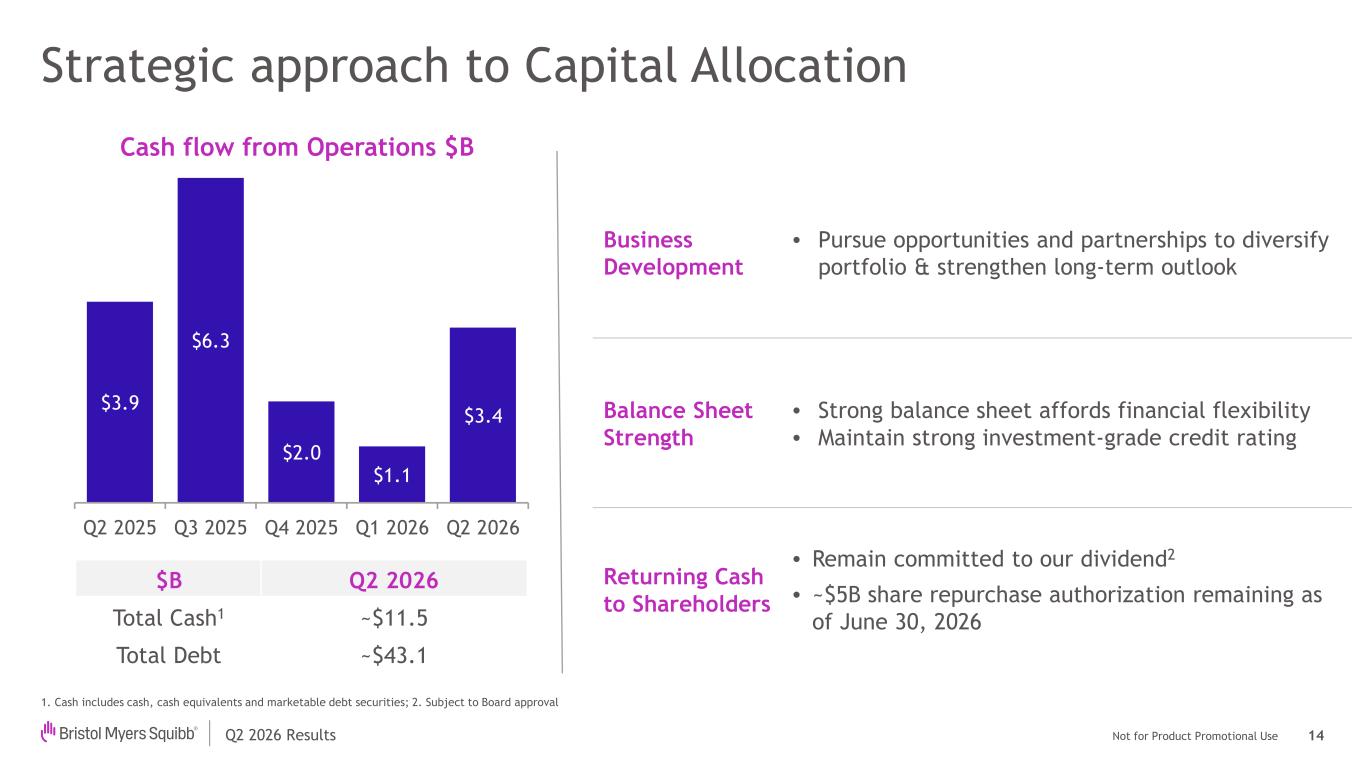
Not for Product Promotional UseQ2 2026 Results Strategic approach to Capital Allocation 1. Cash includes cash, cash equivalents and marketable debt securities; 2. Subject to Board approval Cash flow from Operations $B 14 $3.9 $6.3 $2.0 $1.1 $3.4 Q2 2025 Q3 2025 Q4 2025 Q1 2026 Q2 2026 $B Q2 2026 Total Cash1 ~$11.5 Total Debt ~$43.1 Business Development • Pursue opportunities and partnerships to diversify portfolio & strengthen long-term outlook Balance Sheet Strength • Strong balance sheet affords financial flexibility • Maintain strong investment-grade credit rating Returning Cash to Shareholders • Remain committed to our dividend2 • ~$5B share repurchase authorization remaining as of June 30, 2026
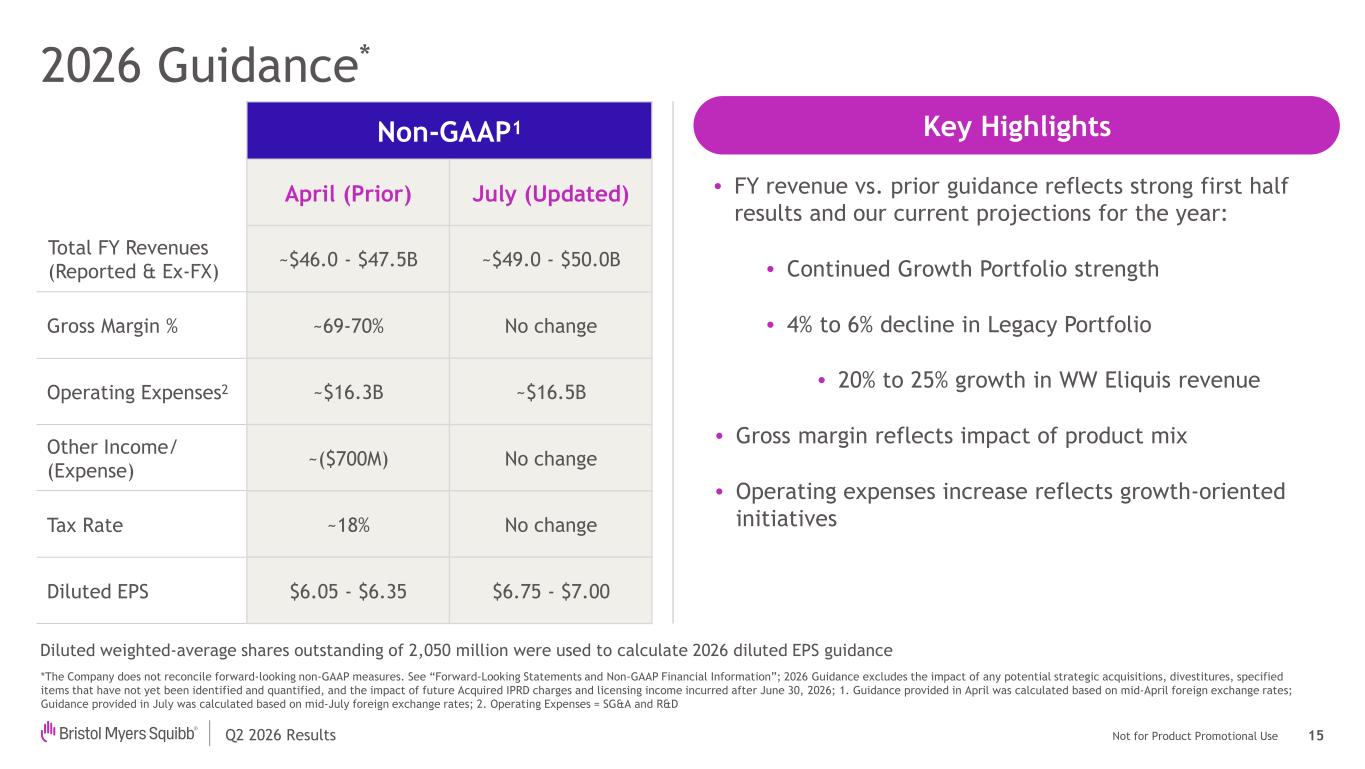
Not for Product Promotional UseQ2 2026 Results 2026 Guidance* 15 *The Company does not reconcile forward-looking non-GAAP measures. See “Forward-Looking Statements and Non-GAAP Financial Information”; 2026 Guidance excludes the impact of any potential strategic acquisitions, divestitures, specified items that have not yet been identified and quantified, and the impact of future Acquired IPRD charges and licensing income incurred after June 30, 2026; 1. Guidance provided in April was calculated based on mid-April foreign exchange rates; Guidance provided in July was calculated based on mid-July foreign exchange rates; 2. Operating Expenses = SG&A and R&D Non-GAAP1 April (Prior) July (Updated) Total FY Revenues (Reported & Ex-FX) ~$46.0 - $47.5B ~$49.0 - $50.0B Gross Margin % ~69-70% No change Operating Expenses2 ~$16.3B ~$16.5B Other Income/ (Expense) ~($700M) No change Tax Rate ~18% No change Diluted EPS $6.05 - $6.35 $6.75 - $7.00 • FY revenue vs. prior guidance reflects strong first half results and our current projections for the year: • Continued Growth Portfolio strength • 4% to 6% decline in Legacy Portfolio • 20% to 25% growth in WW Eliquis revenue • Gross margin reflects impact of product mix • Operating expenses increase reflects growth-oriented initiatives Diluted weighted-average shares outstanding of 2,050 million were used to calculate 2026 diluted EPS guidance Key Highlights
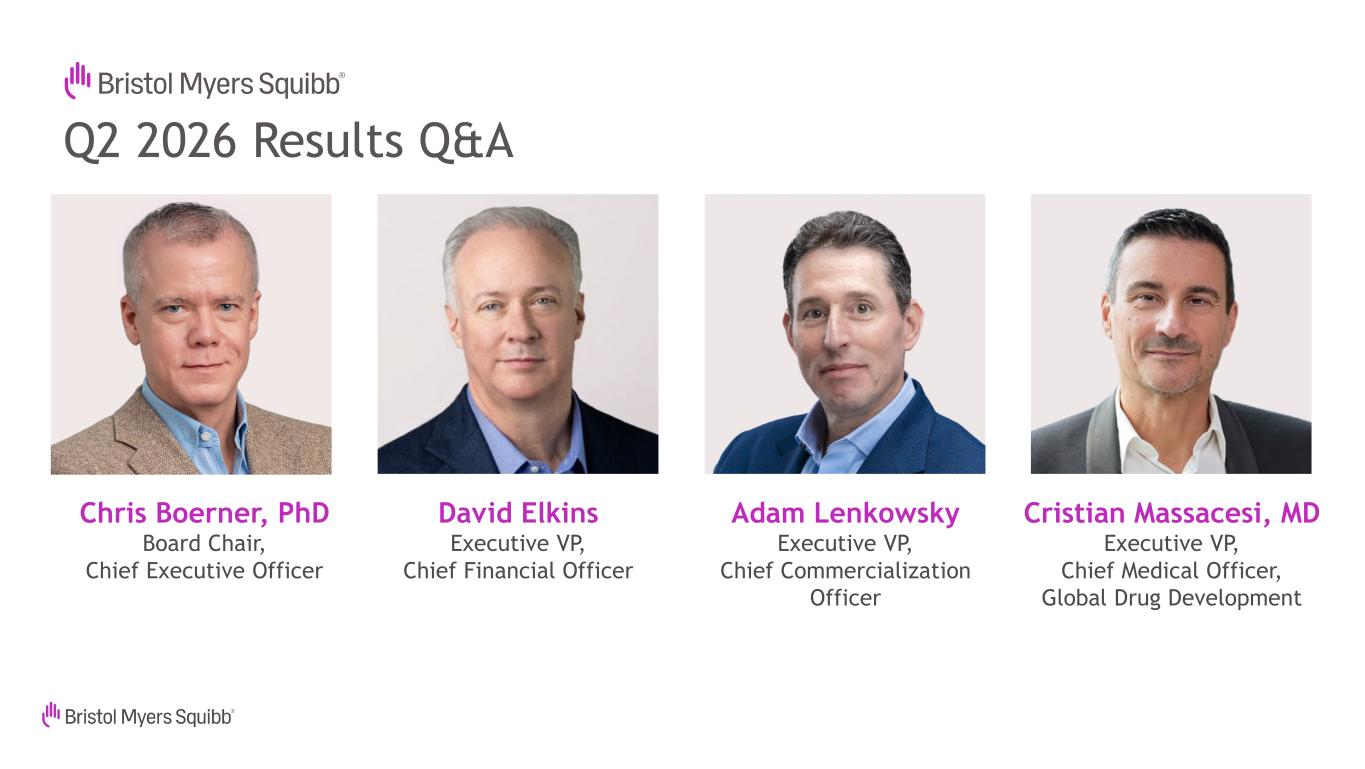
Chris Boerner, PhD Board Chair, Chief Executive Officer David Elkins Executive VP, Chief Financial Officer Adam Lenkowsky Executive VP, Chief Commercialization Officer Cristian Massacesi, MD Executive VP, Chief Medical Officer, Global Drug Development Q2 2026 Results Q&A