Shareholder Report
May 31, 2026
USD ($)
Holding
What were the Fund’s costs for the last year ?
(based on a hypothetical $10,000 investment)
| Share Class | Costs of a $10,000 investment | Costs paid as a percentage of a $10,000 investment |
| Class A* | $106 | 0.95% |
| * |
During the period, fees were waived and/or expenses reimbursed pursuant to an agreement with the Fund’s investment adviser, BNY Mellon Investment Adviser, Inc. If this agreement is not extended in the future, expenses could be higher. |
How did the Fund perform last year ?
-
For the 12-month period ended May 31, 2026, the Fund’s Class A shares returned 22.69%.
-
In comparison, the S&P 500® Index (the “Index”) returned 29.77% for the same period.
What affected the Fund’s performance?
-
U.S. stocks gained as inflation eased, interest rate expectations stabilized, economic growth remained resilient, and earnings growth—particularly in technology—supported market returns.
-
Stock selection in communication services and financials, alongside overweight exposure to consumer discretionary, were the strongest positive contributors to the Fund’s relative performance.
-
Stock selection within the strong information technology sector, combined with weak stock selection in health care and industrials, detracted most from relative performance.
How did the Fund perform over the past 10 years?
The Fund’s past performance is not a good predictor of the Fund’s future performance. The graph and table do not reflect the deduction of taxes that a shareholder would pay on fund distributions or redemption of fund shares.
Cumulative Performance from June 1 , 2016 through May 31, 2026
Initial Investment of $10,000
Initial Investment of $10,000
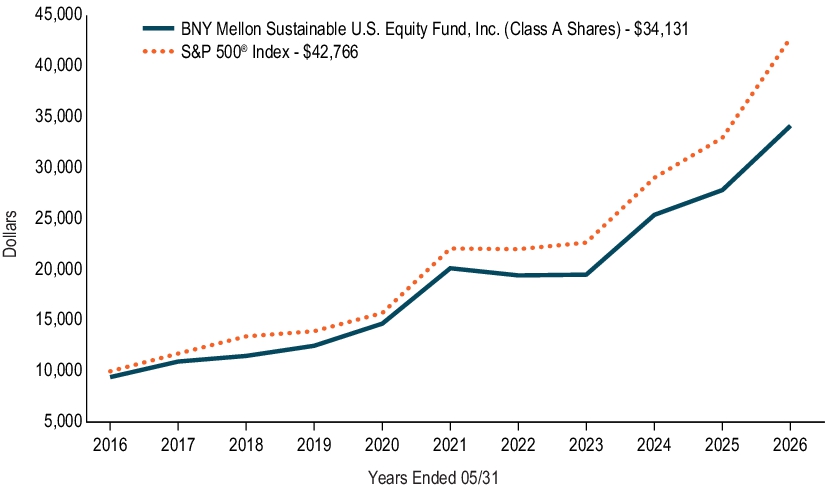
The above graph compares a hypothetical $10,000 investment in the Fund’s Class A shares to a hypothetical investment of $10,000 made in the S&P 500® Index on 5/31/2016. The performance shown takes into account the maximum initial sales charge on Class A shares and applicable fees and expenses of the Fund, including management fees and other expenses. The Fund’s performance also assumes the reinvestment of dividends and capital gains. Unlike the Fund, the Index is not subject to charges, fees and other expenses. Investors cannot invest directly in any index.
AVERAGE ANNUAL TOTAL RETURNS (AS OF 5/31/26 )
| Class A Shares | 1YR | 5YR | 10YR | |||
| with Maximum Sales Charge - 5.75% | 15.66% | 9.82% | 13.06% | |||
| without Sales Charge | 22.69% | 11.14% | 13.73% | |||
| S&P 500® Index | 29.77% | 14.14% | 15.64% |
KEY FUND STATISTICS (AS OF 5/31/26 )
Fund Size (Millions) |
Number of Holdings |
Total Advisory Fee Paid During Period |
Annual Portfolio Turnover |
| $518 | 50 | $2,969,499 | 31.79% |
Portfolio Holdings (as of 5/31/26 )
Top Ten Holdings (Based on Net Assets) *
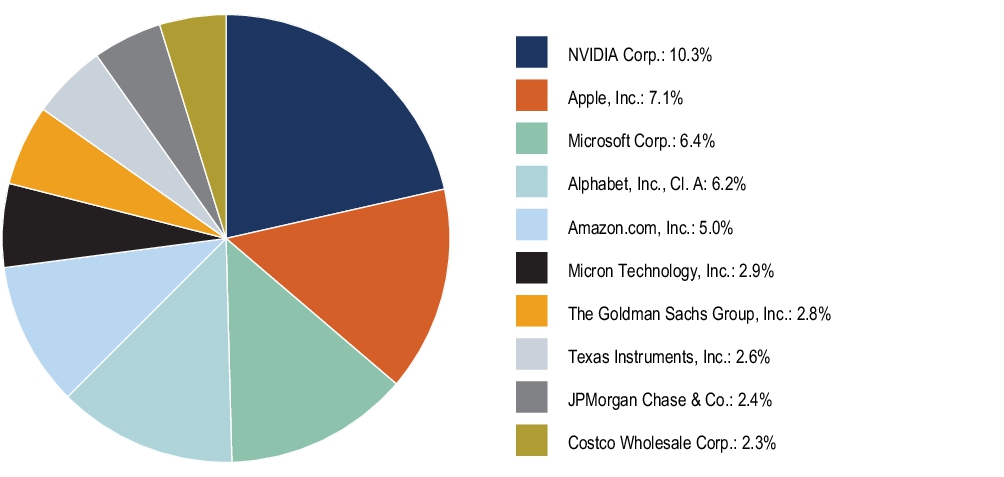
* Excludes money market funds or other short-term securities held for the investment of cash and cash collateral for securities loaned, if any.
Sector Allocation (Based on Net Assets)
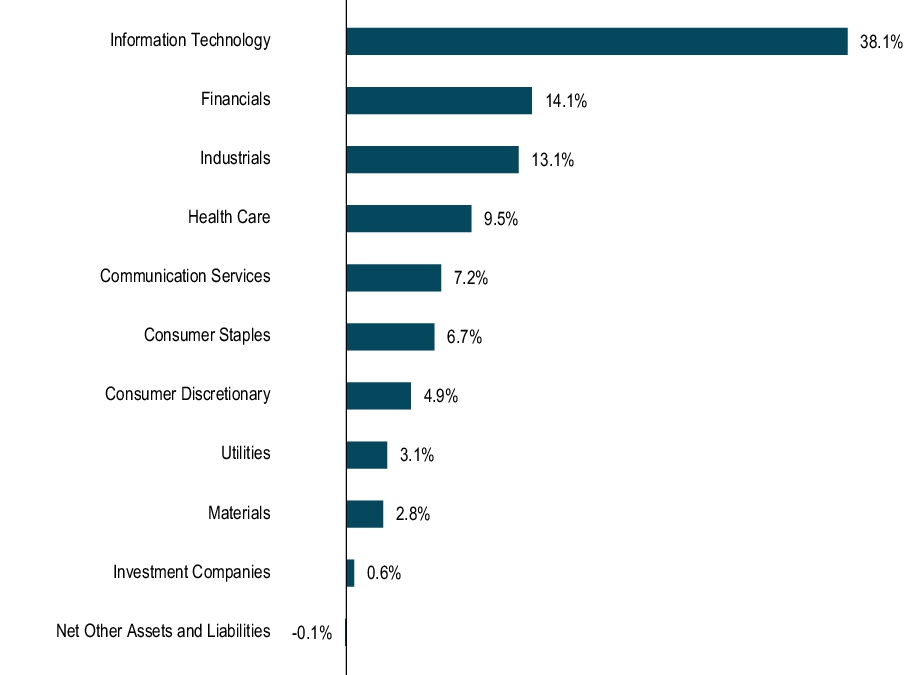
Top Ten Holdings (Based on Net Assets) *
* Excludes money market funds or other short-term securities held for the investment of cash and cash collateral for securities loaned, if any.
What were the Fund’s costs for the last year ?
(based on a hypothetical $10,000 investment)
| Share Class | Costs of a $10,000 investment | Costs paid as a percentage of a $10,000 investment |
| Class C* | $189 | 1.70% |
| * |
During the period, fees were waived and/or expenses reimbursed pursuant to an agreement with the Fund’s investment adviser, BNY Mellon Investment Adviser, Inc. If this agreement is not extended in the future, expenses could be higher. |
How did the Fund perform last year ?
-
For the 12-month period ended May 31, 2026, the Fund’s Class C shares returned 21.79%.
-
In comparison, the S&P 500® Index (the “Index”) returned 29.77% for the same period.
What affected the Fund’s performance?
-
U.S. stocks gained as inflation eased, interest rate expectations stabilized, economic growth remained resilient, and earnings growth—particularly in technology—supported market returns.
-
Stock selection in communication services and financials, alongside overweight exposure to consumer discretionary, were the strongest positive contributors to the Fund’s relative performance.
-
Stock selection within the strong information technology sector, combined with weak stock selection in health care and industrials, detracted most from relative performance.
How did the Fund perform over the past 10 years?
The Fund’s past performance is not a good predictor of the Fund’s future performance. The graph and table do not reflect the deduction of taxes that a shareholder would pay on fund distributions or redemption of fund shares.
Cumulative Performance from June 1 , 2016 through May 31, 2026
Initial Investment of $10,000
Initial Investment of $10,000
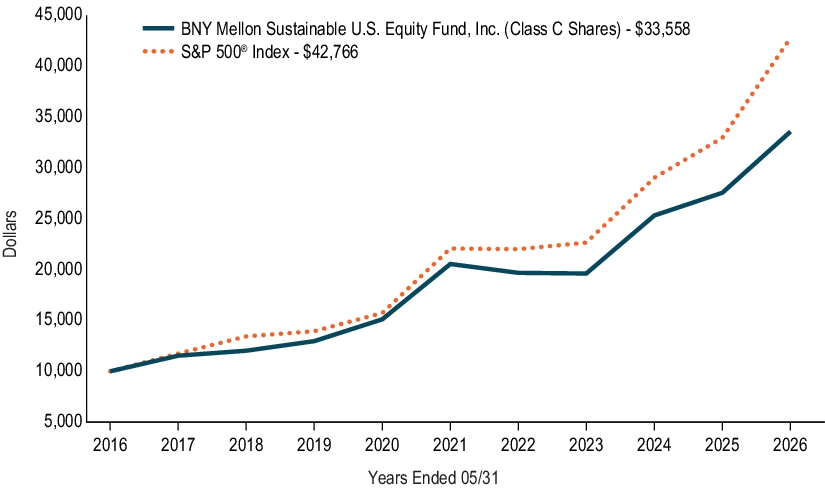
The above graph compares a hypothetical $10,000 investment in the Fund’s Class C shares to a hypothetical investment of $10,000 made in the S&P 500® Index on 5/31/2016. The performance shown takes into account the maximum deferred sales charge on Class C shares and applicable fees and expenses of the Fund, including management fees, 12b-1 fees and other expenses. The Fund’s performance also assumes the reinvestment of dividends and capital gains. Unlike the Fund, the Index is not subject to charges, fees and other expenses. Investors cannot invest directly in any index.
AVERAGE ANNUAL TOTAL RETURNS (AS OF 5/31/26 )
| Class C Shares | 1YR | 5YR | 10YR | |||
| with Maximum Deferred Sales Charge - 1.00% | 20.79% |
* |
10.31% | 12.87% | ||
| without Deferred Sales Charge | 21.79% | 10.31% | 12.87% | |||
| S&P 500® Index | 29.77% | 14.14% | 15.64% |
|
* |
The maximum contingent deferred sales charge for Class C shares is 1.00% for shares redeemed within one year of the date purchased. |
KEY FUND STATISTICS (AS OF 5/31/26 )
Fund Size (Millions) |
Number of Holdings |
Total Advisory Fee Paid During Period |
Annual Portfolio Turnover |
| $518 | 50 | $2,969,499 | 31.79% |
Portfolio Holdings (as of 5/31/26 )
Top Ten Holdings (Based on Net Assets) *
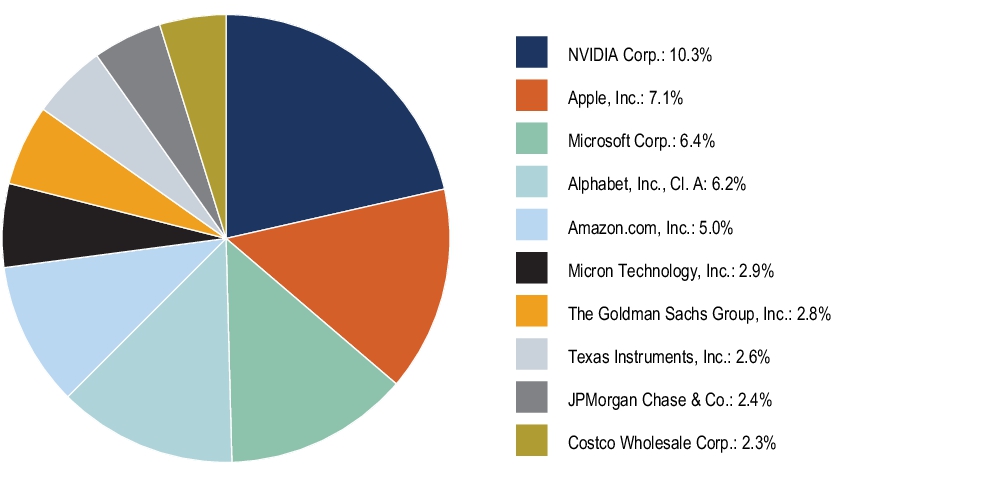
* Excludes money market funds or other short-term securities held for the investment of cash and cash collateral for securities loaned, if any.
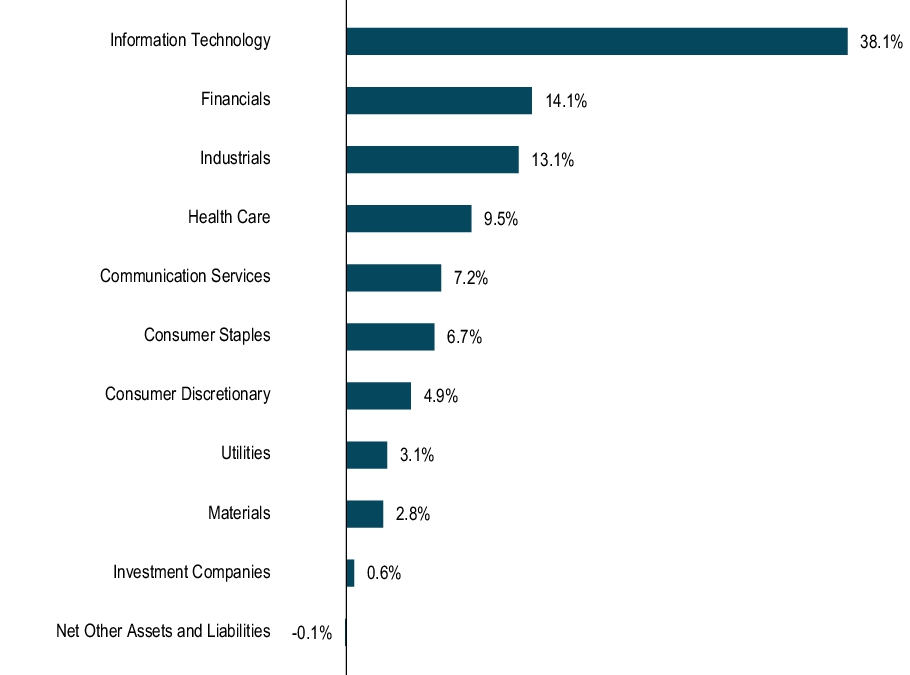
Sector Allocation (Based on Net Assets)
Top Ten Holdings (Based on Net Assets) *
* Excludes money market funds or other short-term securities held for the investment of cash and cash collateral for securities loaned, if any.
What were the Fund’s costs for the last year ?
(based on a hypothetical $10,000 investment)
| Share Class | Costs of a $10,000 investment | Costs paid as a percentage of a $10,000 investment |
| Class I* | $78 | 0.70% |
| * |
During the period, fees were waived and/or expenses reimbursed pursuant to an agreement with the Fund’s investment adviser, BNY Mellon Investment Adviser, Inc. If this agreement is not extended in the future, expenses could be higher. |
How did the Fund perform last year ?
-
For the 12-month period ended May 31, 2026, the Fund’s Class I shares returned 23.07%.
-
In comparison, the S&P 500® Index (the “Index”) returned 29.77% for the same period.
What affected the Fund’s performance?
-
U.S. stocks gained as inflation eased, interest rate expectations stabilized, economic growth remained resilient, and earnings growth—particularly in technology—supported market returns.
-
Stock selection in communication services and financials, alongside overweight exposure to consumer discretionary, were the strongest positive contributors to the Fund’s relative performance.
-
Stock selection within the strong information technology sector, combined with weak stock selection in health care and industrials, detracted most from relative performance.
How did the Fund perform over the past 10 years?
The Fund’s past performance is not a good predictor of the Fund’s future performance. The graph and table do not reflect the deduction of taxes that a shareholder would pay on fund distributions or redemption of fund shares.
Cumulative Performance from June 1 , 2016 through May 31, 2026
Initial Investment of $10,000
Initial Investment of $10,000
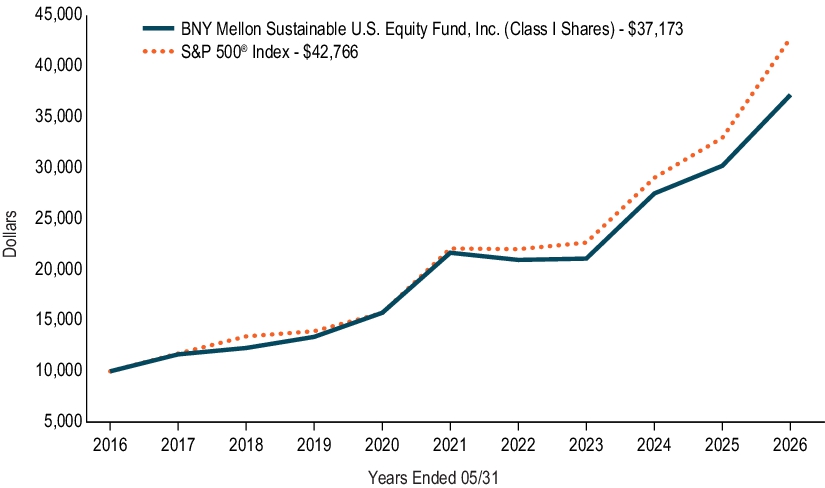
The above graph compares a hypothetical $10,000 investment in the Fund’s Class I shares to a hypothetical investment of $10,000 made in the S&P 500® Index on 5/31/2016. The performance shown takes into account applicable fees and expenses of the Fund, including management fees and other expenses. The Fund’s performance also assumes the reinvestment of dividends and capital gains. Unlike the Fund, the Index is not subject to charges, fees and other expenses. Investors cannot invest directly in any index.
AVERAGE ANNUAL TOTAL RETURNS (AS OF 5/31/26 )
| Share Class | 1YR | 5YR | 10YR | |||
| Class I | 23.07% | 11.41% | 14.03% | |||
| S&P 500® Index | 29.77% | 14.14% | 15.64% |
KEY FUND STATISTICS (AS OF 5/31/26 )
Fund Size (Millions) |
Number of Holdings |
Total Advisory Fee Paid During Period |
Annual Portfolio Turnover |
| $518 | 50 | $2,969,499 | 31.79% |
Portfolio Holdings (as of 5/31/26 )
Top Ten Holdings (Based on Net Assets) *
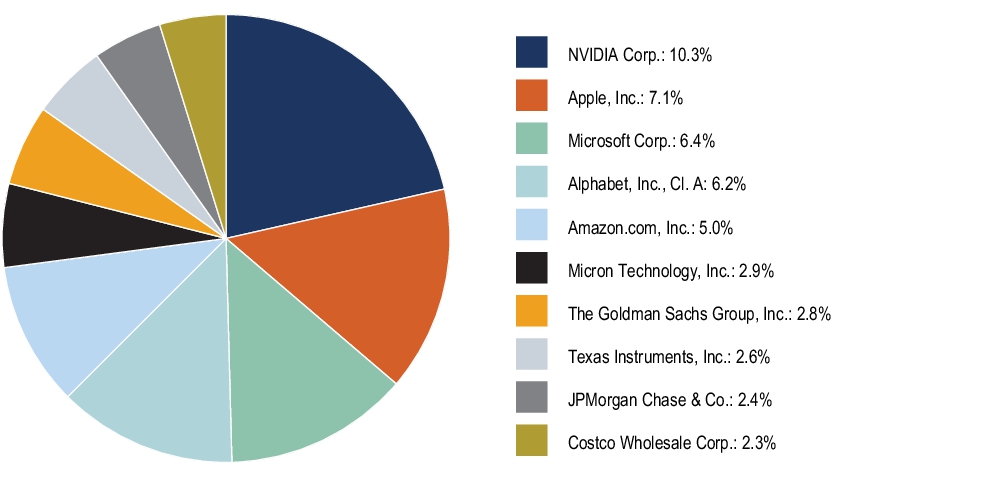
* Excludes money market funds or other short-term securities held for the investment of cash and cash collateral for securities loaned, if any.
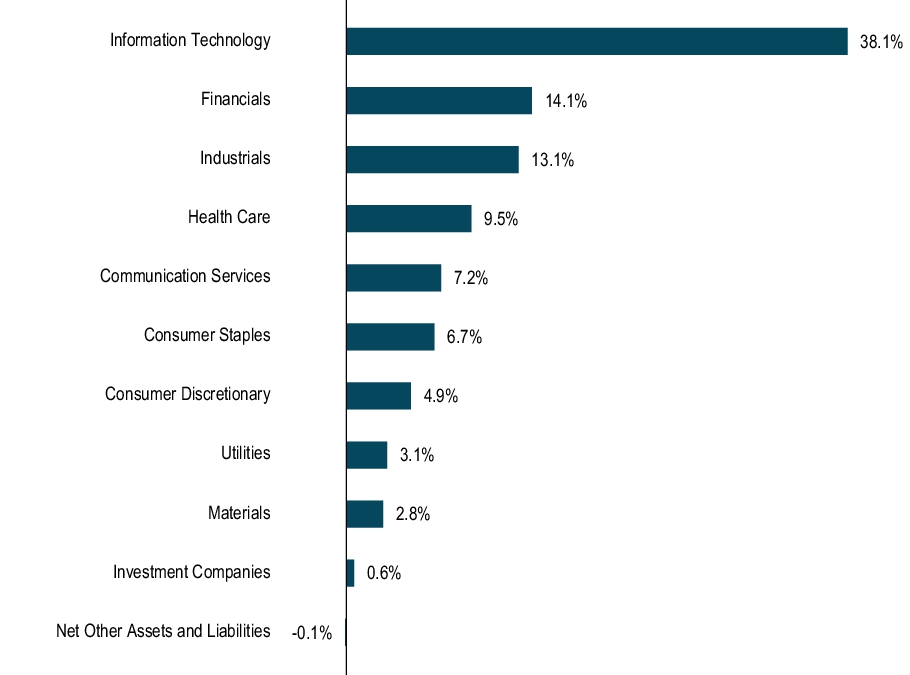
Sector Allocation (Based on Net Assets)
Top Ten Holdings (Based on Net Assets) *
* Excludes money market funds or other short-term securities held for the investment of cash and cash collateral for securities loaned, if any.
What were the Fund’s costs for the last year ?
(based on a hypothetical $10,000 investment)
| Share Class | Costs of a $10,000 investment | Costs paid as a percentage of a $10,000 investment |
| Class Y* | $78 | 0.70% |
| * |
During the period, fees were waived and/or expenses reimbursed pursuant to an agreement with the Fund’s investment adviser, BNY Mellon Investment Adviser, Inc. If this agreement is not extended in the future, expenses could be higher.
|
How did the Fund perform last year ?
-
For the 12-month period ended May 31, 2026, the Fund’s Class Y shares returned 23.00%.
-
In comparison, the S&P 500® Index (the “Index”) returned 29.77% for the same period.
What affected the Fund’s performance?
-
U.S. stocks gained as inflation eased, interest rate expectations stabilized, economic growth remained resilient, and earnings growth—particularly in technology—supported market returns.
-
Stock selection in communication services and financials, alongside overweight exposure to consumer discretionary, were the strongest positive contributors to the Fund’s relative performance.
-
Stock selection within the strong information technology sector, combined with weak stock selection in health care and industrials, detracted most from relative performance.
How did the Fund perform over the past 10 years?
The Fund’s past performance is not a good predictor of the Fund’s future performance. The graph and table do not reflect the deduction of taxes that a shareholder would pay on fund distributions or redemption of fund shares.
Cumulative Performance from June 1 , 2016 through May 31, 2026
Initial Investment of $1,000,000
Initial Investment of $1,000,000
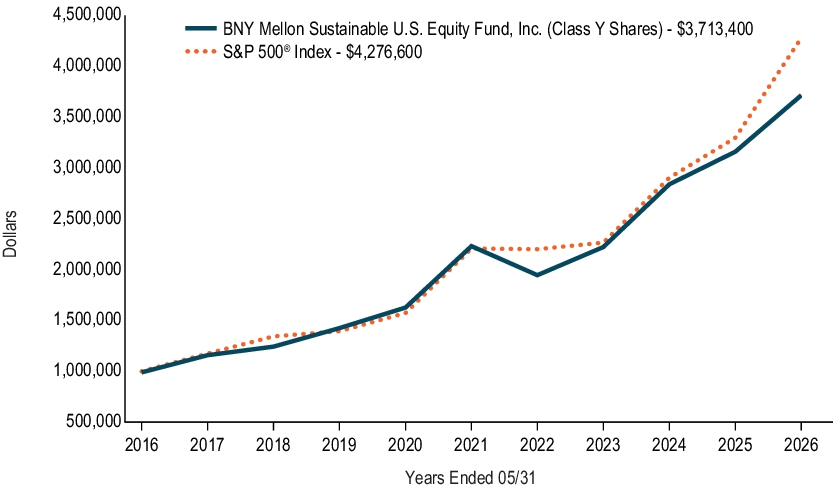
The above graph compares a hypothetical $1,000,000 investment in the Fund’s Class Y shares to a hypothetical investment of $1,000,000 made in the S&P 500® Index on 5/31/2016. The performance shown takes into account applicable fees and expenses of the Fund, including management fees and other expenses. The Fund’s performance also assumes the reinvestment of dividends and capital gains. Unlike the Fund, the Index is not subject to charges, fees and other expenses. Investors cannot invest directly in any index.
AVERAGE ANNUAL TOTAL RETURNS (AS OF 5/31/26 )
| Share Class | 1YR | 5YR | 10YR | |||
| Class Y | 23.00% | 11.42% | 14.02% | |||
| S&P 500® Index | 29.77% | 14.14% | 15.64% |
KEY FUND STATISTICS (AS OF 5/31/26 )
Fund Size (Millions) |
Number of Holdings |
Total Advisory Fee Paid During Period |
Annual Portfolio Turnover |
| $518 | 50 | $2,969,499 | 31.79% |
Portfolio Holdings (as of 5/31/26 )
Top Ten Holdings (Based on Net Assets) *
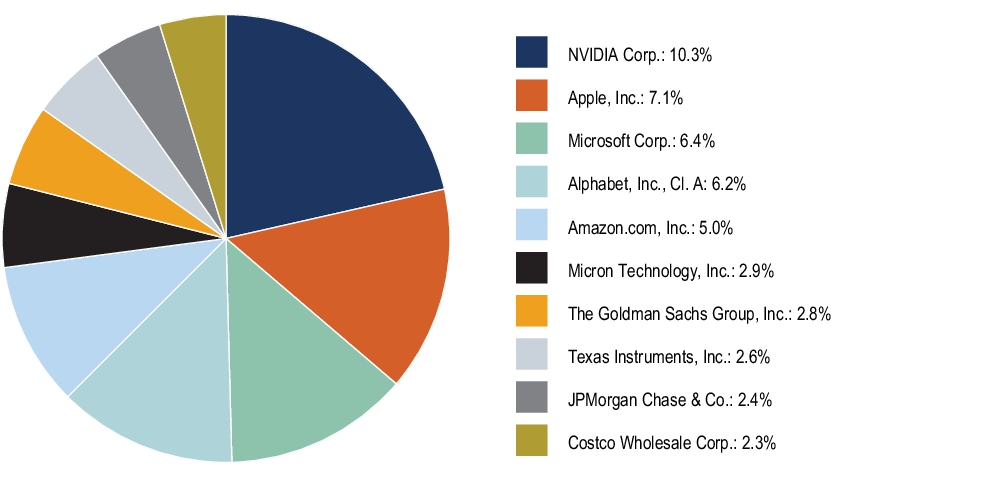
* Excludes money market funds or other short-term securities held for the investment of cash and cash collateral for securities loaned, if any.
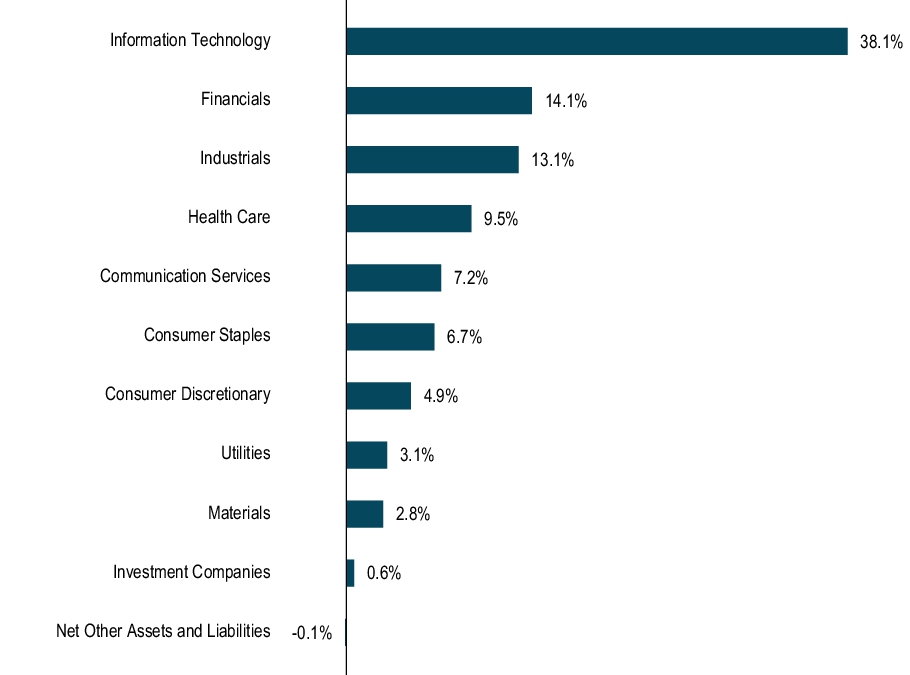
Sector Allocation (Based on Net Assets)
Top Ten Holdings (Based on Net Assets) *
* Excludes money market funds or other short-term securities held for the investment of cash and cash collateral for securities loaned, if any.
What were the Fund’s costs for the last year ?
(based on a hypothetical $10,000 investment)
| Share Class | Costs of a $10,000 investment | Costs paid as a percentage of a $10,000 investment |
| Class Z | $84 | 0.75% |
How did the Fund perform last year ?
-
For the 12-month period ended May 31, 2026, the Fund’s Class Z shares returned 22.96%.
-
In comparison, the S&P 500® Index (the “Index”) returned 29.77% for the same period.
What affected the Fund’s performance?
-
U.S. stocks gained as inflation eased, interest rate expectations stabilized, economic growth remained resilient, and earnings growth—particularly in technology—supported market returns.
-
Stock selection in communication services and financials, alongside overweight exposure to consumer discretionary, were the strongest positive contributors to the Fund’s relative performance.
-
Stock selection within the strong information technology sector, combined with weak stock selection in health care and industrials, detracted most from relative performance.
How did the Fund perform over the past 10 years?
The Fund’s past performance is not a good predictor of the Fund’s future performance. The graph and table do not reflect the deduction of taxes that a shareholder would pay on fund distributions or redemption of fund shares.
Cumulative Performance from June 1 , 2016 through May 31, 2026
Initial Investment of $10,000
Initial Investment of $10,000
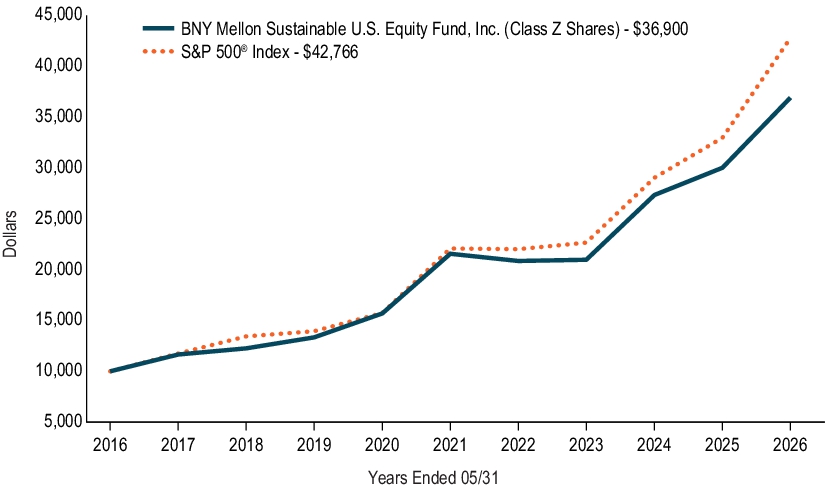
The above graph compares a hypothetical $10,000 investment in the Fund’s Class Z shares to a hypothetical investment of $10,000 made in the S&P 500® Index on 5/31/2016. The performance shown takes into account applicable fees and expenses of the Fund, including management fees and other expenses. The Fund’s performance also assumes the reinvestment of dividends and capital gains. Unlike the Fund, the Index is not subject to charges, fees and other expenses. Investors cannot invest directly in any index.
AVERAGE ANNUAL TOTAL RETURNS (AS OF 5/31/26 )
| Share Class | 1YR | 5YR | 10YR | |||
| Class Z | 22.96% | 11.35% | 13.95% | |||
| S&P 500® Index | 29.77% | 14.14% | 15.64% |
KEY FUND STATISTICS (AS OF 5/31/26 )
Fund Size (Millions) |
Number of Holdings |
Total Advisory Fee Paid During Period |
Annual Portfolio Turnover |
| $518 | 50 | $2,969,499 | 31.79% |
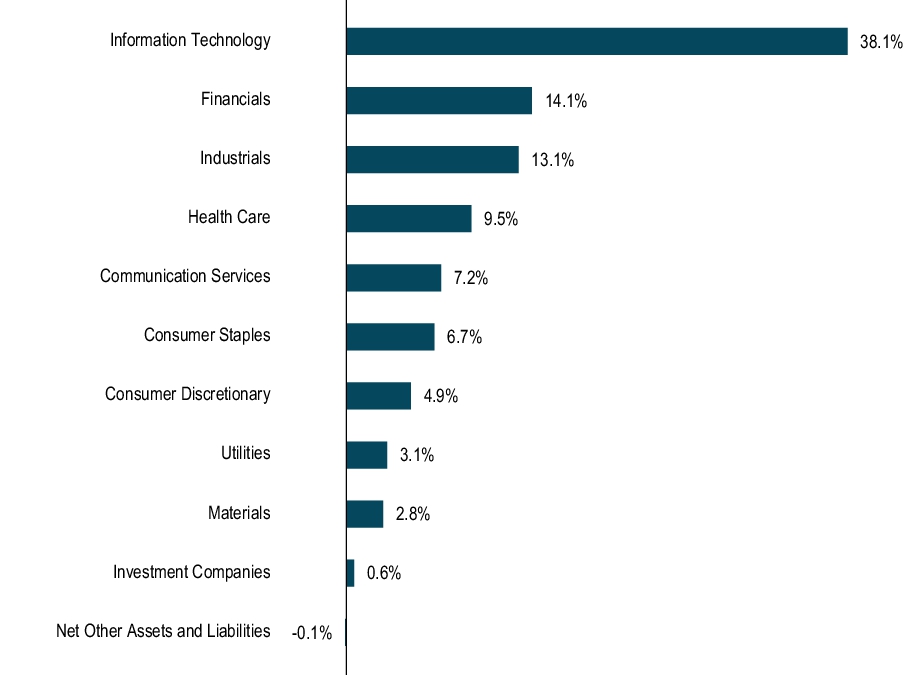
Portfolio Holdings (as of 5/31/26 )
Top Ten Holdings (Based on Net Assets) *
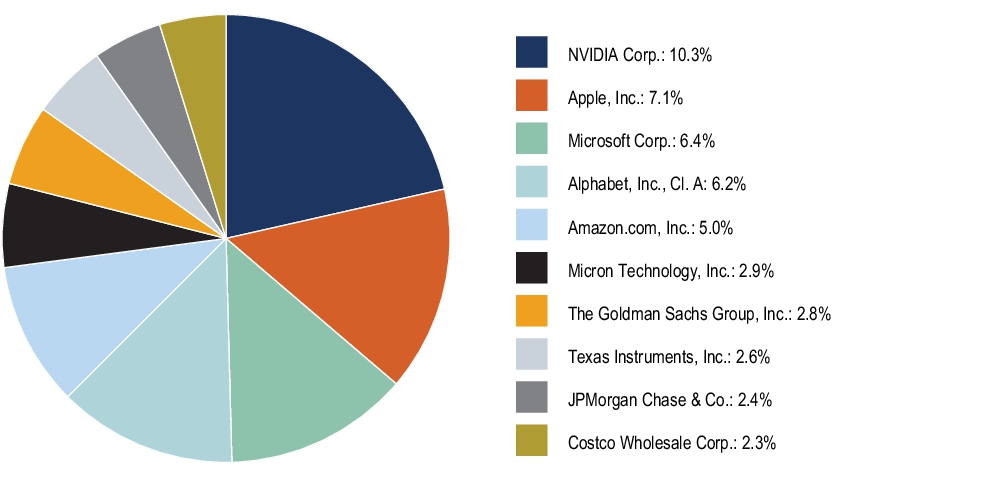
* Excludes money market funds or other short-term securities held for the investment of cash and cash collateral for securities loaned, if any.
Sector Allocation (Based on Net Assets)
Top Ten Holdings (Based on Net Assets) *
* Excludes money market funds or other short-term securities held for the investment of cash and cash collateral for securities loaned, if any.
| [1] | During the period, fees were waived and/or expenses reimbursed pursuant to an agreement with the Fund’s investment adviser, BNY Mellon Investment Adviser, Inc. If this agreement is not extended in the future, expenses could be higher. |
| [2] | During the period, fees were waived and/or expenses reimbursed pursuant to an agreement with the Fund’s investment adviser, BNY Mellon Investment Adviser, Inc. If this agreement is not extended in the future, expenses could be higher. |
| [3] | During the period, fees were waived and/or expenses reimbursed pursuant to an agreement with the Fund’s investment adviser, BNY Mellon Investment Adviser, Inc. If this agreement is not extended in the future, expenses could be higher. |
| [4] | During the period, fees were waived and/or expenses reimbursed pursuant to an agreement with the Fund’s investment adviser, BNY Mellon Investment Adviser, Inc. If this agreement is not extended in the future, expenses could be higher. |