
Exhibit 99.1
Disclaimers Cautionary Note Regarding Forward-Looking Statements This presentation contains forward-looking statements within the meaning of the Private Securities Litigation Reform Act of 1995. All statements other than statements of historical fact are forward-looking statements. These statements include, but are not limited to, statements regarding our future operating results and financial position, including for the third quarter ending September 30, 2026 and the year ending December 31, 2026; anticipated future expenses and investments; expectations relating to certain of our key financial and operating metrics; our business strategy and plans; expectations relating to legal and regulatory proceedings; expectations relating to our industry, the regulatory environment, market conditions, trends and growth; expectations relating to customer behaviors and preferences; our market position; potential market opportunities; and our objectives for future operations. The words “believe,” “may,” “will,” “estimate,” “potential,” “continue,” “anticipate,” “intend,” “expect,” “could,” “would,” “project,” “plan,” “target,” and similar expressions are intended to identify forward-looking statements. Forward-looking statements are based on management’s expectations, assumptions, and projections based on information available at the time the statements were made. These forward-looking statements are subject to a number of risks, uncertainties, and assumptions, including, among others: our ability to successfully execute our business and growth strategy and generate future profitability; market acceptance of our products and services; our ability to further penetrate our existing customer base and expand our customer base; our ability to develop new products and services; our ability to expand internationally; failure to obtain applicable regulatory approvals and satisfy other closing conditions in a timely manner or otherwise for any acquisition we make; the success of any acquisitions or investments that we make; the effects of increased competition in our markets; our ability to stay in compliance with applicable laws and regulations; stock price fluctuations; market conditions across the onchain economy, including crypto asset price volatility; and general market, political, and economic conditions, including interest rate fluctuations, inflation, changes in tariffs and trade restrictions, instability in the global banking system, economic downturns, and other global events, including regional wars and conflicts and government shutdowns. It is not possible for our management to predict all risks, nor can we assess the impact of all factors on our business or the extent to which any factor, or combination of factors, may cause actual results to differ materially from those contained in any forward-looking statements we may make. In light of these risks, uncertainties, and assumptions, our actual results could differ materially and adversely from those anticipated or implied in the forward-looking statements. Further information on risks that could cause actual results to differ materially from forecasted results is, or will be, included in our filings we make with the Securities and Exchange Commission (SEC) from time to time, including our Annual Report on Form 10-K for the year ended December 31, 2025 filed with the SEC on February 12, 2026 and our Quarterly Report on Form 10-Q for the quarter ended June 30, 2026 filed with the SEC on July 30, 2026. Except as required by law, we assume no obligation to update these forward-looking statements, or to update the reasons if actual results differ materially from those anticipated in the forward-looking statements. Key Metrics and Other Information This presentation includes certain of our key metrics that our management uses to help evaluate our business, measure our performance, identify trends affecting our business, and make strategic decisions. Our key metrics are Monthly Transacting Users, Assets on Platform, Net Income (Loss) and Adjusted EBITDA. Definitions of our key metrics can be found in our Quarterly Report on Form 10-Q for the quarter ended June 30, 2026 filed with the SEC on July 30, 2026. See “Non-GAAP Financial Measures” below for more information on Adjusted EBITDA, a non-GAAP financial measure. This presentation may contain metrics, data, estimates, and forecasts that are based on industry publications, third-party websites, or other publicly-available information, as well as other information based on our internal sources and calculations. This information involves many assumptions and limitations, including inherent challenges in measurement as our business and the markets in which we operate evolve. We have not independently verified the accuracy or completeness of the data contained in industry publications, third-party websites, and other publicly-available information. Accordingly, we make no representations as to the accuracy or completeness of that data nor do we undertake to update such data after the date of this presentation. Non-GAAP Financial Measures This presentation includes financial measures that were not prepared in accordance with U.S. generally accepted accounting principles (“GAAP”). Our non-GAAP financial measures include Adjusted EBITDA, Adjusted Net Income (Loss) and Adjusted Expenses. Definitions, explanations, and reconciliations to the most comparable GAAP financial measures can be found in the appendix to this presentation (“Appendix”). 2

Slide 1 Our mission is to increase economic freedom in the world
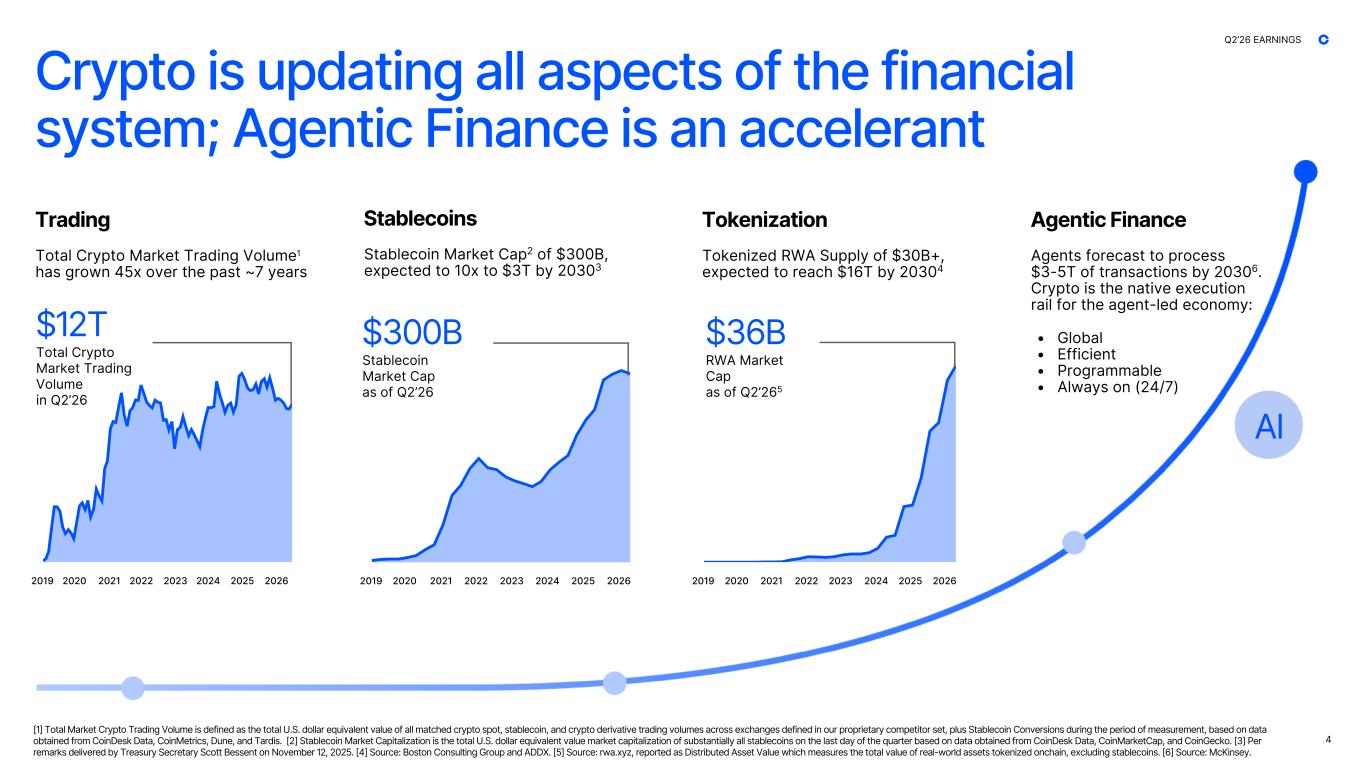
2019 2020 2021 2022 2023 2024 2025 2026 2019 2020 2021 2022 2023 2024 2025 20262019 2020 2021 2022 2023 2024 2025 2026 Crypto is updating all aspects of the financial system; Agentic Finance is an accelerant AI Agentic Finance Agents forecast to process $3-5T of transactions by 20306. Crypto is the native execution rail for the agent-led economy: • Global • Efficient • Programmable • Always on (24/7) Tokenization Tokenized RWA Supply of $30B+, expected to reach $16T by 20304 $36B RWA Market Cap as of Q2’265 [1] Total Market Crypto Trading Volume is defined as the total U.S. dollar equivalent value of all matched crypto spot, stablecoin, and crypto derivative trading volumes across exchanges defined in our proprietary competitor set, plus Stablecoin Conversions during the period of measurement, based on data obtained from CoinDesk Data, CoinMetrics, Dune, and Tardis. [2] Stablecoin Market Capitalization is the total U.S. dollar equivalent value market capitalization of substantially all stablecoins on the last day of the quarter based on data obtained from CoinDesk Data, CoinMarketCap, and CoinGecko. [3] Per remarks delivered by Treasury Secretary Scott Bessent on November 12, 2025. [4] Source: Boston Consulting Group and ADDX. [5] Source: rwa.xyz, reported as Distributed Asset Value which measures the total value of real-world assets tokenized onchain, excluding stablecoins. [6] Source: McKinsey. Trading Total Crypto Market Trading Volume1 has grown 45x over the past ~7 years $12T Total Crypto Market Trading Volume in Q2’26 Stablecoins Stablecoin Market Cap2 of $300B, expected to 10x to $3T by 20303 $300B Stablecoin Market Cap as of Q2’26 4 Q2’26 EARNINGS
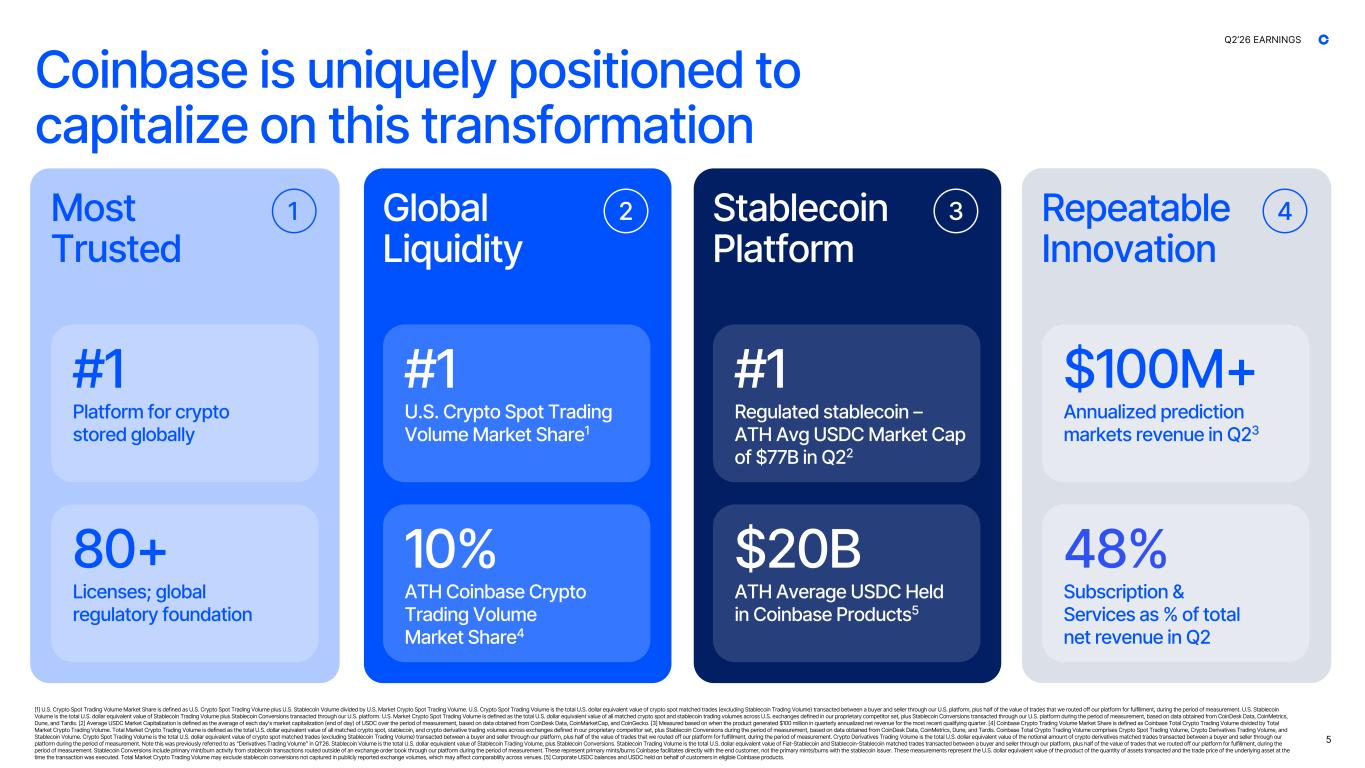
Coinbase is uniquely positioned to capitalize on this transformation [1] U.S. Crypto Spot Trading Volume Market Share is defined as U.S. Crypto Spot Trading Volume plus U.S. Stablecoin Volume divided by U.S. Market Crypto Spot Trading Volume. U.S. Crypto Spot Trading Volume is the total U.S. dollar equivalent value of crypto spot matched trades (excluding Stablecoin Trading Volume) transacted between a buyer and seller through our U.S. platform, plus half of the value of trades that we routed off our platform for fulfillment, during the period of measurement. U.S. Stablecoin Volume is the total U.S. dollar equivalent value of Stablecoin Trading Volume plus Stablecoin Conversions transacted through our U.S. platform. U.S. Market Crypto Spot Trading Volume is defined as the total U.S. dollar equivalent value of all matched crypto spot and stablecoin trading volumes across U.S. exchanges defined in our proprietary competitor set, plus Stablecoin Conversions transacted through our U.S. platform during the period of measurement, based on data obtained from CoinDesk Data, CoinMetrics, Dune, and Tardis. [2] Average USDC Market Capitalization is defined as the average of each day's market capitalization (end of day) of USDC over the period of measurement, based on data obtained from CoinDesk Data, CoinMarketCap, and CoinGecko. [3] Measured based on when the product generated $100 million in quarterly annualized net revenue for the most recent qualifying quarter. [4] Coinbase Crypto Trading Volume Market Share is defined as Coinbase Total Crypto Trading Volume divided by Total Market Crypto Trading Volume. Total Market Crypto Trading Volume is defined as the total U.S. dollar equivalent value of all matched crypto spot, stablecoin, and crypto derivative trading volumes across exchanges defined in our proprietary competitor set, plus Stablecoin Conversions during the period of measurement, based on data obtained from CoinDesk Data, CoinMetrics, Dune, and Tardis. Coinbase Total Crypto Trading Volume comprises Crypto Spot Trading Volume, Crypto Derivatives Trading Volume, and Stablecoin Volume. Crypto Spot Trading Volume is the total U.S. dollar equivalent value of crypto spot matched trades (excluding Stablecoin Trading Volume) transacted between a buyer and seller through our platform, plus half of the value of trades that we routed off our platform for fulfillment, during the period of measurement. Crypto Derivatives Trading Volume is the total U.S. dollar equivalent value of the notional amount of crypto derivatives matched trades transacted between a buyer and seller through our platform during the period of measurement. Note this was previously referred to as “Derivatives Trading Volume” in Q1ʼ26. Stablecoin Volume is the total U.S. dollar equivalent value of Stablecoin Trading Volume, plus Stablecoin Conversions. Stablecoin Trading Volume is the total U.S. dollar equivalent value of Fiat-Stablecoin and Stablecoin-Stablecoin matched trades transacted between a buyer and seller through our platform, plus half of the value of trades that we routed off our platform for fulfillment, during the period of measurement. Stablecoin Conversions include primary mint/burn activity from stablecoin transactions routed outside of an exchange order book through our platform during the period of measurement. These represent primary mints/burns Coinbase facilitates directly with the end customer, not the primary mints/burns with the stablecoin issuer. These measurements represent the U.S. dollar equivalent value of the product of the quantity of assets transacted and the trade price of the underlying asset at the time the transaction was executed. Total Market Crypto Trading Volume may exclude stablecoin conversions not captured in publicly reported exchange volumes, which may affect comparability across venues. [5] Corporate USDC balances and USDC held on behalf of customers in eligible Coinbase products. 1Most Trusted 80+ Licenses; global regulatory foundation #1 Platform for crypto stored globally 2Global Liquidity 10% ATH Coinbase Crypto Trading Volume Market Share4 #1 U.S. Crypto Spot Trading Volume Market Share1 3Stablecoin Platform $20B ATH Average USDC Held in Coinbase Products5 #1 Regulated stablecoin – ATH Avg USDC Market Cap of $77B in Q22 4Repeatable Innovation 48% Subscription & Services as % of total net revenue in Q2 $100M+ Annualized prediction markets revenue in Q23 5 Q2’26 EARNINGS
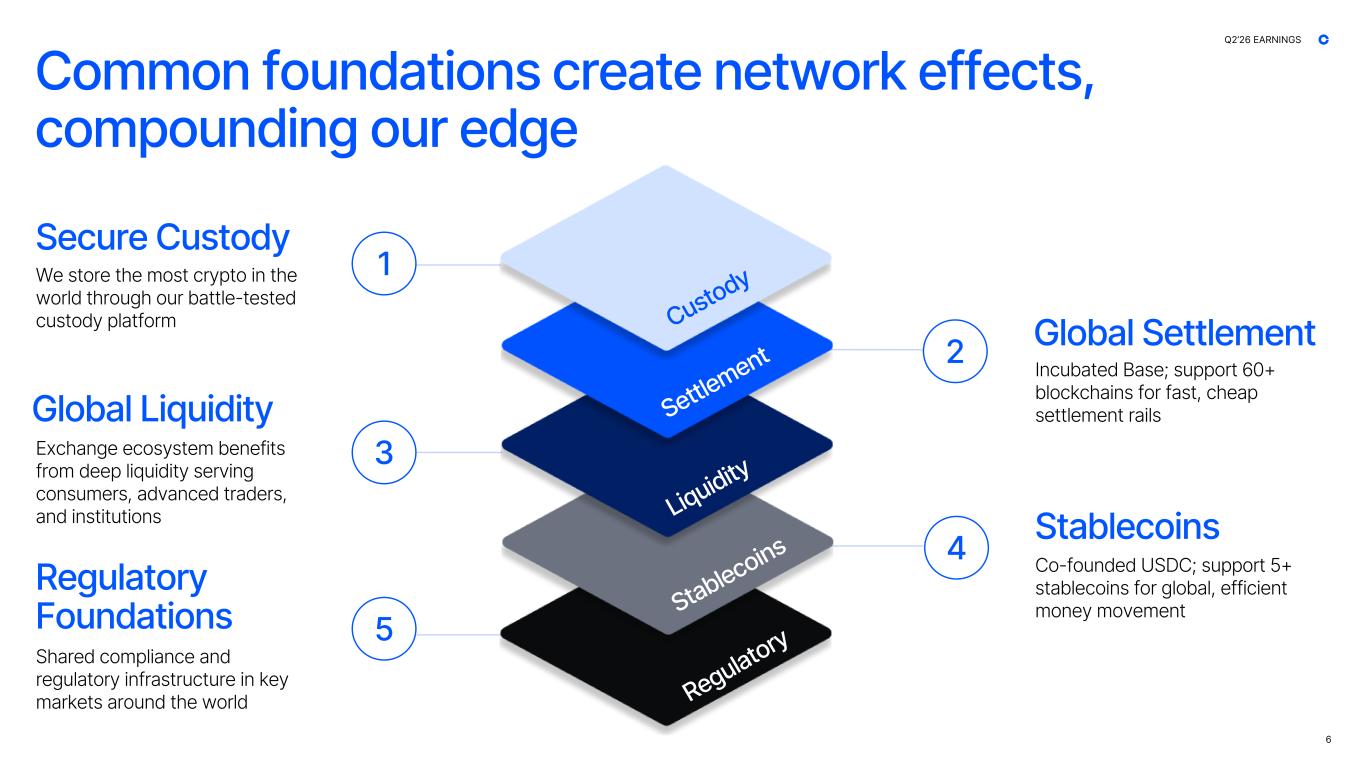
Co-founded USDC; support 5+ stablecoins for global, efficient money movement Shared compliance and regulatory infrastructure in key markets around the world We store the most crypto in the world through our battle-tested custody platform Common foundations create network effects, compounding our edge Stablecoins4 Global Settlement2 Global Liquidity 3 Secure Custody 1 Stablecoins Custody Exchange ecosystem benefits from deep liquidity serving consumers, advanced traders, and institutions Incubated Base; support 60+ blockchains for fast, cheap settlement rails Liquidity Regulatory Foundations Settlement 5 Regulatory 6 Q2’26 EARNINGS
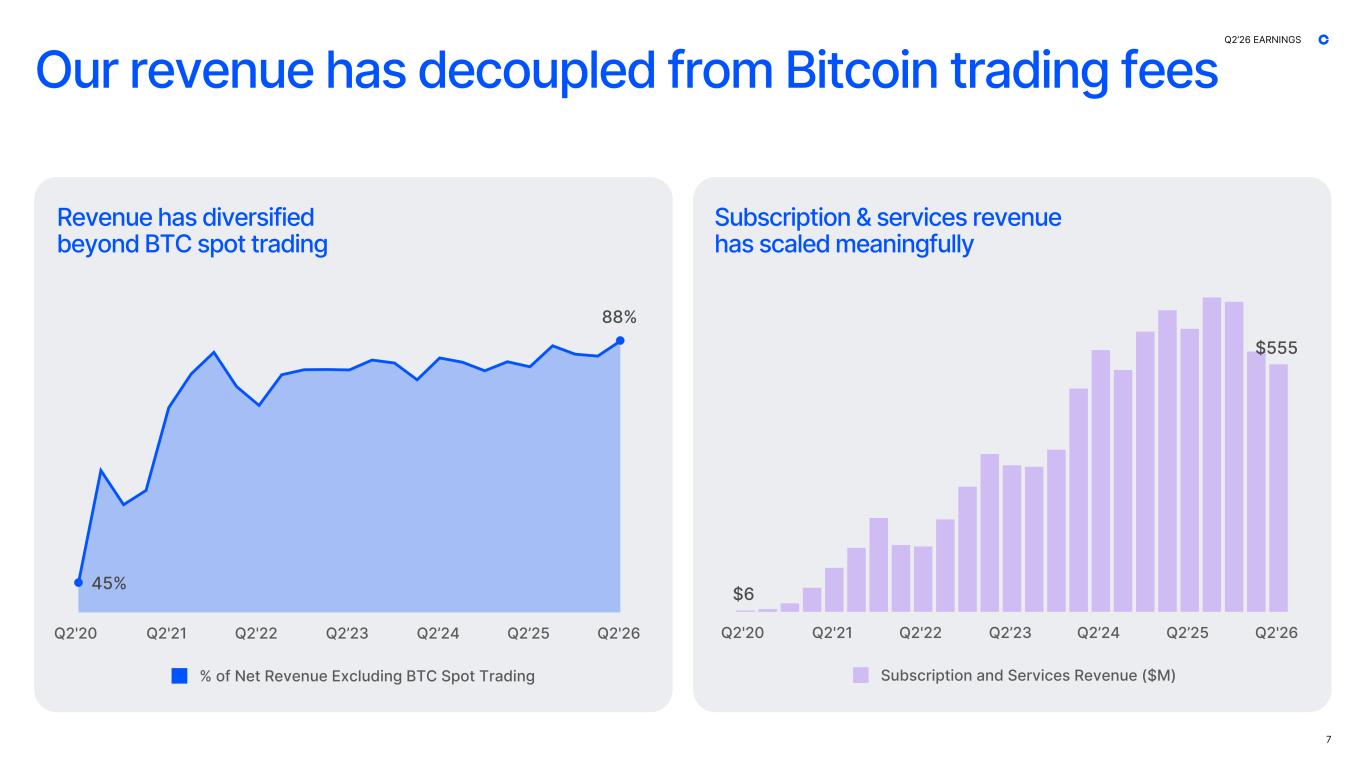
45% 88% % of Net Revenue Excluding BTC Spot Trading Q2'20 Q2'21 Q2'22 Q2’23 Q2’24 Q2’25 Q2'26 Subscription & services revenue has scaled meaningfully Revenue has diversified beyond BTC spot trading Our revenue has decoupled from Bitcoin trading fees 7 Q2’26 EARNINGS $6 $555 Subscription and Services Revenue ($M) Q2'20 Q2'21 Q2'22 Q2’23 Q2’24 Q2’25 Q2'26
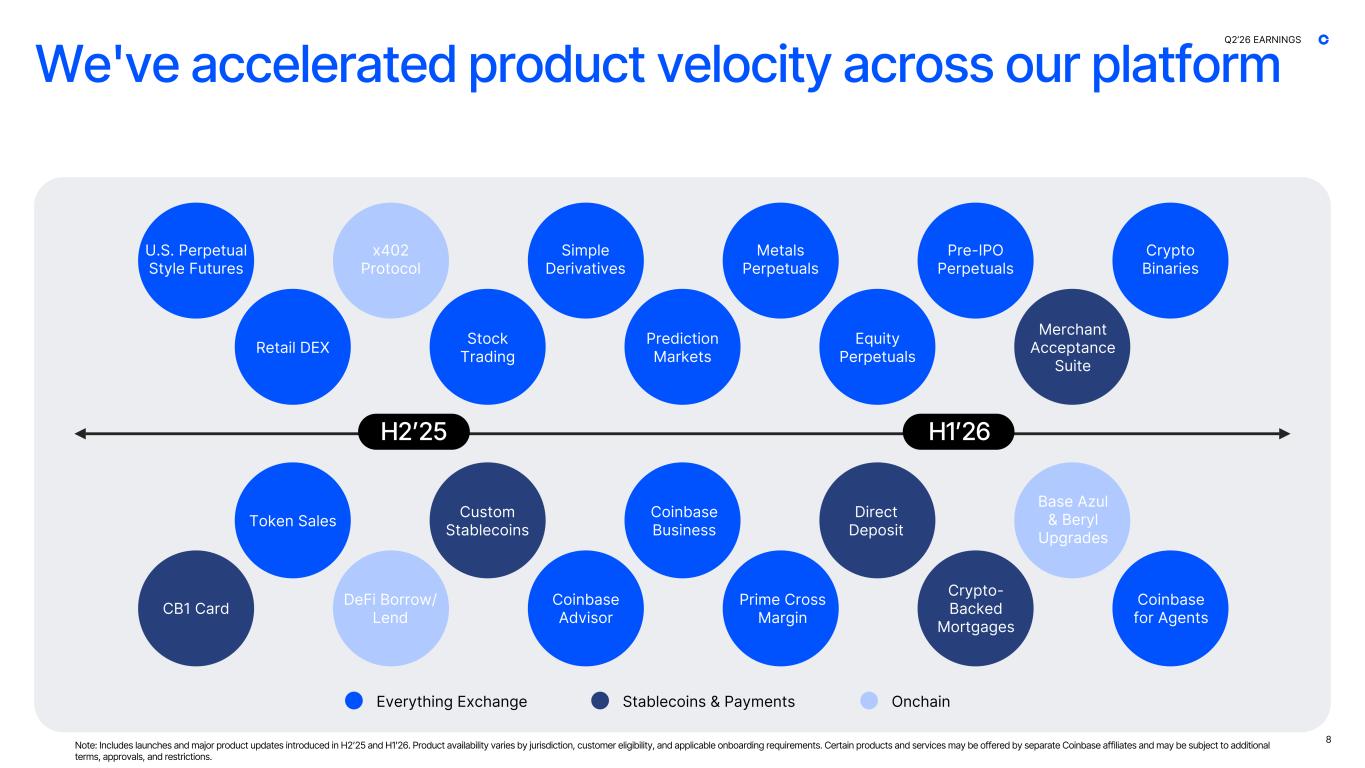
We've accelerated product velocity across our platform 8 Q2’26 EARNINGS Stock Trading Simple Derivatives Token Sales U.S. Perpetual Style Futures Retail DEX x402 Protocol Custom Stablecoins Equity Perpetuals Direct Deposit CB1 Card DeFi Borrow/ Lend Base Azul & Beryl Upgrades Crypto- Backed Mortgages Prediction Markets Pre-IPO Perpetuals Coinbase Advisor Coinbase for Agents Coinbase Business Crypto Binaries Merchant Acceptance Suite Metals Perpetuals Prime Cross Margin H2ʼ25 H1ʼ26 Everything Exchange Stablecoins & Payments Onchain Note: Includes launches and major product updates introduced in H2ʼ25 and H1ʼ26. Product availability varies by jurisdiction, customer eligibility, and applicable onboarding requirements. Certain products and services may be offered by separate Coinbase affiliates and may be subject to additional terms, approvals, and restrictions.
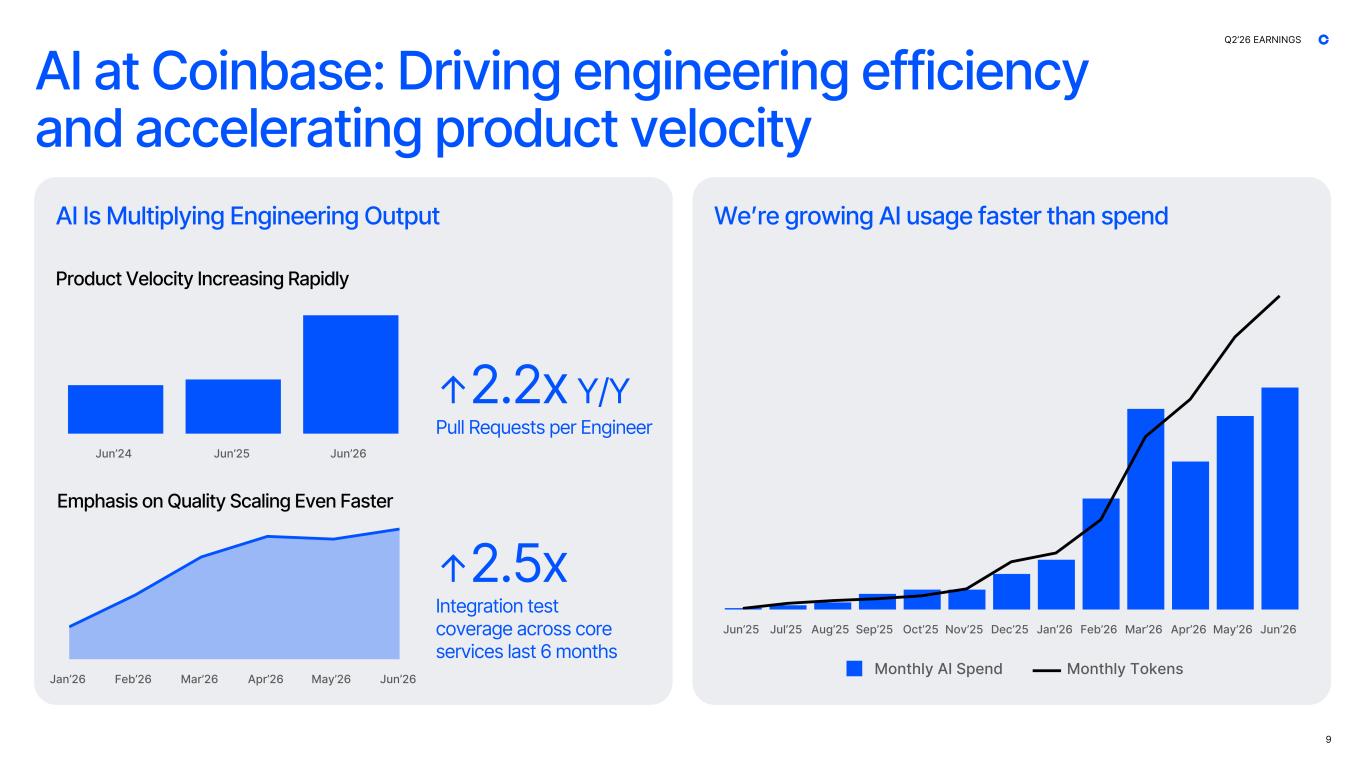
AI Is Multiplying Engineering Output Weʼre growing AI usage faster than spend 9 Q2’26 EARNINGS AI at Coinbase: Driving engineering efficiency and accelerating product velocity Product Velocity Increasing Rapidly Emphasis on Quality Scaling Even Faster Jun’24 Jun’25 Jun’26 ↑2.2x Y/Y Pull Requests per Engineer Jan’26 Feb’26 Mar’26 Apr’26 May’26 Jun’26 ↑2.5x Integration test coverage across core services last 6 months Monthly AI Spend Monthly Tokens Jun’25 Jul’25 Aug’25 Sep’25 Oct’25 Nov’25 Dec’25 Jan’26 Feb’26 Mar’26 Apr’26 May’26 Jun’26
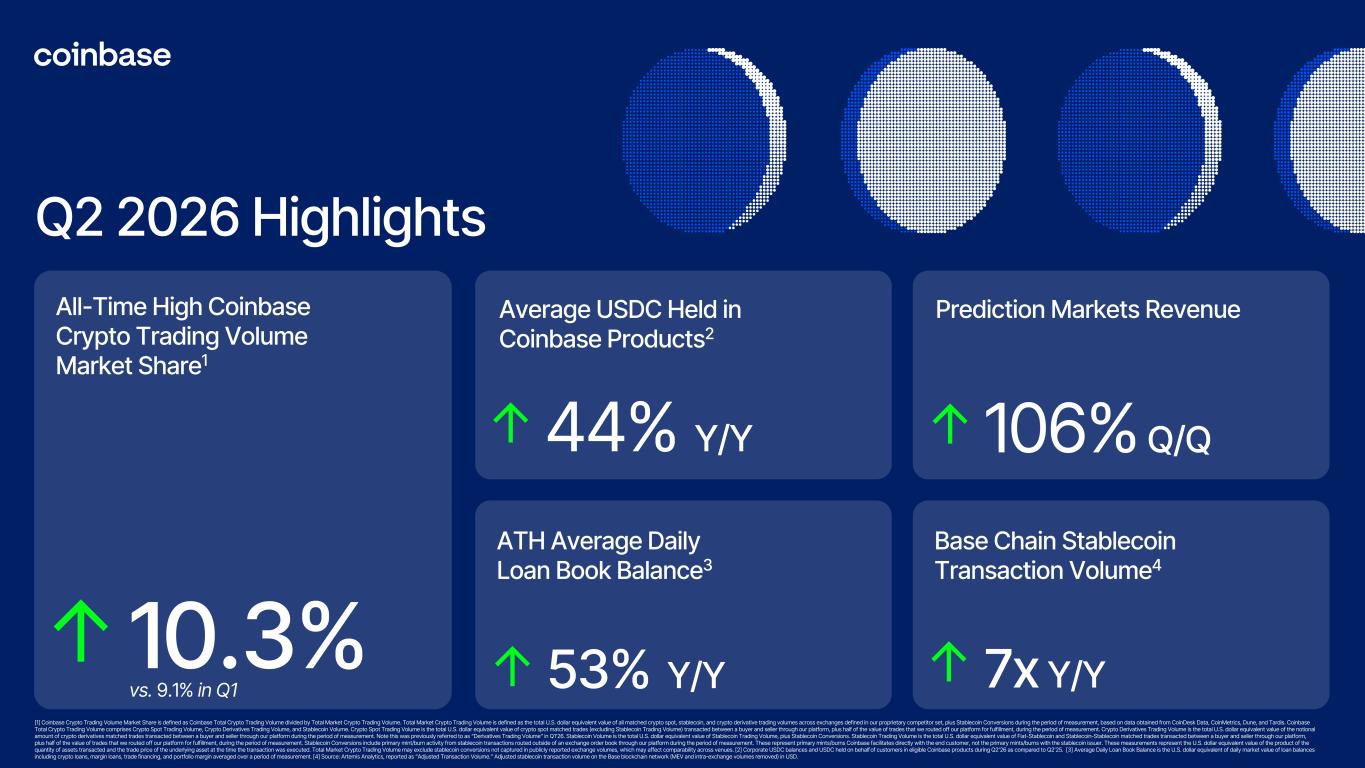
All-Time High Coinbase Crypto Trading Volume Market Share1 Average USDC Held in Coinbase Products2 Prediction Markets Revenue [1] Coinbase Crypto Trading Volume Market Share is defined as Coinbase Total Crypto Trading Volume divided by Total Market Crypto Trading Volume. Total Market Crypto Trading Volume is defined as the total U.S. dollar equivalent value of all matched crypto spot, stablecoin, and crypto derivative trading volumes across exchanges defined in our proprietary competitor set, plus Stablecoin Conversions during the period of measurement, based on data obtained from CoinDesk Data, CoinMetrics, Dune, and Tardis. Coinbase Total Crypto Trading Volume comprises Crypto Spot Trading Volume, Crypto Derivatives Trading Volume, and Stablecoin Volume. Crypto Spot Trading Volume is the total U.S. dollar equivalent value of crypto spot matched trades (excluding Stablecoin Trading Volume) transacted between a buyer and seller through our platform, plus half of the value of trades that we routed off our platform for fulfillment, during the period of measurement. Crypto Derivatives Trading Volume is the total U.S. dollar equivalent value of the notional amount of crypto derivatives matched trades transacted between a buyer and seller through our platform during the period of measurement. Note this was previously referred to as “Derivatives Trading Volume” in Q1ʼ26. Stablecoin Volume is the total U.S. dollar equivalent value of Stablecoin Trading Volume, plus Stablecoin Conversions. Stablecoin Trading Volume is the total U.S. dollar equivalent value of Fiat-Stablecoin and Stablecoin-Stablecoin matched trades transacted between a buyer and seller through our platform, plus half of the value of trades that we routed off our platform for fulfillment, during the period of measurement. Stablecoin Conversions include primary mint/burn activity from stablecoin transactions routed outside of an exchange order book through our platform during the period of measurement. These represent primary mints/burns Coinbase facilitates directly with the end customer, not the primary mints/burns with the stablecoin issuer. These measurements represent the U.S. dollar equivalent value of the product of the quantity of assets transacted and the trade price of the underlying asset at the time the transaction was executed. Total Market Crypto Trading Volume may exclude stablecoin conversions not captured in publicly reported exchange volumes, which may affect comparability across venues. [2] Corporate USDC balances and USDC held on behalf of customers in eligible Coinbase products during Q2ʼ26 as compared to Q2ʼ25. [3] Average Daily Loan Book Balance is the U.S. dollar equivalent of daily market value of loan balances including crypto loans, margin loans, trade financing, and portfolio margin averaged over a period of measurement. [4] Source: Artemis Analytics, reported as “Adjusted Transaction Volume.” Adjusted stablecoin transaction volume on the Base blockchain network (MEV and intra-exchange volumes removed) in USD. 10.3% vs. 9.1% in Q1 ↓ 44% Y/Y ↓ 106% Q/Q Base Chain Stablecoin Transaction Volume4 ↓ 7x Y/Y ATH Average Daily Loan Book Balance3 ↓ 53% Y/Y ↓ Q2 2026 Highlights
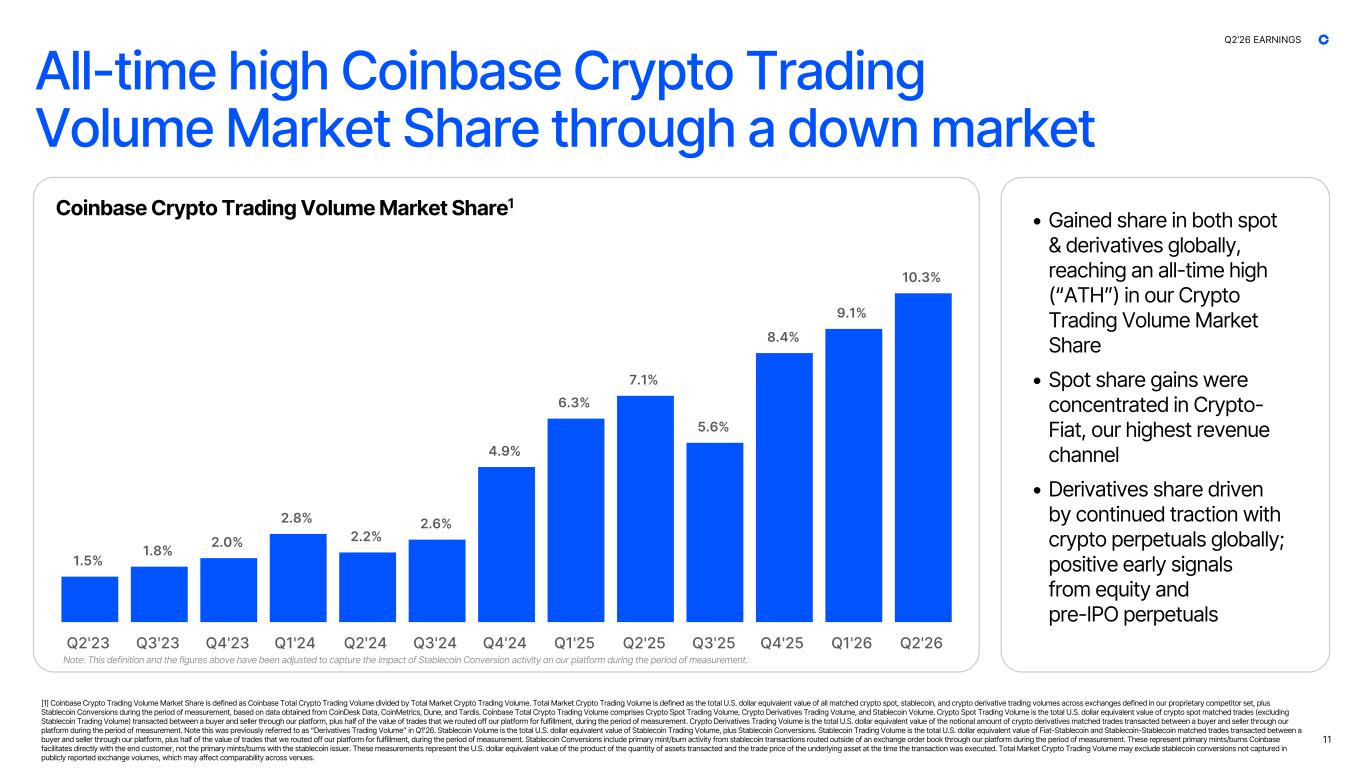
[1] Coinbase Crypto Trading Volume Market Share is defined as Coinbase Total Crypto Trading Volume divided by Total Market Crypto Trading Volume. Total Market Crypto Trading Volume is defined as the total U.S. dollar equivalent value of all matched crypto spot, stablecoin, and crypto derivative trading volumes across exchanges defined in our proprietary competitor set, plus Stablecoin Conversions during the period of measurement, based on data obtained from CoinDesk Data, CoinMetrics, Dune, and Tardis. Coinbase Total Crypto Trading Volume comprises Crypto Spot Trading Volume, Crypto Derivatives Trading Volume, and Stablecoin Volume. Crypto Spot Trading Volume is the total U.S. dollar equivalent value of crypto spot matched trades (excluding Stablecoin Trading Volume) transacted between a buyer and seller through our platform, plus half of the value of trades that we routed off our platform for fulfillment, during the period of measurement. Crypto Derivatives Trading Volume is the total U.S. dollar equivalent value of the notional amount of crypto derivatives matched trades transacted between a buyer and seller through our platform during the period of measurement. Note this was previously referred to as “Derivatives Trading Volume” in Q1ʼ26. Stablecoin Volume is the total U.S. dollar equivalent value of Stablecoin Trading Volume, plus Stablecoin Conversions. Stablecoin Trading Volume is the total U.S. dollar equivalent value of Fiat-Stablecoin and Stablecoin-Stablecoin matched trades transacted between a buyer and seller through our platform, plus half of the value of trades that we routed off our platform for fulfillment, during the period of measurement. Stablecoin Conversions include primary mint/burn activity from stablecoin transactions routed outside of an exchange order book through our platform during the period of measurement. These represent primary mints/burns Coinbase facilitates directly with the end customer, not the primary mints/burns with the stablecoin issuer. These measurements represent the U.S. dollar equivalent value of the product of the quantity of assets transacted and the trade price of the underlying asset at the time the transaction was executed. Total Market Crypto Trading Volume may exclude stablecoin conversions not captured in publicly reported exchange volumes, which may affect comparability across venues. Coinbase Crypto Trading Volume Market Share1 All-time high Coinbase Crypto Trading Volume Market Share through a down market 11 • Gained share in both spot & derivatives globally, reaching an all-time high (“ATH”) in our Crypto Trading Volume Market Share • Spot share gains were concentrated in Crypto- Fiat, our highest revenue channel • Derivatives share driven by continued traction with crypto perpetuals globally; positive early signals from equity and pre-IPO perpetuals 1.5% 1.8% 2.0% 2.8% 2.2% 2.6% 4.9% 6.3% 7.1% 5.6% 8.4% 9.1% 10.3% Q2'23 Q3'23 Q4'23 Q1'24 Q2'24 Q3'24 Q4'24 Q1'25 Q2'25 Q3'25 Q4'25 Q1'26 Q2'26 Q2’26 EARNINGS Note: This definition and the figures above have been adjusted to capture the impact of Stablecoin Conversion activity on our platform during the period of measurement.
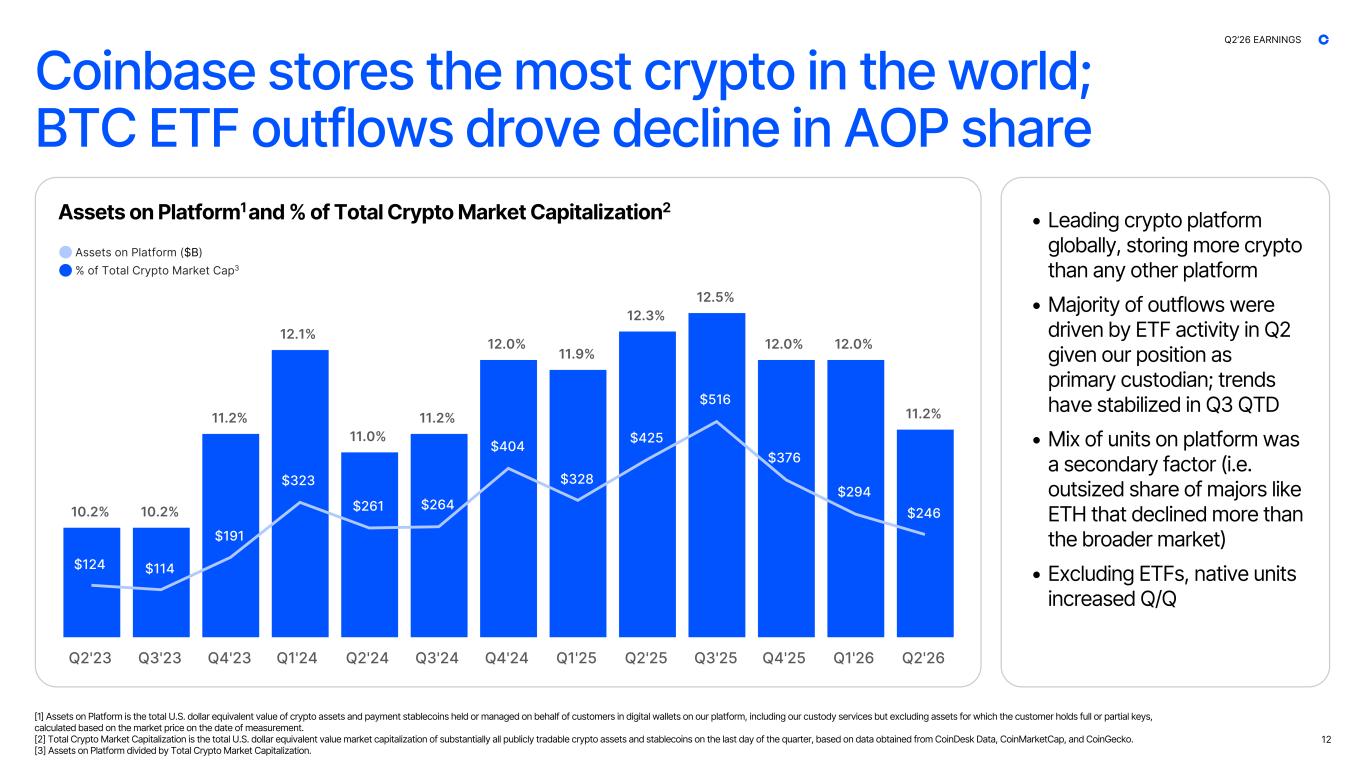
• Leading crypto platform globally, storing more crypto than any other platform • Majority of outflows were driven by ETF activity in Q2 given our position as primary custodian; trends have stabilized in Q3 QTD • Mix of units on platform was a secondary factor (i.e. outsized share of majors like ETH that declined more than the broader market) • Excluding ETFs, native units increased Q/Q [1] Assets on Platform is the total U.S. dollar equivalent value of crypto assets and payment stablecoins held or managed on behalf of customers in digital wallets on our platform, including our custody services but excluding assets for which the customer holds full or partial keys, calculated based on the market price on the date of measurement. [2] Total Crypto Market Capitalization is the total U.S. dollar equivalent value market capitalization of substantially all publicly tradable crypto assets and stablecoins on the last day of the quarter, based on data obtained from CoinDesk Data, CoinMarketCap, and CoinGecko. [3] Assets on Platform divided by Total Crypto Market Capitalization. Coinbase stores the most crypto in the world; BTC ETF outflows drove decline in AOP share Assets on Platform1 and % of Total Crypto Market Capitalization2 12 10.2% 10.2% 11.2% 12.1% 11.0% 11.2% 12.0% 11.9% 12.3% 12.5% 12.0% 12.0% 11.2% $124 $114 $191 $323 $261 $264 $404 $328 $425 $516 $376 $294 $246 Q2'23 Q3'23 Q4'23 Q1'24 Q2'24 Q3'24 Q4'24 Q1'25 Q2'25 Q3'25 Q4'25 Q1'26 Q2'26 Assets on Platform ($B) % of Total Crypto Market Cap3 Q2’26 EARNINGS
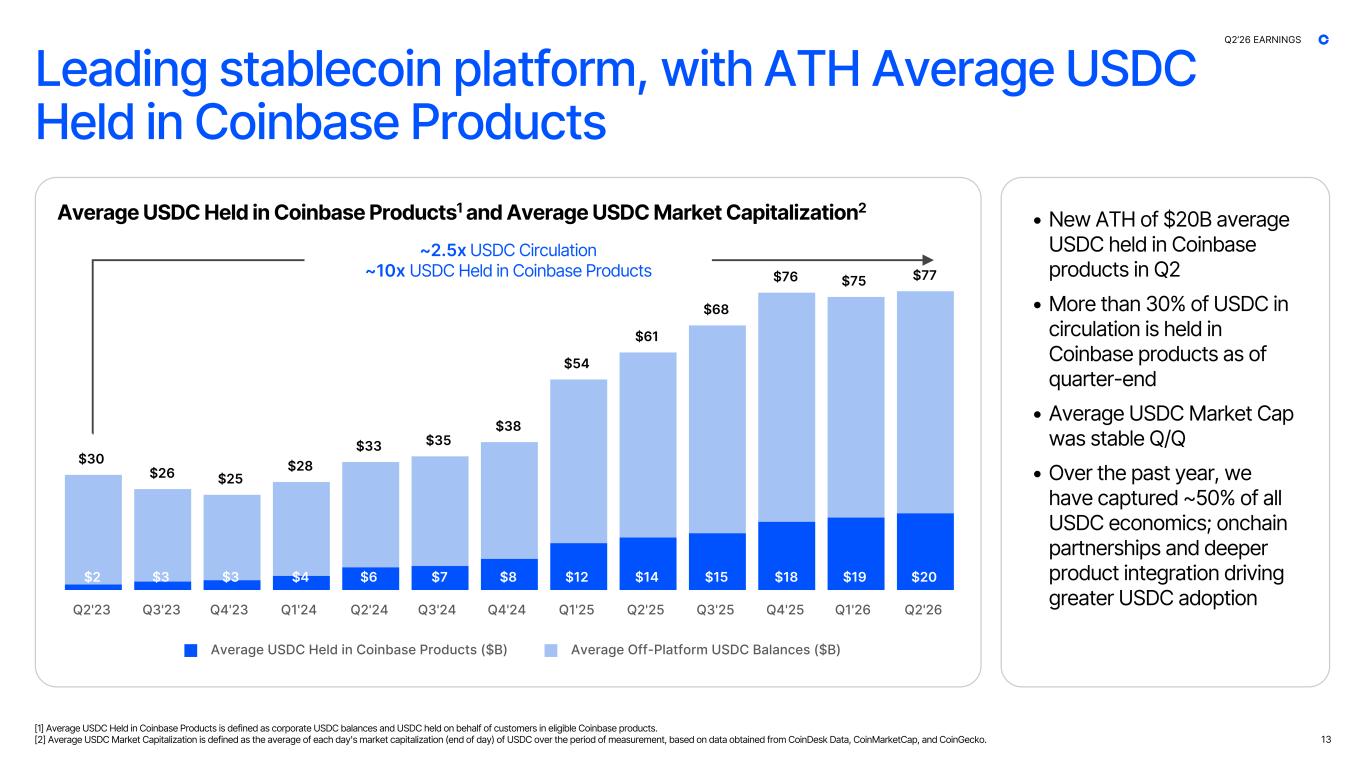
$30 $26 $25 $28 $33 $35 $38 $54 $61 $68 $76 $75 $77 $2 $3 $3 $4 $6 $7 $8 $12 $14 $15 $18 $19 $20 Average USDC Held in Coinbase Products ($B) Average Off-Platform USDC Balances ($B) Q2'23 Q3'23 Q4'23 Q1'24 Q2'24 Q3'24 Q4'24 Q1'25 Q2'25 Q3'25 Q4'25 Q1'26 Q2'26 ~2.5x USDC Circulation ~10x USDC Held in Coinbase Products Leading stablecoin platform, with ATH Average USDC Held in Coinbase Products [1] Average USDC Held in Coinbase Products is defined as corporate USDC balances and USDC held on behalf of customers in eligible Coinbase products. [2] Average USDC Market Capitalization is defined as the average of each day's market capitalization (end of day) of USDC over the period of measurement, based on data obtained from CoinDesk Data, CoinMarketCap, and CoinGecko. Average USDC Held in Coinbase Products1 and Average USDC Market Capitalization2 13 • New ATH of $20B average USDC held in Coinbase products in Q2 • More than 30% of USDC in circulation is held in Coinbase products as of quarter-end • Average USDC Market Cap was stable Q/Q • Over the past year, we have captured ~50% of all USDC economics; onchain partnerships and deeper product integration driving greater USDC adoption Q2’26 EARNINGS
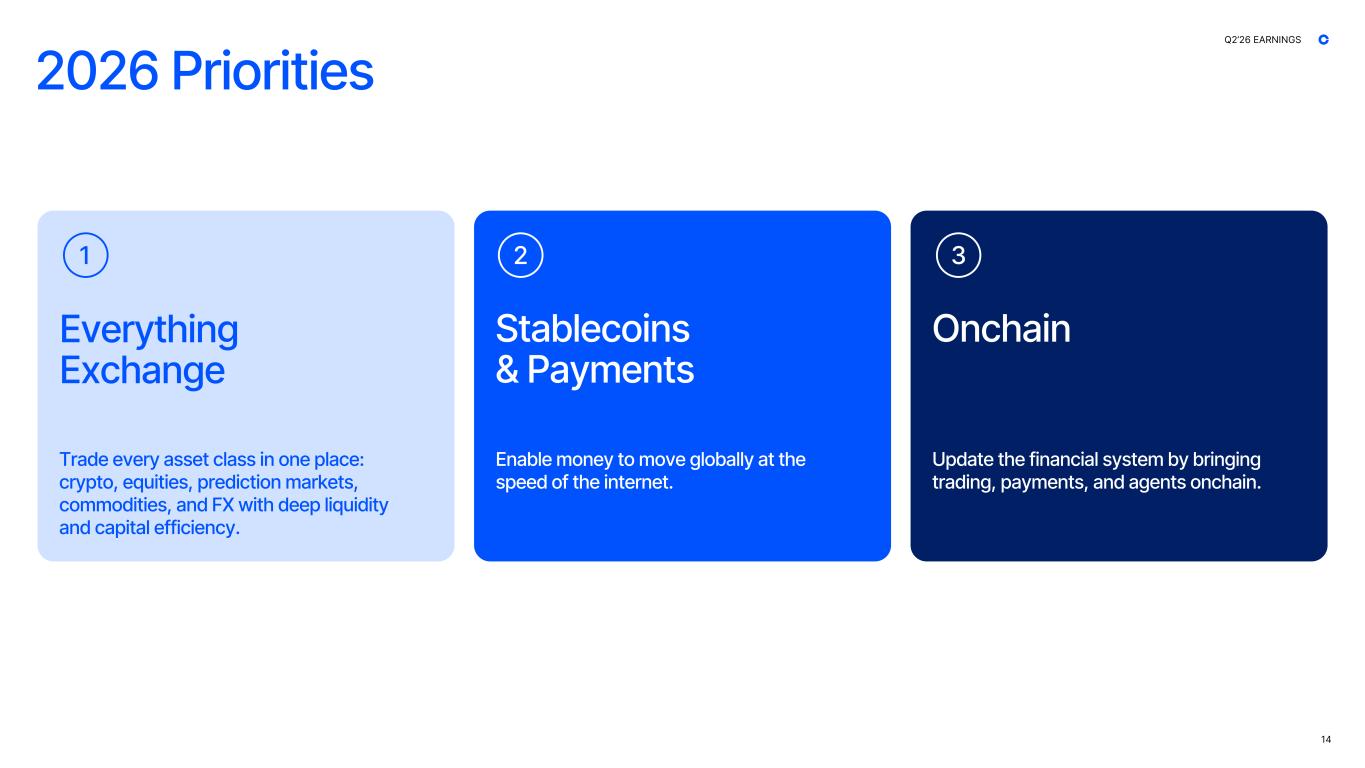
2026 Priorities Everything Exchange Stablecoins & Payments Onchain 1 32 Enable money to move globally at the speed of the internet. Trade every asset class in one place: crypto, equities, prediction markets, commodities, and FX with deep liquidity and capital efficiency. Update the financial system by bringing trading, payments, and agents onchain. 14 Q2’26 EARNINGS
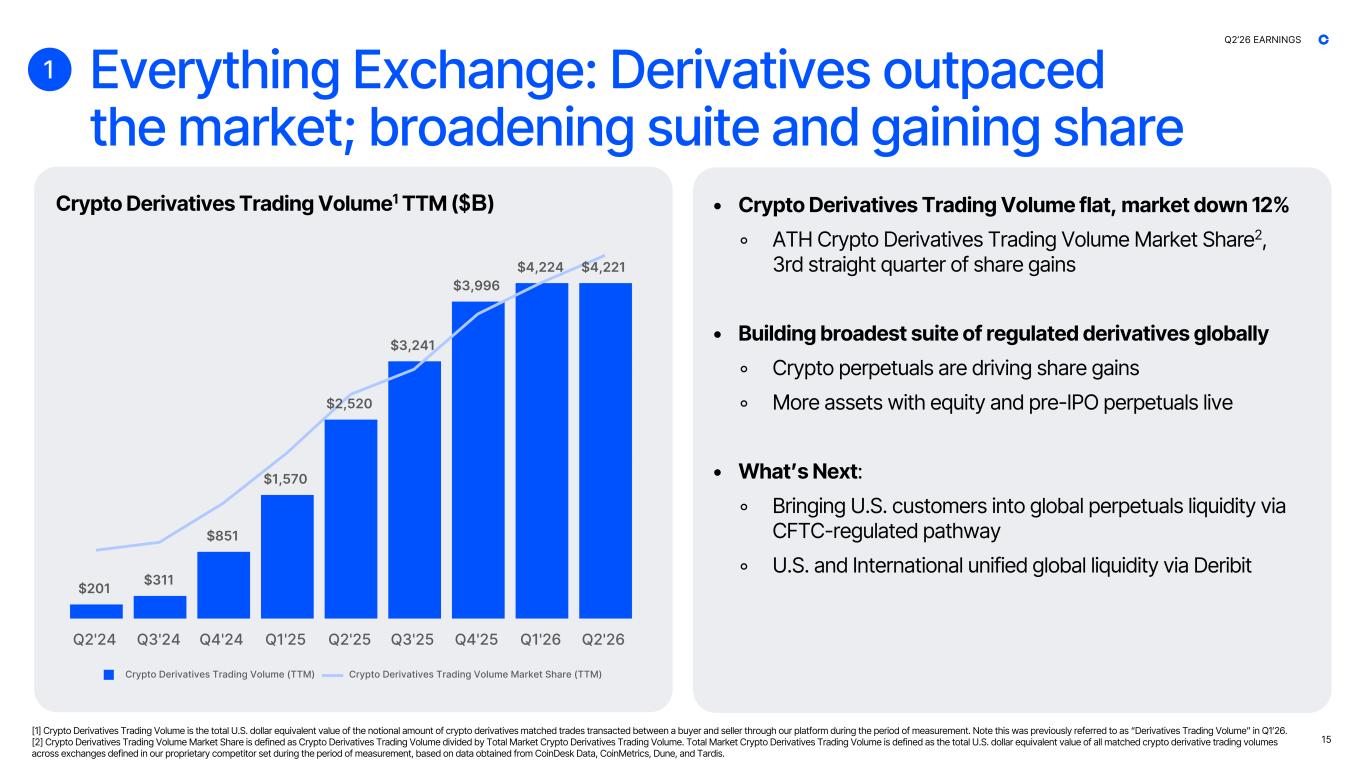
$201 $311 $851 $1,570 $2,520 $3,241 $3,996 $4,224 $4,221 Crypto Derivatives Trading Volume (TTM) Crypto Derivatives Trading Volume Market Share (TTM) Q2'24 Q3'24 Q4'24 Q1'25 Q2'25 Q3'25 Q4'25 Q1'26 Q2'26 Crypto Derivatives Trading Volume1 TTM ($B) • $4.2T+ in Crypto Derivatives Trading Volume TTM, flat despite market down 12% ◦ New ATH global derivatives market share ◦ 3rd consecutive quarter of derivative share gain amidst softer market conditions • Building broadest suite of regulated derivatives globally ◦ Crypto perpetuals are driving share gains ◦ Momentum building around recent launches of equity and pre-IPO perpetuals establishing us as the home for every asset class • Coming Soon: ◦ Bringing US customers into global perpetuals liquidity via CFTC-regulated pathway ◦ Unified global liquidity for US and International customers through Deribit Everything Exchange: Derivatives outpaced the market; broadening suite and gaining share 1 15 Q2’26 EARNINGS [1] Crypto Derivatives Trading Volume is the total U.S. dollar equivalent value of the notional amount of crypto derivatives matched trades transacted between a buyer and seller through our platform during the period of measurement. Note this was previously referred to as “Derivatives Trading Volume” in Q1ʼ26. [2] Crypto Derivatives Trading Volume Market Share is defined as Crypto Derivatives Trading Volume divided by Total Market Crypto Derivatives Trading Volume. Total Market Crypto Derivatives Trading Volume is defined as the total U.S. dollar equivalent value of all matched crypto derivative trading volumes across exchanges defined in our proprietary competitor set during the period of measurement, based on data obtained from CoinDesk Data, CoinMetrics, Dune, and Tardis. • Crypto Derivatives Trading Volume flat, market down 12% ◦ ATH Crypto Derivatives Trading Volume Market Share2, 3rd straight quarter of share gains • Building broadest suite of regulated derivatives globally ◦ Crypto perpetuals are driving share gains ◦ More assets with equity and pre-IPO perpetuals live • Whatʼs Next: ◦ Bringing U.S. customers into global perpetuals liquidity via CFTC-regulated pathway ◦ U.S. and International unified global liquidity via Deribit
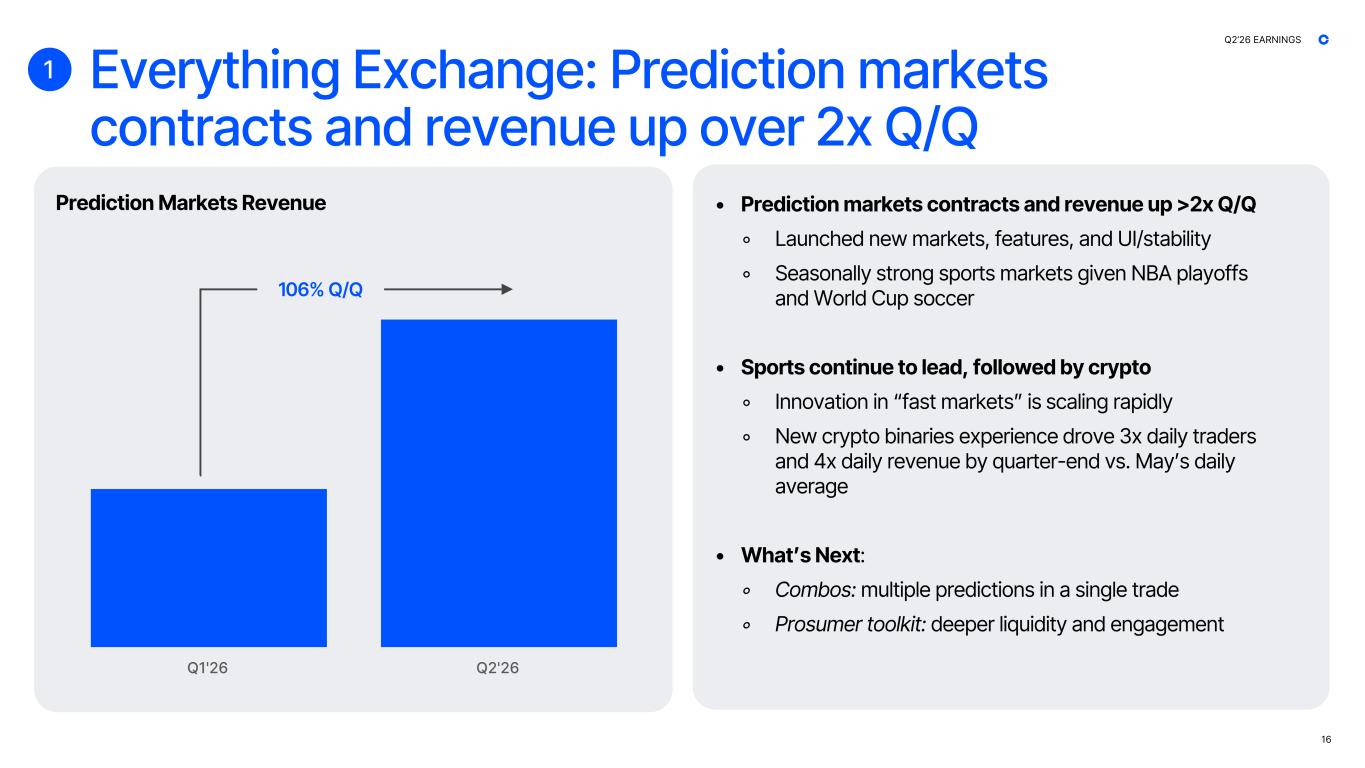
Everything Exchange: Prediction markets contracts and revenue up over 2x Q/Q 16 Q2’26 EARNINGS Q1'26 Q2'26 Prediction Markets Revenue • Prediction markets contracts and revenue up >2x Q/Q ◦ Accelerated momentum by launching new markets & features, and improving UI and platform stability ◦ Volume across sports markets was seasonally strong given NBA playoffs and World Cup soccer • Sports continue to lead, followed by crypto ◦ Driving innovation in “fast markets” which are scaling rapidly ◦ New crypto binaries experience drove 3x increase in traders and 4x increase in revenue at launch • Whatʼs Next: ◦ Combos: bundle multiple predictions into a single trade, across any category on the platform ◦ Prosumer tools: expanding the toolkit to drive deeper liquidity and engagement 106% Q/Q • Prediction markets contracts and revenue up >2x Q/Q ◦ Launched new markets, features, and UI/stability ◦ Seasonally strong sports markets given NBA playoffs and World Cup soccer • Sports continue to lead, followed by crypto ◦ Innovation in “fast markets” is scaling rapidly ◦ New crypto binaries experience drove 3x daily traders and 4x daily revenue by quarter-end vs. Mayʼs daily average • Whatʼs Next: ◦ Combos: multiple predictions in a single trade ◦ Prosumer toolkit: deeper liquidity and engagement 1
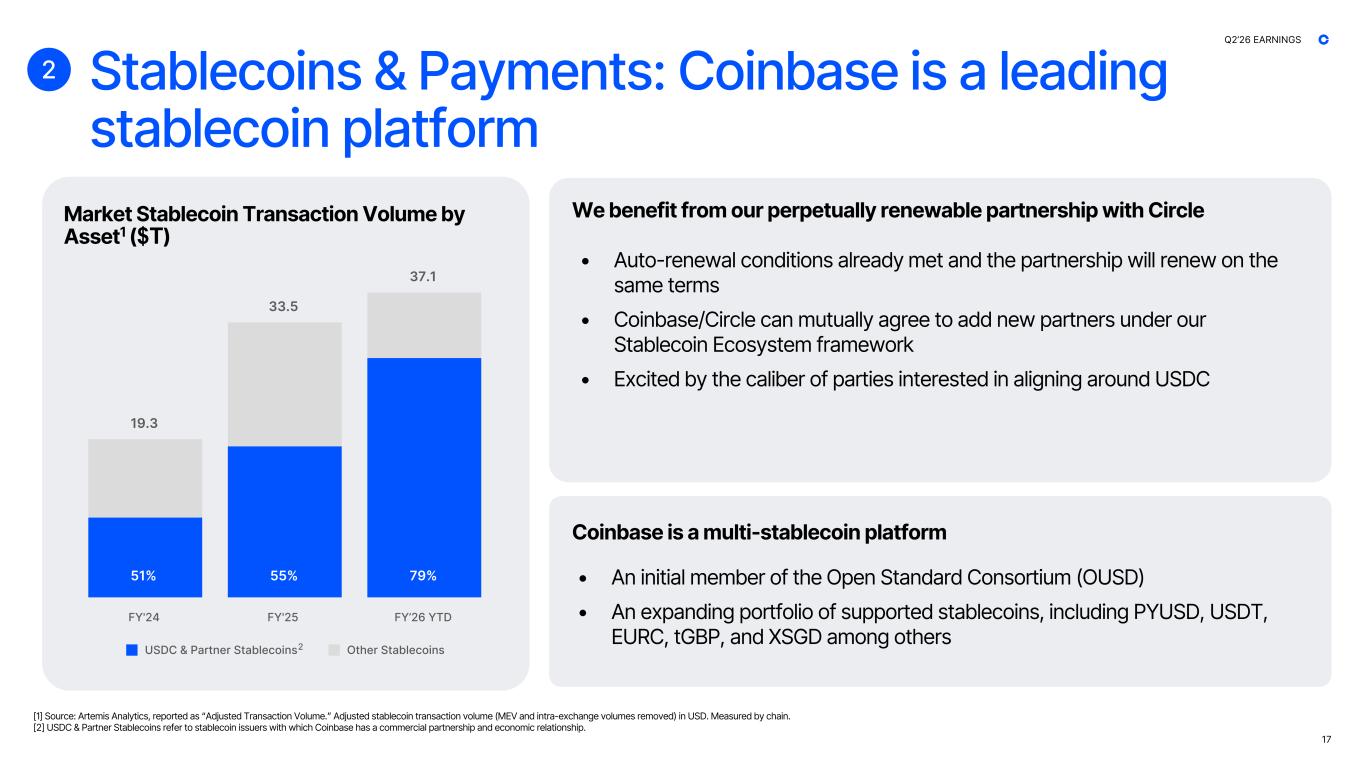
• An initial member of the Open Standard Consortium (OUSD) • An expanding portfolio of supported stablecoins, including PYUSD, USDT, EURC, tGBP, and XSGD among others 19.3 33.5 37.1 51% 55% 79% USDC & Partner Stablecoins Other Stablecoins FY'24 FY'25 FY’26 YTD [1] Source: Artemis Analytics, reported as “Adjusted Transaction Volume.” Adjusted stablecoin transaction volume (MEV and intra-exchange volumes removed) in USD. Measured by chain. [2] USDC & Partner Stablecoins refer to stablecoin issuers with which Coinbase has a commercial partnership and economic relationship. Stablecoins & Payments: Coinbase is a leading stablecoin platform Market Stablecoin Transaction Volume by Asset1 ($T) 17 2 Q2’26 EARNINGS 2 • Auto-renewal conditions already met and the partnership will renew on the same terms • Coinbase/Circle can mutually agree to add new partners under our Stablecoin Ecosystem framework • Excited by the caliber of parties interested in aligning around USDC We benefit from our perpetually renewable partnership with Circle Coinbase is a multi-stablecoin platform
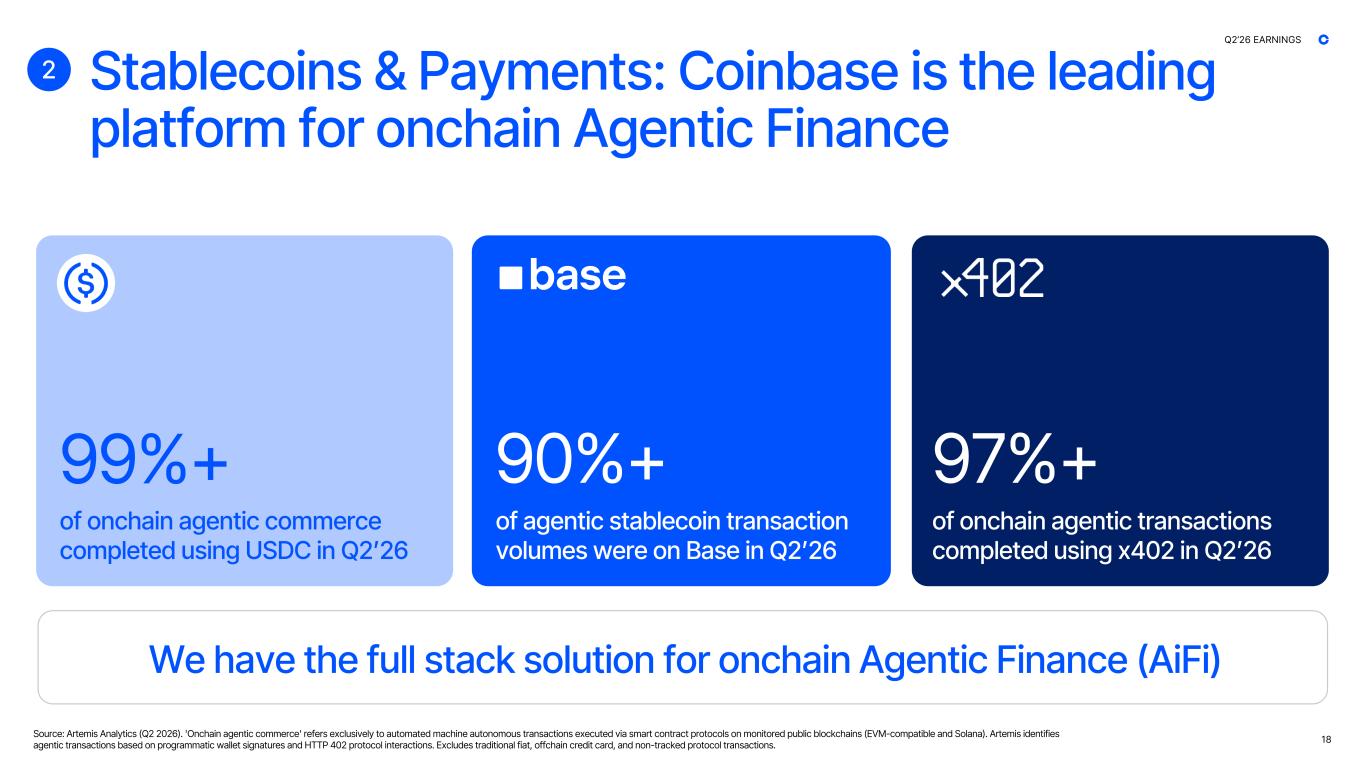
We have the full stack solution for onchain Agentic Finance (AiFi) Stablecoins & Payments: Coinbase is the leading platform for onchain Agentic Finance 99%+ 90%+ 97%+ of agentic stablecoin transaction volumes were on Base in Q2ʼ26 of onchain agentic transactions completed using x402 in Q2ʼ26 of onchain agentic commerce completed using USDC in Q2ʼ26 Source: Artemis Analytics (Q2 2026). 'Onchain agentic commerce' refers exclusively to automated machine autonomous transactions executed via smart contract protocols on monitored public blockchains (EVM-compatible and Solana). Artemis identifies agentic transactions based on programmatic wallet signatures and HTTP 402 protocol interactions. Excludes traditional fiat, offchain credit card, and non-tracked protocol transactions. 18 Q2’26 EARNINGS 2
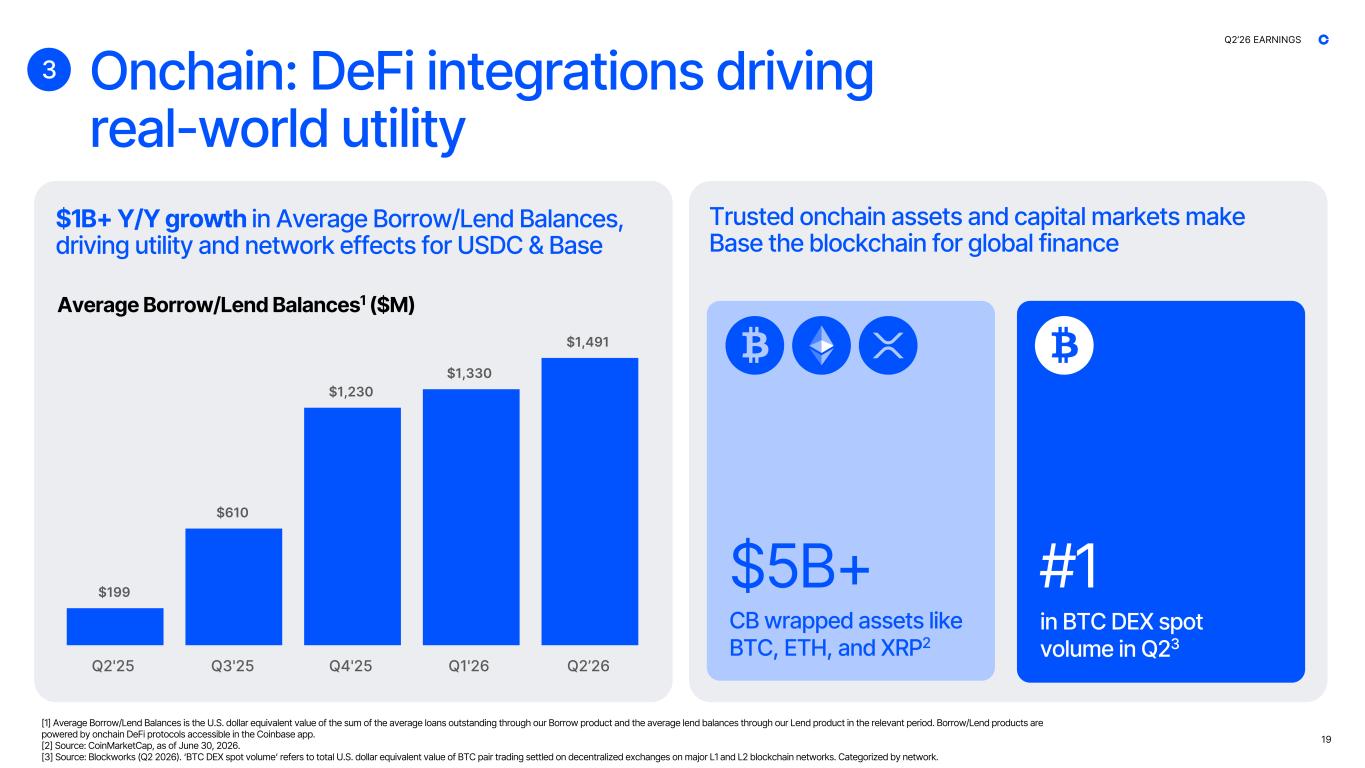
$199 $610 $1,230 $1,330 $1,491 Q2'25 Q3'25 Q4'25 Q1'26 Q2’26 Onchain: DeFi integrations driving real-world utility 3 $1B+ Y/Y growth in Average Borrow/Lend Balances, driving utility and network effects for USDC & Base Average Borrow/Lend Balances1 ($M) [1] Average Borrow/Lend Balances is the U.S. dollar equivalent value of the sum of the average loans outstanding through our Borrow product and the average lend balances through our Lend product in the relevant period. Borrow/Lend products are powered by onchain DeFi protocols accessible in the Coinbase app. [2] Source: CoinMarketCap, as of June 30, 2026. [3] Source: Blockworks (Q2 2026). ‘BTC DEX spot volume‘ refers to total U.S. dollar equivalent value of BTC pair trading settled on decentralized exchanges on major L1 and L2 blockchain networks. Categorized by network. 19 Q2’26 EARNINGS #1 in BTC DEX spot volume in Q23 $5B+ CB wrapped assets like BTC, ETH, and XRP2 Trusted onchain assets and capital markets make Base the blockchain for global finance
The future of finance is onchain, and Coinbase is best positioned to power it The onchain economy has reached escape velocity Coinbase's full stack platform is powering it The next frontier is agentic and on Coinbase 1 32 20 Q2’26 EARNINGS
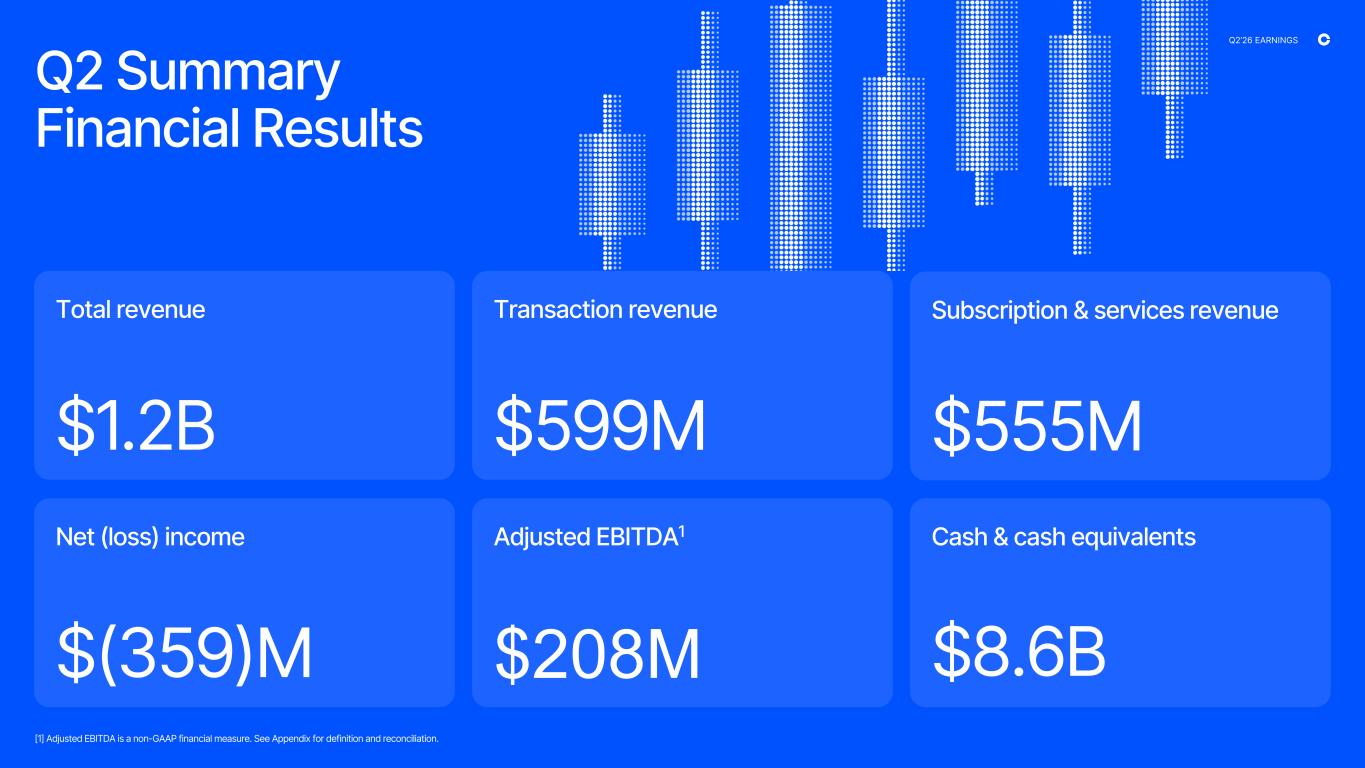
Total revenue $1.2B Transaction revenue $599M Adjusted EBITDA1 $208M Cash & cash equivalents $8.6B Subscription & services revenue $555M [1] Adjusted EBITDA is a non-GAAP financial measure. See Appendix for definition and reconciliation. Net (loss) income $(359)M Q2 Summary Financial Results Q2’26 EARNINGS
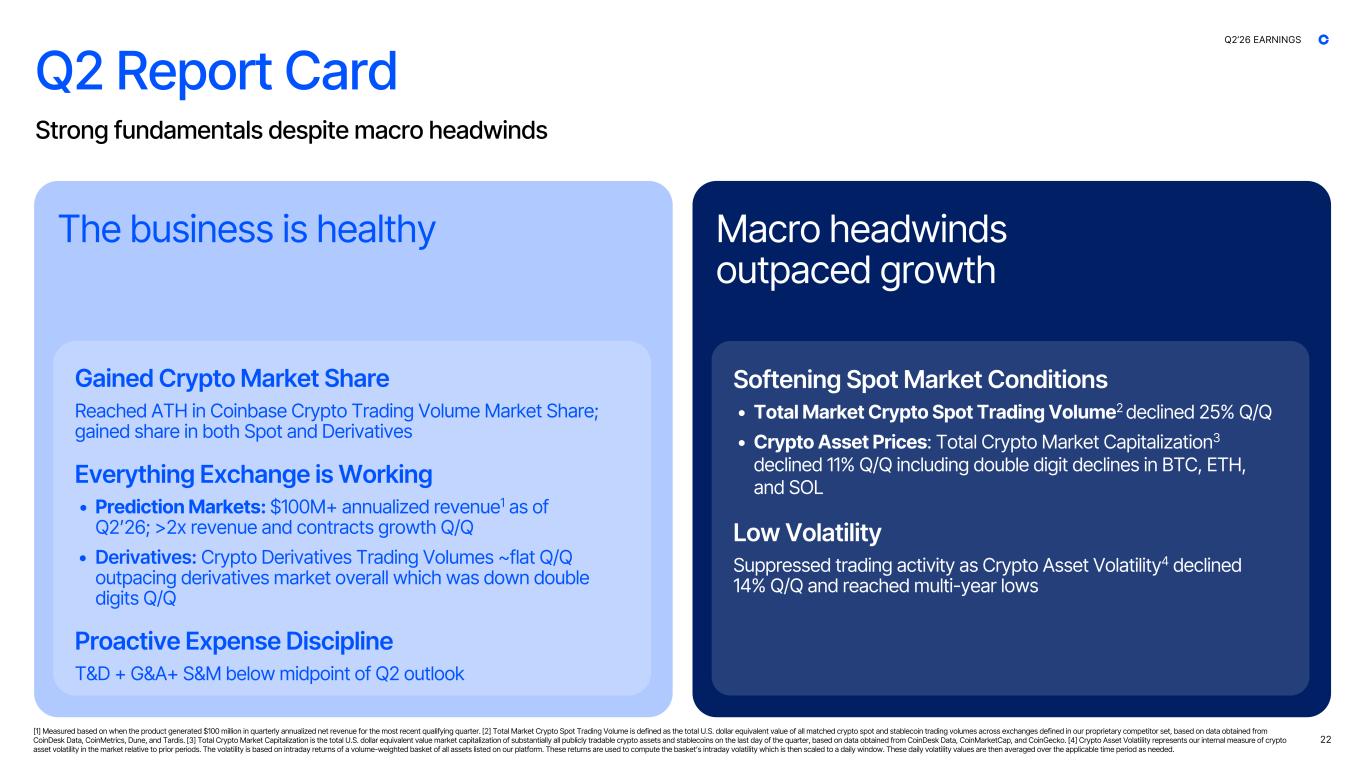
Q2 Report Card Strong fundamentals despite macro headwinds The business is healthy Gained Crypto Market Share Reached ATH in Coinbase Crypto Trading Volume Market Share; gained share in both Spot and Derivatives Everything Exchange is Working • Prediction Markets: $100M+ annualized revenue1 as of Q2ʼ26; >2x revenue and contracts growth Q/Q • Derivatives: Crypto Derivatives Trading Volumes ~flat Q/Q outpacing derivatives market overall which was down double digits Q/Q Proactive Expense Discipline T&D + G&A+ S&M below midpoint of Q2 outlook Macro headwinds outpaced growth Softening Spot Market Conditions • Total Market Crypto Spot Trading Volume2 declined 25% Q/Q • Crypto Asset Prices: Total Crypto Market Capitalization3 declined 11% Q/Q including double digit declines in BTC, ETH, and SOL Low Volatility Suppressed trading activity as Crypto Asset Volatility4 declined 14% Q/Q and reached multi-year lows 22 Q2’26 EARNINGS [1] Measured based on when the product generated $100 million in quarterly annualized net revenue for the most recent qualifying quarter. [2] Total Market Crypto Spot Trading Volume is defined as the total U.S. dollar equivalent value of all matched crypto spot and stablecoin trading volumes across exchanges defined in our proprietary competitor set, based on data obtained from CoinDesk Data, CoinMetrics, Dune, and Tardis. [3] Total Crypto Market Capitalization is the total U.S. dollar equivalent value market capitalization of substantially all publicly tradable crypto assets and stablecoins on the last day of the quarter, based on data obtained from CoinDesk Data, CoinMarketCap, and CoinGecko. [4] Crypto Asset Volatility represents our internal measure of crypto asset volatility in the market relative to prior periods. The volatility is based on intraday returns of a volume-weighted basket of all assets listed on our platform. These returns are used to compute the basketʼs intraday volatility which is then scaled to a daily window. These daily volatility values are then averaged over the applicable time period as needed.
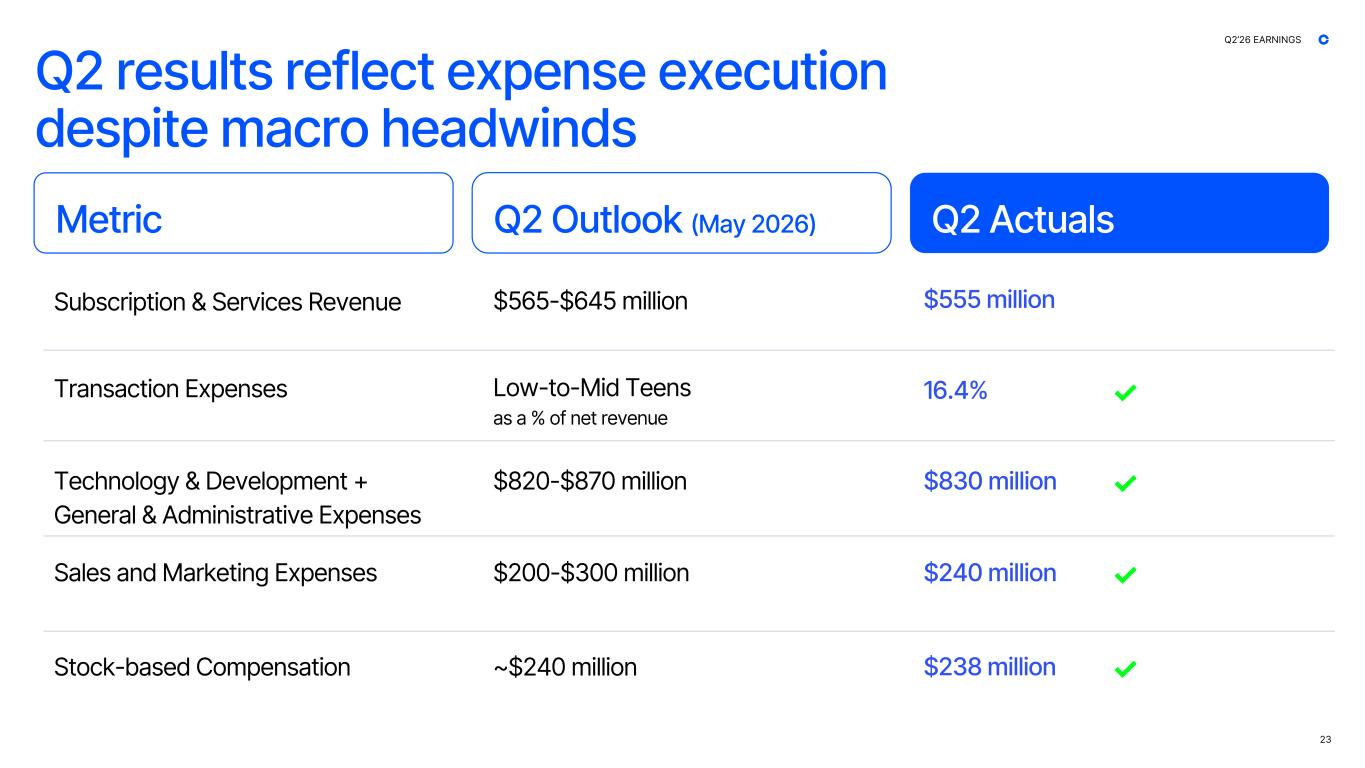
Q2 results reflect expense execution despite macro headwinds Metric Q2 Outlook (May 2026) Q2 Actuals Subscription & Services Revenue Transaction Expenses Technology & Development + General & Administrative Expenses Sales and Marketing Expenses Stock-based Compensation $565-$645 million Low-to-Mid Teens as a % of net revenue $200-$300 million $820-$870 million ~$240 million $555 million 16.4% $240 million $830 million $238 million ✓ ✓ ✓ ✓ 23 Q2’26 EARNINGS
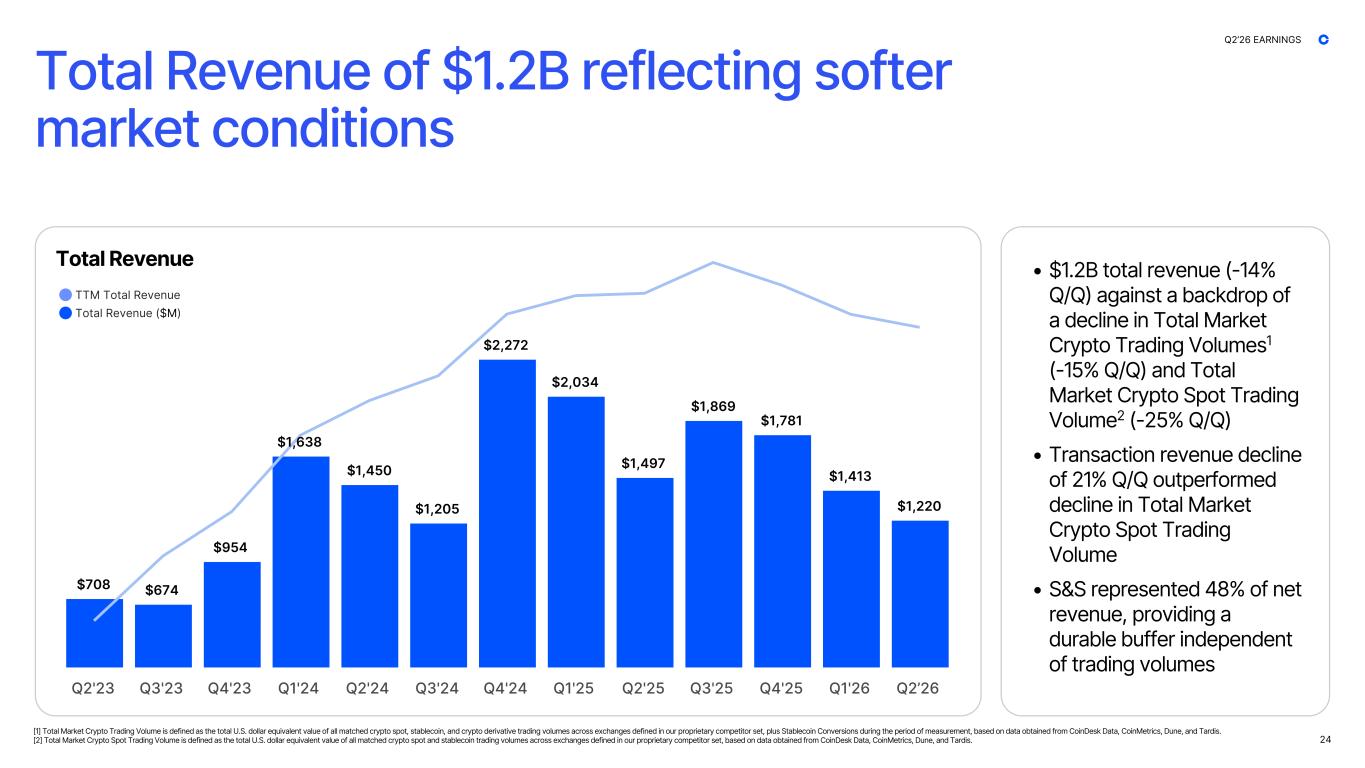
$708 $674 $954 $1,638 $1,450 $1,205 $2,272 $2,034 $1,497 $1,869 $1,781 $1,413 $1,220 Q2'23 Q3'23 Q4'23 Q1'24 Q2'24 Q3'24 Q4'24 Q1'25 Q2'25 Q3'25 Q4'25 Q1'26 Q2’26 Total Revenue 24 • $1.2B total revenue (-14% Q/Q) against a backdrop of a decline in Total Market Crypto Trading Volumes1 (-15% Q/Q) and Total Market Crypto Spot Trading Volume2 (-25% Q/Q) • Transaction revenue decline of 21% Q/Q outperformed decline in Total Market Crypto Spot Trading Volume • S&S represented 48% of net revenue, providing a durable buffer independent of trading volumes TTM Total Revenue Total Revenue ($M) Q2’26 EARNINGS Total Revenue of $1.2B reflecting softer market conditions [1] Total Market Crypto Trading Volume is defined as the total U.S. dollar equivalent value of all matched crypto spot, stablecoin, and crypto derivative trading volumes across exchanges defined in our proprietary competitor set, plus Stablecoin Conversions during the period of measurement, based on data obtained from CoinDesk Data, CoinMetrics, Dune, and Tardis. [2] Total Market Crypto Spot Trading Volume is defined as the total U.S. dollar equivalent value of all matched crypto spot and stablecoin trading volumes across exchanges defined in our proprietary competitor set, based on data obtained from CoinDesk Data, CoinMetrics, Dune, and Tardis.
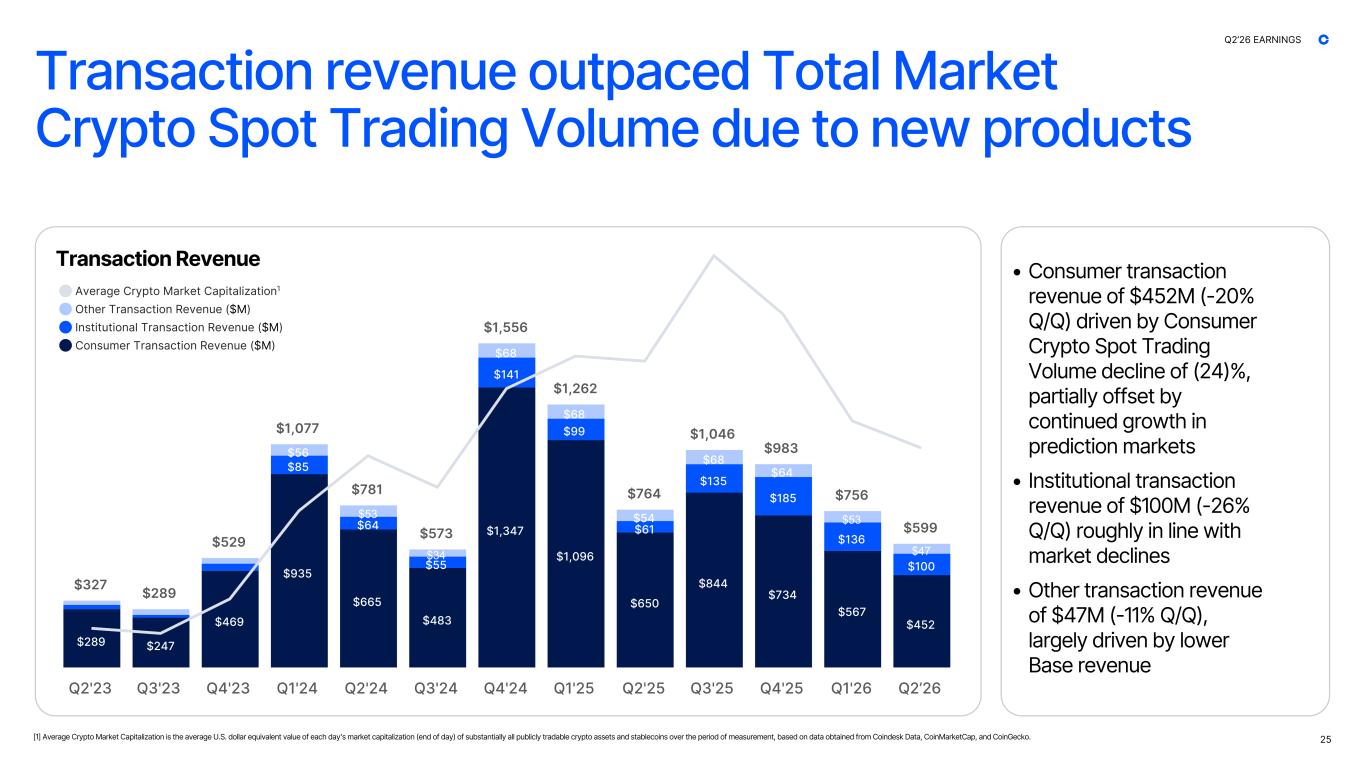
Transaction revenue outpaced Total Market Crypto Spot Trading Volume due to new products Transaction Revenue 25 • Consumer transaction revenue of $452M (-20% Q/Q) driven by Consumer Crypto Spot Trading Volume decline of (24)%, partially offset by continued growth in prediction markets • Institutional transaction revenue of $100M (-26% Q/Q) roughly in line with market declines • Other transaction revenue of $47M (-11% Q/Q), largely driven by lower Base revenue $327 $289 $529 $1,077 $781 $573 $1,556 $1,262 $764 $1,046 $983 $756 $599 $289 $247 $469 $935 $665 $483 $1,347 $1,096 $650 $844 $734 $567 $452 $85 $64 $55 $141 $99 $61 $135 $185 $136 $100 $56 $53 $34 $68 $68 $54 $68 $64 $53 $47 Q2'23 Q3'23 Q4'23 Q1'24 Q2'24 Q3'24 Q4'24 Q1'25 Q2'25 Q3'25 Q4'25 Q1'26 Q2’26 Average Crypto Market Capitalization1 Other Transaction Revenue ($M) Institutional Transaction Revenue ($M) Consumer Transaction Revenue ($M) Q2’26 EARNINGS [1] Average Crypto Market Capitalization is the average U.S. dollar equivalent value of each day's market capitalization (end of day) of substantially all publicly tradable crypto assets and stablecoins over the period of measurement, based on data obtained from Coindesk Data, CoinMarketCap, and CoinGecko.
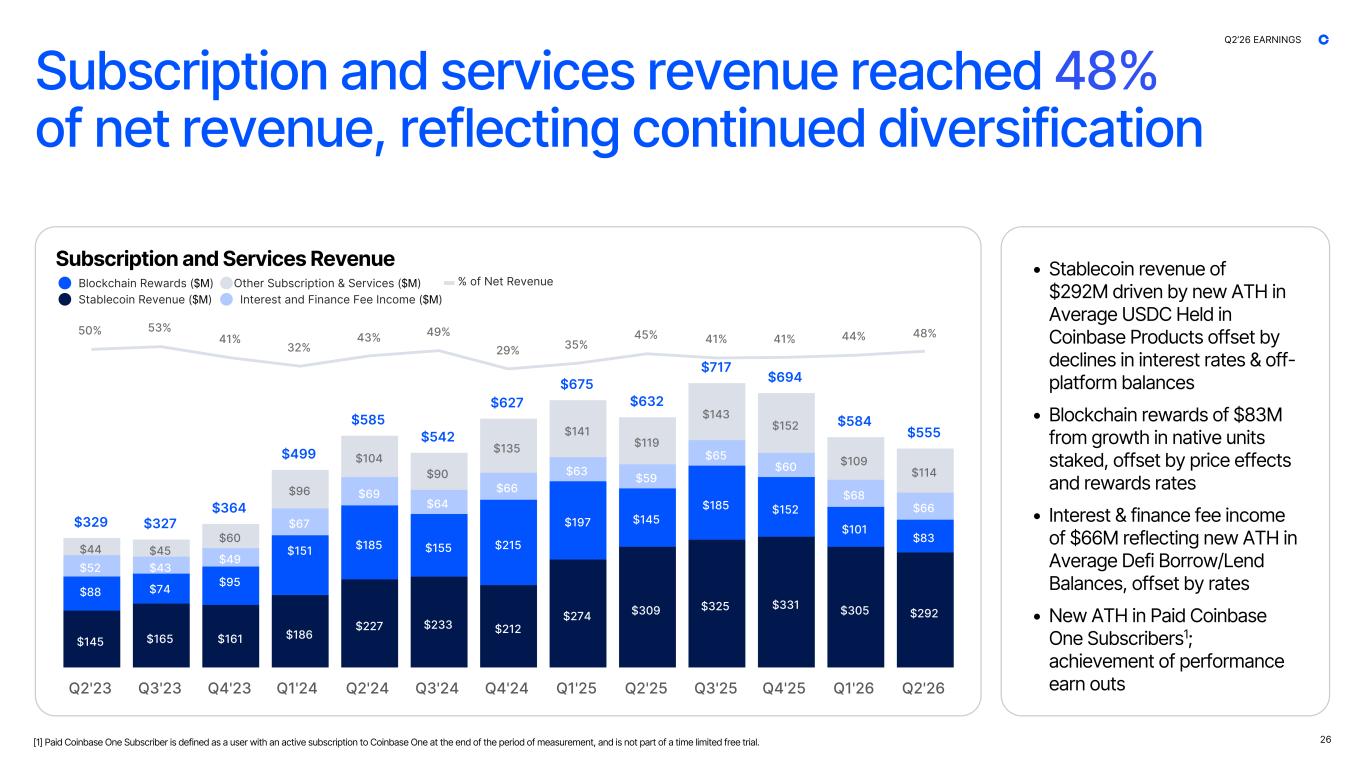
Subscription and services revenue reached 48% of net revenue, reflecting continued diversification Subscription and Services Revenue 26 $329 $327 $364 $499 $585 $542 $627 $675 $632 $717 $694 $584 $555 $145 $165 $161 $186 $227 $233 $212 $274 $309 $325 $331 $305 $292 $88 $74 $95 $151 $185 $155 $215 $197 $145 $185 $152 $101 $83 $52 $43 $49 $67 $69 $64 $66 $63 $59 $65 $60 $68 $66 $44 $45 $60 $96 $104 $90 $135 $141 $119 $143 $152 $109 $114 50% 53% 41% 32% 43% 49% 29% 35% 45% 41% 41% 44% 48% Q2'23 Q3'23 Q4'23 Q1'24 Q2'24 Q3'24 Q4'24 Q1'25 Q2'25 Q3'25 Q4'25 Q1'26 Q2'26 % of Net RevenueOther Subscription & Services ($M) Interest and Finance Fee Income ($M) Blockchain Rewards ($M) • Stablecoin revenue of $292M driven by new ATH in Average USDC Held in Coinbase Products offset by declines in interest rates & off- platform balances • Blockchain rewards of $83M from growth in native units staked, offset by price effects and rewards rates • Interest & finance fee income of $66M reflecting new ATH in Average Defi Borrow/Lend Balances, offset by rates • New ATH in Paid Coinbase One Subscribers1; achievement of performance earn outs Stablecoin Revenue ($M) Q2’26 EARNINGS [1] Paid Coinbase One Subscriber is defined as a user with an active subscription to Coinbase One at the end of the period of measurement, and is not part of a time limited free trial.
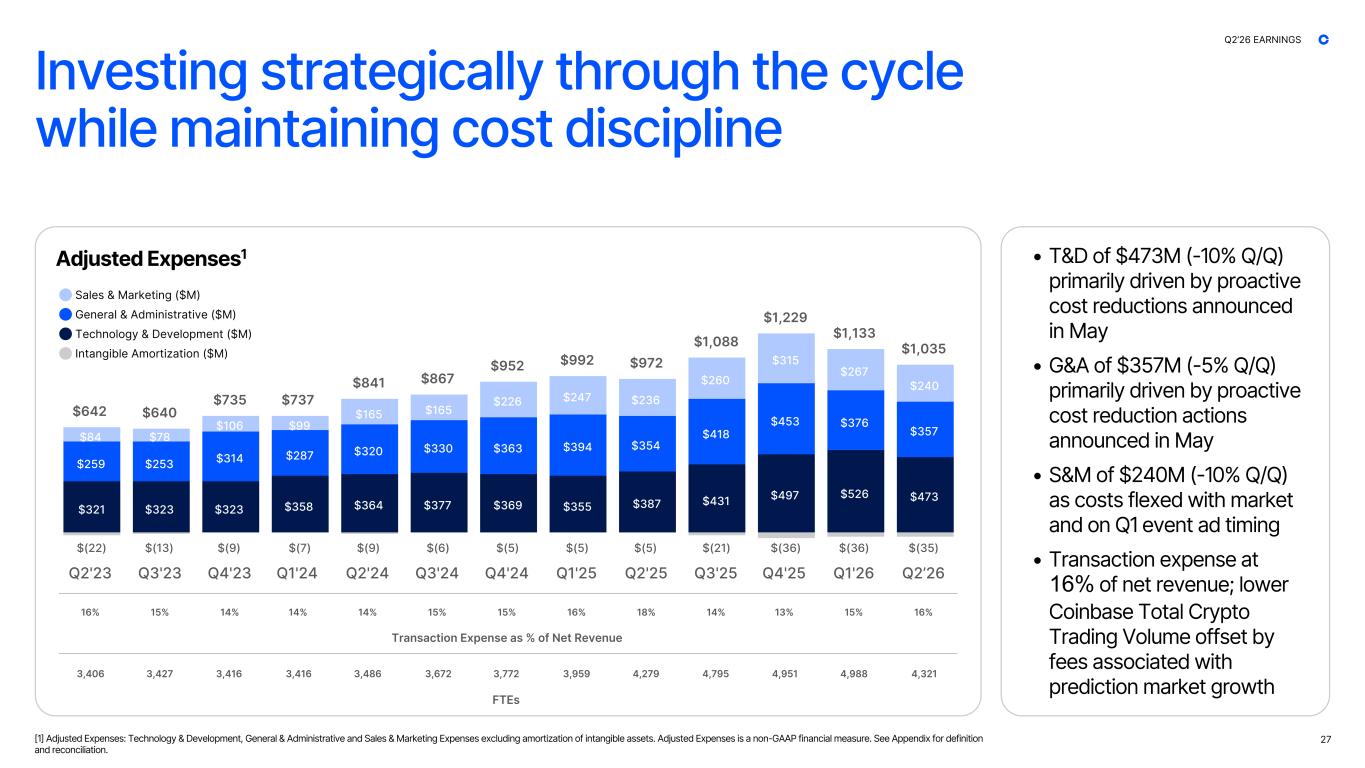
Investing strategically through the cycle while maintaining cost discipline Adjusted Expenses1 27 • T&D of $473M (-10% Q/Q) primarily driven by proactive cost reductions announced in May • G&A of $357M (-5% Q/Q) primarily driven by proactive cost reduction actions announced in May • S&M of $240M (-10% Q/Q) as costs flexed with market and on Q1 event ad timing • Transaction expense at 16% of net revenue; lower Coinbase Total Crypto Trading Volume offset by fees associated with prediction market growth $642 $640 $735 $737 $841 $867 $952 $992 $972 $1,088 $1,229 $1,133 $1,035 $321 $323 $323 $358 $364 $377 $369 $355 $387 $431 $497 $526 $473 $259 $253 $314 $287 $320 $330 $363 $394 $354 $418 $453 $376 $357$84 $78 $106 $99 $165 $165 $226 $247 $236 $260 $315 $267 $240 $(22) $(13) $(9) $(7) $(9) $(6) $(5) $(5) $(5) $(21) $(36) $(36) $(35) Q2'23 Q3'23 Q4'23 Q1'24 Q2'24 Q3'24 Q4'24 Q1'25 Q2'25 Q3'25 Q4'25 Q1'26 Q2’26 Intangible Amortization ($M) Sales & Marketing ($M) General & Administrative ($M) Technology & Development ($M) Q2’26 EARNINGS Transaction Expense as % of Net Revenue 16% 15% 14% 14% 14% 15% 15% 16% 18% 14% 13% 15% 16% [1] Adjusted Expenses: Technology & Development, General & Administrative and Sales & Marketing Expenses excluding amortization of intangible assets. Adjusted Expenses is a non-GAAP financial measure. See Appendix for definition and reconciliation. FTEs 3,406 3,427 3,416 3,416 3,486 3,672 3,772 3,959 4,279 4,795 4,951 4,988 4,321
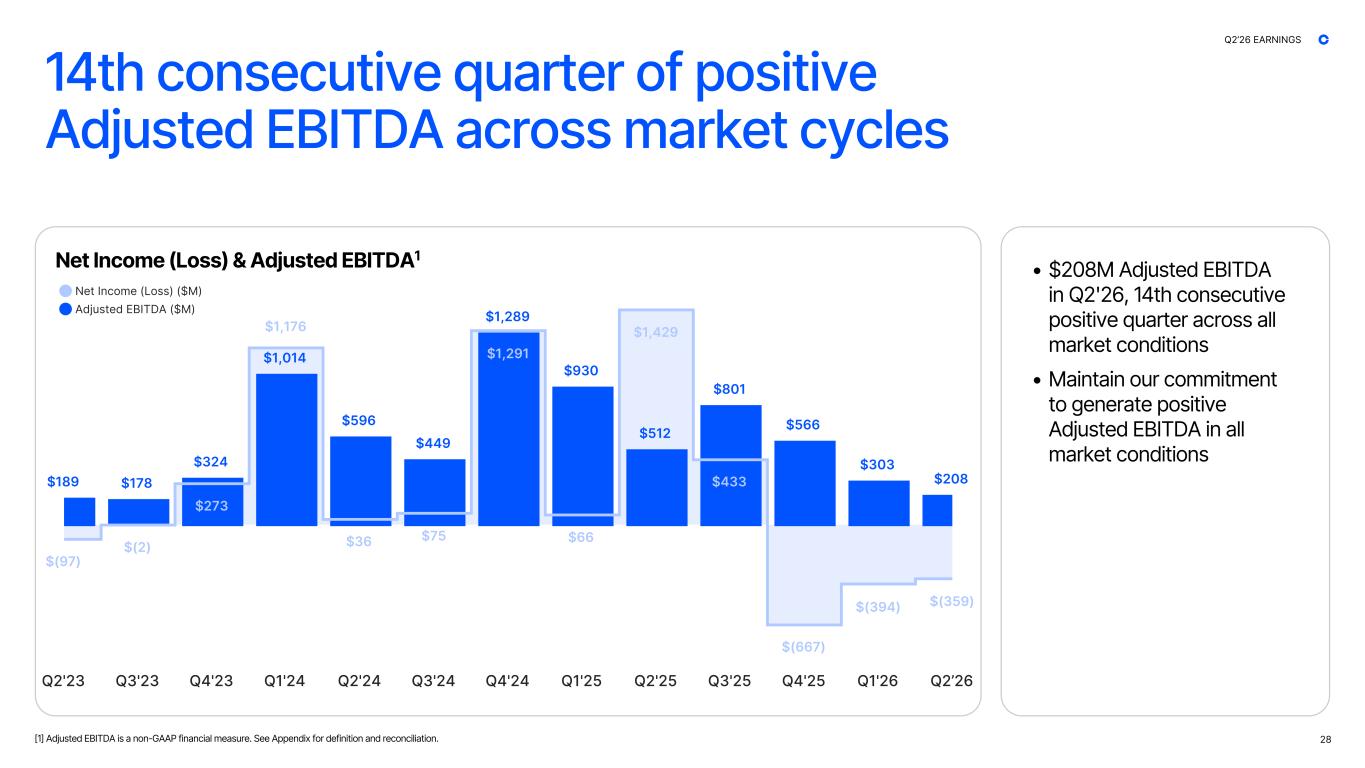
14th consecutive quarter of positive Adjusted EBITDA across market cycles Net Income (Loss) & Adjusted EBITDA1 [1] Adjusted EBITDA is a non-GAAP financial measure. See Appendix for definition and reconciliation. 28 • $208M Adjusted EBITDA in Q2'26, 14th consecutive positive quarter across all market conditions • Maintain our commitment to generate positive Adjusted EBITDA in all market conditions Net Income (Loss) ($M) Adjusted EBITDA ($M) Q2’26 EARNINGS $189 $178 $324 $1,014 $596 $449 $1,289 $930 $512 $801 $566 $303 $208 Q2'23 Q3'23 Q4'23 Q1'24 Q2'24 Q3'24 Q4'24 Q1'25 Q2'25 Q3'25 Q4'25 Q1'26 Q2’26 $(97) $(2) $273 $1,176 $36 $75 $1,291 $66 $1,429 $433 $(667) $(394) $(359)
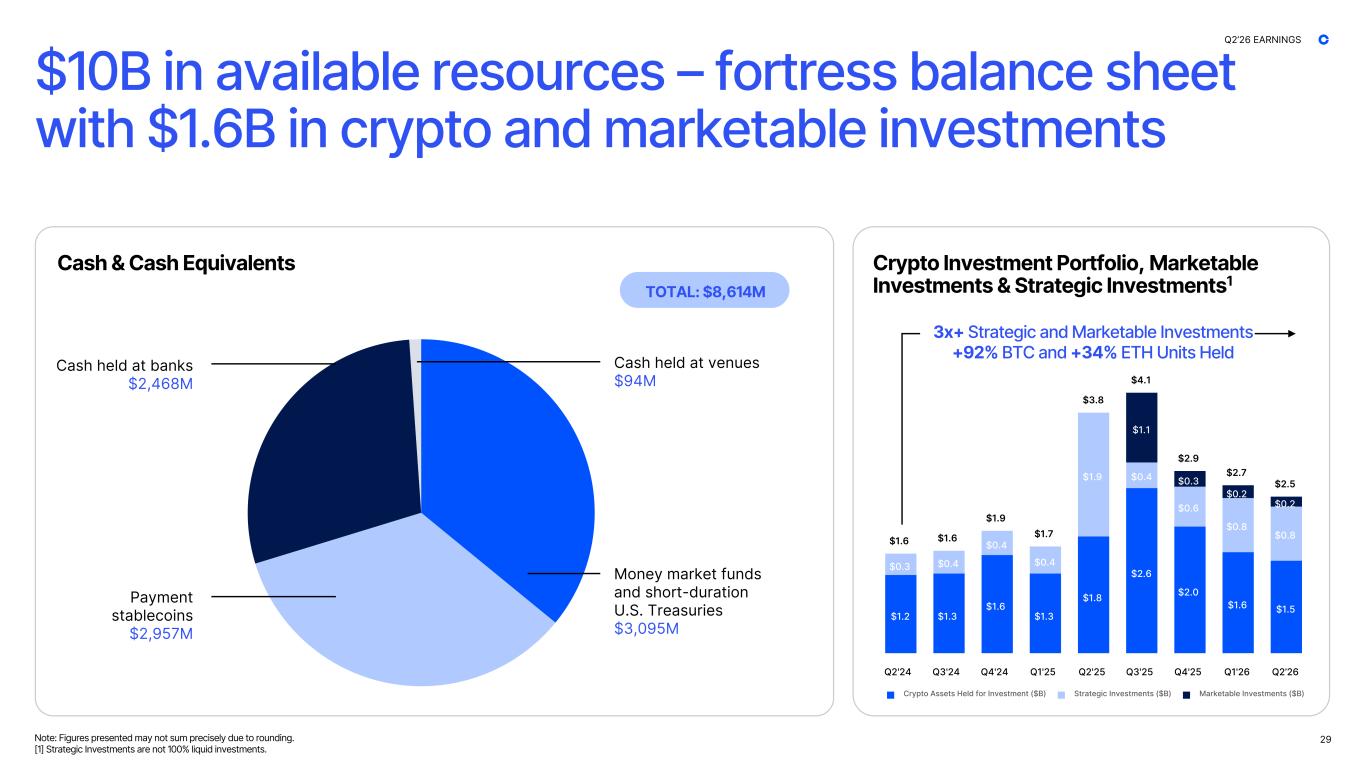
$1.6 $1.6 $1.9 $1.7 $3.8 $4.1 $2.9 $2.7 $2.5 $1.2 $1.3 $1.6 $1.3 $1.8 $2.6 $2.0 $1.6 $1.5 $0.3 $0.4 $0.4 $0.4 $1.9 $0.4 $0.6 $0.8 $0.8 $1.1 $0.3 $0.2 $0.2 Crypto Assets Held for Investment ($B) Strategic Investments ($B) Marketable Investments ($B) Q2'24 Q3'24 Q4'24 Q1'25 Q2'25 Q3'25 Q4'25 Q1'26 Q2’26 $10B in available resources – fortress balance sheet with $1.6B in crypto and marketable investments 3x+ Strategic and Marketable Investments +92% BTC and +34% ETH Units Held TOTAL: $8,614M Money market funds and short-duration U.S. Treasuries $3,095M Payment stablecoins $2,957M Cash held at banks $2,468M Cash held at venues $94M Cash & Cash Equivalents Crypto Investment Portfolio, Marketable Investments & Strategic Investments1 Note: Figures presented may not sum precisely due to rounding. [1] Strategic Investments are not 100% liquid investments. 29 Q2’26 EARNINGS
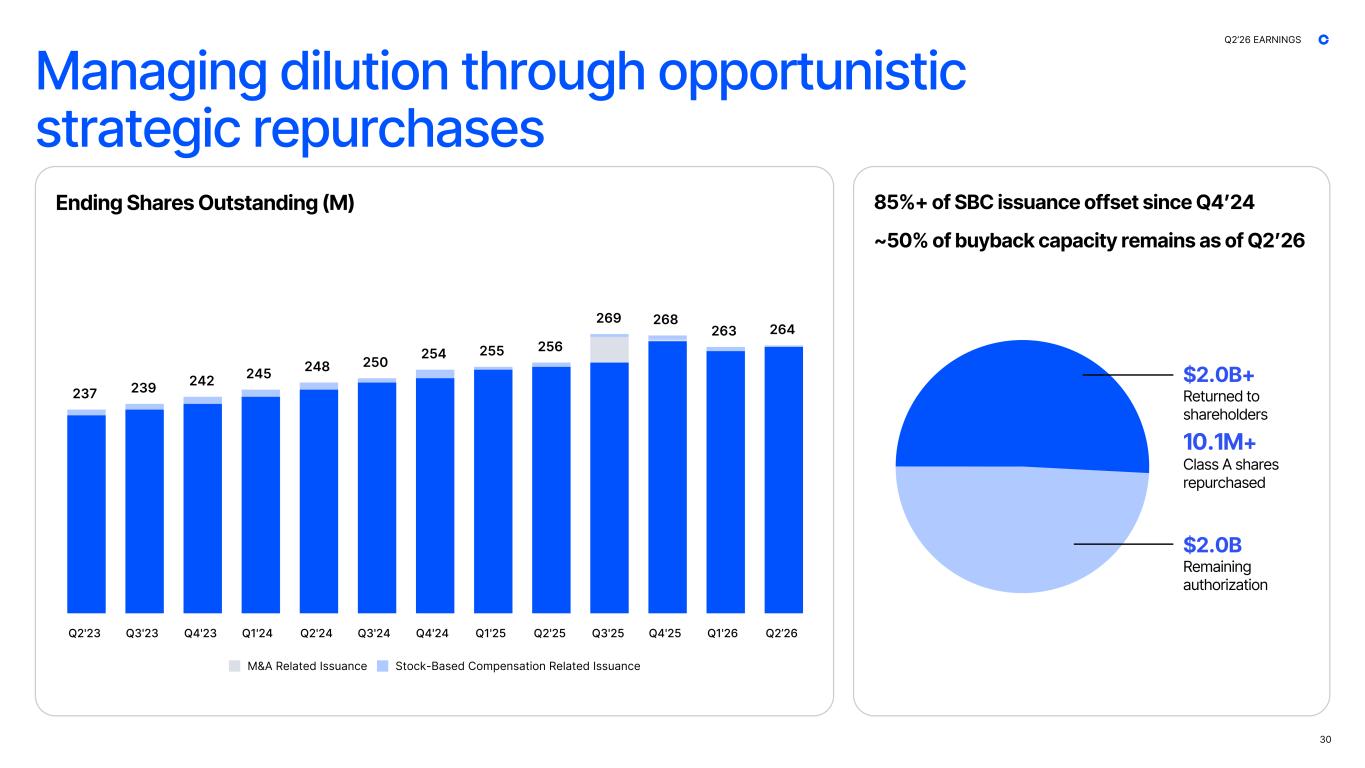
Managing dilution through opportunistic strategic repurchases Ending Shares Outstanding (M) $2.0B+ Returned to shareholders 10.1M+ Class A shares repurchased $2.0B Remaining authorization 85%+ of SBC issuance offset since Q4ʼ24 ~50% of buyback capacity remains as of Q2ʼ26 30 237 239 242 245 248 250 254 255 256 269 268 263 264 M&A Related Issuance Stock-Based Compensation Related Issuance Q2'23 Q3'23 Q4'23 Q1'24 Q2'24 Q3'24 Q4'24 Q1'25 Q2'25 Q3'25 Q4'25 Q1'26 Q2’26 Q2’26 EARNINGS
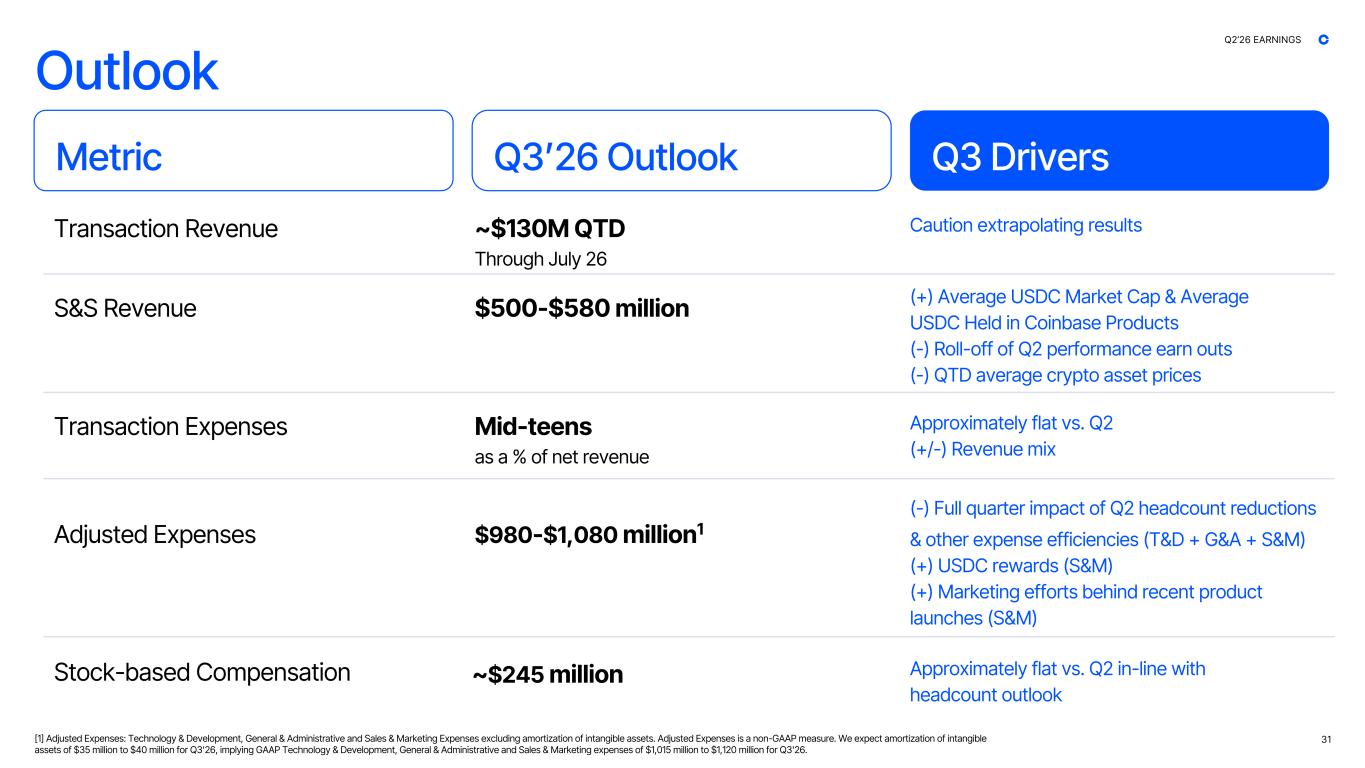
Outlook Metric Q3ʼ26 Outlook Q3 Drivers Transaction Revenue S&S Revenue Transaction Expenses Adjusted Expenses Stock-based Compensation ~$130M QTD Through July 26 $500-$580 million Mid-teens as a % of net revenue $980-$1,080 million1 ~$245 million Caution extrapolating results (+) Average USDC Market Cap & Average USDC Held in Coinbase Products (-) Roll-off of Q2 performance earn outs (-) QTD average crypto asset prices Approximately flat vs. Q2 (+/-) Revenue mix (-) Full quarter impact of Q2 headcount reductions & other expense efficiencies (T&D + G&A + S&M) (+) USDC rewards (S&M) (+) Marketing efforts behind recent product launches (S&M) Approximately flat vs. Q2 in-line with headcount outlook 31 Q2’26 EARNINGS [1] Adjusted Expenses: Technology & Development, General & Administrative and Sales & Marketing Expenses excluding amortization of intangible assets. Adjusted Expenses is a non-GAAP measure. We expect amortization of intangible assets of $35 million to $40 million for Q3'26, implying GAAP Technology & Development, General & Administrative and Sales & Marketing expenses of $1,015 million to $1,120 million for Q3'26.
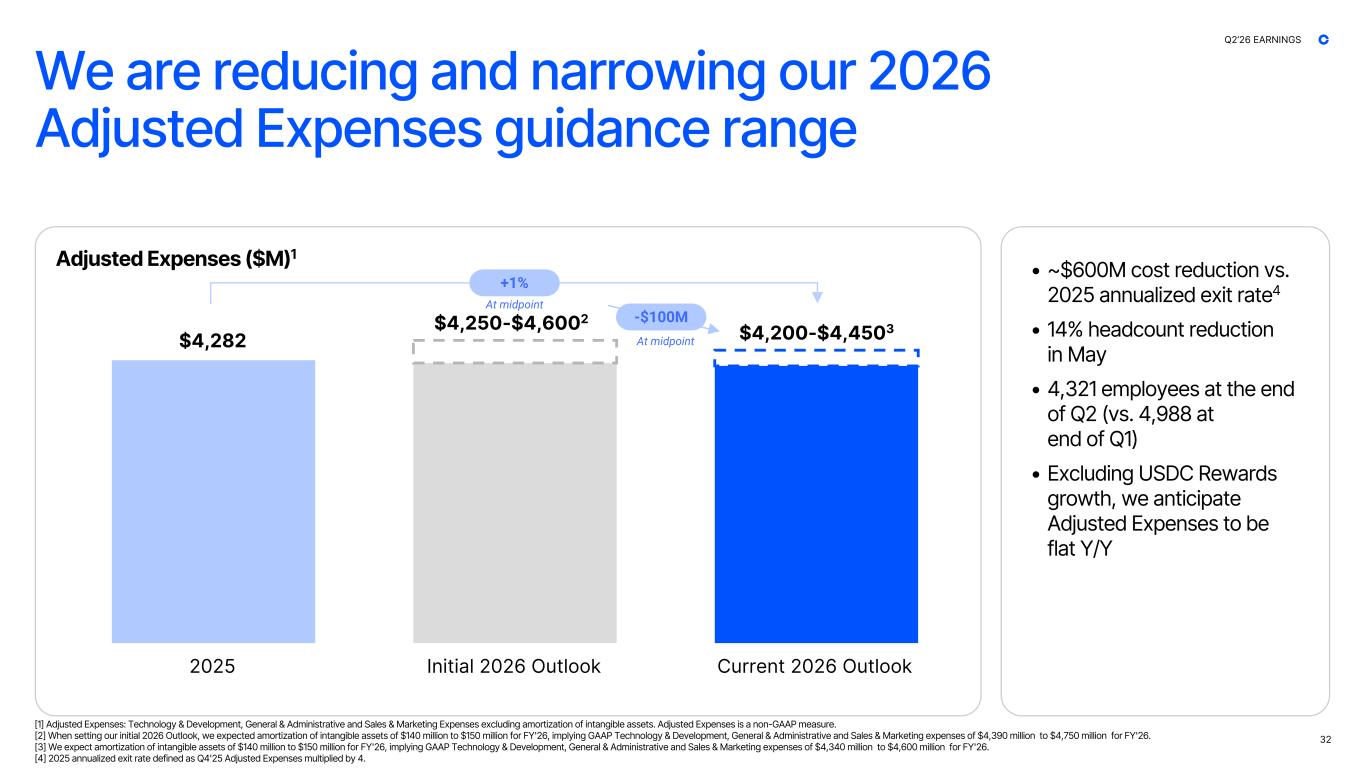
$4,282 $4,600 $4,450 2025 Initial 2026 Outlook Current 2026 Outlook We are reducing and narrowing our 2026 Adjusted Expenses guidance range Adjusted Expenses ($M)1 [1] Adjusted Expenses: Technology & Development, General & Administrative and Sales & Marketing Expenses excluding amortization of intangible assets. Adjusted Expenses is a non-GAAP measure. [2] When setting our initial 2026 Outlook, we expected amortization of intangible assets of $140 million to $150 million for FY'26, implying GAAP Technology & Development, General & Administrative and Sales & Marketing expenses of $4,390 million to $4,750 million for FY'26. [3] We expect amortization of intangible assets of $140 million to $150 million for FY'26, implying GAAP Technology & Development, General & Administrative and Sales & Marketing expenses of $4,340 million to $4,600 million for FY'26. [4] 2025 annualized exit rate defined as Q4'25 Adjusted Expenses multiplied by 4. $4,200-$4,4503 -$100M At midpoint 32 • ~$600M cost reduction vs. 2025 annualized exit rate4 • 14% headcount reduction in May • 4,321 employees at the end of Q2 (vs. 4,988 at end of Q1) • Excluding USDC Rewards growth, we anticipate Adjusted Expenses to be flat Y/Y Q2’26 EARNINGS $4,250-$4,6002 +1% At midpoint

Appendix
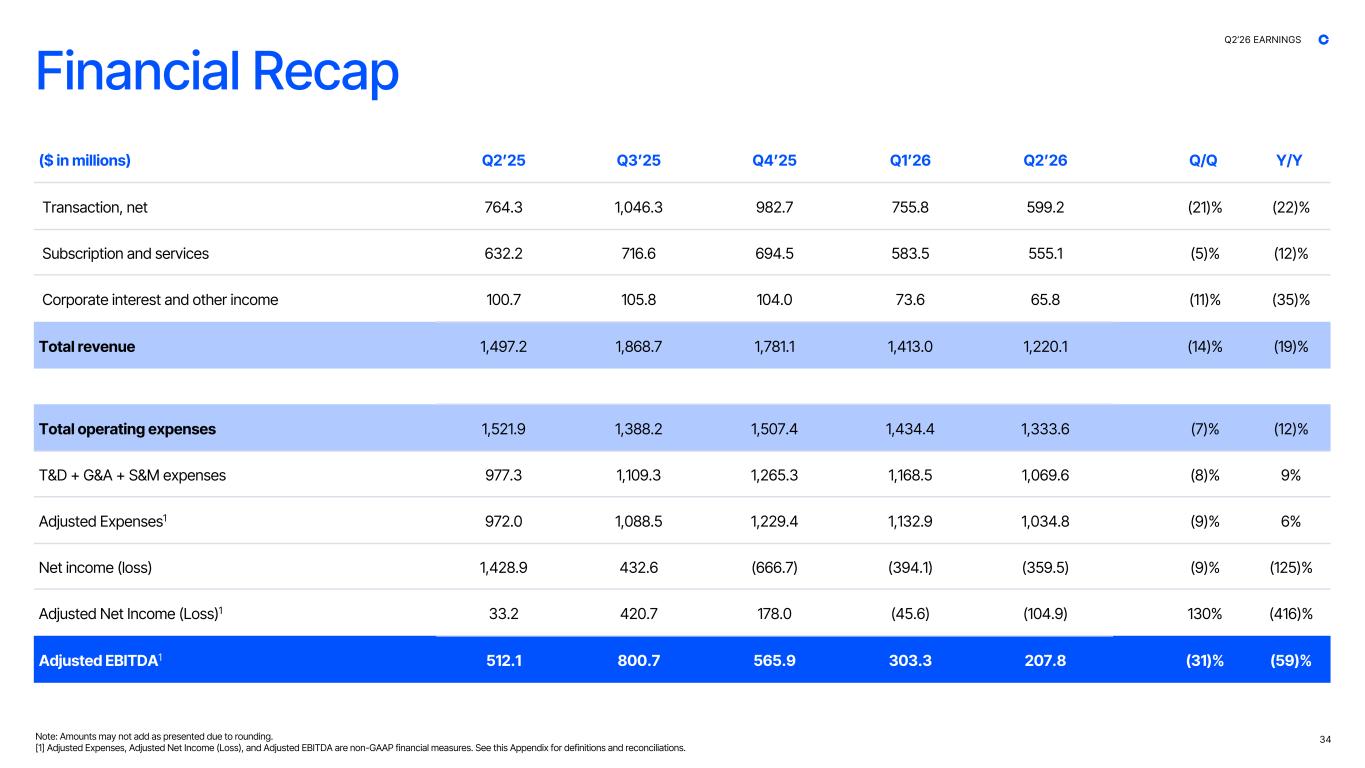
Financial Recap ($ in millions) Q2ʼ25 Q3ʼ25 Q4ʼ25 Q1ʼ26 Q2ʼ26 Q/Q Y/Y Transaction, net 764.3 1,046.3 982.7 755.8 599.2 (21)% (22)% Subscription and services 632.2 716.6 694.5 583.5 555.1 (5)% (12)% Corporate interest and other income 100.7 105.8 104.0 73.6 65.8 (11)% (35)% Total revenue 1,497.2 1,868.7 1,781.1 1,413.0 1,220.1 (14)% (19)% Total operating expenses 1,521.9 1,388.2 1,507.4 1,434.4 1,333.6 (7)% (12)% T&D + G&A + S&M expenses 977.3 1,109.3 1,265.3 1,168.5 1,069.6 (8)% 9% Adjusted Expenses1 972.0 1,088.5 1,229.4 1,132.9 1,034.8 (9)% 6% Net income (loss) 1,428.9 432.6 (666.7) (394.1) (359.5) (9)% (125)% Adjusted Net Income (Loss)1 33.2 420.7 178.0 (45.6) (104.9) 130% (416)% Adjusted EBITDA1 512.1 800.7 565.9 303.3 207.8 (31)% (59)% Note: Amounts may not add as presented due to rounding. [1] Adjusted Expenses, Adjusted Net Income (Loss), and Adjusted EBITDA are non-GAAP financial measures. See this Appendix for definitions and reconciliations. 34 Q2’26 EARNINGS
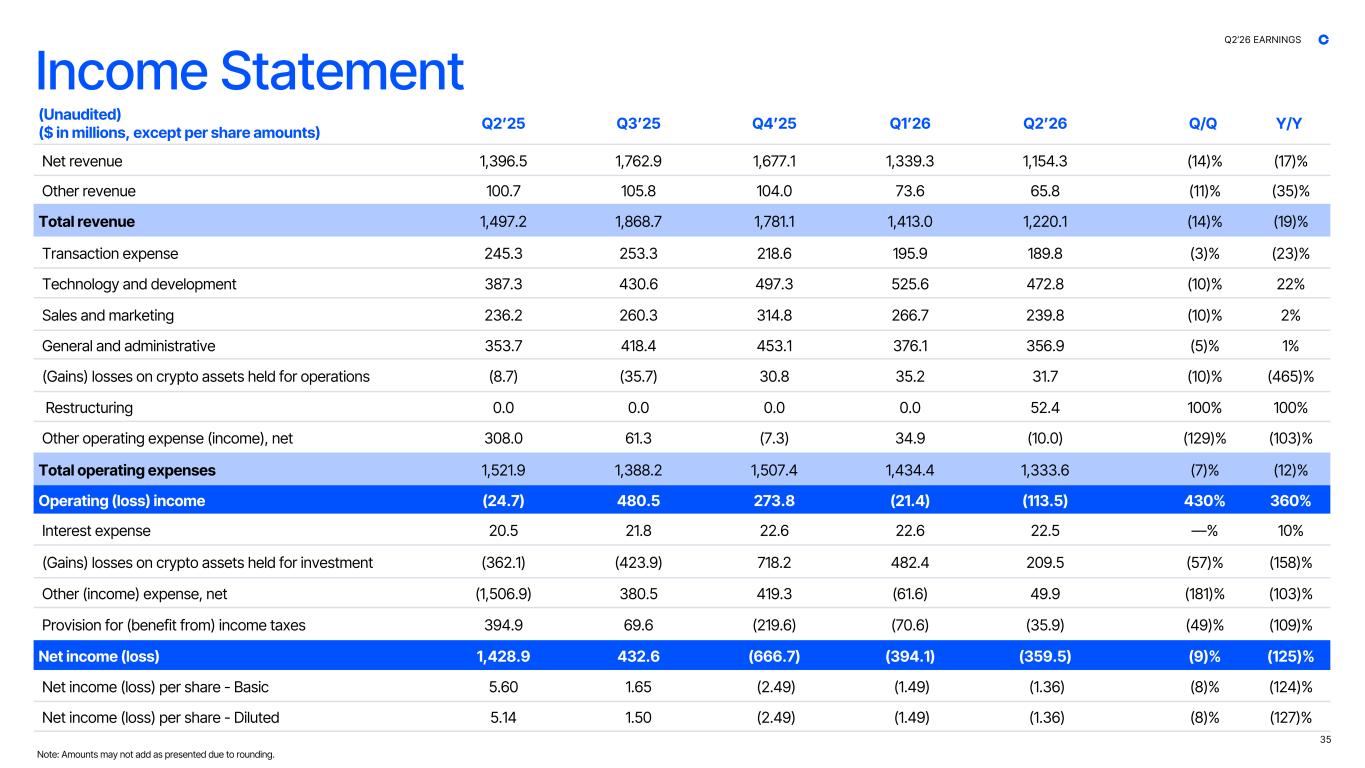
Income Statement (Unaudited) ($ in millions, except per share amounts) Q2ʼ25 Q3ʼ25 Q4ʼ25 Q1ʼ26 Q2ʼ26 Q/Q Y/Y Net revenue 1,396.5 1,762.9 1,677.1 1,339.3 1,154.3 (14)% (17)% Other revenue 100.7 105.8 104.0 73.6 65.8 (11)% (35)% Total revenue 1,497.2 1,868.7 1,781.1 1,413.0 1,220.1 (14)% (19)% Transaction expense 245.3 253.3 218.6 195.9 189.8 (3)% (23)% Technology and development 387.3 430.6 497.3 525.6 472.8 (10)% 22% Sales and marketing 236.2 260.3 314.8 266.7 239.8 (10)% 2% General and administrative 353.7 418.4 453.1 376.1 356.9 (5)% 1% (Gains) losses on crypto assets held for operations (8.7) (35.7) 30.8 35.2 31.7 (10)% (465)% Restructuring 0.0 0.0 0.0 0.0 52.4 100% 100% Other operating expense (income), net 308.0 61.3 (7.3) 34.9 (10.0) (129)% (103)% Total operating expenses 1,521.9 1,388.2 1,507.4 1,434.4 1,333.6 (7)% (12)% Operating (loss) income (24.7) 480.5 273.8 (21.4) (113.5) 430% 360% Interest expense 20.5 21.8 22.6 22.6 22.5 —% 10% (Gains) losses on crypto assets held for investment (362.1) (423.9) 718.2 482.4 209.5 (57)% (158)% Other (income) expense, net (1,506.9) 380.5 419.3 (61.6) 49.9 (181)% (103)% Provision for (benefit from) income taxes 394.9 69.6 (219.6) (70.6) (35.9) (49)% (109)% Net income (loss) 1,428.9 432.6 (666.7) (394.1) (359.5) (9)% (125)% Net income (loss) per share - Basic 5.60 1.65 (2.49) (1.49) (1.36) (8)% (124)% Net income (loss) per share - Diluted 5.14 1.50 (2.49) (1.49) (1.36) (8)% (127)% 35 Note: Amounts may not add as presented due to rounding. Q2’26 EARNINGS
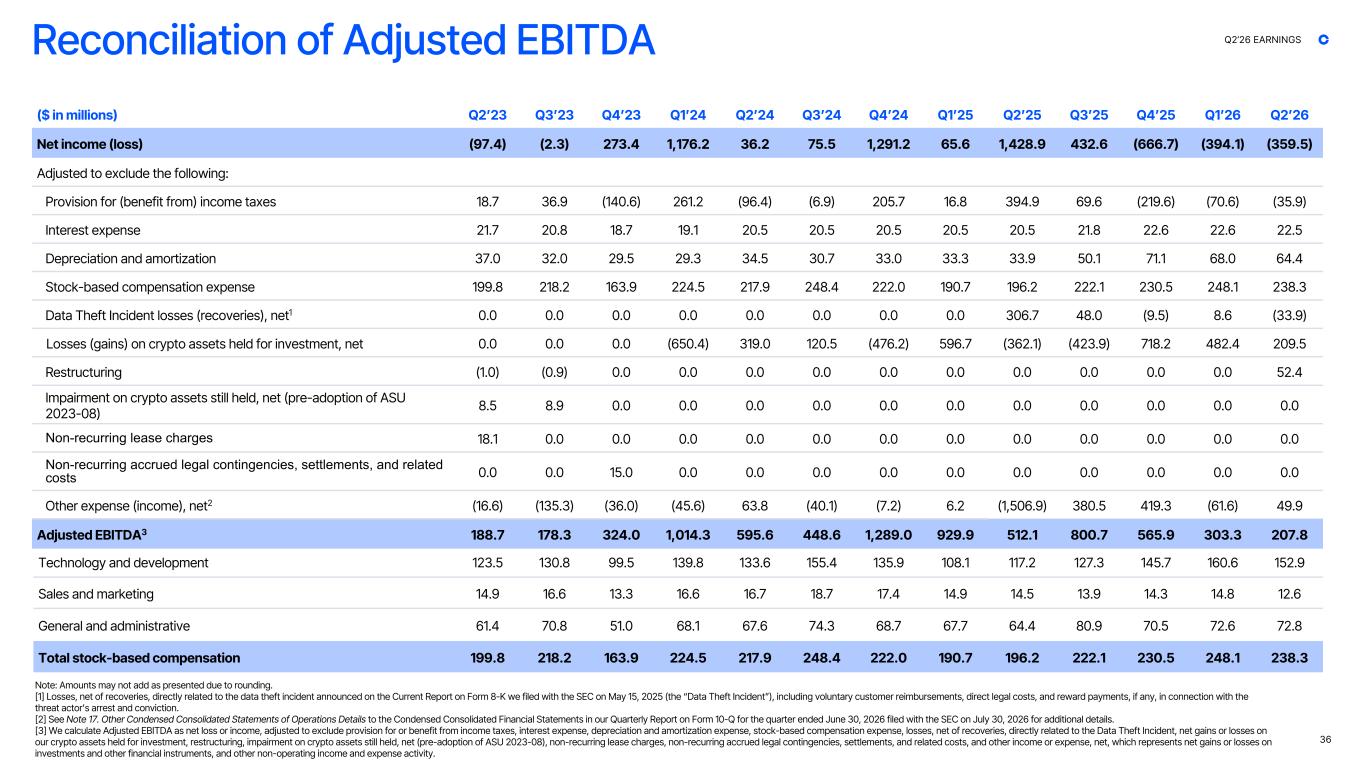
Reconciliation of Adjusted EBITDA ($ in millions) Q2ʼ23 Q3ʼ23 Q4ʼ23 Q1ʼ24 Q2ʼ24 Q3ʼ24 Q4ʼ24 Q1ʼ25 Q2ʼ25 Q3ʼ25 Q4ʼ25 Q1ʼ26 Q2ʼ26 Net income (loss) (97.4) (2.3) 273.4 1,176.2 36.2 75.5 1,291.2 65.6 1,428.9 432.6 (666.7) (394.1) (359.5) Adjusted to exclude the following: Provision for (benefit from) income taxes 18.7 36.9 (140.6) 261.2 (96.4) (6.9) 205.7 16.8 394.9 69.6 (219.6) (70.6) (35.9) Interest expense 21.7 20.8 18.7 19.1 20.5 20.5 20.5 20.5 20.5 21.8 22.6 22.6 22.5 Depreciation and amortization 37.0 32.0 29.5 29.3 34.5 30.7 33.0 33.3 33.9 50.1 71.1 68.0 64.4 Stock-based compensation expense 199.8 218.2 163.9 224.5 217.9 248.4 222.0 190.7 196.2 222.1 230.5 248.1 238.3 Data Theft Incident losses (recoveries), net1 0.0 0.0 0.0 0.0 0.0 0.0 0.0 0.0 306.7 48.0 (9.5) 8.6 (33.9) Losses (gains) on crypto assets held for investment, net 0.0 0.0 0.0 (650.4) 319.0 120.5 (476.2) 596.7 (362.1) (423.9) 718.2 482.4 209.5 Restructuring (1.0) (0.9) 0.0 0.0 0.0 0.0 0.0 0.0 0.0 0.0 0.0 0.0 52.4 Impairment on crypto assets still held, net (pre-adoption of ASU 2023-08) 8.5 8.9 0.0 0.0 0.0 0.0 0.0 0.0 0.0 0.0 0.0 0.0 0.0 Non-recurring lease charges 18.1 0.0 0.0 0.0 0.0 0.0 0.0 0.0 0.0 0.0 0.0 0.0 0.0 Non-recurring accrued legal contingencies, settlements, and related costs 0.0 0.0 15.0 0.0 0.0 0.0 0.0 0.0 0.0 0.0 0.0 0.0 0.0 Other expense (income), net2 (16.6) (135.3) (36.0) (45.6) 63.8 (40.1) (7.2) 6.2 (1,506.9) 380.5 419.3 (61.6) 49.9 Adjusted EBITDA3 188.7 178.3 324.0 1,014.3 595.6 448.6 1,289.0 929.9 512.1 800.7 565.9 303.3 207.8 Technology and development 123.5 130.8 99.5 139.8 133.6 155.4 135.9 108.1 117.2 127.3 145.7 160.6 152.9 Sales and marketing 14.9 16.6 13.3 16.6 16.7 18.7 17.4 14.9 14.5 13.9 14.3 14.8 12.6 General and administrative 61.4 70.8 51.0 68.1 67.6 74.3 68.7 67.7 64.4 80.9 70.5 72.6 72.8 Total stock-based compensation 199.8 218.2 163.9 224.5 217.9 248.4 222.0 190.7 196.2 222.1 230.5 248.1 238.3 36 Note: Amounts may not add as presented due to rounding. [1] Losses, net of recoveries, directly related to the data theft incident announced on the Current Report on Form 8-K we filed with the SEC on May 15, 2025 (the “Data Theft Incident”), including voluntary customer reimbursements, direct legal costs, and reward payments, if any, in connection with the threat actorʼs arrest and conviction. [2] See Note 17. Other Condensed Consolidated Statements of Operations Details to the Condensed Consolidated Financial Statements in our Quarterly Report on Form 10-Q for the quarter ended June 30, 2026 filed with the SEC on July 30, 2026 for additional details. [3] We calculate Adjusted EBITDA as net loss or income, adjusted to exclude provision for or benefit from income taxes, interest expense, depreciation and amortization expense, stock-based compensation expense, losses, net of recoveries, directly related to the Data Theft Incident, net gains or losses on our crypto assets held for investment, restructuring, impairment on crypto assets still held, net (pre-adoption of ASU 2023-08), non-recurring lease charges, non-recurring accrued legal contingencies, settlements, and related costs, and other income or expense, net, which represents net gains or losses on investments and other financial instruments, and other non-operating income and expense activity. Q2’26 EARNINGS
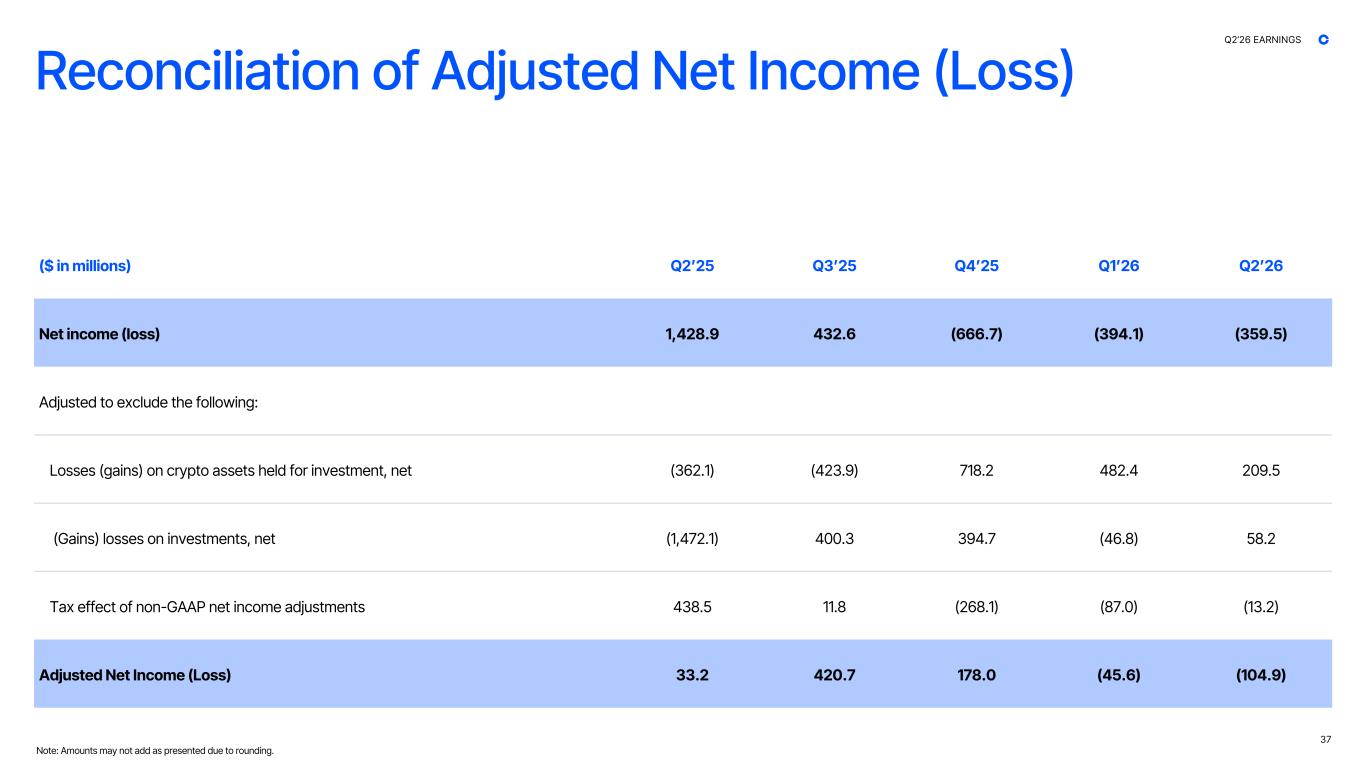
Reconciliation of Adjusted Net Income (Loss) ($ in millions) Q2ʼ25 Q3ʼ25 Q4ʼ25 Q1ʼ26 Q2ʼ26 Net income (loss) 1,428.9 432.6 (666.7) (394.1) (359.5) Adjusted to exclude the following: Losses (gains) on crypto assets held for investment, net (362.1) (423.9) 718.2 482.4 209.5 (Gains) losses on investments, net (1,472.1) 400.3 394.7 (46.8) 58.2 Tax effect of non-GAAP net income adjustments 438.5 11.8 (268.1) (87.0) (13.2) Adjusted Net Income (Loss) 33.2 420.7 178.0 (45.6) (104.9) 37 Note: Amounts may not add as presented due to rounding. Q2’26 EARNINGS
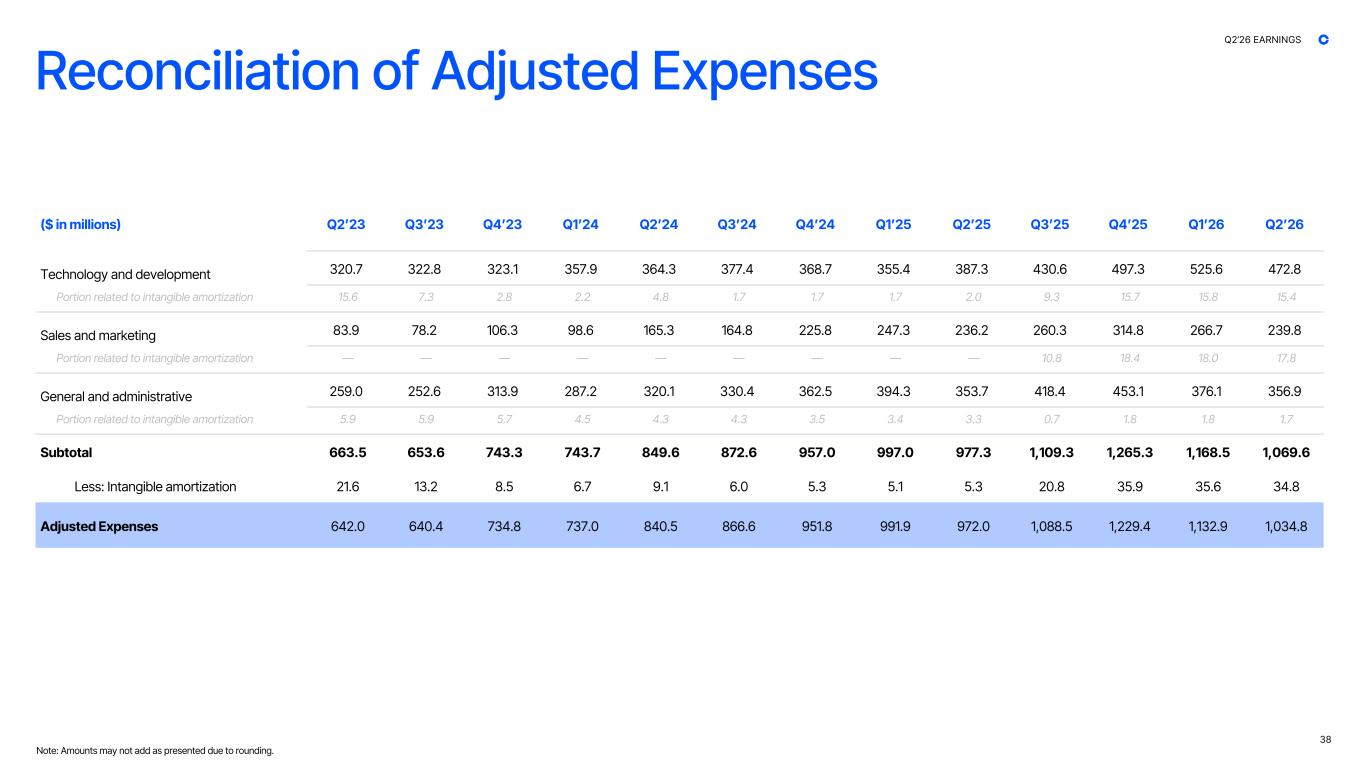
Reconciliation of Adjusted Expenses ($ in millions) Q2ʼ23 Q3ʼ23 Q4ʼ23 Q1ʼ24 Q2ʼ24 Q3ʼ24 Q4ʼ24 Q1ʼ25 Q2ʼ25 Q3ʼ25 Q4ʼ25 Q1ʼ26 Q2ʼ26 Technology and development 320.7 322.8 323.1 357.9 364.3 377.4 368.7 355.4 387.3 430.6 497.3 525.6 472.8 Portion related to intangible amortization 15.6 7.3 2.8 2.2 4.8 1.7 1.7 1.7 2.0 9.3 15.7 15.8 15.4 Sales and marketing 83.9 78.2 106.3 98.6 165.3 164.8 225.8 247.3 236.2 260.3 314.8 266.7 239.8 Portion related to intangible amortization — — — — — — — — — 10.8 18.4 18.0 17.8 General and administrative 259.0 252.6 313.9 287.2 320.1 330.4 362.5 394.3 353.7 418.4 453.1 376.1 356.9 Portion related to intangible amortization 5.9 5.9 5.7 4.5 4.3 4.3 3.5 3.4 3.3 0.7 1.8 1.8 1.7 Subtotal 663.5 653.6 743.3 743.7 849.6 872.6 957.0 997.0 977.3 1,109.3 1,265.3 1,168.5 1,069.6 Less: Intangible amortization 21.6 13.2 8.5 6.7 9.1 6.0 5.3 5.1 5.3 20.8 35.9 35.6 34.8 Adjusted Expenses 642.0 640.4 734.8 737.0 840.5 866.6 951.8 991.9 972.0 1,088.5 1,229.4 1,132.9 1,034.8 38 Note: Amounts may not add as presented due to rounding. Q2’26 EARNINGS
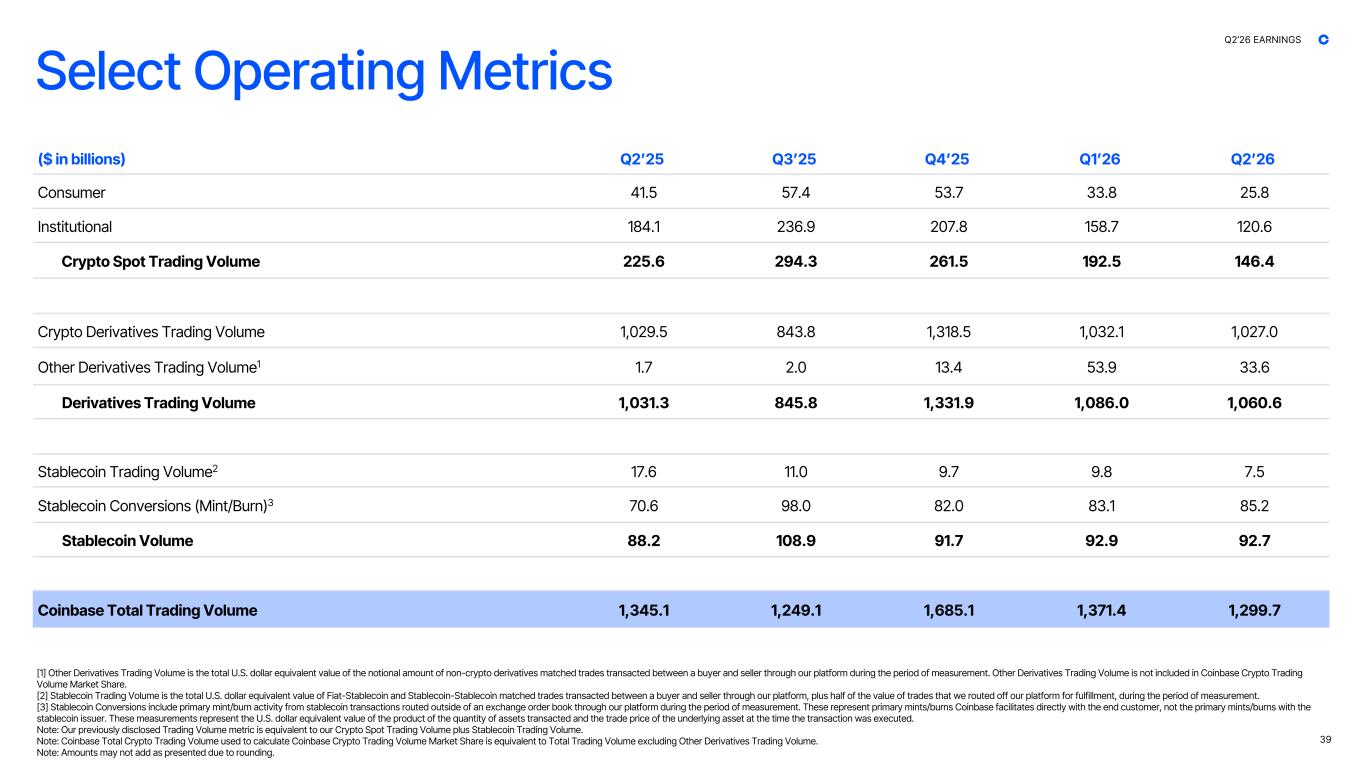
Select Operating Metrics ($ in billions) Q2ʼ25 Q3ʼ25 Q4ʼ25 Q1ʼ26 Q2ʼ26 Consumer 41.5 57.4 53.7 33.8 25.8 Institutional 184.1 236.9 207.8 158.7 120.6 Crypto Spot Trading Volume 225.6 294.3 261.5 192.5 146.4 Crypto Derivatives Trading Volume 1,029.5 843.8 1,318.5 1,032.1 1,027.0 Other Derivatives Trading Volume1 1.7 2.0 13.4 53.9 33.6 Derivatives Trading Volume 1,031.3 845.8 1,331.9 1,086.0 1,060.6 Stablecoin Trading Volume2 17.6 11.0 9.7 9.8 7.5 Stablecoin Conversions (Mint/Burn)3 70.6 98.0 82.0 83.1 85.2 Stablecoin Volume 88.2 108.9 91.7 92.9 92.7 Coinbase Total Trading Volume 1,345.1 1,249.1 1,685.1 1,371.4 1,299.7 39 [1] Other Derivatives Trading Volume is the total U.S. dollar equivalent value of the notional amount of non-crypto derivatives matched trades transacted between a buyer and seller through our platform during the period of measurement. Other Derivatives Trading Volume is not included in Coinbase Crypto Trading Volume Market Share. [2] Stablecoin Trading Volume is the total U.S. dollar equivalent value of Fiat-Stablecoin and Stablecoin-Stablecoin matched trades transacted between a buyer and seller through our platform, plus half of the value of trades that we routed off our platform for fulfillment, during the period of measurement. [3] Stablecoin Conversions include primary mint/burn activity from stablecoin transactions routed outside of an exchange order book through our platform during the period of measurement. These represent primary mints/burns Coinbase facilitates directly with the end customer, not the primary mints/burns with the stablecoin issuer. These measurements represent the U.S. dollar equivalent value of the product of the quantity of assets transacted and the trade price of the underlying asset at the time the transaction was executed. Note: Our previously disclosed Trading Volume metric is equivalent to our Crypto Spot Trading Volume plus Stablecoin Trading Volume. Note: Coinbase Total Crypto Trading Volume used to calculate Coinbase Crypto Trading Volume Market Share is equivalent to Total Trading Volume excluding Other Derivatives Trading Volume. Note: Amounts may not add as presented due to rounding. Q2’26 EARNINGS
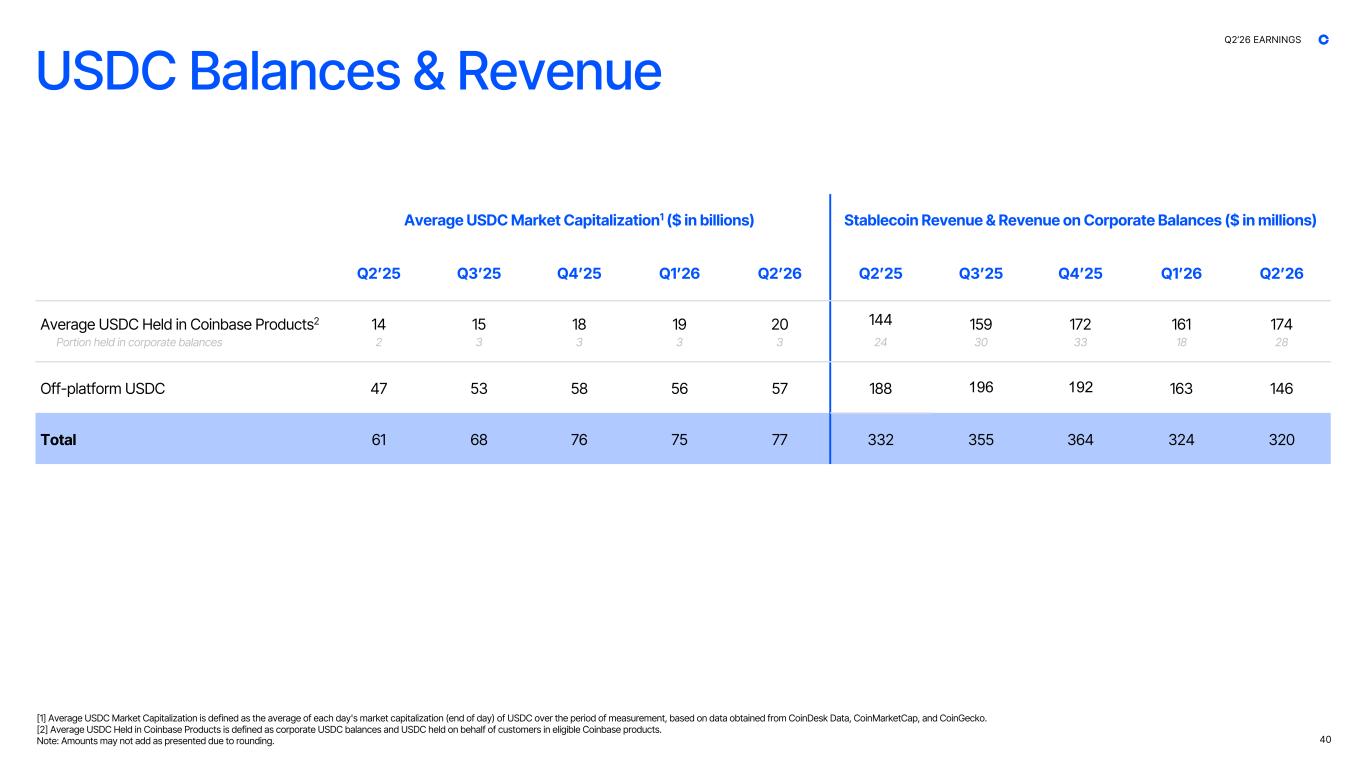
USDC Balances & Revenue Average USDC Market Capitalization1 ($ in billions) Stablecoin Revenue & Revenue on Corporate Balances ($ in millions) Q2ʼ25 Q3ʼ25 Q4ʼ25 Q1ʼ26 Q2ʼ26 Q2ʼ25 Q3ʼ25 Q4ʼ25 Q1ʼ26 Q2ʼ26 Average USDC Held in Coinbase Products2 14 15 18 19 20 144 159 172 161 174 Portion held in corporate balances 2 3 3 3 3 24 30 33 18 28 Off-platform USDC 47 53 58 56 57 188 196 192 163 146 Total 61 68 76 75 77 332 355 364 324 320 40 [1] Average USDC Market Capitalization is defined as the average of each day's market capitalization (end of day) of USDC over the period of measurement, based on data obtained from CoinDesk Data, CoinMarketCap, and CoinGecko. [2] Average USDC Held in Coinbase Products is defined as corporate USDC balances and USDC held on behalf of customers in eligible Coinbase products. Note: Amounts may not add as presented due to rounding. Q2’26 EARNINGS
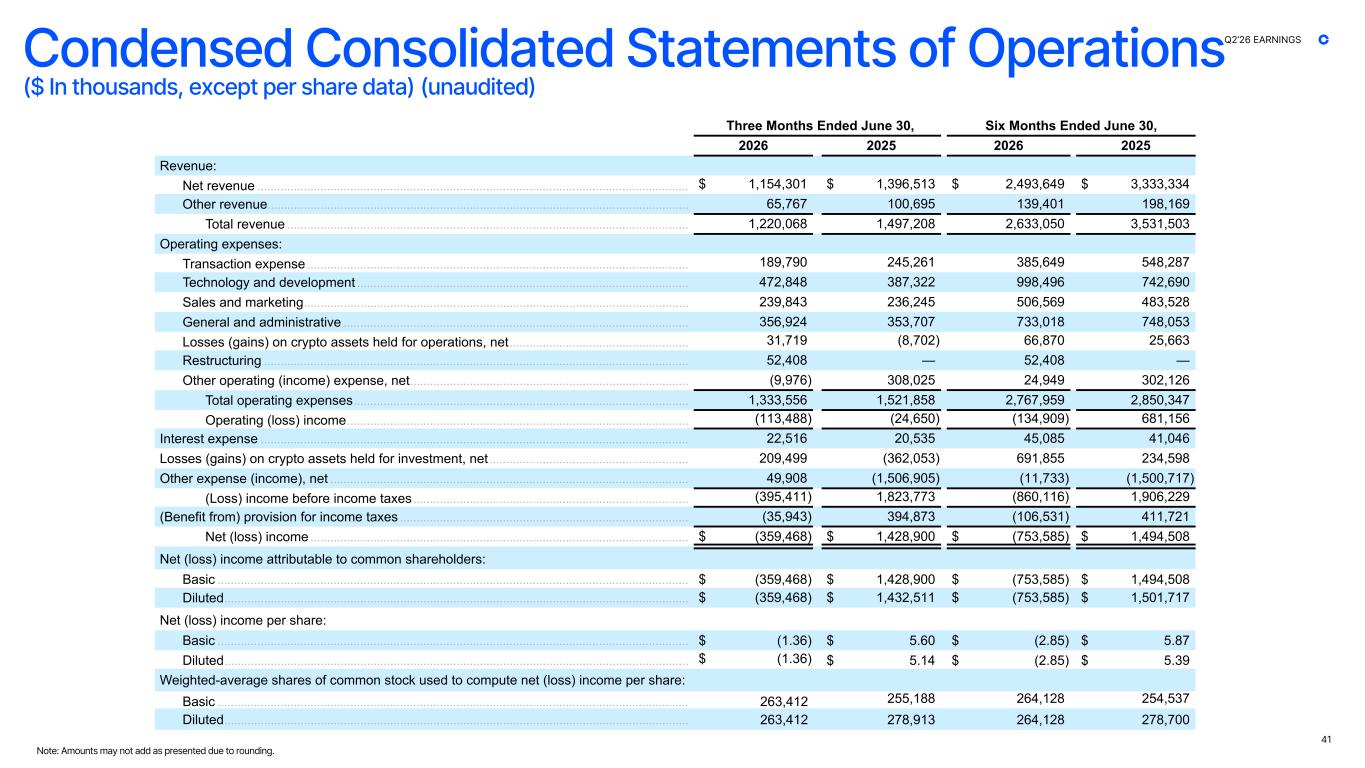
Condensed Consolidated Statements of Operations ($ In thousands, except per share data) (unaudited) 41 Note: Amounts may not add as presented due to rounding. Three Months Ended June 30, Six Months Ended June 30, 2026 2025 2026 2025 Revenue: Net revenue .................................................................................................................................. $ 1,154,301 $ 1,396,513 $ 2,493,649 $ 3,333,334 Other revenue ............................................................................................................................... 65,767 100,695 139,401 198,169 Total revenue ......................................................................................................................... 1,220,068 1,497,208 2,633,050 3,531,503 Operating expenses: Transaction expense ................................................................................................................... 189,790 245,261 385,649 548,287 Technology and development .................................................................................................... 472,848 387,322 998,496 742,690 Sales and marketing .................................................................................................................... 239,843 236,245 506,569 483,528 General and administrative ........................................................................................................ 356,924 353,707 733,018 748,053 Losses (gains) on crypto assets held for operations, net ...................................................... 31,719 (8,702) 66,870 25,663 Restructuring ................................................................................................................................ 52,408 — 52,408 — Other operating (income) expense, net .................................................................................... (9,976) 308,025 24,949 302,126 Total operating expenses ..................................................................................................... 1,333,556 1,521,858 2,767,959 2,850,347 Operating (loss) income ....................................................................................................... (113,488) (24,650) (134,909) 681,156 Interest expense ................................................................................................................................. 22,516 20,535 45,085 41,046 Losses (gains) on crypto assets held for investment, net ............................................................ 209,499 (362,053) 691,855 234,598 Other expense (income), net ............................................................................................................ 49,908 (1,506,905) (11,733) (1,500,717) (Loss) income before income taxes ................................................................................... (395,411) 1,823,773 (860,116) 1,906,229 (Benefit from) provision for income taxes ....................................................................................... (35,943) 394,873 (106,531) 411,721 Net (loss) income .................................................................................................................. $ (359,468) $ 1,428,900 $ (753,585) $ 1,494,508 Net (loss) income attributable to common shareholders: Basic .............................................................................................................................................. $ (359,468) $ 1,428,900 $ (753,585) $ 1,494,508 Diluted ............................................................................................................................................ $ (359,468) $ 1,432,511 $ (753,585) $ 1,501,717 Net (loss) income per share: Basic .............................................................................................................................................. $ (1.36) $ 5.60 $ (2.85) $ 5.87 Diluted ............................................................................................................................................ $ (1.36) $ 5.14 $ (2.85) $ 5.39 Weighted-average shares of common stock used to compute net (loss) income per share: Basic .............................................................................................................................................. 263,412 255,188 264,128 254,537 Diluted ............................................................................................................................................ 263,412 278,913 264,128 278,700 Q2’26 EARNINGS
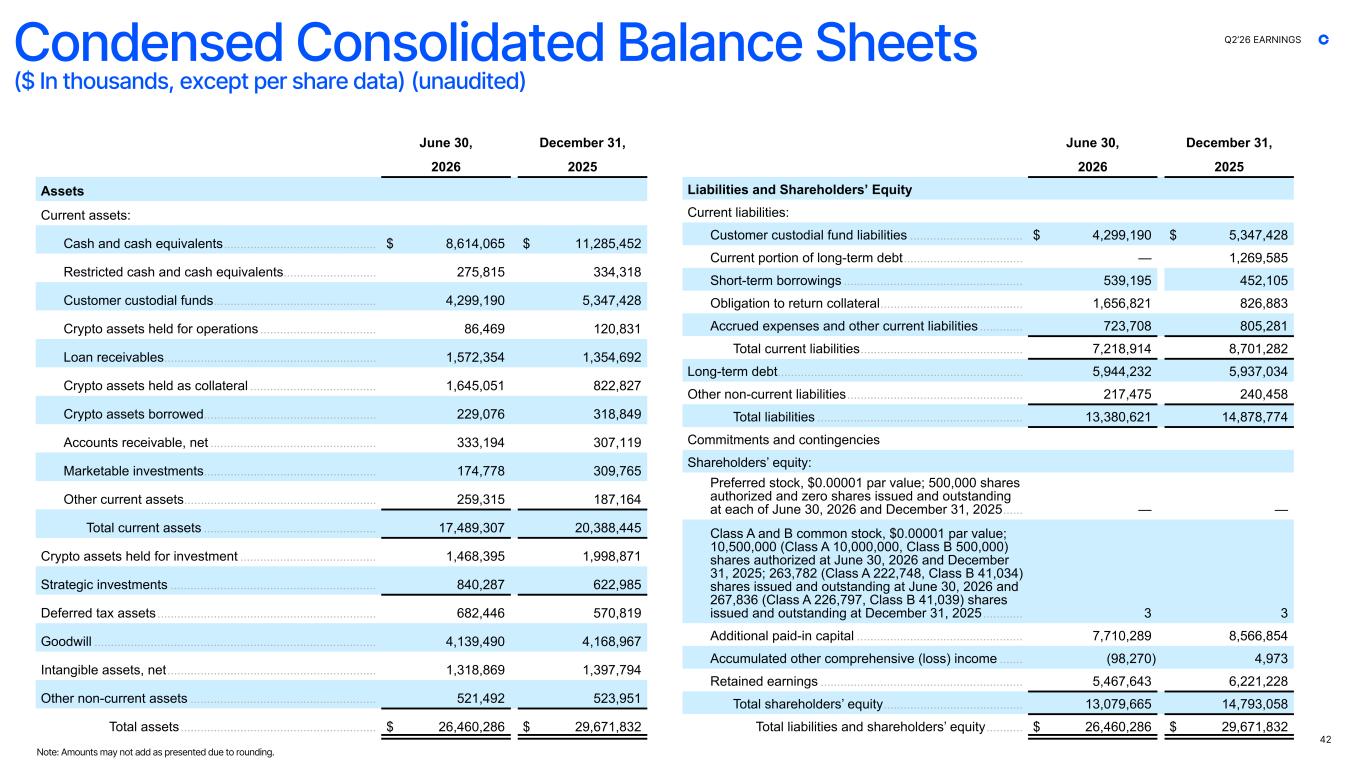
Condensed Consolidated Balance Sheets ($ In thousands, except per share data) (unaudited) 42 Note: Amounts may not add as presented due to rounding. June 30, December 31, 2026 2025 Liabilities and Shareholders’ Equity Current liabilities: Customer custodial fund liabilities .................................. $ 4,299,190 $ 5,347,428 Current portion of long-term debt .................................... — 1,269,585 Short-term borrowings ...................................................... 539,195 452,105 Obligation to return collateral ........................................... 1,656,821 826,883 Accrued expenses and other current liabilities ............. 723,708 805,281 Total current liabilities ................................................. 7,218,914 8,701,282 Long-term debt .......................................................................... 5,944,232 5,937,034 Other non-current liabilities ..................................................... 217,475 240,458 Total liabilities .............................................................. 13,380,621 14,878,774 Commitments and contingencies Shareholders’ equity: Preferred stock, $0.00001 par value; 500,000 shares authorized and zero shares issued and outstanding at each of June 30, 2026 and December 31, 2025 ...... — — Class A and B common stock, $0.00001 par value; 10,500,000 (Class A 10,000,000, Class B 500,000) shares authorized at June 30, 2026 and December 31, 2025; 263,782 (Class A 222,748, Class B 41,034) shares issued and outstanding at June 30, 2026 and 267,836 (Class A 226,797, Class B 41,039) shares issued and outstanding at December 31, 2025 ............ 3 3 Additional paid-in capital .................................................. 7,710,289 8,566,854 Accumulated other comprehensive (loss) income ....... (98,270) 4,973 Retained earnings ............................................................. 5,467,643 6,221,228 Total shareholders’ equity .......................................... 13,079,665 14,793,058 Total liabilities and shareholders’ equity ........... $ 26,460,286 $ 29,671,832 June 30, December 31, 2026 2025 Assets Current assets: Cash and cash equivalents .............................................. $ 8,614,065 $ 11,285,452 Restricted cash and cash equivalents ............................ 275,815 334,318 Customer custodial funds ................................................. 4,299,190 5,347,428 Crypto assets held for operations ................................... 86,469 120,831 Loan receivables ................................................................ 1,572,354 1,354,692 Crypto assets held as collateral ...................................... 1,645,051 822,827 Crypto assets borrowed .................................................... 229,076 318,849 Accounts receivable, net .................................................. 333,194 307,119 Marketable investments .................................................... 174,778 309,765 Other current assets .......................................................... 259,315 187,164 Total current assets .................................................... 17,489,307 20,388,445 Crypto assets held for investment ......................................... 1,468,395 1,998,871 Strategic investments .............................................................. 840,287 622,985 Deferred tax assets .................................................................. 682,446 570,819 Goodwill ..................................................................................... 4,139,490 4,168,967 Intangible assets, net ............................................................... 1,318,869 1,397,794 Other non-current assets ........................................................ 521,492 523,951 Total assets ........................................................... $ 26,460,286 $ 29,671,832 Q2’26 EARNINGS
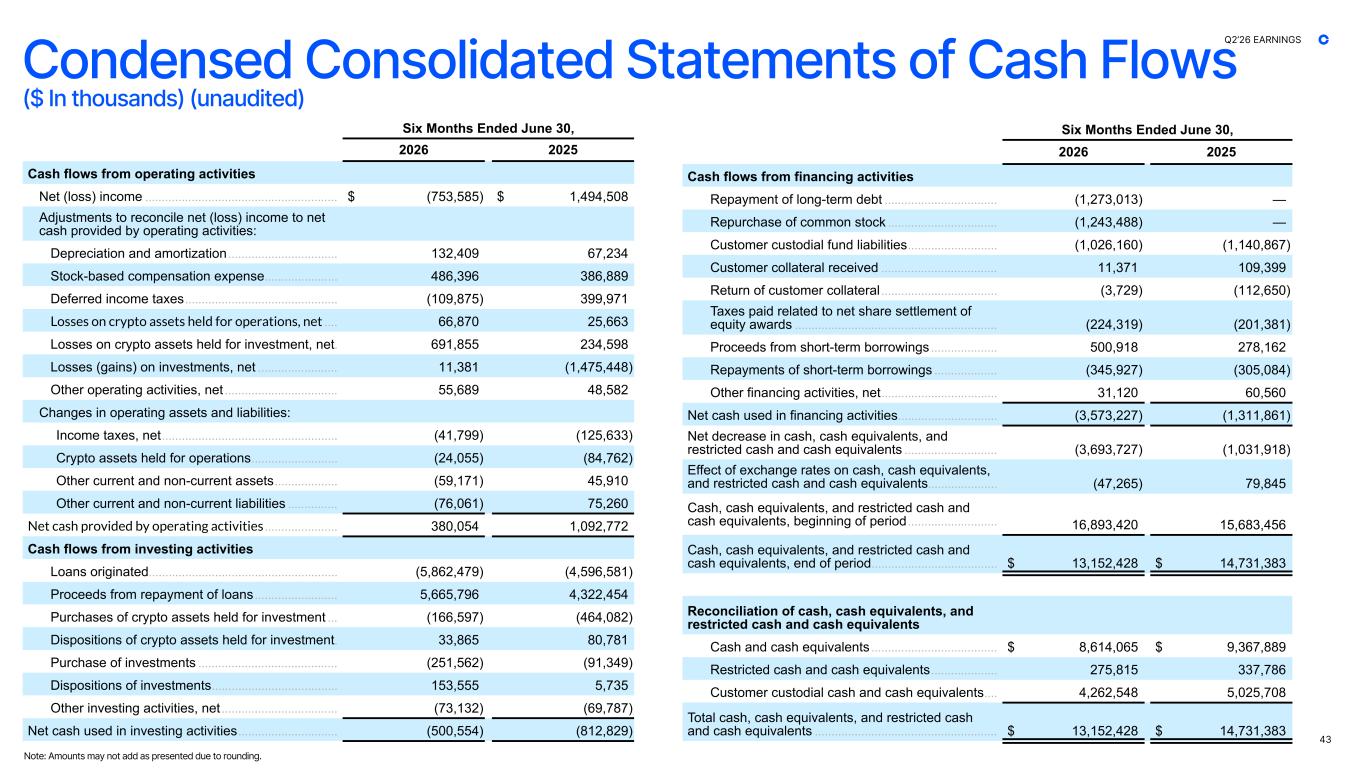
43 Condensed Consolidated Statements of Cash Flows ($ In thousands) (unaudited) Note: Amounts may not add as presented due to rounding. Six Months Ended June 30, 2026 2025 Cash flows from operating activities Net (loss) income .......................................................... $ (753,585) $ 1,494,508 Adjustments to reconcile net (loss) income to net cash provided by operating activities: Depreciation and amortization ................................. 132,409 67,234 Stock-based compensation expense ...................... 486,396 386,889 Deferred income taxes .............................................. (109,875) 399,971 Losses on crypto assets held for operations, net .... 66,870 25,663 Losses on crypto assets held for investment, net . 691,855 234,598 Losses (gains) on investments, net ........................ 11,381 (1,475,448) Other operating activities, net .................................. 55,689 48,582 Changes in operating assets and liabilities: Income taxes, net ..................................................... (41,799) (125,633) Crypto assets held for operations .......................... (24,055) (84,762) Other current and non-current assets ................... (59,171) 45,910 Other current and non-current liabilities ............... (76,061) 75,260 Net cash provided by operating activities ...................... 380,054 1,092,772 Cash flows from investing activities Loans originated ......................................................... (5,862,479) (4,596,581) Proceeds from repayment of loans ......................... 5,665,796 4,322,454 Purchases of crypto assets held for investment ... (166,597) (464,082) Dispositions of crypto assets held for investment . 33,865 80,781 Purchase of investments .......................................... (251,562) (91,349) Dispositions of investments ...................................... 153,555 5,735 Other investing activities, net ................................... (73,132) (69,787) Net cash used in investing activities .............................. (500,554) (812,829) Six Months Ended June 30, 2026 2025 Cash flows from financing activities Repayment of long-term debt .................................. (1,273,013) — Repurchase of common stock ................................. (1,243,488) — Customer custodial fund liabilities ........................... (1,026,160) (1,140,867) Customer collateral received ................................... 11,371 109,399 Return of customer collateral ................................... (3,729) (112,650) Taxes paid related to net share settlement of equity awards ............................................................. (224,319) (201,381) Proceeds from short-term borrowings .................... 500,918 278,162 Repayments of short-term borrowings ................... (345,927) (305,084) Other financing activities, net ................................... 31,120 60,560 Net cash used in financing activities .............................. (3,573,227) (1,311,861) Net decrease in cash, cash equivalents, and restricted cash and cash equivalents ............................ (3,693,727) (1,031,918) Effect of exchange rates on cash, cash equivalents, and restricted cash and cash equivalents..................... (47,265) 79,845 Cash, cash equivalents, and restricted cash and cash equivalents, beginning of period ........................... 16,893,420 15,683,456 Cash, cash equivalents, and restricted cash and cash equivalents, end of period ...................................... $ 13,152,428 $ 14,731,383 Reconciliation of cash, cash equivalents, and restricted cash and cash equivalents Cash and cash equivalents ...................................... $ 8,614,065 $ 9,367,889 Restricted cash and cash equivalents .................... 275,815 337,786 Customer custodial cash and cash equivalents .... 4,262,548 5,025,708 Total cash, cash equivalents, and restricted cash and cash equivalents ....................................................... $ 13,152,428 $ 14,731,383 Q2’26 EARNINGS
Non-GAAP Financial Measures Adjusted EBITDA In addition to our results determined in accordance with GAAP, we believe Adjusted EBITDA, a non-GAAP financial performance measure, is useful information to help investors evaluate our operating performance because it: enables investors to compare this measure and component adjustments to similar information provided by peer companies and our past financial performance; provides additional company-specific adjustments for certain items that may be included in income from operations but that we do not consider to be normal, recurring, operating expenses (or income) necessary to operate our business given our operations, revenue generating activities, business strategy, industry, and regulatory environment; and provides investors with visibility to a measure management uses to evaluate our ongoing operations and for internal planning and forecasting purposes. For example: • We believe it is useful to exclude certain non-cash expenses, such as depreciation and amortization and stock-based compensation, from Adjusted EBITDA because the amounts of such expenses can vary significantly from period to period and may not directly correlate to the underlying performance of our business operations. • We believe it is useful to exclude certain items that we do not consider to be normal, recurring, cash operating expenses and therefore, not reflective of our ongoing business operations. For example, we exclude: (i) other (income) expense, net, as the income and expenses recognized in this line item are not part of our core operating activities and are considered non-operating activities under GAAP, (ii) gains and losses on crypto assets held for investment because such investments are considered primarily long-term holdings, (iii) losses, net of recoveries, directly related to the data theft incident announced on the Current Report on Form 8-K we filed with the SEC on May 15, 2025 (the “Data Theft Incident”), including voluntary customer reimbursements, direct legal costs, and reward payments, if any, in connection with the threat actor’s arrest and conviction, (iv) costs of restructuring, as these costs are associated with discrete organizational changes and are not reflective of our core, ongoing business operations, (v) non-recurring lease charges, which represent a non-recurring fee and write-off related to an early lease termination, (vi) non-recurring accrued legal contingencies, settlements, and related costs, which reduces cash available to us, and (vii) impairment on crypto assets still held, net, which represents impairment on crypto assets still held and is a non-cash expense, prior to the adoption of Accounting Standards Update (“ASU”) 2023-08. We do not plan on engaging in regular trading of crypto assets, and, as an operating company, our investing activities in crypto are not part of our revenue generating activities, which are primarily based on transactions on our platform and the sales of subscriptions and services. • We believe Adjusted EBITDA is useful to measure a company’s operating performance without regard to items such as stock-based compensation expense, depreciation and amortization expense, interest expense, other (income) expense, net, and provision for (benefit from) income taxes that can vary substantially from company to company depending upon their financing, capital structures, and the method by which assets were acquired. Adjusted Net Income (Loss) In addition to our results determined in accordance with GAAP, we believe that Adjusted Net Income (Loss), a non-GAAP financial performance measure, provides useful information to help investors evaluate our operating performance. We believe it is useful to exclude tax- effected gains and losses on crypto assets held for investment from Adjusted Net Income (Loss) because (i) such investments are considered primarily long-term holdings, (ii) we do not plan on engaging in regular trading of crypto assets, and, (iii) as an operating company, our investing activities in crypto are not part of our revenue generating activities, which are based on transactions on our platform and the sales of subscriptions and services. Additionally, we believe it is useful to exclude tax-effected gains and losses on our marketable and strategic investments from Adjusted Net Income (Loss) because such investments are not part of our core operating activities and are considered non-operating activities under GAAP. Adjusted Expenses Adjusted Expenses is defined as the sum of technology and development, sales and marketing, and general and administrative expenses, less amortization of acquired intangible assets. We believe this non-GAAP financial measure provides useful information to help investors evaluate our results of operations excluding amortization of acquired intangible assets, which we do not consider to be normal, recurring, cash operating expenses and which may not directly correlate to the underlying performance of our business operations. Limitations of Non-GAAP Financial Measures We believe that non-GAAP financial measures may be helpful to investors for the reasons noted above. However, non-GAAP financial measures are presented for supplemental informational purposes only, have limitations as analytical tools, and should not be considered in isolation or as a substitute for financial information presented in accordance with GAAP. In addition, other companies, including companies in our industry, may calculate non-GAAP financial measures differently or may use other measures to evaluate their performance, all of which could reduce the usefulness of our disclosure of non-GAAP financial measures as a tool for comparison. Adjusted EBITDA There are a number of limitations related to Adjusted EBITDA rather than net (loss) income, which is the nearest GAAP equivalent of Adjusted EBITDA. Some of these limitations are that Adjusted EBITDA excludes: • provision for (benefit from) income taxes; • interest expense, or the cash requirements necessary to service interest or principal payments on our debt, which reduces cash available to us; • depreciation and amortization expense and, although these are non-cash expenses, the assets being depreciated and amortized may have to be replaced in the future; • stock-based compensation expense, which has been, and will continue to be for the foreseeable future, a significant recurring expense for our business and an important part of our compensation strategy; • losses directly related to the Data Theft Incident, net of recoveries; • net gains or losses on our crypto assets held for investment; • the impact of the restructuring, which is not related to normal operations but impacted our results in 2023 and 2026; • non-recurring lease charges, which represent a non-recurring fee and write-off related to an early lease termination; • non-recurring accrued legal contingencies, settlements, and related costs, which reduces cash available to us; • impairment on crypto assets still held, net, which represents impairment on crypto assets still held and is a non-cash expense, prior to the adoption of ASU 2023-08; and • other (income) expense, net, which represents net gains or losses on investments and other financial instruments, and other non-operating income and expense activity. Adjusted Net Income (Loss) There are limitations related to Adjusted Net Income (Loss) rather than net income, which is the nearest GAAP equivalent, including that Adjusted Net Income (Loss) excludes the tax-effected impact of our crypto investment gains/losses and of our marketable and strategic investments gains or losses. Adjusted Expenses There are limitations related to Adjusted Expenses rather than the sum of technology and development, sales and marketing, and general and administrative expenses, including that it excludes amortization of acquired intangible assets, which although non-cash, is an expense related to acquisitions of businesses, which have been and may be significant in the future. Additional Information For more information, including reconciliations of these non-GAAP financial measures to their nearest GAAP equivalents, please see the reconciliation of GAAP to non-GAAP results tables in this presentation. Investors are encouraged to review the related GAAP financial measure and the reconciliations, and not to rely on any single financial measure to evaluate our business. Q2’26 EARNINGS 44