
Exhibit 99.2
Second Quarter 2026 Results June 30, 2026 COMMERCIAL REAL ESTATE | ENGINEERING | INVESTMENT MANAGEMENT
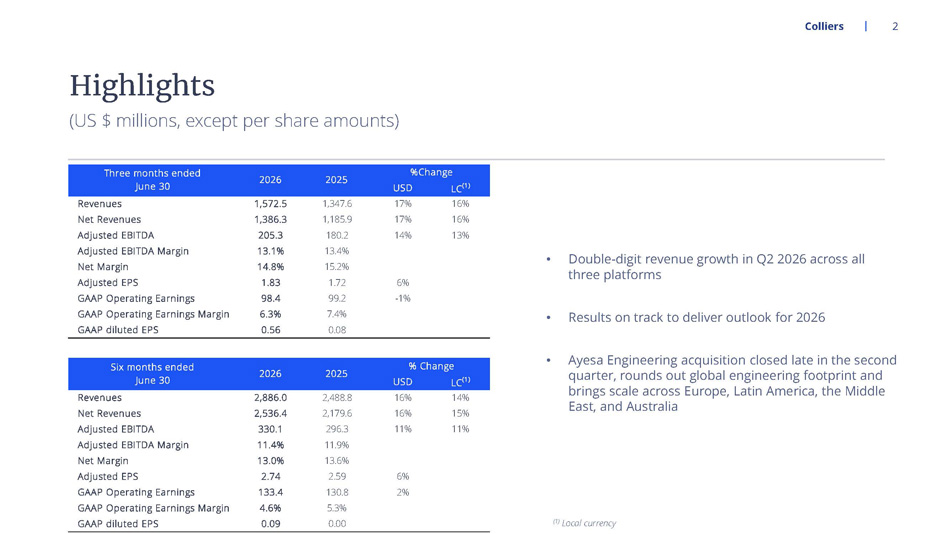
2 Colliers (US $ millions, except per share amounts) Highlights • Double - digit revenue growth in Q2 2026 across all three platforms • Results on track to deliver outlook for 2026 • Ayesa Engineering acquisition closed late in the second quarter, rounds out global engineering footprint and brings scale across Europe, Latin America, the Middle East, and Australia USD LC (1) Revenues 1,572.5 1,347.6 17% 16% Net Revenues 1,386.3 1,185.9 17% 16% Adjusted EBITDA 205.3 180.2 14% 13% Adjusted EBITDA Margin 13.1% 13.4% Net Margin 14.8% 15.2% Adjusted EPS 1.83 1.72 6% GAAP Operating Earnings 98.4 99.2 -1% GAAP Operating Earnings Margin 6.3% 7.4% GAAP diluted EPS 0.56 0.08 USD LC (1) Revenues 2,886.0 2,488.8 16% 14% Net Revenues 2,536.4 2,179.6 16% 15% Adjusted EBITDA 330.1 296.3 11% 11% Adjusted EBITDA Margin 11.4% 11.9% Net Margin 13.0% 13.6% Adjusted EPS 2.74 2.59 6% GAAP Operating Earnings 133.4 130.8 2% GAAP Operating Earnings Margin 4.6% 5.3% GAAP diluted EPS 0.09 0.00 Three months ended June 30 2026 2025 %Change Six months ended June 30 2026 2025 % Change (1) Local currency
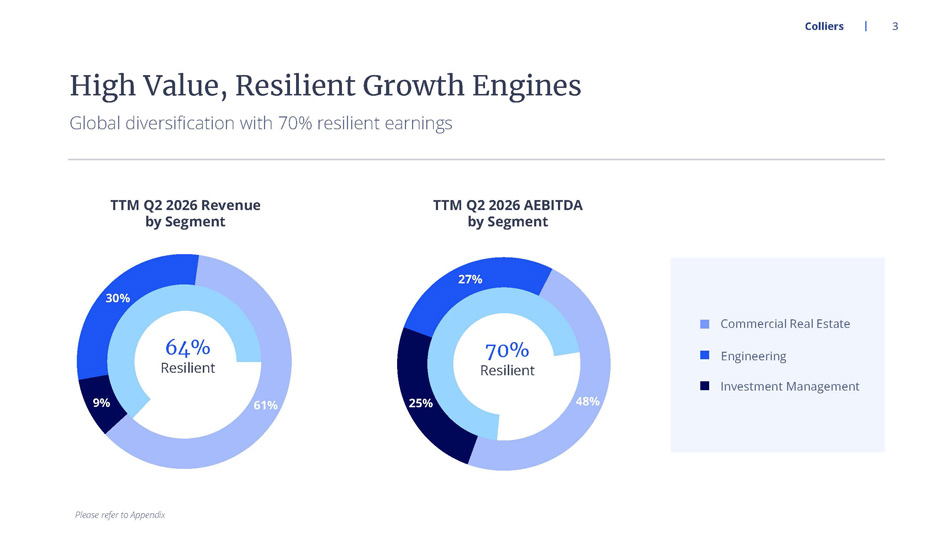
27% 48% 25% 70% Resilient TTM Q2 2026 AEBITDA by Segment 30% 61% 9% TTM Q2 2026 Revenue by Segment 64% Resilient Colliers Commercial Real Estate Engineering Investment Management Global diversification with 70% resilient earnings High Value, Resilient Growth Engines Please refer to Appendix 3
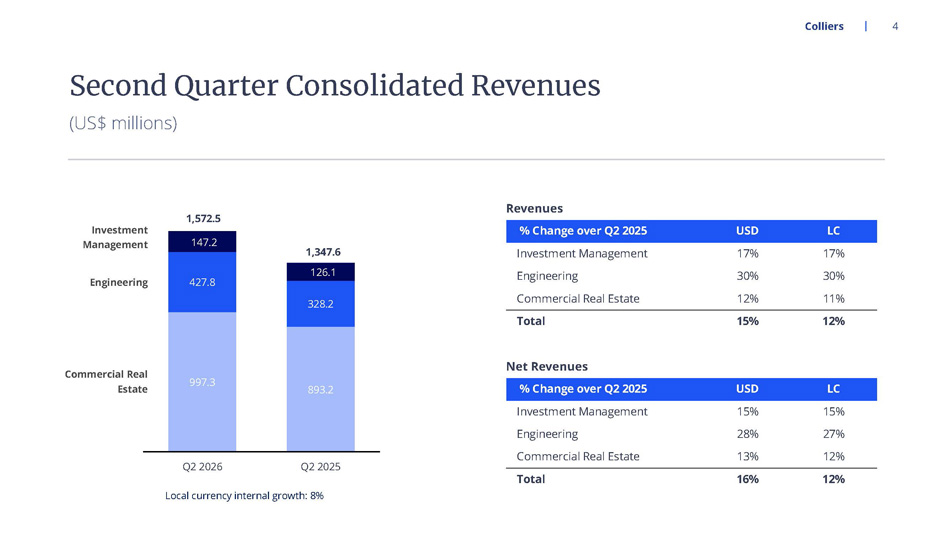
4 Colliers Second Quarter Consolidated Revenues Engineering Investment Management Commercial Real Estate % Change over Q2 2025 USD LC Investment Management 17% 17% Engineering 30% 30% Commercial Real Estate 12% 11% Total 15% 12% 997.3 893.2 427.8 328.2 147.2 126.1 1,572.5 1,347.6 Q2 2026 Q2 2025 (US$ millions) Local currency internal growth: 8% Revenues % Change over Q2 2025 USD LC Investment Management 15% 15% Engineering 28% 27% Commercial Real Estate 13% 12% Total 16% 12% Net Revenues
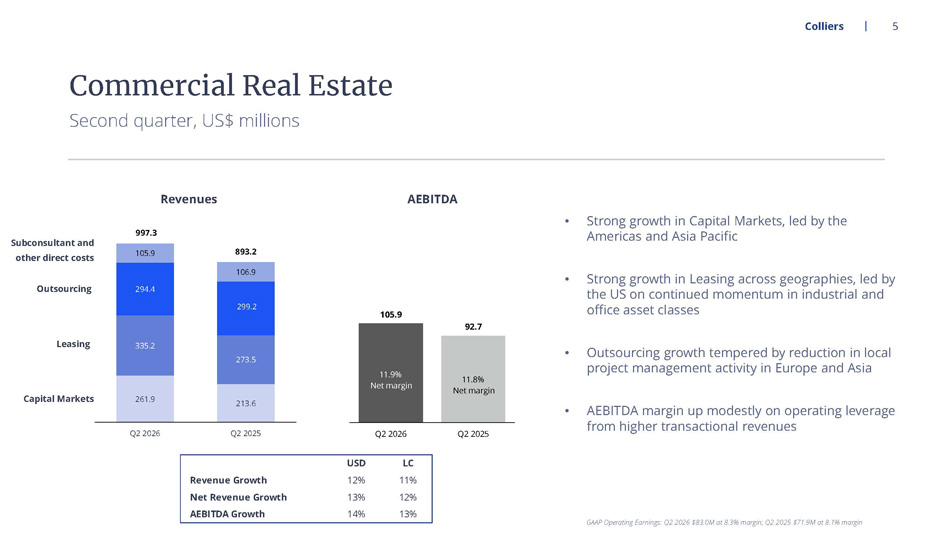
261.9 213.6 335.2 273.5 294.4 299.2 105.9 106.9 997.3 893.2 Q2 2026 Q2 2025 5 Colliers Second quarter, US$ millions Commercial Real Estate • Strong growth in Capital Markets, led by the Americas and Asia Pacific • Strong growth in Leasing across geographies, led by the US on continued momentum in industrial and office asset classes • Outsourcing growth tempered by reduction in local project management activity in Europe and Asia • AEBITDA margin up modestly on operating leverage from higher transactional revenues 105.9 92.7 Q2 2026 Q2 2025 11.9% Net margin 11.8% Net margin USD LC Revenue Growth 12% 11% Net Revenue Growth 13% 12% AEBITDA Growth 14% 13% Revenues AEBITDA Outsourcing Leasing Capital Markets Subconsultant and other direct costs GAAP Operating Earnings: Q2 2026 $83.0M at 8.3% margin; Q2 2025 $71.9M at 8.1% margin
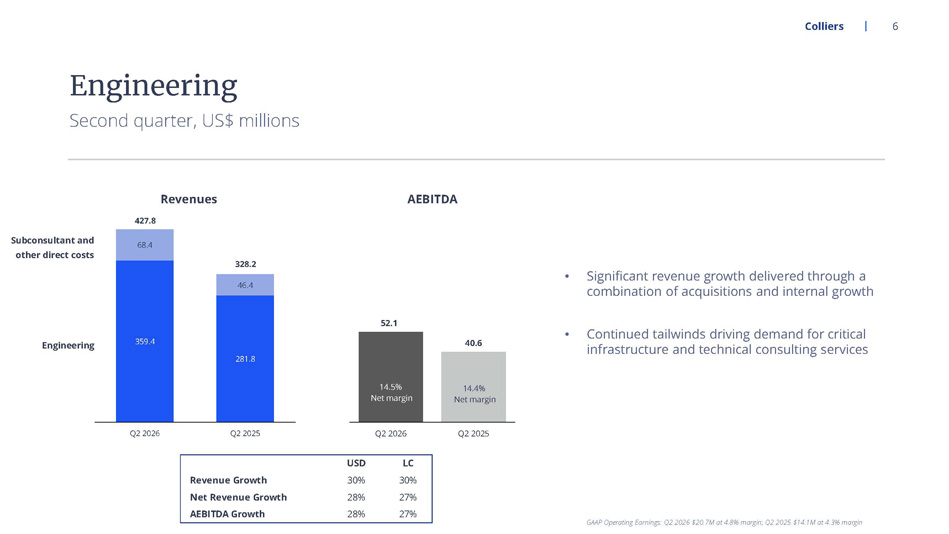
6 Colliers Second quarter, US$ millions Engineering • Significant revenue growth delivered through a combination of acquisitions and internal growth • Continued tailwinds driving demand for critical infrastructure and technical consulting services 359.4 281.8 68.4 46.4 427.8 328.2 Q2 2026 Q2 2025 GAAP Operating Earnings: Q2 2026 $20.7M at 4.8% margin; Q2 2025 $14.1M at 4.3% margin 52.1 40.6 Q2 2026 Q2 2025 14.5% Net margin 14.4% Net margin USD LC Revenue Growth 30% 30% Net Revenue Growth 28% 27% AEBITDA Growth 28% 27% Revenues AEBITDA Engineering Subconsultant and other direct costs
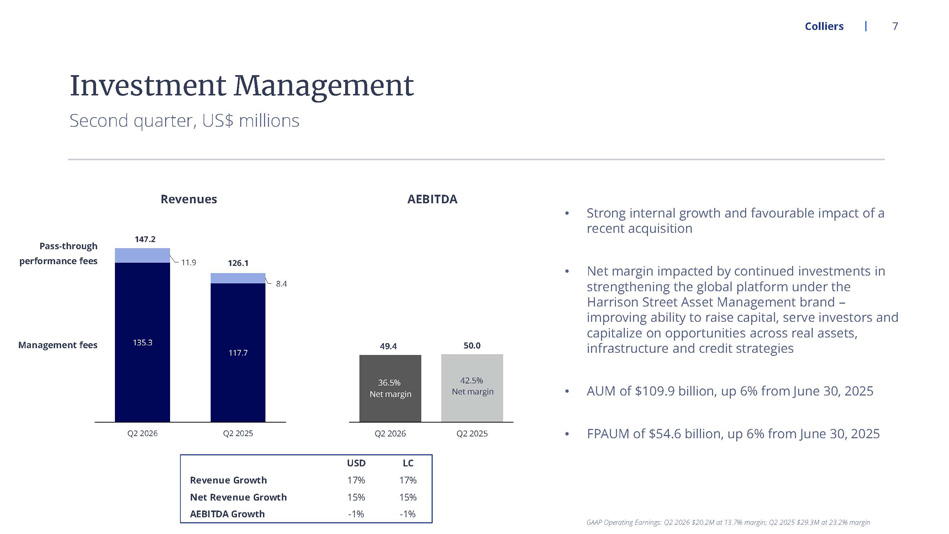
7 Colliers Second quarter, US$ millions Investment Management • Strong internal growth and favourable impact of a recent acquisition • Net margin impacted by continued investments in strengthening the global platform under the Harrison Street Asset Management brand – improving ability to raise capital, serve investors and capitalize on opportunities across real assets, infrastructure and credit strategies • AUM of $109.9 billion, up 6% from June 30, 2025 • FPAUM of $54.6 billion, up 6% from June 30, 2025 135.3 117.7 11.9 8.4 147.2 126.1 Q2 2026 Q2 2025 GAAP Operating Earnings: Q2 2026 $20.2M at 13.7% margin; Q2 2025 $29.3M at 23.2% margin 49.4 50.0 Q2 2026 Q2 2025 36.5% Net margin 42.5% Net margin USD LC Revenue Growth 17% 17% Net Revenue Growth 15% 15% AEBITDA Growth -1% -1% Management fees Pass - through performance fees Revenues AEBITDA
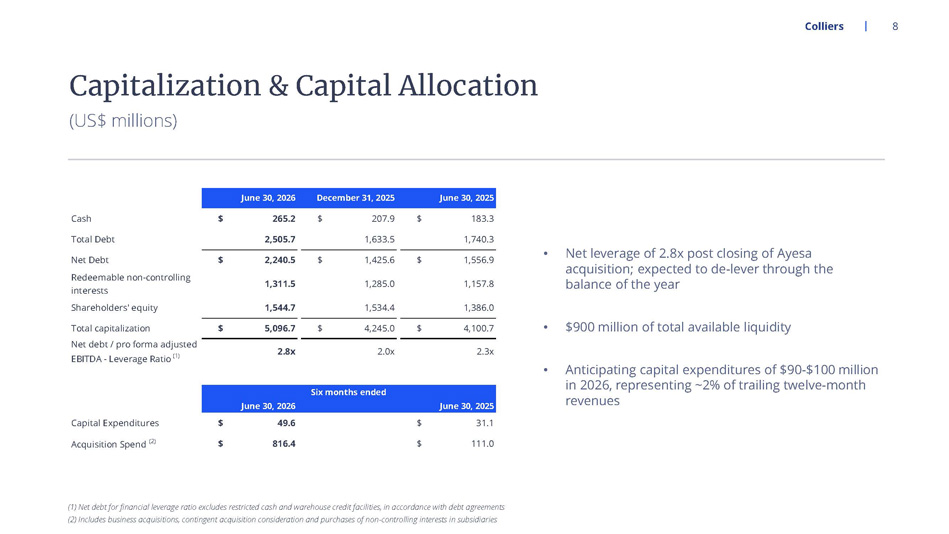
8 Colliers (US$ millions) Capitalization & Capital Allocation • Net leverage of 2.8x post closing of Ayesa acquisition; expected to de - lever through the balance of the year • $900 million of total available liquidity • Anticipating capital expenditures of $90 - $100 million in 2026, representing ~2% of trailing twelve - month revenues Cash $ 265.2 $ 207.9 $ 183.3 Total Debt 2,505.7 1,633.5 1,740.3 Net Debt $ 2,240.5 $ 1,425.6 $ 1,556.9 Redeemable non-controlling interests 1,311.5 1,285.0 1,157.8 Shareholders' equity 1,544.7 1,534.4 1,386.0 Total capitalization $ 5,096.7 $ 4,245.0 $ 4,100.7 Net debt / pro forma adjusted EBITDA - Leverage Ratio (1) 2.8x 2.0x 2.3x Capital Expenditures $ 49.6 $ 31.1 Acquisition Spend (2) $ 816.4 $ 111.0 Six months ended June 30, 2026 June 30, 2025 June 30, 2026 December 31, 2025 June 30, 2025 (1) Net debt for financial leverage ratio excludes restricted cash and warehouse credit facilities, in accordance with debt a gre ements (2) Includes business acquisitions, contingent acquisition consideration and purchases of non - controlling interests in subsidiar ies
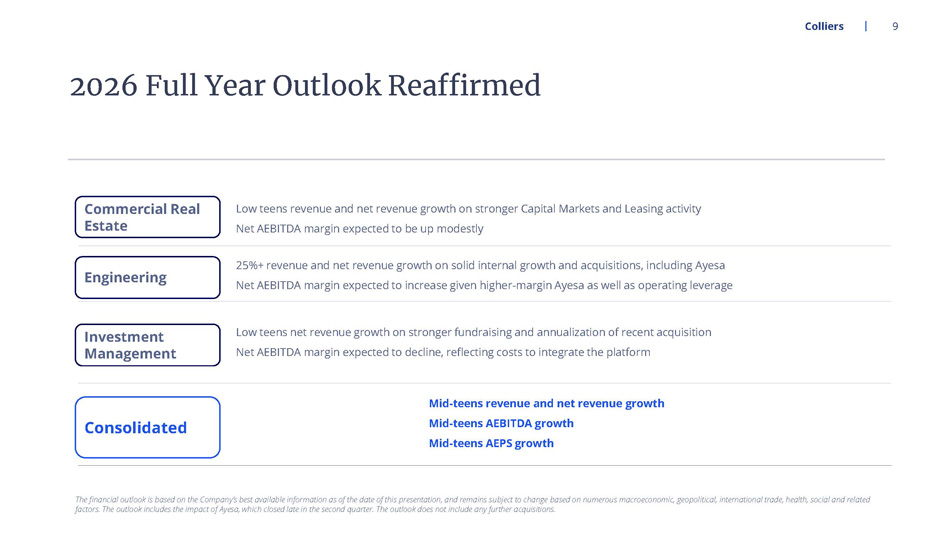
Colliers 9 2026 Full Year Outlook Reaffirmed The financial outlook is based on the Company’s best available information as of the date of this presentation, and remains s ubj ect to change based on numerous macroeconomic, geopolitical, international trade, health, social and related factors. The outlook includes the impact of Ayesa , which closed late in the second quarter. The outlook does not include any further acquisitions. Commercial Real Estate Engineering Investment Management Consolidated Mid - teens revenue and net revenue growth Mid - teens AEBITDA growth Mid - teens AEPS growth Low teens revenue and net revenue growth on stronger Capital Markets and Leasing activity Net AEBITDA margin expected to be up modestly 25%+ revenue and net revenue growth on solid internal growth and acquisitions, including Ayesa Net AEBITDA margin expected to increase given higher - margin Ayesa as well as operating leverage Low teens net revenue growth on stronger fundraising and annualization of recent acquisition Net AEBITDA margin expected to decline, reflecting costs to integrate the platform

Appendix Colliers 10 Reconciliation of non - GAAP Measures
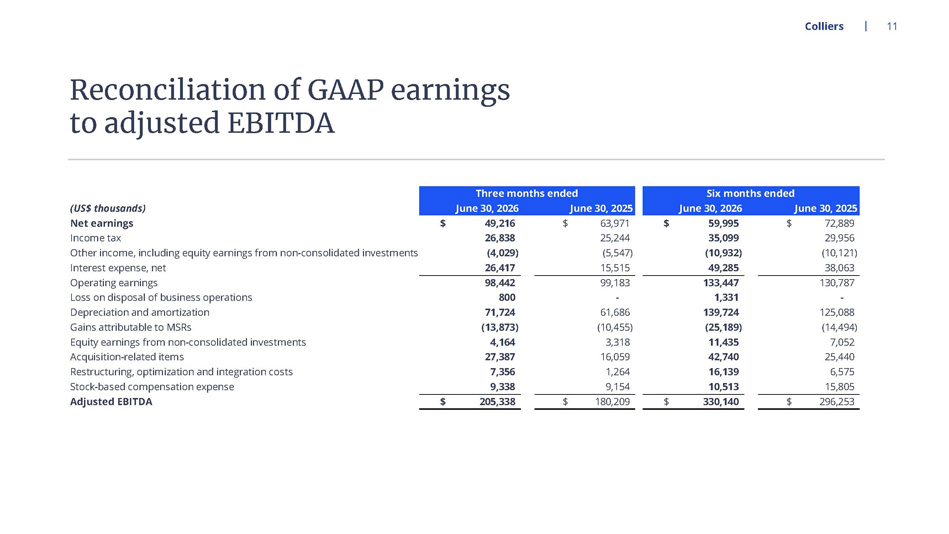
Colliers 11 (US$ thousands) Net earnings $ 49,216 $ 63,971 $ 59,995 $ 72,889 Income tax 26,838 25,244 35,099 29,956 Other income, including equity earnings from non-consolidated investments (4,029) (5,547) (10,932) (10,121) Interest expense, net 26,417 15,515 49,285 38,063 Operating earnings 98,442 99,183 133,447 130,787 Loss on disposal of business operations 800 - 1,331 - Depreciation and amortization 71,724 61,686 139,724 125,088 Gains attributable to MSRs (13,873) (10,455) (25,189) (14,494) Equity earnings from non-consolidated investments 4,164 3,318 11,435 7,052 Acquisition-related items 27,387 16,059 42,740 25,440 Restructuring, optimization and integration costs 7,356 1,264 16,139 6,575 Stock-based compensation expense 9,338 9,154 10,513 15,805 Adjusted EBITDA $ 205,338 $ 180,209 $ 330,140 $ 296,253 Three months ended Six months ended June 30, 2026 June 30, 2025 June 30, 2026 June 30, 2025 Reconciliation of GAAP earnings to adjusted EBITDA
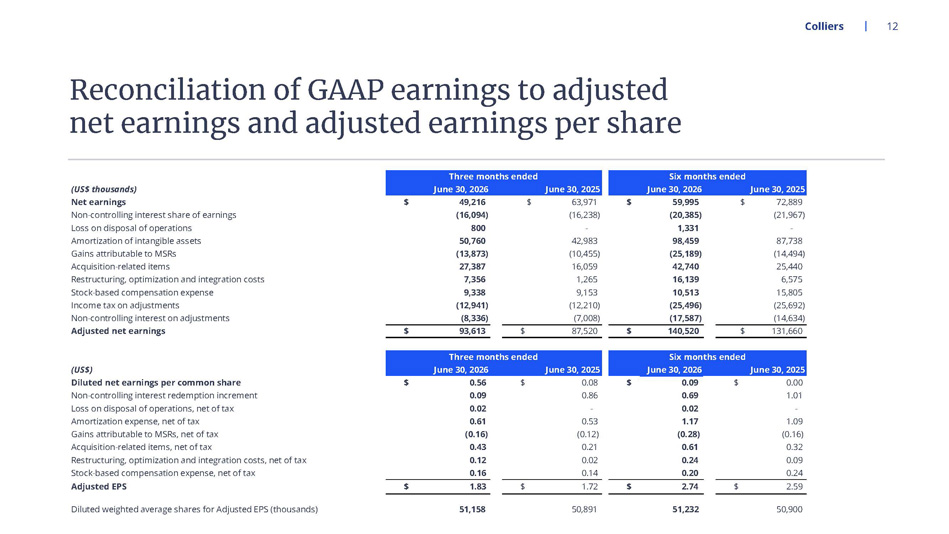
Colliers 12 (US$ thousands) Net earnings $ 49,216 $ 63,971 $ 59,995 $ 72,889 Non-controlling interest share of earnings (16,094) (16,238) (20,385) (21,967) Loss on disposal of operations 800 - 1,331 - Amortization of intangible assets 50,760 42,983 98,459 87,738 Gains attributable to MSRs (13,873) (10,455) (25,189) (14,494) Acquisition-related items 27,387 16,059 42,740 25,440 Restructuring, optimization and integration costs 7,356 1,265 16,139 6,575 Stock-based compensation expense 9,338 9,153 10,513 15,805 Income tax on adjustments (12,941) (12,210) (25,496) (25,692) Non-controlling interest on adjustments (8,336) (7,008) (17,587) (14,634) Adjusted net earnings $ 93,613 $ 87,520 $ 140,520 $ 131,660 (US$) Diluted net earnings per common share $ 0.56 $ 0.08 $ 0.09 $ 0.00 Non-controlling interest redemption increment 0.09 0.86 0.69 1.01 Loss on disposal of operations, net of tax 0.02 - 0.02 - Amortization expense, net of tax 0.61 0.53 1.17 1.09 Gains attributable to MSRs, net of tax (0.16) (0.12) (0.28) (0.16) Acquisition-related items, net of tax 0.43 0.21 0.61 0.32 Restructuring, optimization and integration costs, net of tax 0.12 0.02 0.24 0.09 Stock-based compensation expense, net of tax 0.16 0.14 0.20 0.24 Adjusted EPS $ 1.83 $ 1.72 $ 2.74 $ 2.59 Diluted weighted average shares for Adjusted EPS (thousands) 51,158 50,891 51,232 50,900 Three months ended Six months ended June 30, 2026 June 30, 2025 June 30, 2026 June 30, 2025 Three months ended Six months ended June 30, 2026 June 30, 2025 June 30, 2026 June 30, 2025 Reconciliation of GAAP earnings to adjusted net earnings and adjusted earnings per share
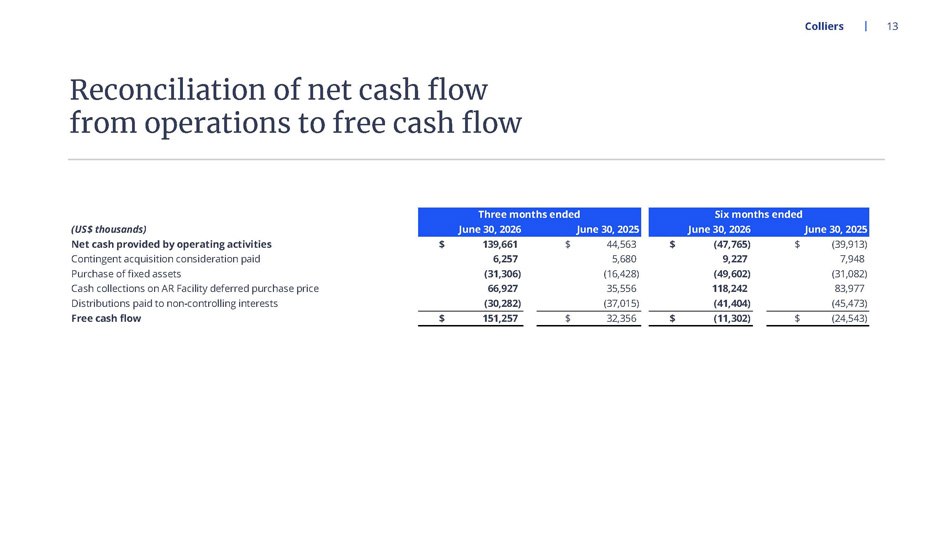
Colliers 13 Reconciliation of net cash flow from operations to free cash flow (US$ thousands) Net cash provided by operating activities $ 139,661 $ 44,563 $ (47,765) $ (39,913) Contingent acquisition consideration paid 6,257 5,680 9,227 7,948 Purchase of fixed assets (31,306) (16,428) (49,602) (31,082) Cash collections on AR Facility deferred purchase price 66,927 35,556 118,242 83,977 Distributions paid to non-controlling interests (30,282) (37,015) (41,404) (45,473) Free cash flow $ 151,257 $ 32,356 $ (11,302) $ (24,543) Three months ended Six months ended June 30, 2026 June 30, 2025 June 30, 2026 June 30, 2025
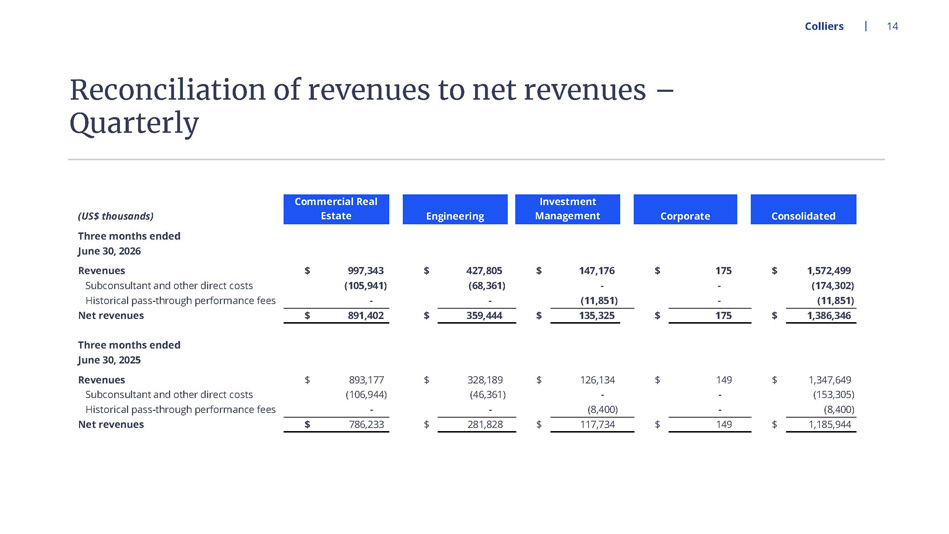
Colliers 14 Reconciliation of revenues to net revenues – Quarterly (US$ thousands) Three months ended June 30, 2026 Revenues $ 997,343 $ 427,805 $ 147,176 $ 175 $ 1,572,499 Subconsultant and other direct costs (105,941) (68,361) - - (174,302) Historical pass-through performance fees - - (11,851) - (11,851) Net revenues $ 891,402 $ 359,444 $ 135,325 $ 175 $ 1,386,346 Three months ended June 30, 2025 Revenues $ 893,177 $ 328,189 $ 126,134 $ 149 $ 1,347,649 Subconsultant and other direct costs (106,944) (46,361) - - (153,305) Historical pass-through performance fees - - (8,400) - (8,400) Net revenues $ 786,233 $ 281,828 $ 117,734 $ 149 $ 1,185,944 Commercial Real Estate Investment Management Engineering Corporate Consolidated
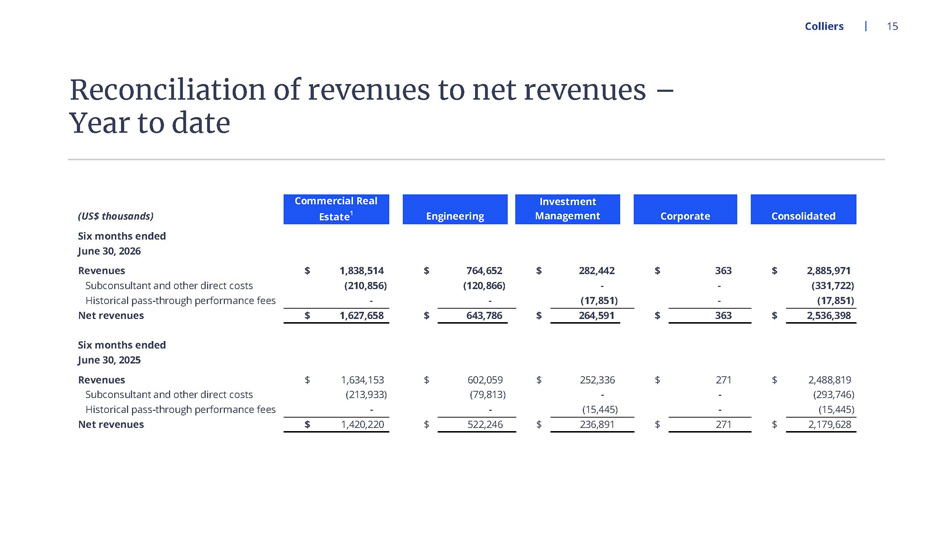
Colliers 15 Reconciliation of revenues to net revenues – Year to date (US$ thousands) Six months ended Revenues $ 1,838,514 $ 764,652 $ 282,442 $ 363 $ 2,885,971 Subconsultant and other direct costs (210,856) (120,866) - - (331,722) Historical pass-through performance fees - - (17,851) - (17,851) Net revenues $ 1,627,658 $ 643,786 $ 264,591 $ 363 $ 2,536,398 Six months ended June 30, 2025 Revenues $ 1,634,153 $ 602,059 $ 252,336 $ 271 $ 2,488,819 Subconsultant and other direct costs (213,933) (79,813) - - (293,746) Historical pass-through performance fees - - (15,445) - (15,445) Net revenues $ 1,420,220 $ 522,246 $ 236,891 $ 271 $ 2,179,628 June 30, 2026 Commercial Real Estate 1 Investment Management Engineering Corporate Consolidated
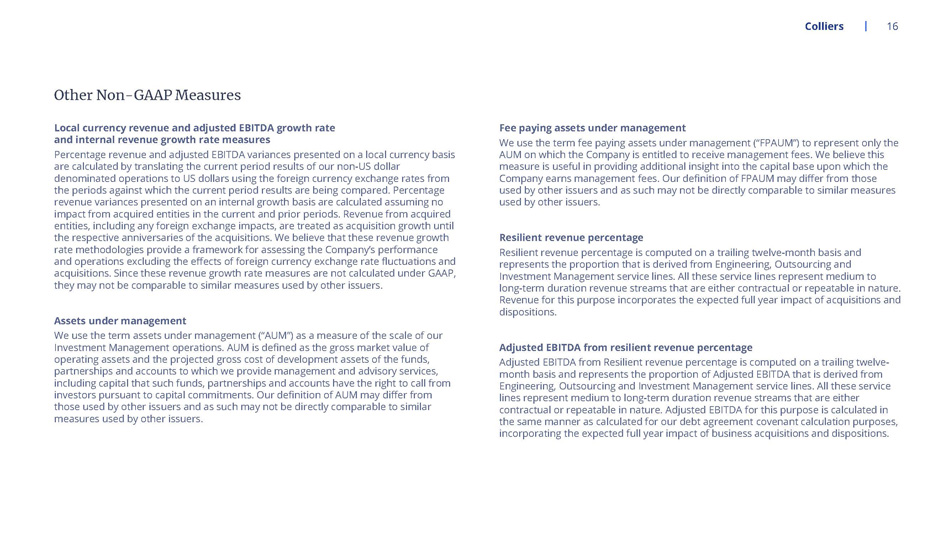
Local currency revenue and adjusted EBITDA growth rate and internal revenue growth rate measures Percentage revenue and adjusted EBITDA variances presented on a local currency basis are calculated by translating the current period results of our non - US dollar denominated operations to US dollars using the foreign currency exchange rates from the periods against which the current period results are being compared. Percentage revenue variances presented on an internal growth basis are calculated assuming no impact from acquired entities in the current and prior periods. Revenue from acquired entities, including any foreign exchange impacts, are treated as acquisition growth until the respective anniversaries of the acquisitions. We believe that these revenue growth rate methodologies provide a framework for assessing the Company’s performance and operations excluding the effects of foreign currency exchange rate fluctuations and acquisitions. Since these revenue growth rate measures are not calculated under GAAP, they may not be comparable to similar measures used by other issuers. Assets under management We use the term assets under management (“AUM”) as a measure of the scale of our Investment Management operations. AUM is defined as the gross market value of operating assets and the projected gross cost of development assets of the funds, partnerships and accounts to which we provide management and advisory services, including capital that such funds, partnerships and accounts have the right to call from investors pursuant to capital commitments. Our definition of AUM may differ from those used by other issuers and as such may not be directly comparable to similar measures used by other issuers. Fee paying assets under management We use the term fee paying assets under management (“FPAUM”) to represent only the AUM on which the Company is entitled to receive management fees. We believe this measure is useful in providing additional insight into the capital base upon which the Company earns management fees. Our definition of FPAUM may differ from those used by other issuers and as such may not be directly comparable to similar measures used by other issuers. Resilient revenue percentage Resilient revenue percentage is computed on a trailing twelve - month basis and represents the proportion that is derived from Engineering, Outsourcing and Investment Management service lines. All these service lines represent medium to long - term duration revenue streams that are either contractual or repeatable in nature. Revenue for this purpose incorporates the expected full year impact of acquisitions and dispositions. Adjusted EBITDA from resilient revenue percentage Adjusted EBITDA from Resilient revenue percentage is computed on a trailing twelve - month basis and represents the proportion of Adjusted EBITDA that is derived from Engineering, Outsourcing and Investment Management service lines. All these service lines represent medium to long - term duration revenue streams that are either contractual or repeatable in nature. Adjusted EBITDA for this purpose is calculated in the same manner as calculated for our debt agreement covenant calculation purposes, incorporating the expected full year impact of business acquisitions and dispositions. Colliers 16 Other Non - GAAP Measures