Exhibit 99.1
Interim Report
As of and for the three and six months ended June 30, 2026
TABLE OF CONTENTS
Cautionary Statements Concerning Forward Looking Statements
Statements contained in this report, particularly those regarding possible or assumed future performance, competitive strengths, costs, dividends, reserves, our growth, industry growth and other trends and projections and estimated company earnings are “forward-looking statements” that contain risks and uncertainties. In some cases, words such as “may”, “will”, “expect”, “could”, “should”, “intend”, “estimate”, “anticipate”, “believe”, “remain”, “on track”, “design”, “target”, “objective”, “goal”, “forecast”, “projection”, “outlook”, “prospects”, “plan”, or similar terms are used to identify forward-looking statements. These forward-looking statements reflect our current views with respect to future events and involve significant risks and uncertainties that could cause actual results to differ materially.
These risks and uncertainties include, without limitation:
•our ability to maintain vehicle shipment volumes;
•changes in the global financial markets, general economic environment and changes in demand for automotive products, which is subject to cyclicality;
•changes in trade policy, the imposition of global and regional tariffs or tariffs targeted to the automotive industry;
•our ability to accurately predict the market demand for electrified vehicles;
•our ability to offer innovative, attractive and relevant products;
•a significant malfunction, disruption or security breach compromising information technology systems or the electronic control systems contained in our vehicles;
•the level of competition in the automotive industry, which may increase due to consolidation and new entrants;
•our ability to attract and retain experienced management and employees;
•exchange rate fluctuations, interest rate changes, credit risk and other market risks;
•increases in costs, disruptions of supply or shortages of raw materials, parts, components and systems used in our vehicles;
•changes in local economic and political conditions;
•the enactment of tax reforms or other changes in laws and regulations;
•the level of governmental economic incentives available to support the adoption of battery electric vehicles;
•the impact of increasingly stringent regulations regarding fuel efficiency and greenhouse gas (“GHG”) and tailpipe emissions;
•various types of claims, lawsuits, governmental investigations and other contingencies, including product liability and warranty claims and environmental claims, investigations and lawsuits;
•material operating expenditures in relation to compliance with environmental, health and safety regulations;
•exposure to shortfalls in the funding of our defined benefit pension plans;
•our ability to provide or arrange for access to adequate financing for dealers and retail customers;
•risks related to the operation of financial services companies;
•our ability to access funding to execute our business plan;
•our ability to realize anticipated benefits from joint venture arrangements;
•disruptions arising from political, social and economic instability;
•risks associated with our relationships with employees, dealers and suppliers;
•our ability to maintain effective internal controls over financial reporting;
•developments in labor and industrial relations and developments in applicable labor laws;
•earthquakes or other disasters; and
•other factors discussed elsewhere in this report.
Furthermore, in light of the inherent difficulty in forecasting future results, any estimates or forecasts of particular periods that are provided in this report are uncertain. We expressly disclaim and do not assume any liability in connection with any inaccuracies in any of the forward-looking statements in this report or in connection with any use by any third party of such forward-looking statements. Actual results could differ materially from those anticipated in such forward-looking statements. We do not undertake an obligation to update or revise publicly any forward-looking statements.
Additional factors which could cause actual results and developments to differ from those expressed or implied by the forward-looking statements are included in the section — Risks and uncertainties of this Interim Report.
CERTAIN DEFINED TERMS
In this Interim Report, unless otherwise specified, the terms “we”, “our”, “us”, the “Company” and “Stellantis” refer to Stellantis N.V., together with its consolidated subsidiaries, or any one or more of them, as the context may require. This terminology does not affect the separate corporate status of the referenced legal entities, each of which is only responsible for its own obligations.
References to “the merger” refer to the merger between PSA and FCA completed on January 16, 2021 and resulting in the creation of Stellantis.
References to “FCA” mean Fiat Chrysler Automobiles N.V. together with its consolidated subsidiaries, or any one or more of them, as the context may require.
References to “PSA” mean Peugeot S.A. together with its consolidated subsidiaries, or any one or more of them, as the context may require.
References to “Leapmotor” or “LPM” mean Zhejiang Leapmotor Technology Co., Ltd. For further details on this relationship, refer to Note 12, Investments accounted for using the equity method of the Consolidated Financial Statements for the year ended December 31, 2025.
References to “Leapmotor International” means a jointly established Stellantis-controlled company created in 2024 and owned 51 percent by Stellantis and 49 percent by Leapmotor, to distribute Leapmotor-branded vehicles outside of China.
All references in this Interim Report to “Euro” and “€” refer to the currency issued by the European Central Bank. Stellantis’ financial information is presented in Euro. All references to “U.S. Dollars”, “U.S. Dollar”, “USD” and “$” refer to the currency of the United States of America (“U.S.”). All figures shown are rounded to the nearest tenth of unit presented. Certain totals in the tables included in this report may not add due to rounding.
The Interim Report is furnished to the U.S. Securities and Exchange Commission (“SEC”) on Form 6-K.
MANAGEMENT DISCUSSION AND ANALYSIS
Highlights
| | | | | | | | | | | | | | | | | | | | | | | | | | |
| Three months ended June 30, | | | | Six Months Ended June 30, |
| 2026 | | 2025 | | (€ million, except shipments, which are in thousands of units, and per share amounts) | | 2026 | | 2025 |
| 1,603 | | | 1,457 | | | Combined shipments(1) | | 2,968 | | | 2,690 | |
| 1.597 | | | 1.447 | | | Consolidated shipments(2) | | 2,958 | | | 2,664 | |
| | | | | | | | |
| 43,482 | | | 38,448 | | | Net revenues | | 81,614 | | | 74,261 | |
| 293 | | | (1,869) | | | Net profit/(loss) | | 670 | | | (2,256) | |
| | | | | | | | |
| | | | | | | | |
| 773 | | | 213 | | | Adjusted operating income (“AOI”)(3) | | 1,733 | | | 540 | |
| | | | | | | | |
| | | | | | | | |
| | | | | | | | |
| | | | | | | | |
| | | | | | | | |
| | | | Earnings/(loss) per share (“EPS”)(4) | | | | |
| 0.07 | | | (0.65) | | | Basic (loss)/earnings per share (€) | | 0.20 | | | (0.78) | |
| 0.07 | | | (0.65) | | | Diluted (loss)/earnings per share (€) | | 0.20 | | | (0.78) | |
| 0.12 | | | 0.15 | | | Adjusted diluted earnings/(loss) per share (€)(5) | | 0.32 | | | 0.18 | |
| | | | | | | | |
| — | | | — | | | Ordinary dividends, per share (€) | | — | | | 0.68 | |
| | | | | | | | |
| | | | | | | | | | | | | | | | |
| | Six months ended June 30, | | |
(€ million) | | 2026 | | 2025 | | |
Net cash from/(used in) operating activities | | (2,887) | | | (2,287) | | | |
Industrial free cash flows (“IFCF”)(6) | | (921) | | | (3,005) | | | |
| | | | | | | | | | | | | | | | |
(€ million) | | | | At June 30, 2026 | | At December 31, 2025 |
| Available liquidity | | | | 48,420 | | | 49,795 | |
| Of which: Industrial available liquidity | | | | 44,145 | | | 45,711 | |
Industrial net financial position(6) | | | | 10,035 | | | 6,694 | |
(1) Combined shipments also includes the Stellantis branded vehicles distributed by our joint ventures (such as Tofas) and associates
(2) Consolidated Shipments includes the vehicles produced by our joint ventures and associates (including Leapmotor) which are distributed by our consolidated subsidiaries
(3) Refer to sections — Non-GAAP financial measures, Company results and Results by segment in this Interim Report for further discussion
(4) Refer to Note 19, Earnings/(loss) per share, in the Interim Condensed Consolidated Financial Statements included in this Interim Report for additional information
(5) Refer to sections — Non-GAAP financial measures and Company results in this Interim Report for further discussion
(6) Refer to sections — Non-GAAP financial measures and Liquidity and capital resources in this Interim Report for further discussion
Non-GAAP financial measures
We monitor our operations through the use of several non-generally accepted accounting principles (“non-GAAP”) financial measures: Adjusted operating income/(loss), Adjusted operating income margin, Industrial free cash flows and Industrial net financial position. We believe that these non-GAAP financial measures provide useful and relevant information regarding our operating results and enhance the overall ability to assess our financial performance and financial position. They provide us with comparable measures which facilitate management’s ability to identify operational trends, as well as make decisions regarding future spending, resource allocations and other operational decisions. We also present the non-GAAP measure, Adjusted diluted EPS which is not used to monitor our operations but which we believe provides investors with a more meaningful comparison of the Company’s ongoing quality of earnings. These and similar measures are widely used in the industry in which we operate, however, these financial measures may not be comparable to other similarly titled measures of other companies and are not intended to be substitutes for measures of financial performance as prepared in accordance with International Financial Reporting Standards (“IFRS”) as issued by the International Accounting Standards Board (“IASB”), as well as IFRS as adopted by the European Union.
Adjusted operating income/(loss): Adjusted operating income/(loss) excludes from Net profit/(loss) adjustments comprising restructuring and other termination costs, impairments, asset write-offs, disposals of investments and unusual operating income/(expense) that are considered rare or discrete events and are infrequent in nature, as inclusion of such items is not considered to be indicative of the Company's ongoing operating performance, and also excludes Net financial expenses/(income) and Tax expense/(benefit).
Unusual operating income/(expense) are impacts from strategic decisions, as well as events considered rare or discrete and infrequent in nature, as inclusion of such items is not considered to be indicative of the Company's ongoing operating performance. Unusual operating income/(expense) includes, but may not be limited to:
•Impacts from strategic decisions to rationalize Stellantis’ core operations;
•Facility-related costs stemming from Stellantis’ plans to match production capacity and cost structure to market demand; and
•Convergence and integration costs directly related to significant acquisitions or mergers.
Adjusted operating income/(loss) is used for internal reporting to assess performance and as part of the Company's forecasting, budgeting and decision making processes as it provides additional transparency to the Company's core operations. We believe this non-GAAP measure is useful because it excludes items that we do not believe are indicative of the Company’s ongoing operating performance and allows management to view operating trends, perform analytical comparisons and benchmark performance between periods and among our segments. We also believe that Adjusted operating income/(loss) is useful for analysts and investors to understand how management assesses the Company’s ongoing operating performance on a consistent basis. In addition, Adjusted operating income/(loss) is one of the metrics used in the determination of the annual performance bonus for eligible employees, including members of the senior management.
Refer to the sections “Company results” and “Results by segment” below for further discussion and for a reconciliation of this non-GAAP measure to Net profit/(loss), which is the most directly comparable measure included in our Interim Condensed Consolidated Income Statement. Adjusted operating income/(loss) should not be considered as a substitute for Net profit/(loss), cash flow or other methods of analyzing our results as reported under IFRS.
Adjusted operating income/(loss) margin: is calculated as Adjusted operating income/(loss) divided by Net revenues.
Adjusted diluted EPS: is calculated by adjusting Diluted earnings per share for the post-tax impact per share of the same items excluded from Adjusted operating income/(loss) as well as tax expense/(benefit) items that are considered rare or infrequent, or whose nature would distort the presentation of the ongoing tax charge of the Company. We believe this non-GAAP measure is useful because it also excludes items that we do not believe are indicative of the Company’s ongoing operating performance and provides investors with a more meaningful comparison of the Company’s ongoing quality of earnings. Refer to the section “Company results” below for a reconciliation of this non-GAAP measure to Diluted earnings per share from operations, which is the most directly comparable measure included in our Interim Condensed Consolidated Financial Statements. Adjusted diluted EPS should not be considered as a substitute for Basic earnings per share, Diluted earnings per share from operations or other methods of analyzing our quality of earnings as reported under IFRS.
Industrial free cash flows: is our key cash flow metric and is calculated as Cash flows from operating activities less: (i) cash flows from operating activities from discontinued operations; (ii) cash flows from operating activities related to financial services, net of eliminations; (iii) investments in property, plant and equipment and intangible assets for industrial activities and (iv) contributions of equity to joint ventures and minor acquisitions of consolidated subsidiaries and equity method and other investments; and adjusted for: (i) net intercompany payments between continuing operations and discontinued operations; (ii) proceeds from disposal of assets and (iii) contributions to defined benefit pension plans, net of tax. The timing of Industrial free cash flows may be affected by the timing of monetization of receivables, factoring and the payment of accounts payables, as well as changes in other components of working capital, which can vary from period to period due to, among other things, cash management initiatives and other factors, some of which may be outside of the Company’s control. In addition, Industrial free cash flows is one of the metrics used in the determination of the annual performance bonus for eligible employees, including members of the senior management. We believe that this measure is useful for investors to facilitate their review and evaluation of the cash generation of our industrial operations, net of investing needs.
Refer to “Liquidity and capital resources” — “Industrial free cash flows” for further information and the reconciliation of this non-GAAP measure to Cash flows from operating activities, which is the most directly comparable measure included in our Interim Condensed Consolidated Statement of Cash Flows. Industrial free cash flows should not be considered as a substitute for Net profit/(loss), cash flow or other methods of analyzing our results as reported under IFRS.
Industrial net financial position is calculated as: Debt plus derivative financial liabilities related to industrial activities less (i) cash and cash equivalents; (ii) financial securities that are considered liquid; (iii) current financial receivables from the Company or its jointly controlled financial services entities and (iv) derivative financial assets and collateral deposits. Therefore, debt, cash and cash equivalents and other financial assets/liabilities pertaining to Stellantis’ financial services entities are excluded from the computation of the Industrial net financial position. Industrial net financial position includes the Industrial net financial position classified as held for sale. We believe it is useful for investors to report the Industrial net financial position to assist in comparability with the industrial operations of our peers. Refer to “Liquidity and capital resources” — “Industrial net financial position” for further information.
Company results
Effective January 2026, the Company’s segment structure was updated to align with how the Chief Operating Decision Maker (“CODM”) reviews performance and allocates resources. Under the revised structure, the CODM reviews the business through the following operating and reportable segments: North America; Enlarged Europe; Middle East & Africa; South America; and Asia Pacific. Refer to Note 1, Basis of Preparation in the Interim Condensed Consolidated Financial Statements included in this Interim Report for additional information.
The following is a discussion of the Company's results of operations for the three and six months ended June 30, 2026 compared to the three and six months ended June 30, 2025.
| | | | | | | | | | | | | | | | | | | | | | | | | | |
| Three months ended June 30, | | | | Six Months Ended June 30, |
| 2026 | | 2025 | | (€ million) | | 2026 | | 2025 |
| 43,482 | | | 38,448 | | | Net revenues | | 81,614 | | | 74,261 | |
| 38,708 | | | 36,079 | | | Cost of revenues | | 72,411 | | | 68,267 | |
| 2,483 | | | 1,828 | | | Selling, general and other costs | | 4,785 | | | 4,174 | |
| 1,308 | | | 1,938 | | | Research and development costs | | 2,748 | | | 3,371 | |
| 71 | | | (202) | | | Gains/(losses) on disposal of investments | | 59 | | | (204) | |
| 384 | | | 399 | | | Restructuring costs | | 482 | | | 522 | |
| 32 | | | (396) | | | Share of the profit/(loss) of equity method investees | | 143 | | | (433) | |
| 702 | | | (2,394) | | | Operating income/(loss) | | 1,390 | | | (2,710) | |
| 202 | | | 63 | | | Net financial expenses/(income) | | 352 | | | 160 | |
| 500 | | | (2,457) | | | Profit/(loss) before taxes | | 1,038 | | | (2,870) | |
| 207 | | | (588) | | | Tax expense/(benefit) | | 368 | | | (614) | |
| | | | | | | | |
| | | | | | | | |
| 293 | | | (1,869) | | | Net profit/(loss) | | 670 | | | (2,256) | |
| | | | | | | | |
| | | | Net profit/(loss) attributable to: | | | | |
| 266 | | | (1,869) | | | Owners of the parent | | 656 | | | (2,240) | |
| 27 | | | — | | | Non-controlling interests | | 14 | | | (16) | |
| | | | | | | | |
| | | | | | | | |
| | | | | | | | |
| | | | | | | | |
| | | | | | | | |
| | | | | | | | |
| | | | | | | | |
| | | | | | | | |
Net revenues
| | | | | | | | | | | | | | | | | | | | | | | | | | | | | | | | | | | | | | |
| Three months ended June 30, | | Increase/(Decrease) | | | | Six Months Ended June 30, | | Increase/(Decrease) |
| 2026 | | 2025 | | 2026 vs. 2025 | | (€ million) | | 2026 | | 2025 | | 2026 vs. 2025 |
| 43,482 | | | 38,448 | | | 13.1 | % | | Net revenues | | 81,614 | | | 74,261 | | | 9.9 | % |
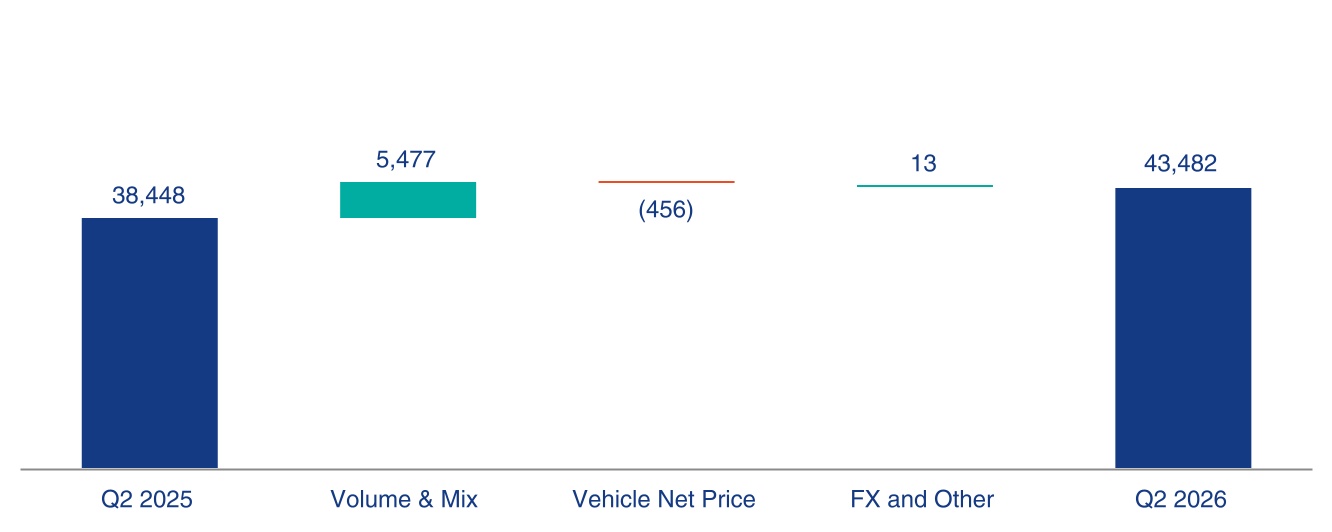
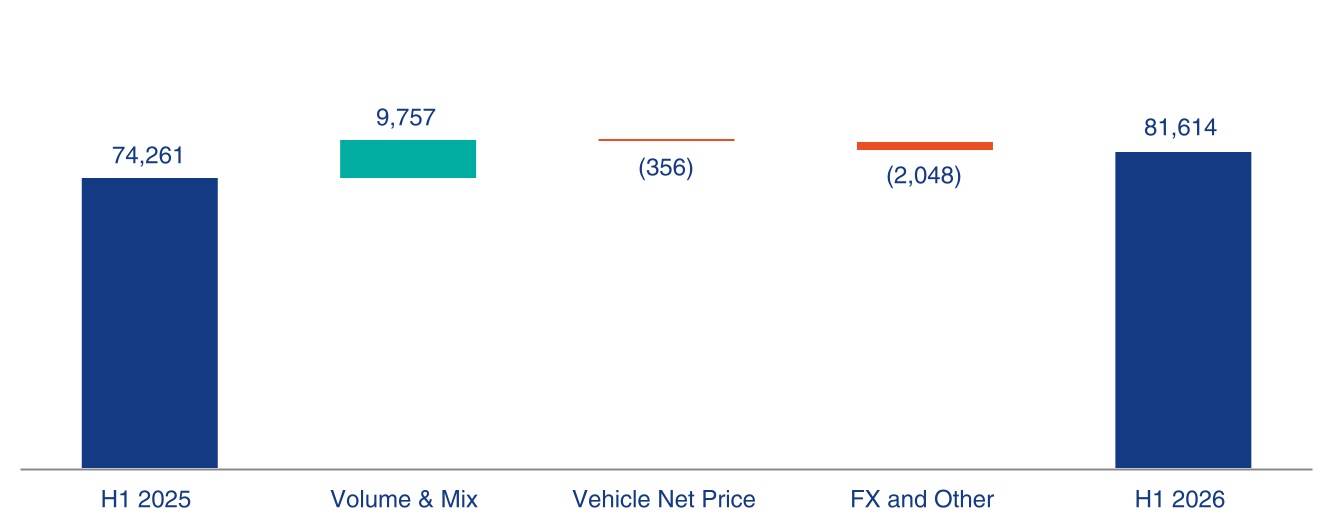
The following charts present the Company’s Net revenues walk by operational driver for the three and six months ended June 30, 2026 compared to the corresponding periods in 2025:
Net revenues by operational drive - Three months ended June 30, 2026 compared to the three months ended June 30, 2025 (€ million)
Net revenues by operational drive - Six months ended June 30, 2026 compared to the six months ended June 30, 2025 (€ million)
See — Results by segment below for a discussion of Net revenues for each of our five reportable segments (North America, Enlarged Europe, Middle East & Africa, South America and Asia Pacific).
Cost of revenues
| | | | | | | | | | | | | | | | | | | | | | | | | | | | | | | | | | | | | | |
| Three months ended June 30, | | Increase/(Decrease) | | | | Six Months Ended June 30, | | Increase/(Decrease) |
| 2026 | | 2025 | | 2026 vs. 2025 | | (€ million) | | 2026 | | 2025 | | 2026 vs. 2025 |
| 38,708 | | 36,079 | | 7.3 | % | | Cost of revenues | | 72,411 | | 68,267 | | 6.1 | % |
| 89.0 | % | | 93.8 | % | | | | Cost of revenues as % of Net revenues | | 88.7 | % | | 91.9 | % | | |
Cost of revenues increased for the three and six months ended June 30, 2026 compared to the corresponding periods in 2025, primarily related to increased volumes in North America and Enlarged Europe.
The increase was partially offset by lower costs in 2026 resulting from:
•the non-recurrence of recall campaign costs in Enlarged Europe (€0.5 billion for the three and six month periods ended June 30, 2025);
•a reduction of regulatory expenses in North America of €1.3 billion and €1.0 billion for the three and six month periods ended June 30, 2026, respectively. Of these amounts, net benefits of €0.3 billion and €0.4 billion, respectively, were excluded from AOI for the three and six months ended June 30, 2026. Comparatively, net costs of €0.3 billion were excluded from AOI in both the three and six months ended June 30, 2025;
•lower impairment and costs related to product plan realignments and program cancellations. During the three and six months ended June 30, 2026, costs related to product plan realignments and program cancellations amounted to €1 million and €40 million, respectively, primarily related to North America. Comparative amounts for the three and six months ended June 30, 2025 included impairment charges and costs related to program cancellations of €315 million and €377 million, respectively, related to North America and certain Maserati and Alfa Romeo vehicle platforms;
•lower costs associated with the Takata airbags recall campaign in Enlarged Europe. For the three and six month periods, respectively, expenses of €49 million and €92 million were recognized compared to €174 million and €239 million for the corresponding periods of 2025; and
•the non-recurrence of impairment and other costs related to the discontinuation of the hydrogen fuel cell technology development program in Enlarged Europe (€51 million for the three and six month periods ended June 30, 2025).
Selling, general and other costs
| | | | | | | | | | | | | | | | | | | | | | | | | | | | | | | | | | | | | | |
| Three months ended June 30, | | Increase/(Decrease) | | | | Six Months Ended June 30, | | Increase/(Decrease) |
| 2026 | | 2025 | | 2026 vs. 2025 | | (€ million) | | 2026 | | 2025 | | 2026 vs. 2025 |
| 2,483 | | 1,828 | | 35.8 | % | | Selling, general and other costs | | 4,785 | | 4,174 | | 14.6 | % |
| 5.7 | % | | 4.8 | % | | | | Selling, general and other costs as % of Net revenues | | 5.9 | % | | 5.6 | % | | |
Selling, general and other expenses increased for the three and six months ended June 30, 2026 compared to the corresponding periods in 2025, primarily as a result of higher marketing and advertising expenditures in Enlarged Europe and North America, partially offset by cost-saving actions.
The increase also includes benefits recorded in 2025 which did not recur in 2026, primarily:
•the recognition of indirect tax credits in South America (€334 million and €293 million for the three and six month periods, respectively); and
•a gain on disposal from the sale of the Luton plant in the UK (nil and €66 million for the three and six month periods, respectively).
Research and development costs
| | | | | | | | | | | | | | | | | | | | | | | | | | | | | | | | | | | | | | |
| Three months ended June 30, | | Increase/(Decrease) | | | | Six Months Ended June 30, | | Increase/(Decrease) |
| 2026 | | 2025 | | 2026 vs. 2025 | | (€ million) | | 2026 | | 2025 | | 2026 vs. 2025 |
| 807 | | | 678 | | | 19.0 | % | | Research and development expenditures expensed | | 1,669 | | | 1,411 | | | 18.3 | % |
| 462 | | | 513 | | | (9.9 | %) | | Amortization of capitalized development expenditures | | 923 | | | 1,088 | | | (15.2 | %) |
| 39 | | | 747 | | | (94.8 | %) | | Impairment and write-off of capitalized development expenditures | | 156 | | | 872 | | | (82.1 | %) |
| 1,308 | | 1,938 | | (32.5 | %) | | Total Research and development costs | | 2,748 | | 3,371 | | (18.5 | %) |
| | | | | | | | | | | | | | | | | | | | | | | | | | |
| Three months ended June 30, | | | | Six Months Ended June 30, |
| 2026 | | 2025 | | (€ million) | | 2026 | | 2025 |
| 1.9 | % | | 1.8 | % | | Research and development expenditures expensed as % of Net revenues | | 2.0 | % | | 1.9 | % |
| 1.1 | % | | 1.3 | % | | Amortization of capitalized development expenditures as % of Net revenues | | 1.1 | % | | 1.5 | % |
| 0.1 | % | | 1.9 | % | | Impairment and write-off of capitalized development expenditures as % of Net revenues | | 0.2 | % | | 1.2 | % |
| 3.0 | % | | 5.0 | % | | Total Research and development cost as % of Net revenues | | 3.4 | % | | 4.5 | % |
Research and development expenditures expensed increased by €129 million and €258 million for the three and six months ended June 30, 2026, respectively, as compared to the corresponding periods in 2025 primarily resulting from:
•higher product serial life activities (quality improvements, value optimization and product actions) aimed at further enhancing the quality of our offerings to customers (€86 million and €111 million for the three and six month periods, respectively);
•increased advanced engineering activities for products included in the long-range plan (€19 million and €36 million for the three and six month periods, respectively); and
•the expensing of development costs incurred on platforms that were fully impaired in 2025 and are therefore no longer eligible for capitalization (€36 million and €70 million for the three and six month periods, respectively).
Amortization of capitalized development expenditures during the three and six months ended June 30, 2026 decreased by 9.9 percent and 15.2 percent, respectively as compared to the corresponding periods in 2025, primarily due to reduced amortization following impairments recognized in 2025.
Impairments of capitalized development expenditures recognized in the three and six months ended June 30, 2026 were attributable to impairments of platform assets in North America related to program cancellations. Impairments of capitalized development expenditures recognized in the three and six months ended June 2025 primarily related to (i) impairments of platforms used for Maserati and Alfa Romeo vehicles of €348 million, (ii) impairments as a result of the Company’s decision to discontinue its hydrogen fuel cell technology of €278 million, and (iii) impairments as a result of program cancellations. Total Research and development expenditures for the three and six months ended June 30, 2026 and 2025 were as follows:
| | | | | | | | | | | | | | | | | | | | | | | | | | | | | | | | | | | | | | |
| Three months ended June 30, | | Increase/(Decrease) | | | | Six Months Ended June 30, | | Increase/(Decrease) |
| 2026 | | 2025 | | 2026 vs. 2025 | | (€ million) | | 2026 | | 2025 | | 2026 vs. 2025 |
| 660 | | 840 | | (21.4 | %) | | Capitalized development expenditures excl. borrowing costs(1) | | 1,273 | | 1,705 | | (25.3 | %) |
| 807 | | 678 | | 19.0 | % | | Research and development expenditures expensed | | 1,669 | | 1,411 | | 18.3 | % |
| 1,467 | | 1,518 | | (3.4 | %) | | Total Research and development expenditures | | 2,942 | | 3,116 | | (5.6 | %) |
| | | | | | | | | | | | |
| 45.0 | % | | 55.3 | % | | | | Capitalized development expenditures as % of Total Research and development expenditures | | 43.3 | % | | 54.7 | % | | |
| 3.4 | % | | 3.9 | % | | | | Total Research and development expenditures as % of Net revenues | | 3.6 | % | | 4.2 | % | | |
(1) Additions to capitalized development expenditures of €685 million and €899 million for the three months ended June 30, 2026 and 2025, respectively, and €1,316 million and €1,822 million for the six months ended June 30, 2026 and 2025, respectively, adjusted in each case to remove capitalized borrowing costs of €25 million and €59 million for the three months ended June 30, 2026 and 2025, respectively, and €43 million and €117 million for the six months ended June 30, 2026 and 2025, respectively, in accordance with IAS 23 – Borrowing Costs (Revised)
Total Research and development expenditures during the three and six months ended June 30, 2026 decreased compared to the corresponding periods in 2025. Research and development expenditures expensed increased by 19.0 percent and 18.3 percent, respectively, while capitalized development expenditures (excluding borrowing costs) decreased by 21.4 percent and 25.3 percent, respectively. The decrease in Capitalized development expenditure, was primarily driven by: (i) lower capitalization resulting from asset impairments, and (ii) timing of new product development activities.
Restructuring costs
| | | | | | | | | | | | | | | | | | | | | | | | | | | | | | | | | | | | | | |
| Three months ended June 30, | | Increase/(Decrease) | | | | Six Months Ended June 30, | | Increase/(Decrease) |
| 2026 | | 2025 | | 2026 vs. 2025 | | (€ million) | | 2026 | | 2025 | | 2026 vs. 2025 |
| 384 | | | 399 | | | (3.8 | %) | | Restructuring costs | | 482 | | | 522 | | | (7.7) | % |
Restructuring costs for the three and six months ended June 30, 2026 decreased compared to the corresponding periods in 2025, primarily related to decreased levels of workforce reductions in Enlarged Europe.
Share of the profit/(loss) of equity method investees
| | | | | | | | | | | | | | | | | | | | | | | | | | | | | | | | | | | | | | |
| Three months ended June 30, | | Increase/(Decrease) | | | | Six Months Ended June 30, | | Increase/(Decrease) |
| 2026 | | 2025 | | 2026 vs. 2025 | | (€ million) | | 2026 | | 2025 | | 2026 vs. 2025 |
| 32 | | | (396) | | | n.m. | | Share of the profit/(loss) of equity method investees | | 143 | | | (433) | | | n.m. |
n.m. = not meaningful
The Company recorded a share of profit of equity method investees for the three and six months ended June 30, 2026 compared to a share of loss of equity method investees in the corresponding periods of 2025. The share of profit in 2026 was primarily attributable to its investment in StarPlus Energy LLC. The share of loss in 2025 was mainly due to €404 million of write-offs recorded in three months ended June 30, 2025, as a result of the Company’s decision to discontinue its hydrogen fuel cell technology program.
Net financial expenses/(income)
| | | | | | | | | | | | | | | | | | | | | | | | | | | | | | | | | | | | | | |
| Three months ended June 30, | | Increase/(Decrease) | | | | Six Months Ended June 30, | | Increase/(Decrease) |
| 2026 | | 2025 | | 2026 vs. 2025 | | (€ million) | | 2026 | | 2025 | | 2026 vs. 2025 |
| 202 | | | 63 | | | 220.6 | % | | Net financial expenses/(income) | | 352 | | 160 | | 120.0 | % |
Net financial expenses increased for the three and six months ended June 30, 2026 compared to the corresponding periods of 2025. The increase was primarily driven by lower interest income from liquidity investments, reflecting both reduced liquidity levels and a decline in short-term market rates, higher interest expense on warranty provisions and lower capitalized interest, partially offset by expenses recognized during 2025 upon termination of commodity derivative contracts of €138 million, which did not recur in 2026.
Tax expense/(benefit)
| | | | | | | | | | | | | | | | | | | | | | | | | | | | | | | | | | | | | | |
| Three months ended June 30, | | Increase/(Decrease) | | | | Six Months Ended June 30, | | Increase/(Decrease) |
| 2026 | | 2025 | | 2026 vs. 2025 | | (€ million) | | 2026 | | 2025 | | 2026 vs. 2025 |
| 207 | | (588) | | n.m. | | Tax expense/(benefit) | | 368 | | (614) | | n.m. |
| 41.4 | % | | 23.9 | % | | 17.5 | % | | Effective tax rate | | 35.5 | % | | 21.4 | % | | 14.1 | % |
n.m. = not meaningful
Tax expense was €207 million for the three months ended June 30, 2026, compared to a tax benefit of €588 million for the corresponding period in 2025. For the six months ended June 30, 2026, tax expense was €368 million, compared to a tax benefit of €614 million for the corresponding period in 2025. These variations primarily reflect the Company’s transition from pre-tax losses in the three and six month periods ended June 30, 2025 to pre-tax income in the corresponding periods of 2026.
The effective tax rate of 41.4 percent for the three months ended June 30, 2026, was higher than the effective tax rate of 23.9 percent for the three months ended June 30, 2025. The increase primarily reflects a different mix of results by jurisdiction, with a greater proportion of pre-tax losses incurred in jurisdictions where deferred tax assets are not recognized and, accordingly, such losses did not give rise to a corresponding tax benefit.
For the six months ended June 30, 2026, the effective tax rate increased to 35.5 percent from 21.4 percent in the corresponding period of 2025, driven by the same factors described above.
The Company’s ability to realize the full value of its deferred tax assets is dependent upon the generation of future taxable income. Based on recent losses generated in certain jurisdictions, we are closely monitoring the realizability of our recognized deferred tax assets. If actual future taxable income differs from the current estimates, the Company may be required to de-recognize deferred tax assets, which could materially impact future results.
Net profit/(loss)
| | | | | | | | | | | | | | | | | | | | | | | | | | | | | | | | | | | | | | |
| Three months ended June 30, | | Increase/(Decrease) | | | | Six Months Ended June 30, | | Increase/(Decrease) |
| 2026 | | 2025 | | 2026 vs. 2025 | | (€ million) | | 2026 | | 2025 | | 2026 vs. 2025 |
| 293 | | | (1,869) | | | n.m. | | Net profit/(loss) | | 670 | | | (2,256) | | | n.m. |
n.m. = not meaningful
The Company recorded for the three and six months ended June 30, 2026, a Net profit of €293 million and €670 million, respectively, compared to Net losses of €1,869 million and €2,256 million in the corresponding periods of 2025. The improvement in both periods was primarily attributable to higher Net revenues driven by volume growth in North America and the non-recurrence of costs incurred in 2025 related to: (i) charges recognized as a result of program cancellations and corresponding costs, (ii) charges recognized as a result of the Company’s decision to discontinue its hydrogen fuel cell technology program, and (iii) impairment of platforms used for Maserati and Alfa Romeo vehicles.
Adjusted operating income/(loss)
| | | | | | | | | | | | | | | | | | | | | | | | | | | | | | | | | | | | | | |
| Three months ended June 30, | | Increase/(Decrease) | | | | Six Months Ended June 30, | | Increase/(Decrease) |
| 2026 | | 2025 | | 2026 vs. 2025 | | (€ million) | | 2026 | | 2025 | | 2026 vs. 2025 |
| 773 | | 213 | | 262.9 | % | | Adjusted operating income/(loss) | | 1,733 | | 540 | | 220.9 | % |
| 1.8 | % | | 0.6 | % | | 120 bps | | Adjusted operating income/(loss) margin (%) | | 2.1 | % | | 0.7 | % | | 140 bps |
n.m. = not meaningful
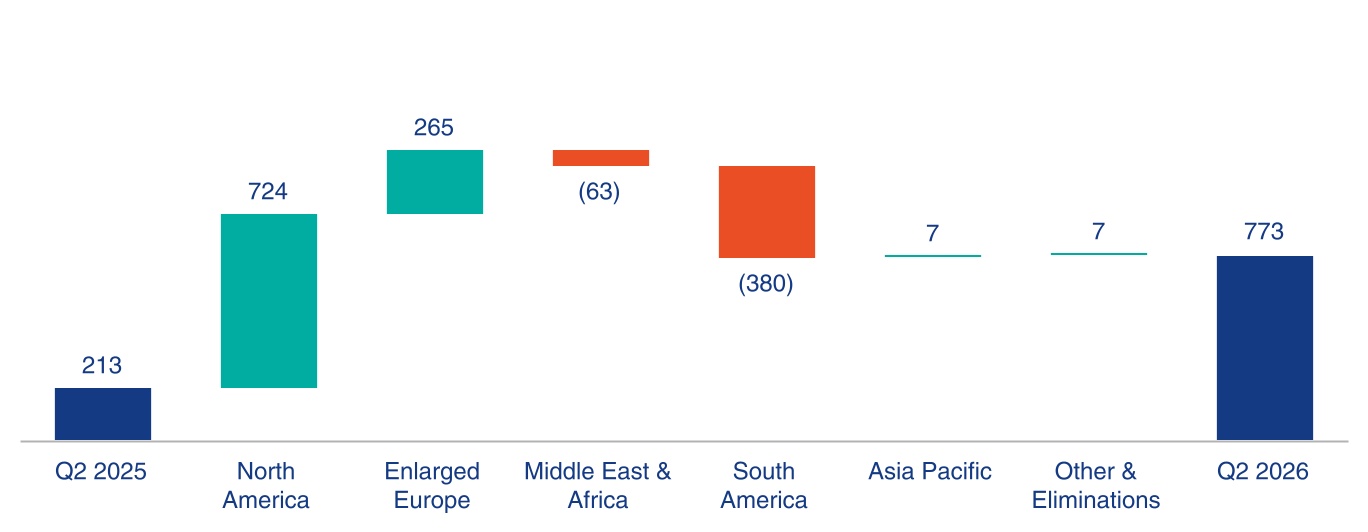
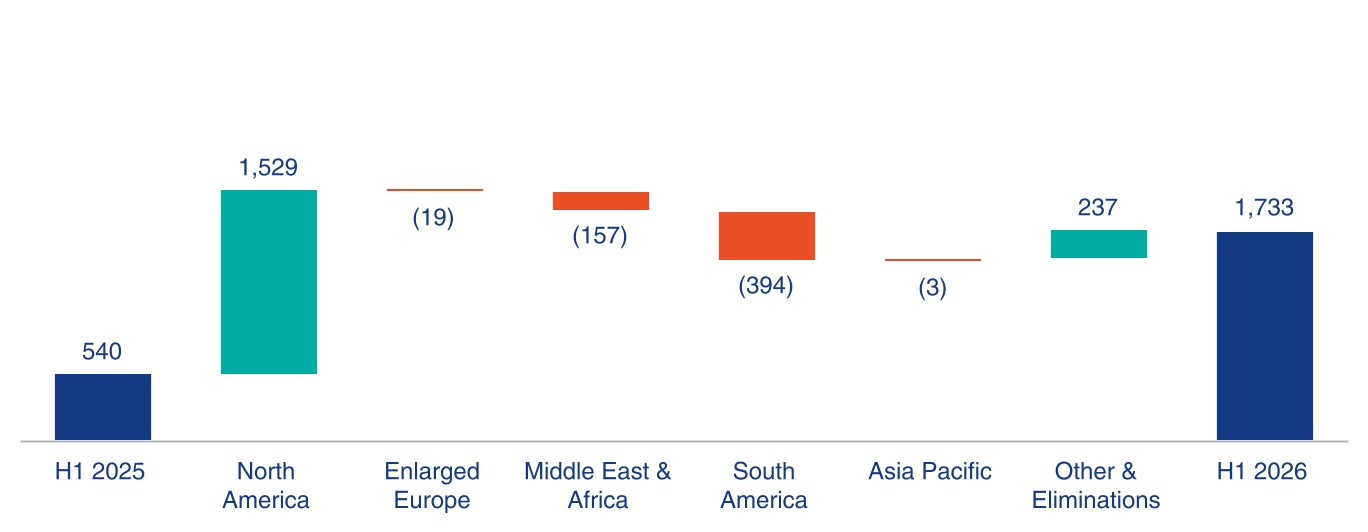
The following charts present the change in Adjusted operating income/(loss) by segment for the three and six months ended June 30, 2026 compared to the corresponding periods in 2025:
Adjusted operating income/(loss) change by segment - Three months ended June 30, 2026 compared to the three months ended June 30, 2025 (€ million)
Adjusted operating income/(loss) change by segment - Six months ended June 30, 2026 compared to the six months ended June 30, 2025 (€ million)
Refer to — Results by segment below for a discussion of Adjusted operating income/(loss) for each of our five reportable segments (North America, Enlarged Europe, Middle East & Africa, South America and Asia Pacific).
The following table is the reconciliation of Net profit/(loss), which is the most directly comparable measure included in the Interim Condensed Consolidated Income Statement, to Adjusted operating income:
| | | | | | | | | | | | | | |
| Three months ended June 30, 2026 | | (€ million) | | Six Months Ended June 30, 2026 |
| 293 | | | Net profit/(loss) | | 670 | |
| 207 | | | Tax expense/(benefit) | | 368 | |
| 202 | | | Net financial expenses/(income) | | 352 | |
| 702 | | | Operating income/(loss) | | 1,390 | |
| | | | |
| | Adjustments: | | |
| 384 | | | Restructuring and other costs, net of reversals | | 482 | |
| 52 | | | Takata airbags recall campaign | | 106 | |
| 40 | | | Costs related to product plan realignments and program cancellations | | 196 | |
| — | | | U.S. GHG regulation change | | (66) | |
| (317) | | | Renegotiated regulatory purchase commitments of credits | | (317) | |
| (71) | | | (Gains)/losses on disposal of investments | | (59) | |
| (17) | | | Other | | 1 | |
| 71 | | | Total Adjustments | | 343 | |
| 773 | | | Adjusted operating income/(loss) | | 1,733 | |
| | | | | | | | | | | | | | |
| Three months ended June 30, 2025 | | (€ million) | | Six Months Ended June 30, 2025 |
| (1,869) | | | Net profit/(loss) | | (2,256) | |
| (588) | | | Tax expense/(benefit) | | (614) | |
| 63 | | | Net financial expenses/(income) | | 160 | |
| (2,394) | | | Operating income/(loss) | | (2,710) | |
| | | | |
| | Adjustments: | | |
| 399 | | | Restructuring and other costs, net of reversals | | 522 | |
| 174 | | | Takata airbags recall campaign | | 239 | |
| 578 | | | Platform impairments | | 578 | |
| 296 | | | Costs related to program cancellations | | 789 | |
| 733 | | | Fuel cell program discontinuation | | 733 | |
| 269 | | | Corporate average fuel economy (“CAFE”) penalty rate | | 269 | |
| 246 | | | Stellantis Türkiye disposal | | 246 | |
| (88) | | | Other | | (126) | |
| 2,607 | | | Total Adjustments | | 3,250 | |
| 213 | | | Adjusted operating income/(loss) | | 540 | |
During the three months ended June 30, 2026, Adjusted operating income excluded adjustments primarily related to:
•€384 million of restructuring and other costs, primarily related to workforce reductions, mainly in Enlarged Europe;
•€52 million related to stop-drive campaign on certain vehicles, mainly in Enlarged Europe;
•€40 million primarily related to costs incurred as result of product plan realignments and program cancellations in North America;
•€317 million net gain recognized within Cost of revenues related to renegotiated contractual commitments for the purchase of regulatory compliance credits; and
•€71 million comprised primarily of gains recognized as a result of the loss of significant influence over Archer Aviation Inc (“Archer”) and the resulting termination of the equity method (refer to Note 2, Scope of consolidation in the Interim Condensed Consolidated Financial Statements included in this Interim Report for additional information), and a dilution gain related to the investment in Comau Group.
During the six months ended June 30, 2026, Adjusted operating income excluded adjustments primarily related to:
•€482 million of restructuring and other costs, primarily related to workforce reductions, mainly in Enlarged Europe;
•€106 million related to stop-drive campaign on certain vehicles, mainly in Enlarged Europe;
•€196 million primarily related to costs incurred as result of product plan realignments and program cancellations, including €221 million recognized in North America, as well as a provision reversal of €25 million in Enlarged Europe;
•€66 million net gain recognized within Cost of revenues related to the repeal of GHG emissions standards in the U.S. The net gain consisted of an impairment of GHG-related Other intangible assets of €284 million and the elimination of the related GHG provision of €350 million;
•€317 million net gain recognized within Cost of revenues related to renegotiated contractual commitments for the purchase of regulatory compliance credits; and
•€59 million comprised primarily of (i) gains recognized as a result of the loss of significant influence over Archer and the resulting termination of the equity method (refer to Note 2, Scope of consolidation in the Interim Condensed Consolidated Financial Statements included in this Interim Report for additional information), and a dilution gain related to the investment in Comau Group, and (ii) gains/(losses) recognized on the disposal of non-significant assets in Enlarged Europe.
During the three months ended June 30, 2025, Adjusted operating income excluded adjustments primarily related to:
•€399 million of Restructuring and other costs, net of reversals, primarily related to workforce reductions, mainly in Enlarged Europe;
•€174 million of Takata airbags recall campaign related to stop-drive campaign on certain vehicles in Enlarged Europe announced in June 2025;
•€578 million of Platform impairments, due to reduced volumes, platforms used for Maserati and Alfa Romeo vehicles were impaired and recognized in Enlarged Europe for €578 million;
•€296 million of costs related to program cancellations;
•€733 million of Fuel cell program discontinuation during the three months ended June 30, 2025, Stellantis decided to discontinue its fuel cell strategy. As a result, the following items have been impaired: (i) investment in Symbio (€179 million), (ii) loans granted to Symbio (€162 million), (iii) capitalized development expenditures and property, plant and equipment related to fuel cells (€329 million) and (iv) in addition, provisions for risks were recognized (€63 million);
•€269 million of CAFE penalty rate. As a result of the elimination of CAFE fines with the enactment of One Big Beautiful Bill Act (“OBBB”), net expense included (i) elimination of the CAFE provision of €844 million, (ii) impairment of the regulatory credit assets of €609 million, and (iii) onerous contracts related to contractual purchase commitments for CAFE credits of €504 million;
•€246 million of Stellantis Türkiye disposal, driven primarily by the recycling of the cumulative translation reserve from Equity to the Consolidated Income Statement upon disposal; and
•€88 million of Other, primarily of (i) adjustments to costs previously recognized to support the workforce during the transformation of certain plants in North America, (ii) gains on disposal of investments in Enlarged Europe and (iii) a gain from dilution related to the investment in Archer.
During the six months ended June 30, 2025, Adjusted operating income/(loss) excluded adjustments primarily related to:
• €522 million of restructuring and other costs, primarily related to workforce reductions, mainly in Enlarged Europe, partially offset by a €41 million reduction in estimated North America restructuring costs;
• €239 million of Takata airbags recall campaign, related to stop-drive campaign on certain vehicles in Enlarged Europe announced in June 2025;
• €578 million of platform impairments. Due to reduced volumes, platforms used for Maserati and Alfa Romeo vehicles were impaired and recognized in Maserati for €552 million and in Enlarged Europe for €26 million;
• €789 million of costs related to program cancellations;
• €733 million related to the Company’s decision to discontinue its hydrogen fuel cell strategy. As a result, the following items have been impaired: (i) investment in Symbio (€179 million), (ii) loans granted to Symbio (€162 million), (iii) capitalized development expenditures and property, plant and equipment related to fuel cells (€329 million), and (iv) in addition, provisions for risks were recognized (€63 million);
• €269 million of CAFE penalty rate. As a result of the elimination of CAFE fines with the enactment of the OBBB, the Company recognized a net expense of €97 million, comprised of net €172 million of CAFE credits recognized as a reduction of Cost of revenues, which remains included in Adjusted operating income as these amounts reduced prior year CAFE fines, and a net expense of €269 million, which is excluded from AOI and comprised of (i) elimination of the CAFE provision of €844 million, (ii) impairment of the regulatory credit assets of €609 million, and (iii) onerous contracts related to contractual purchase commitments for CAFE credits of €504 million;
• €246 million related to the sale of Stellantis Türkiye to the Company’s joint venture, Tofas-Turk Otomobil Fabrikasi A.S. (“Tofas”), for which the Company recognized an estimated loss on disposal of €246 million, driven primarily by the recycling of the cumulative translation reserve from Equity to the Consolidated Income Statement upon disposal; and
• €(126) million of Other, primarily related to (i) adjustments to costs previously recognized to support the workforce during the transformation of certain plants in North America, (ii) gains on sales of real estate in Enlarged Europe, and (iii) a gain from dilution related to the investment in Archer.
Diluted and Adjusted diluted EPS
| | | | | | | | | | | | | | | | | | | | | | | | | | | | | | | | | | | | | | |
| Three months ended June 30, | | Increase/(Decrease) | | | | Six Months Ended June 30, | | Increase/(Decrease) |
| 2026 | | 2025 | | 2026 vs. 2025 | | (€ per share) | | 2026 | | 2025 | | 2026 vs. 2025 |
| 0.07 | | | (0.65) | | | n.m. | | Diluted EPS | | 0.20 | | | (0.78) | | | n.m. |
| 0.12 | | | 0.15 | | | (20.0) | % | | Adjusted diluted EPS | | 0.32 | | | 0.18 | | | 77.8 | % |
n.m. = not meaningful
The following table summarizes the reconciliation of Diluted (loss)/earnings per share to Adjusted diluted earnings per share: | | | | | | | | | | | | | | | | | | | | | | | | | | |
| Three months ended June 30, | | | | Six Months Ended June 30, |
| 2026 | | 2025 | | (€ million except otherwise noted) | | 2026 | | 2025 |
| 266 | | | (1,869) | | | Net (loss)/profit attributable to owners of the parent | | 656 | | | (2,240) | |
| (72) | | | — | | | Coupon and tax impacts on Hybrid perpetual notes(1) | | (64) | | | — | |
| 2,898,791 | | | 2,884,704 | | | Weighted average number of shares outstanding (000) | | 2,898,144 | | | 2,882,611 | |
| 18.903 | | | — | | | Number of shares deployable for share-based compensation (000)(2) | | 11.233 | | | — | |
| 2,917,694 | | | 2,884,704 | | | Weighted average number of shares outstanding for diluted earnings per share (000) | | 2,909,377 | | | 2,882,611 | |
| 0.07 | | | (0.65) | | | Diluted (loss)/earnings per share (A) (€/share) | | 0.20 | | | (0.78) | |
| | | | | | | | |
| 71 | | | 2,607 | | | Adjustments, per above | | 343 | | | 3,250 | |
| 67 | | | (308) | | | Tax impact on adjustments(3) | | 19 | | | (470) | |
| | | | | | | | |
| 138 | | | 2,299 | | | Total adjustments, net of taxes | | 362 | | | 2,780 | |
| — | | | 17.162 | | | Number of shares deployable for share-based compensation (000)(2) | | — | | | 17,162 | |
| — | | | 0.00 | | | Adjusted dilutive impact per share | | — | | | 0.00 | |
| 0.05 | | | 0.80 | | | Impact of adjustments above, net of taxes, on Diluted earnings per share (B) (€/share) | | 0.12 | | | 0.96 | |
| 0.12 | | | 0.15 | | | Adjusted Diluted earnings per share (€/share) (A+B) | | 0.32 | | | 0.18 | |
(1) Refer to Note 18, Equity in the Interim Condensed Consolidated Financial Statements included in this Interim Report for additional information
(2) For the three and six months ended June 30, 2025, the Company reported a loss attributable to the owners of the parent. Consequently, the potential dilutive impact of share-based payment plans was excluded from the calculation of diluted earnings/(loss) per share, as their inclusion would have been anti-dilutive. However, for the purpose of calculating Adjusted diluted earnings per share, the adjusted net result reflects a profit. Therefore, the potential dilutive effect of share-based payment plans has been included in this calculation, as their impact is dilutive under these circumstances
(3) Tax impact on adjustments is calculated based on the expected local country tax implications for each adjustment
Results by segment
The following are the results by segment for the three and six months ended June 30, 2026 and 2025:
| | | | | | | | | | | | | | | | | | | | | | | | | | | | | | | | | | | | | | | | | | | | | | |
| | Net revenues(2) | | | | Adjusted operating income/(loss) | | | | Consolidated Shipments |
| | Three months ended June 30, 2026 |
(€ million, except shipments which are in thousands of units) | | 2026 | | 2025 | | | | 2026 | | | | 2025 | | | | 2026 | | 2025 | | |
| North America | | 18,193 | | | 13,834 | | | | | 284 | | | | | (440) | | | | | 445 | | 323 | | | |
Enlarged Europe | | 16,426 | | | 16,387 | | | | | (94) | | | | | (359) | | | | | 762 | | 723 | | | |
| Middle East & Africa | | 2,565 | | | 2,674 | | | | | 329 | | | | | 392 | | | | | 121 | | 125 | | | |
South America | | 4,338 | | | 4,092 | | | | | 402 | | | | | 782 | | | | | 253 | | 260 | | | |
Asia Pacific | | 499 | | | 524 | | | | | 27 | | | | | 20 | | | | | 16 | | 16 | | | |
| Total Segments | | 42,021 | | | 37,511 | | | | | 948 | | | | | 395 | | | | | 1,597 | | | 1,447 | | | |
| Other activities | | 1,582 | | | 1,031 | | | | | 79 | | | | | (164) | | | | | — | | | — | | | |
Unallocated items & eliminations(1) | | (121) | | | (94) | | | | | (254) | | | | | (18) | | | | | — | | | — | | | |
| Total | | 43,482 | | | 38,448 | | | | | 773 | | | | | 213 | | | | | 1,597 | | | 1,447 | | | |
| | | | | | | | | | | | | | | | | | | | | | | | | | | | | | | | | | | | | | | | | | | | | | |
| | Net revenues(2) | | | | Adjusted operating income/(loss)(2) | | | | Consolidated Shipments |
| | Six Months Ended June 30, |
(€ million, except shipments which are in thousands of units) | | 2026 | | 2025 | | | | 2026 | | | | 2025 | | | | 2026 | | 2025 | | |
| North America | | 34,307 | | | 28,303 | | | | | 547 | | | | | (982) | | | | | 824 | | 648 | | | |
Enlarged Europe | | 30,801 | | | 30,557 | | | | | (86) | | | | | (67) | | | | | 1,399 | | 1,291 | | | |
| Middle East & Africa | | 4,953 | | | 4,962 | | | | | 611 | | | | | 768 | | | | | 232 | | 225 | | | |
South America | | 7,961 | | | 7,771 | | | | | 795 | | | | | 1,189 | | | | | 472 | | 471 | | | |
Asia Pacific | | 934 | | | 1,010 | | | | | (3) | | | | | — | | | | | 31 | | 29 | | | |
| Total Segments | | 78,956 | | | 72,603 | | | | | 1,864 | | | | | 908 | | | | | 2,958 | | | 2,664 | | | |
| Other activities | | 2,875 | | | 1,873 | | | | | 265 | | | | | (73) | | | | | — | | | — | | | |
Unallocated items & eliminations(1) | | (217) | | | (215) | | | | | (396) | | | | | (295) | | | | | — | | | — | | | |
| Total | | 81,614 | | | 74,261 | | | | | 1,733 | | | | | 540 | | | | | 2,958 | | | 2,664 | | | |
(1) Primarily includes intercompany transactions which are eliminated on consolidation
(2) Effective January 2026, the Company’s segment structure was updated to align with how the CODM reviews performance and allocates resources. Under the revised structure, the CODM reviews the business through the following operating and reportable segments: North America; Enlarged Europe; Middle East & Africa; South America; and Asia Pacific. Refer to Note 1, Basis of Preparation in the Interim Condensed Consolidated Financial Statements included in this Interim Report for additional information
The following are the market shares by segment for the three and six months ended June 30, 2026 and 2025:
| | | | | | | | | | | | | | | | | | | | | | | | | | |
| | Stellantis market share(1) | | Stellantis and LPM(2) market share |
| | Three months ended June 30, | | Three months ended June 30, |
| | 2026 | | 2025 | | 2026 | | 2025 |
North America | | 7.4 | % | | 7.0 | % | | 7.4 | % | | 7.0 | % |
Enlarged Europe | | 15.2 | % | | 15.9 | % | | 15.9 | % | | 16.1 | % |
| Middle East & Africa | | 12.2 | % | | 12.0 | % | | 12.3 | % | | 12.0 | % |
South America | | 19.1 | % | | 23.3 | % | | 19.4 | % | | 23.3 | % |
| Asia Pacific | | 0.2 | % | | 0.3 | % | | 0.3 | % | | 0.3 | % |
| | | | | | | | | | | | | | | | | | | | | | | | | | |
| | Stellantis market share(1) | | Stellantis and LPM(2) market share |
| | Six Months Ended June 30, | | Six Months Ended June 30, |
| | 2026 | | 2025 | | 2026 | | 2025 |
North America | | 7.6 | % | | 7.1 | % | | 7.6 | % | | 7.1 | % |
Enlarged Europe | | 16.0 | % | | 16.2 | % | | 16.6 | % | | 16.3 | % |
| Middle East & Africa | | 11.9 | % | | 11.5 | % | | 11.9 | % | | 11.5 | % |
South America | | 20.0 | % | | 23.5 | % | | 20.2 | % | | 23.5 | % |
| Asia Pacific | | 0.3 | % | | 0.3 | % | | 0.3 | % | | 0.3 | % |
(1) Industry and market share information is derived from third-party industry sources (e.g. Agence Nationale des Titres Sécurisés (“ANTS”), Associação Nacional dos Fabricantes de Veículos Automotores (“ANFAVEA”), Ministry of Infrastructure and Sustainable Mobility (“MIMS”), Ward’s Automotive) and internal information. Represents passenger cars (“PC”) and light commercial vehicles (“LCV”), except as noted
•Enlarged Europe excludes Russia and Belarus;
•Middle East & Africa excludes Iran, Sudan and Syria;
•South America excludes Cuba; and
•Asia Pacific reflects the major markets where Stellantis competes including China (PC only) including licensed sales from Dongfeng Peugeot Citroën Automobiles, Japan (PC), India (PC), South Korea (PC + Pickups), Australia, New Zealand and South East Asia
(2) This metric combines Stellantis-owned brands and Leapmotor vehicles distributed by Leapmotor International, a jointly established, Stellantis-controlled company created in 2024 and owned 51 percent by Stellantis and 49 percent by Leapmotor, to distribute Leapmotor-branded vehicles outside of China. Stellantis does not design, or manufacture Leapmotor-branded vehicles and does not own the Leapmotor brand or intellectual property
Figures may not add due to rounding. Prior period figures have been updated to reflect current information provided by third-party industry sources
Refer to Note 20, Segment reporting in the Interim Condensed Consolidated Financial Statements included in this Interim Report for additional information on the Company’s reportable segments.
The following is a discussion of Net revenues, Shipments and Adjusted operating income/(loss) for each of our five reportable segments for the three and six months ended June 30, 2026 as compared to the three and six months ended June 30, 2025.
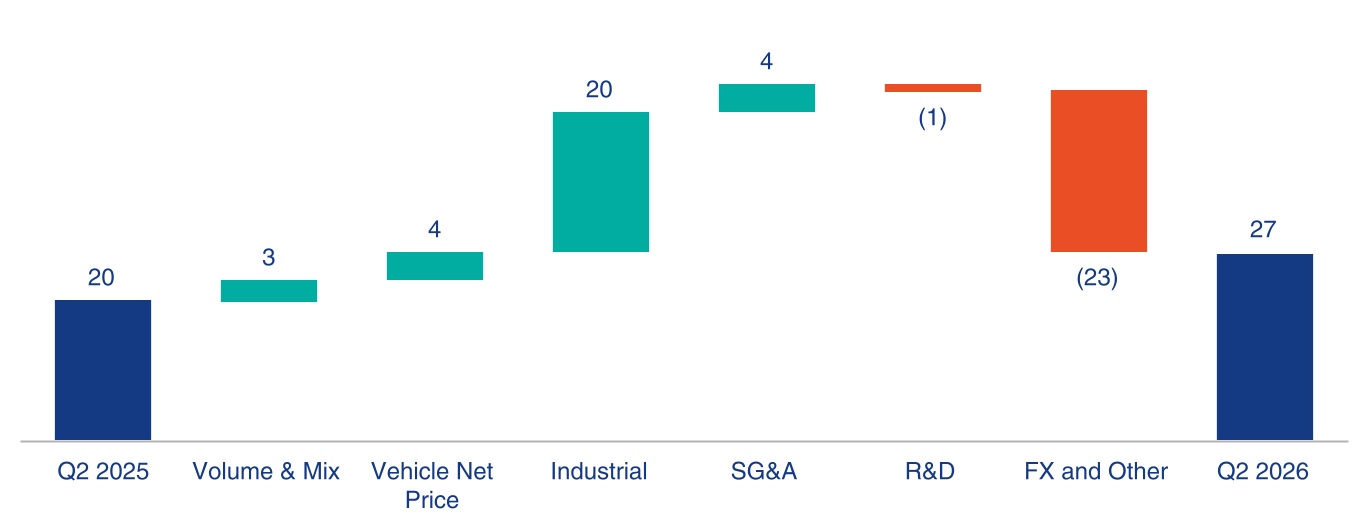
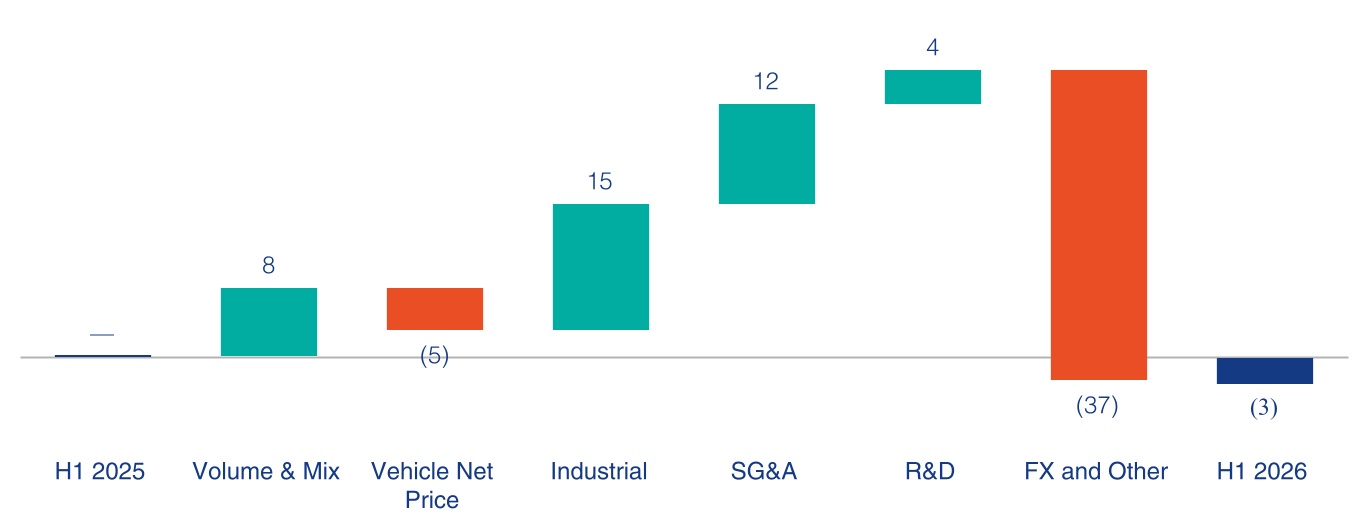
•Volume & Mix: Reflects changes in new car volumes (consolidated shipments), driven by industry volume, market share and dealer stocks, and mix evolutions such as channel, product line and trim mix. It also reflects the impact of some non-pricing items;
•Vehicle Net Price: Reflects changes in prices, net of discounts and other sales incentive programs;
•Industrial: Reflects manufacturing and purchasing cost changes associated with content, technology and enhancement of vehicle features, as well as industrial, logistics and purchasing efficiencies and inefficiencies. The impact of fixed manufacturing costs absorption related to the change in production output is included here. Cost changes to purchasing of raw materials, warranty, compliance costs, as well as depreciation related to property, plant and equipment are also included here. This also encompasses costs of tariffs;
•SG&A: Primarily includes costs for advertising and promotional activities, purchased services, information technology costs and other costs not directly related to the development and manufacturing of Stellantis products;
•R&D: Includes research and development costs, as well as amortization of capitalized development expenditures; and
•FX and Other: includes other items not mentioned above, such as used cars, parts & services, sales to partners, royalties, as well as foreign currency exchange translation, transaction and hedging.
North America
| | | | | | | | | | | | | | | | | | | | | | | | | | | | | | | | | | | | | | |
| Three months ended June 30, | | Increase/(Decrease) | | | | Six Months Ended June 30, | | Increase/(Decrease) |
| 2026 | | 2025 | | 2026 vs. 2025 | | | | 2026 | | 2025 | | 2026 vs. 2025 |
| 445 | | 323 | | 37.8 | % | | Consolidated shipments (thousands of units) | | 824 | | 648 | | 27.2 | % |
| 18,193 | | 13,834 | | 31.5 | % | | Net revenues (€ million) | | 34,307 | | 28,303 | | 21.2 | % |
| 284 | | (440) | | n.m. | | Adjusted operating income/(loss)(€ million) | | 547 | | (982) | | n.m. |
| 1.6 | % | | (3.2) | % | | 480 bps | | Adjusted operating income margin (%) | | 1.6 | % | | (3.5) | % | | 510 bps |
n.m. = not meaningfulThree months ended June 30, 2026
The following table presents Stellantis market share(1) and Stellantis and LPM market share for the three months ended June 30, 2026 and 2025.
| | | | | | | | | | | | | | | | | | | | | | | | | | | | | | | | | | | | | | |
| | Stellantis market share | | Stellantis and LPM(2) market share |
| | Three months ended June 30, | | Increase/(Decrease) | | Three months ended June 30, | | Increase/(Decrease) |
| | 2026 | | 2025 | | 2026 vs. 2025 | | 2026 | | 2025 | | 2026 vs. 2025 |
| North America | | 7.4 | % | | 7.0 | % | | 40 bps | | 7.4 | % | | 7.0 | % | | 40 bps |
| U.S. | | 7.7 | % | | 7.2 | % | | 50 bps | | 7.7 | % | | 7.2 | % | | 50 bps |
(2) This metric combines Stellantis-owned brands and Leapmotor vehicles distributed by Leapmotor International, a jointly established, Stellantis-controlled company created in 2024 and owned 51 percent by Stellantis and 49 percent by Leapmotor, to distribute Leapmotor-branded vehicles outside of China. Stellantis does not design, or manufacture Leapmotor-branded vehicles and does not own the Leapmotor brand or intellectual property
Shipments
North America shipments increased in the three months ended June 30, 2026 compared to the corresponding period in 2025, primarily due to new or refreshed products and powertrain offerings, including Ram 1500 HEMI V8 and Ram 1500 TRX SRT, Jeep Grand Wagoneer and Cherokee HEV and Chrysler Pacifica, the increase also reflects inventory build ahead of the planned summer production shutdown.
Net revenues
The increase in North America Net revenues in the three months ended June 30, 2026 compared to the corresponding period in 2025 was driven by higher volumes, partially offset by unfavorable foreign exchange translation impacts.
Adjusted operating income
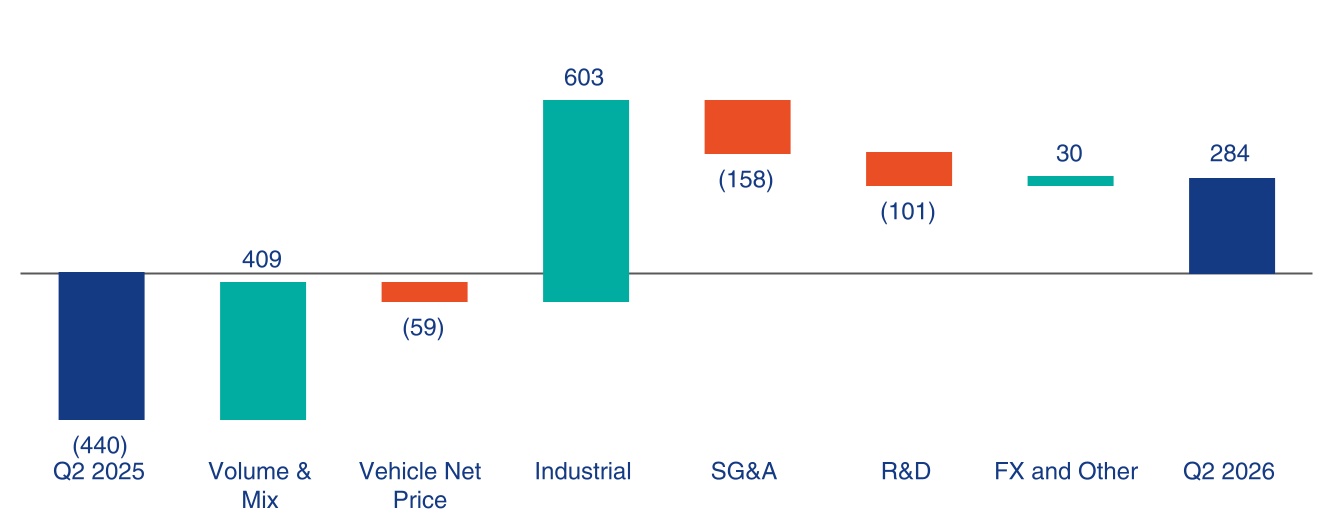
The following chart reflects the change in North America Adjusted operating income/(loss) by operational driver for the three months ended June 30, 2026 compared to the same period in 2025.
1 Industry and market share information is derived from third-party industry sources (e.g. Agence Nationale des Titres Sécurisés (“ANTS”), Associação Nacional dos Fabricantes de Veículos Automotores (“ANFAVEA”), Ministry of Infrastructure and Sustainable Mobility (“MIMS”), Ward’s Automotive) and internal information
Adjusted operating income/(loss) by operational driver - Three months ended June 30, 2026 compared to the three months ended June 30, 2025 (€ million)
The increase in North America Adjusted operating income/(loss) in the three months ended June 30, 2026 compared to the same period in 2025 was driven by higher volumes, operational performance improvements, and a reduction of regulatory expenses, partially offset by raw material inflation and higher recall campaign costs.
Six Months Ended June 30, 2026
The following table presents Stellantis market share(2) and Stellantis and LPM market share for the six months ended June 30, 2026 and 2025.
| | | | | | | | | | | | | | | | | | | | | | | | | | | | | | | | | | | | | | |
| | Stellantis market share | | Stellantis and LPM(1) market share |
| | Six Months Ended June 30, | | Increase/(Decrease) | | Six Months Ended June 30, | | Increase/(Decrease) |
| | 2026 | | 2025 | | 2026 vs. 2025 | | 2026 | | 2025 | | 2026 vs. 2025 |
| North America | | 7.6 | % | | 7.1 | % | | 50 bps | | 7.6 | % | | 7.1 | % | | 50 bps |
| U.S. | | 7.9 | % | | 7.3 | % | | 60 bps | | 7.9 | % | | 7.3 | % | | 60 bps |
(1) This metric combines Stellantis-owned brands and Leapmotor vehicles distributed by Leapmotor International, a jointly established, Stellantis-controlled company created in 2024 and owned 51 percent by Stellantis and 49 percent by Leapmotor, to distribute Leapmotor-branded vehicles outside of China. Stellantis does not design, or manufacture Leapmotor-branded vehicles and does not own the Leapmotor brand or intellectual property
Shipments
North America shipments increased in the six months ended June 30, 2026 compared to the corresponding period in 2025, primarily reflecting higher Ram and Jeep volumes following new and refreshed model launches, as well as inventory build up ahead of the planned summer production shutdown, to support new product launches and anticipated demand in the second half of the year.
2 Industry and market share information is derived from third-party industry sources (e.g. Agence Nationale des Titres Sécurisés (“ANTS”), Associação Nacional dos Fabricantes de Veículos Automotores (“ANFAVEA”), Ministry of Infrastructure and Sustainable Mobility (“MIMS”), Ward’s Automotive) and internal information
Net revenues
The increase in North America Net revenues in the six months ended June 30, 2026 compared to the corresponding period in 2025 was driven by higher volumes, improved mix and positive net pricing, partially offset by unfavorable foreign exchange translation impacts.
Adjusted operating income/(loss)
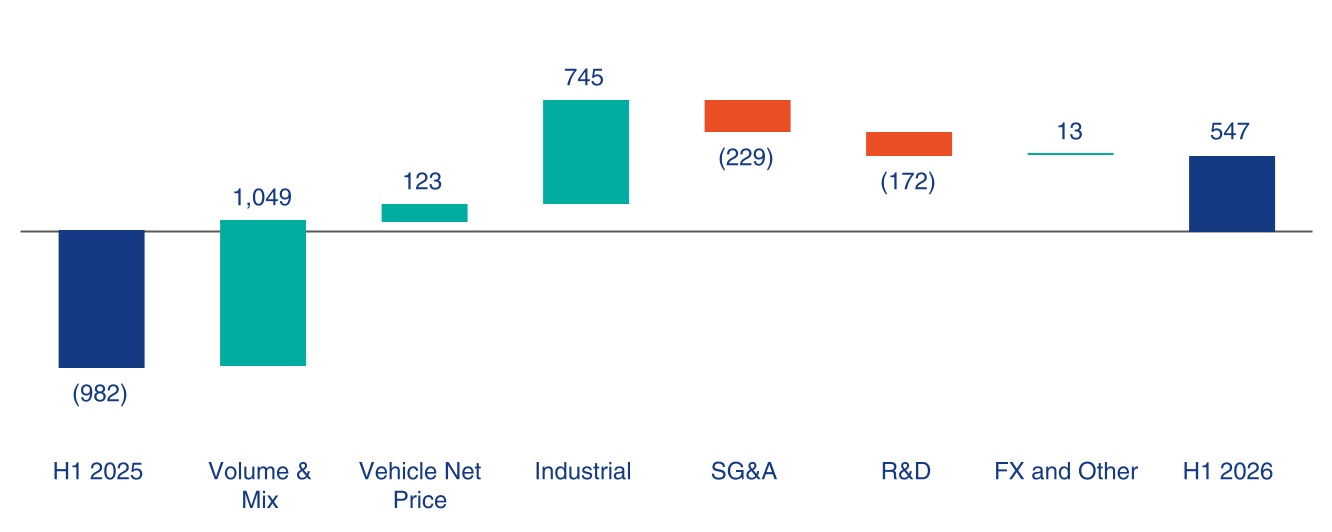
The following chart reflects the change in North America Adjusted operating income/(loss) by operational driver for the six months ended June 30, 2026 compared to the same period in 2025.
Adjusted operating income/(loss) by operational driver - Six months ended June 30, 2026 compared to the six months ended June 30, 2025 (€ million)
The increase in North America Adjusted operating income/(loss) in the six months ended June 30, 2026 compared to the same period in 2025 was mainly driven by higher volumes, favorable mix and positive net pricing. In addition, improved industrial costs included a reduction of regulatory expenses. These benefits were partially offset by higher SG&A reflecting increased marketing initiatives and higher R&D as a result of expensing certain development costs incurred on platforms that were fully-impaired in 2025 and therefore no longer eligible for capitalization. During the six months ended June 30, 2025, tariff impacts were broadly neutral year-over-year, with the International Emergency Economic Powers Act (“IEEPA”) tariff cost adjustment offsetting 2026 tariff costs.
Enlarged Europe
| | | | | | | | | | | | | | | | | | | | | | | | | | | | | | | | | | | | | | |
| Three months ended June 30, | | Increase/(Decrease) | | | | Six Months Ended June 30, | | Increase/(Decrease) |
| 2026 | | 2025 | | 2026 vs. 2025 | | | | 2026 | | 2025 | | 2026 vs. 2025 |
| 762 | | 723 | | 5.4 | % | | Consolidated shipments (thousands of units) | | 1,399 | | 1,291 | | 8.4 | % |
| 16,426 | | 16,387 | | 0.2 | % | | Net revenues (€ million) | | 30,801 | | 30,557 | | 0.8 | % |
| (94) | | (359) | | 73.8 | % | | Adjusted operating income/(loss) (€ million) | | (86) | | (67) | | (28.4 | %) |
| (0.6 | %) | | (2.2 | %) | | 160 bps | | Adjusted operating income margin (%) | | (0.3 | %) | | (0.2 | %) | | -10 bps |
Three months ended June 30, 2026
The following table presents Stellantis market share(3) and Stellantis and LPM market share for the three months ended June 30, 2026 and 2025.
| | | | | | | | | | | | | | | | | | | | | | | | | | | | | | | | | | | | | | |
| | Stellantis market share | | Stellantis and LPM(1) market share |
| | Three months ended June 30, | | Increase/(Decrease) | | Three months ended June 30, | | Increase/(Decrease) |
| | 2026 | | 2025 | | 2026 vs. 2025 | | 2026 | | 2025 | | 2026 vs. 2025 |
| Enlarged Europe | | 15.2 | % | | 15.9 | % | | (70) bps | | 15.9 | % | | 16.1 | % | | (20) bps |
| EU30 | | 16.0 | % | | 16.8 | % | | (80) bps | | 16.8 | % | | 16.9 | % | | (10) bps |
(1) This metric combines Stellantis-owned brands and Leapmotor vehicles distributed by Leapmotor International, a jointly established, Stellantis-controlled company created in 2024 and owned 51 percent by Stellantis and 49 percent by Leapmotor, to distribute Leapmotor-branded vehicles outside of China. Stellantis does not design, or manufacture Leapmotor-branded vehicles and does not own the Leapmotor brand or intellectual property
Shipments
Shipments in Enlarged Europe increased in the three months ended June 30, 2026 compared to the corresponding period in 2025, mainly due to higher volumes of Fiat 500 and Grande Panda, Citroën C3 Aircross, Opel/Vauxhall Frontera, Jeep Compass and Leapmotor-branded vehicles, notably T03 and B10.
Net revenues
Enlarged Europe Net revenues were flat in the three months ended June 30, 2026 compared to the corresponding period in 2025, as higher volumes were offset by negative net pricing.
Adjusted operating income/(loss)
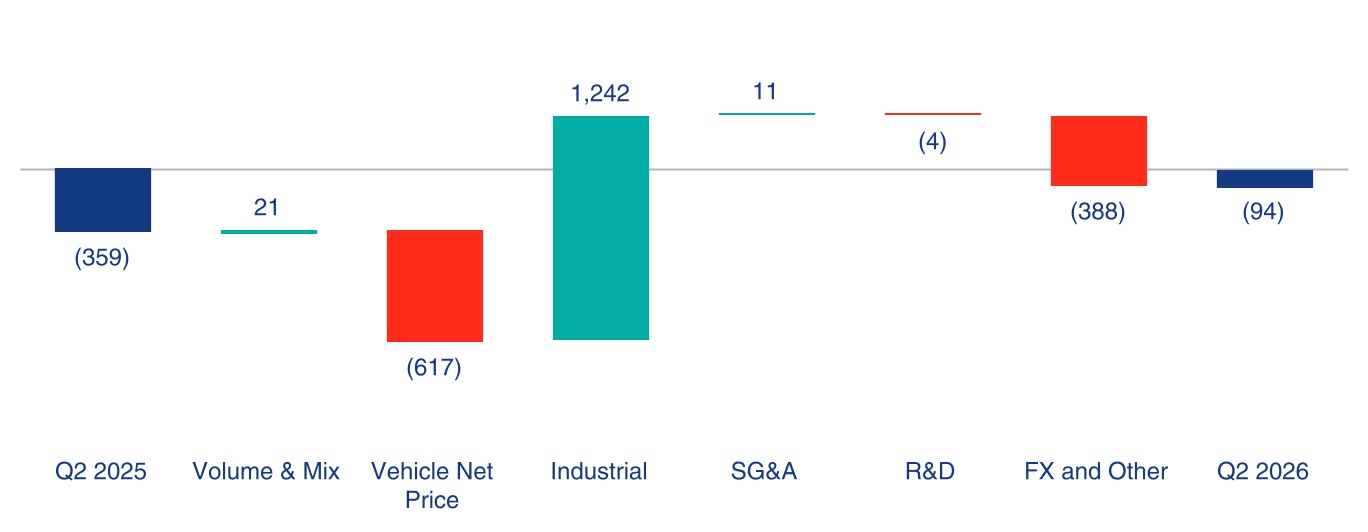
The following chart reflects the change in Enlarged Europe Adjusted operating income/(loss) by operational driver for the three months ended June 30, 2026 compared to the same period in 2025.
3 EU30 = EU27 (excluding Malta) and including Iceland, Norway, Switzerland and UK. Industry and market share information is derived from third-party industry sources (e.g. Agence Nationale des Titres Sécurisés (“ANTS”), Associação Nacional dos Fabricantes de Veículos Automotores (“ANFAVEA”), Ministry of Infrastructure and Sustainable Mobility (“MIMS”), Ward’s Automotive) and internal information
Adjusted operating income/(loss) by operational driver - Three months ended June 30, 2026 compared to the three months ended June 30, 2025 (€ million)
The increase in Enlarged Europe Adjusted operating income in the three months ended June 30, 2026 compared to the same period in 2025 was driven mainly by increased volumes, operational performance improvements and lower recall campaign costs of €0.5 billion, partially offset by negative net pricing and raw material inflation.
Six Months Ended June 30, 2026
The following table presents Stellantis market share(4) and Stellantis and LPM market share for the six months ended June 30, 2026 and 2025.
| | | | | | | | | | | | | | | | | | | | | | | | | | | | | | | | | | | | | | |
| | Stellantis market share | | Stellantis and LPM(1) market share |
| | Six Months Ended June 30, | | Increase/(Decrease) | | Six Months Ended June 30, | | Increase/(Decrease) |
| | 2026 | | 2025 | | 2026 vs. 2025 | | 2026 | | 2025 | | 2026 vs. 2025 |
| Enlarged Europe | | 16.0 | % | | 16.2 | % | | -20 bps | | 16.6 | % | | 16.3 | % | | 30 bps |
| EU30 | | 16.7 | % | | 17.0 | % | | -30 bps | | 17.4 | % | | 17.1 | % | | 30 bps |
(1) This metric combines Stellantis-owned brands and Leapmotor vehicles distributed by Leapmotor International, a jointly established, Stellantis-controlled company created in 2024 and owned 51 percent by Stellantis and 49 percent by Leapmotor, to distribute Leapmotor-branded vehicles outside of China. Stellantis does not design, or manufacture Leapmotor-branded vehicles and does not own the Leapmotor brand or intellectual property
Shipments
Shipments in Enlarged Europe increased in the six months ended June 30, 2026 compared to the corresponding period in 2025, mainly due to higher volumes in FIAT, Citroën, Opel/Vauxhall and Leapmotor brands. Main contributors were Fiat 500 and Grande Panda, Citroën C3 Aircross, Opel/Vauxhall Frontera and Leapmotor T03 and B10.
4 EU30 = EU27 (excluding Malta) and including Iceland, Norway, Switzerland and UK. Industry and market share information is derived from third-party industry sources (e.g. Agence Nationale des Titres Sécurisés (“ANTS”), Associação Nacional dos Fabricantes de Veículos Automotores (“ANFAVEA”), Ministry of Infrastructure and Sustainable Mobility (“MIMS”), Ward’s Automotive) and internal information
Net revenues
The slight increase in Enlarged Europe Net revenues in the six months ended June 30, 2026 compared to the corresponding period in 2025 was driven by higher volumes largely offset by negative net pricing and unfavorable mix.
Adjusted operating income/(loss)
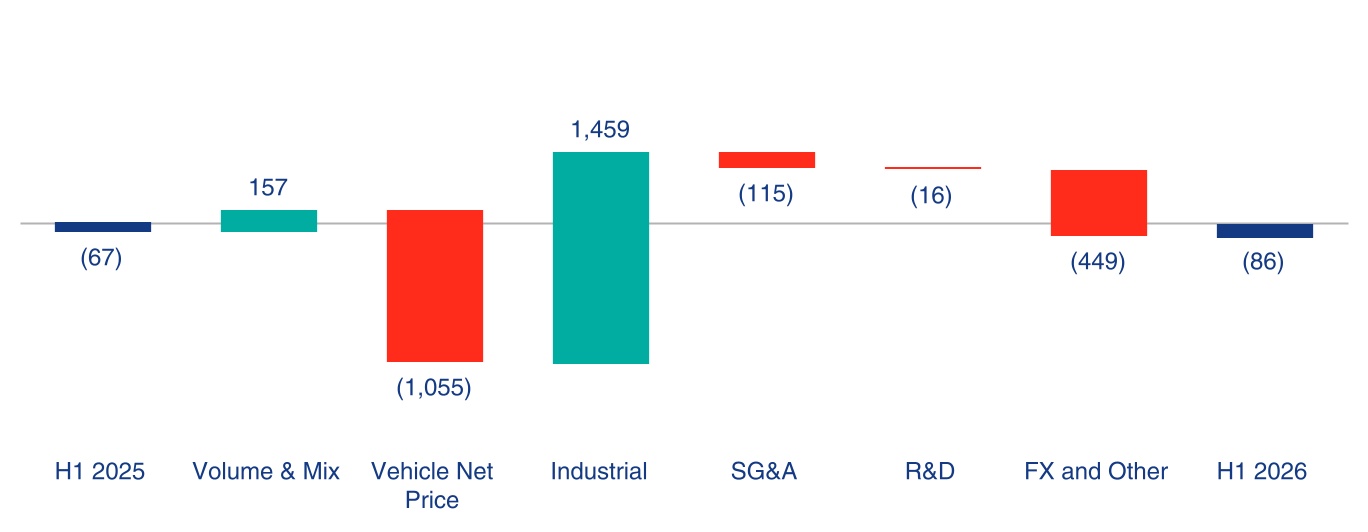
The following chart reflects the change in Enlarged Europe Adjusted operating income/(loss) by operational driver for the six months ended June 30, 2026 compared to the same period in 2025.
Adjusted operating income/(loss) by operational driver - Six months ended June 30, 2026 compared to the six months ended June 30, 2025 (€ million)
Enlarged Europe Adjusted operating loss in the six months ended June 30, 2026 was substantially unchanged compared to the same period in 2025. Positive impacts from improved industrial costs driven by the non-recurrence of recall campaign costs recognized in 2025 of €0.5 billion, manufacturing efficiencies and increased volumes were offset by negative pricing from higher incentives, and unfavorable mix.
Middle East & Africa
| | | | | | | | | | | | | | | | | | | | | | | | | | | | | | | | | | | | | | |
| Three months ended June 30, | | Increase/(Decrease) | | | | Six Months Ended June 30, | | Increase/(Decrease) |
| 2026 | | 2025 | | 2026 vs. 2025 | | | | 2026 | | 2025 | | 2026 vs. 2025 |
| 128 | | 135 | | (5.2 | %) | | Combined shipments (thousands of units) | | 243 | | 251 | | (3.2 | %) |
| 121 | | 125 | | (3.2 | %) | | Consolidated shipments (thousands of units) | | 232 | | 225 | | 3.1 | % |
| 2,565 | | 2,674 | | (4.1 | %) | | Net revenues (€ million) | | 4,953 | | 4,962 | | (0.2 | %) |
| 329 | | 392 | | (16.1 | %) | | Adjusted operating income (€ million) | | 611 | | 768 | | (20.4 | %) |
| 12.8 | % | | 14.7 | % | | (190) bps | | Adjusted operating income margin (%) | | 12.3 | % | | 15.5 | % | | (320) bps |
Three months ended June 30, 2026
The following table presents Stellantis market share(5) and Stellantis and LPM market share for the three months ended June 30, 2026 and 2025.
| | | | | | | | | | | | | | | | | | | | | | | | | | | | | | | | | | | | | | |
| | Stellantis market share | | Stellantis and LPM(1) market share |
| | Three months ended June 30, | | Increase/(Decrease) | | Three months ended June 30, | | Increase/(Decrease) |
| | 2026 | | 2025 | | 2026 vs. 2025 | | 2026 | | 2025 | | 2026 vs. 2025 |
Middle East & Africa | | 12.2 | % | | 12.0 | % | | 20 bps | | 12.3 | % | | 12.0 | % | | 30 bps |
(1) This metric combines Stellantis-owned brands and Leapmotor vehicles distributed by Leapmotor International, a jointly established, Stellantis-controlled company created in 2024 and owned 51 percent by Stellantis and 49 percent by Leapmotor, to distribute Leapmotor-branded vehicles outside of China. Stellantis does not design, or manufacture Leapmotor-branded vehicles and does not own the Leapmotor brand or intellectual property
Shipments
The decrease in consolidated shipments in Middle East & Africa in the three months ended June 30, 2026 compared to the corresponding period in 2025 was mainly due to the industry decline in Türkiye and Gulf Cooperation Council countries largely due to the regional conflict, partially offset by higher volumes in Algeria.
Net revenues
The decrease in Middle East & Africa Net revenues in the three months ended June 30, 2026 compared to the corresponding period in 2025 was driven by unfavorable foreign exchange translation effects from the Turkish Lira partially offset by positive net pricing.
Adjusted operating income/(loss)
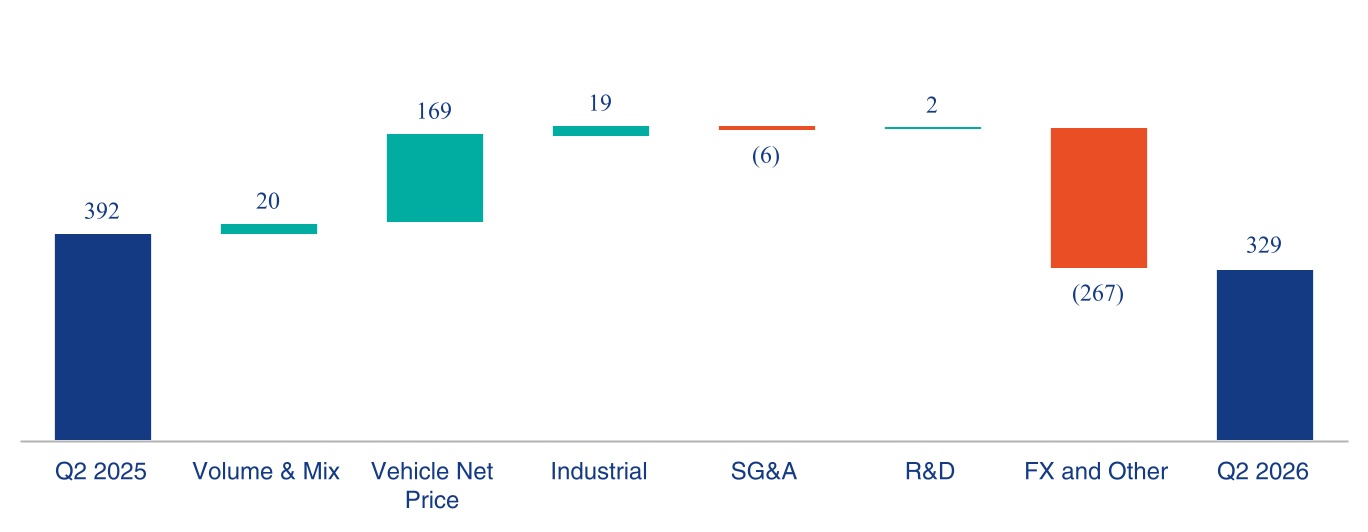
The following chart reflects the change in Middle East & Africa Adjusted operating income/(loss) by operational driver for the three months ended June 30, 2026 compared to the same period in 2025.
5 Industry and market share information is derived from third-party industry sources (e.g. Agence Nationale des Titres Sécurisés (“ANTS”), Associação Nacional dos Fabricantes de Veículos Automotores (“ANFAVEA”), Ministry of Infrastructure and Sustainable Mobility (“MIMS”), Ward’s Automotive) and internal information
Adjusted operating income/(loss) by operational driver - Three months ended June 30, 2026 compared to the three months ended June 30, 2025 (€ million)
The decrease in Middle East & Africa Adjusted operating income in the three months ended June 30, 2026 compared to the same period in 2025 was primarily due to unfavorable foreign exchange effects related to Turkish Lira devaluation, partially offset by positive net pricing, favorable mix and improved industrial costs.
Six Months Ended June 30, 2026
The following table presents Stellantis market share(6) and Stellantis and LPM market share for the six months ended June 30, 2026 and 2025.
| | | | | | | | | | | | | | | | | | | | | | | | | | | | | | | | | | | | | | |
| | Stellantis market share | | Stellantis and LPM(1) market share |
| | Six Months Ended June 30, | | Increase/(Decrease) | | Six Months Ended June 30, | | Increase/(Decrease) |
| | 2026 | | 2025 | | 2026 vs. 2025 | | 2026 | | 2025 | | 2026 vs. 2025 |
Middle East & Africa | | 11.9 | % | | 11.5 | % | | 40 bps | | 11.9 | % | | 11.5 | % | | 40 bps |
(1) This metric combines Stellantis-owned brands and Leapmotor vehicles distributed by Leapmotor International, a jointly established, Stellantis-controlled company created in 2024 and owned 51 percent by Stellantis and 49 percent by Leapmotor, to distribute Leapmotor-branded vehicles outside of China. Stellantis does not design, or manufacture Leapmotor-branded vehicles and does not own the Leapmotor brand or intellectual property
Shipments
The increase in consolidated shipments in Middle East & Africa in the six months ended June 30, 2026 compared to the corresponding period in 2025 was driven primarily by increased volumes in Algeria, Türkiye and Morocco which was partially offset by lower volumes in the Middle East due to the regional conflict.
Net revenues
Middle East & Africa Net revenues in the six months ended June 30, 2026 were substantially unchanged compared to the corresponding period in 2025, with positive net pricing and higher volumes being offset by the negative impact of foreign currency translation, primarily related to the Turkish Lira.
6 Industry and market share information is derived from third-party industry sources (e.g. Agence Nationale des Titres Sécurisés (“ANTS”), Associação Nacional dos Fabricantes de Veículos Automotores (“ANFAVEA”), Ministry of Infrastructure and Sustainable Mobility (“MIMS”), Ward’s Automotive) and internal information
Adjusted operating income/(loss)
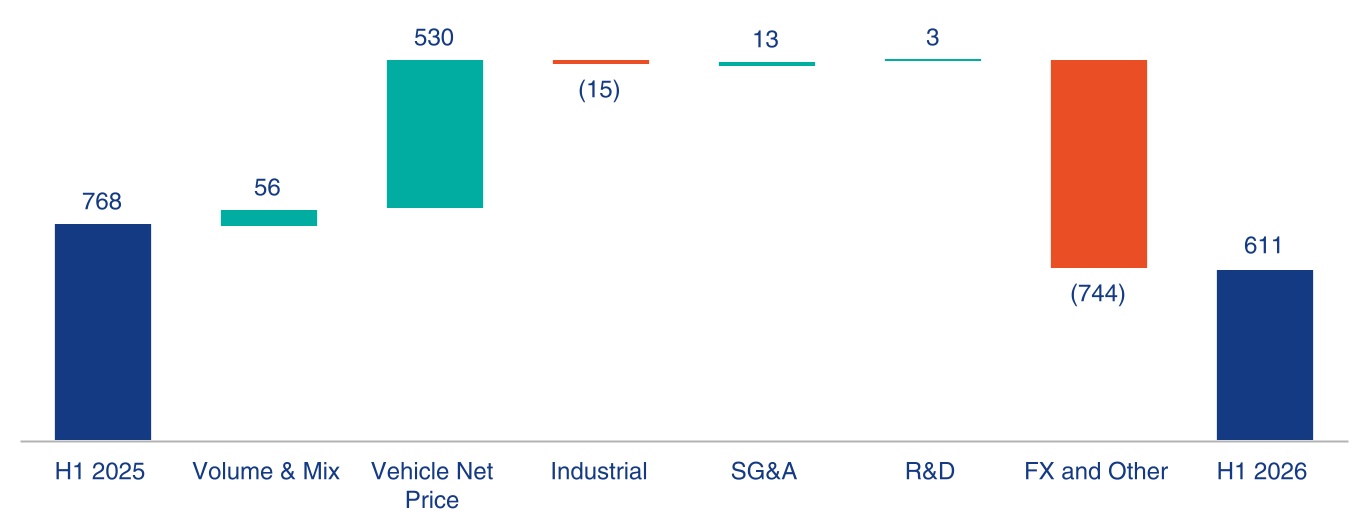
The following chart reflects the change in Middle East & Africa Adjusted operating income/(loss) by operational driver for the six months ended June 30, 2026 compared to the same period in 2025.
Adjusted operating income/(loss) by operational driver - Six months ended June 30, 2026 compared to the six months ended June 30, 2025 (€ million)
The decrease in Middle East & Africa Adjusted operating income/(loss) in the six months ended June 30, 2026 compared to the same period in 2025 was primarily due to unfavorable foreign currency translation effects, mainly related to the Turkish Lira, which offset the benefits from improved net pricing and volume and mix.
South America
| | | | | | | | | | | | | | | | | | | | | | | | | | | | | | | | | | | | | | |
| Three months ended June 30, | | Increase/(Decrease) | | | | Six Months Ended June 30, | | Increase/(Decrease) |
| 2026 | | 2025 | | 2026 vs. 2025 | | | | 2026 | | 2025 | | 2026 vs. 2025 |
| 253 | | 260 | | (2.7 | %) | | Consolidated shipments (thousands of units) | | 472 | | 471 | | 0.2 | % |
| 4,338 | | 4,092 | | 6.0 | % | | Net revenues (€ million) | | 7,961 | | 7,771 | | 2.4 | % |
| 402 | | 782 | | (48.6 | %) | | Adjusted operating income (€ million) | | 795 | | 1,189 | | (33.1 | %) |
| 9.3 | % | | 19.1 | % | | (980) bps | | Adjusted operating income margin (%) | | 10.0 | % | | 15.3 | % | | (530) bps |
Three months ended June 30, 2026
The following table presents Stellantis market share(7) and Stellantis and LPM market share for the three months ended June 30, 2026 and 2025.
7 Industry and market share information is derived from third-party industry sources (e.g. Agence Nationale des Titres Sécurisés (“ANTS”), Associação Nacional dos Fabricantes de Veículos Automotores (“ANFAVEA”), Ministry of Infrastructure and Sustainable Mobility (“MIMS”), Ward’s Automotive) and internal information
| | | | | | | | | | | | | | | | | | | | | | | | | | | | | | | | | | | | | | |
| | Stellantis market share | | Stellantis and LPM(1) market share |
| | Three months ended June 30, | | Increase/(Decrease) | | Three months ended June 30, | | Increase/(Decrease) |
| | 2026 | | 2025 | | 2026 vs. 2025 | | 2026 | | 2025 | | 2026 vs. 2025 |
South America | | 19.1 | % | | 23.3 | % | | -420 bps | | 19.4 | % | | 23.3 | % | | -390 bps |
| Brazil | | 25.6 | % | | 29.7 | % | | -410 bps | | 25.9 | % | | 29.7 | % | | -380 bps |
| Argentina | | 26.0 | % | | 31.1 | % | | -510 bps | | 26.0 | % | | 31.1 | % | | -510 bps |
(1) This metric combines Stellantis-owned brands and Leapmotor vehicles distributed by Leapmotor International, a jointly established, Stellantis-controlled company created in 2024 and owned 51 percent by Stellantis and 49 percent by Leapmotor, to distribute Leapmotor-branded vehicles outside of China. Stellantis does not design, or manufacture Leapmotor-branded vehicles and does not own the Leapmotor brand or intellectual property
Shipments
Shipments in South America decreased in the three months ended June 30, 2026 compared to the corresponding period in 2025, driven primarily by lower volumes in Argentina and Chile, partially offset by higher volumes in Brazil.
Net revenues
South America Net revenues increased in the three months ended June 30, 2026 compared to the corresponding period in 2025 mainly reflecting positive foreign exchange translation effects, favorable mix and positive net pricing, partially offset by lower volumes.
Adjusted operating income/(loss)
The following chart reflects the change in South America Adjusted operating income/(loss) by operational driver for the three months ended June 30, 2026 compared to the same period in 2025.
Adjusted operating income/(loss) by operational driver - Three months ended June 30, 2026 compared to the three months ended June 30, 2025 (€ million)
The decrease in South America Adjusted operating income/(loss) in the three months ended June 30, 2026 compared to the same period in 2025 mainly reflects the non-repeat of a Brazilian indirect tax credit of €0.3 billion recognized in three months ended June 30, 2025, and lower volumes in Argentina, partially offset by favorable net pricing and improved industrial costs.
Six Months Ended June 30, 2026
The following table presents Stellantis market share(8) and Stellantis and LPM market share for the six months ended June 30, 2026 and 2025.
| | | | | | | | | | | | | | | | | | | | | | | | | | | | | | | | | | | | | | |
| | Stellantis market share | | Stellantis and LPM(1) market share |
| | Six months ended June 30, | | Increase/(Decrease) | | Six months ended June 30, | | Increase/(Decrease) |
| | 2026 | | 2025 | | 2026 vs. 2025 | | 2026 | | 2025 | | 2026 vs. 2025 |
South America | | 20.0 | % | | 23.5 | % | | -350 bps | | 20.2 | % | | 23.5 | % | | -330 bps |
| Brazil | | 27.0 | % | | 30.1 | % | | -310 bps | | 27.3 | % | | 30.1 | % | | -280 bps |
| Argentina | | 27.5 | % | | 32.7 | % | | -520 bps | | 27.5 | % | | 32.7 | % | | -520 bps |
(1) This metric combines Stellantis-owned brands and Leapmotor vehicles distributed by Leapmotor International, a jointly established, Stellantis-controlled company created in 2024 and owned 51 percent by Stellantis and 49 percent by Leapmotor, to distribute Leapmotor-branded vehicles outside of China. Stellantis does not design, or manufacture Leapmotor-branded vehicles and does not own the Leapmotor brand or intellectual property
Shipments
Shipments in South America were broadly in line in the six months ended June 30, 2026 compared to the corresponding period in 2025 with increases in Brazil relating to FIAT, Leapmotor, Ram and Jeep that were offset by decreases in Argentina relating to FIAT, Peugeot and Jeep and Chile relating to Citroën and Opel.
Net revenues
South America Net revenues increased slightly in the six months ended June 30, 2026 compared to the corresponding period in 2025, primarily due to foreign currency translation impacts.
Adjusted operating income/(loss)
The following chart reflects the change in South America Adjusted operating income/(loss) by operational driver for the six months ended June 30, 2026 compared to the same period in 2025.
8 Industry and market share information is derived from third-party industry sources (e.g. Agence Nationale des Titres Sécurisés (“ANTS”), Associação Nacional dos Fabricantes de Veículos Automotores (“ANFAVEA”), Ministry of Infrastructure and Sustainable Mobility (“MIMS”), Ward’s Automotive) and internal information
Adjusted operating income/(loss) by operational driver - Six months ended June 30, 2026 compared to the six months ended June 30, 2025 (€ million)
The decrease in South America Adjusted operating income/(loss) in the six months ended June 30, 2026 compared to the same period in 2025 mainly reflects the non-recurrence of Brazilian indirect tax credits of €0.3 million recognized in 2025 and less favorable mix.
Asia Pacific
| | | | | | | | | | | | | | | | | | | | | | | | | | | | | | | | | | | | | | |
| Three months ended June 30, | | Increase/(Decrease) | | | | Six Months Ended June 30, | | Increase/(Decrease) |
| 2026 | | 2025 | | 2026 vs. 2025 | | | | 2026 | | 2025 | | 2026 vs. 2025 |
| | | | | | | | | | | | |
| 16 | | 16 | | — | % | | Consolidated shipments (thousands of units) | | 31 | | 29 | | 6.9 | % |
| 499 | | 524 | | (4.8 | %) | | Net revenues (€ million) | | 934 | | 1,010 | | (7.5 | %) |
| 27 | | 20 | | 35 | % | | Adjusted operating income/(loss) (€ million) | | (3) | | 0 | | n.m. |
| 5.4 | % | | 3.8 | % | | 160 bps | | Adjusted operating income/(loss) margin (%) | | (0.3) | % | | — | % | | n.m. |
n.m. = not meaningful
In China, we distribute imported vehicles primarily for the Jeep brand through an asset-light approach.
We produce the Jeep Compass and Jeep Meridian in India through our joint operation Fiat India Automobiles Private Limited and we recognize our related interest in the joint operation on a line-by-line basis.
Three months ended June 30, 2026
The following table presents Stellantis market share(9) and Stellantis and LPM market share for the three months ended June 30, 2026 and 2025.
9 Industry and market share information is derived from third-party industry sources (e.g. Agence Nationale des Titres Sécurisés (“ANTS”), Associação Nacional dos Fabricantes de Veículos Automotores (“ANFAVEA”), Ministry of Infrastructure and Sustainable Mobility (“MIMS”), Ward’s Automotive) and internal information
| | | | | | | | | | | | | | | | | | | | | | | | | | | | | | | | | | | | | | |
| | Stellantis market share | | Stellantis and LPM(1) market share |
| | Three months ended June 30, | | Increase/(Decrease) | | Three months ended June 30, | | Increase/(Decrease) |
| | 2026 | | 2025 | | 2026 vs. 2025 | | 2026 | | 2025 | | 2026 vs. 2025 |
Asia Pacific | | 0.2 | % | | 0.3 | % | | -10 bps | | 0.3 | % | | 0.3 | % | | n.m. |
n.m. = not meaningful
(1) This metric combines Stellantis-owned brands and Leapmotor vehicles distributed by Leapmotor International, a jointly established, Stellantis-controlled company created in 2024 and owned 51 percent by Stellantis and 49 percent by Leapmotor, to distribute Leapmotor-branded vehicles outside of China. Stellantis does not design, or manufacture Leapmotor-branded vehicles and does not own the Leapmotor brand or intellectual property
Shipments
Asia Pacific consolidated shipments in the three months ended June 30, 2026 compared to the corresponding period in 2025 were relatively flat, reflecting higher volumes in South East Asia and India, partially offset by lower volumes in South Korea and Japan.
Net revenues
The decrease in Asia Pacific Net revenues in the three months ended June 30, 2026 compared to the corresponding period in 2025 was primarily driven by unfavorable mix and negative foreign exchange translation effects more than offsetting higher volumes and positive net pricing.
Adjusted operating income/(loss)
The following chart reflects the change in Asia Pacific Adjusted operating income by operational driver for the three months ended June 30, 2026 compared to the same period in 2025.
Adjusted operating income/(loss) by operational driver - Three months ended June 30, 2026 compared to the three months ended June 30, 2025 (€ million)
The increase in Asia Pacific Adjusted operating income/(loss) in the three months ended June 30, 2026 compared to the same period in 2025 was primarily due to improved industrial costs, positive net pricing and favorable mix, partially offset by unfavorable foreign exchange effects mainly from the Japanese Yen and the Indian Rupee.
Six Months Ended June 30, 2026
The following table presents Stellantis market share(10) and Stellantis and LPM market share for the six months ended June 30, 2026 and 2025.
| | | | | | | | | | | | | | | | | | | | | | | | | | | | | | | | | | | | | | |
| | Stellantis market share | | Stellantis and LPM(1) market share |
| | Six Months Ended June 30, | | Increase/(Decrease) | | Six Months Ended June 30, | | Increase/(Decrease) |
| | 2026 | | 2025 | | 2026 vs. 2025 | | 2026 | | 2025 | | 2026 vs. 2025 |
Asia Pacific | | 0.3 | % | | 0.3 | % | | n.m. | | 0.3 | % | | 0.3 | % | | n.m. |
n.m. = not meaningful
(1) This metric combines Stellantis-owned brands and Leapmotor vehicles distributed by Leapmotor International, a jointly established, Stellantis-controlled company created in 2024 and owned 51 percent by Stellantis and 49 percent by Leapmotor, to distribute Leapmotor-branded vehicles outside of China. Stellantis does not design, or manufacture Leapmotor-branded vehicles and does not own the Leapmotor brand or intellectual property
Shipments
The increase in Asia Pacific consolidated shipments in the six months ended June 30, 2026 compared to the corresponding period in 2025 was mainly driven by increased volumes in Citroën and Leapmotor offset by decreases in Peugeot and Jeep branded vehicles.
Net revenues
The decrease in Asia Pacific Net revenues in the six months ended June 30, 2026 compared to the corresponding period in 2025 was primarily due to negative impact of mix and foreign exchange translation impacts more than offsetting higher volumes.
Adjusted operating income/(loss)
The following chart reflects the change in Asia Pacific Adjusted operating income/(loss) by operational driver for the six months ended June 30, 2026 compared to the same period in 2025.
10 Industry and market share information is derived from third-party industry sources (e.g. Agence Nationale des Titres Sécurisés (“ANTS”), Associação Nacional dos Fabricantes de Veículos Automotores (“ANFAVEA”), Ministry of Infrastructure and Sustainable Mobility (“MIMS”), Ward’s Automotive) and internal information
Adjusted operating income/(loss) by operational driver - Six months ended June 30, 2026 compared to the six months ended June 30, 2025 (€ million)
Asia Pacific maintained break-even Adjusted operating income/(loss) for the six months ended June 30, 2026, in line with the prior-year period, reflecting benefits from higher volumes and industrial and SG&A efficiencies, which were offset by adverse foreign exchange impacts, mainly related to the Japanese Yen.
Liquidity and capital resources
Available liquidity
The following table summarizes our total Available liquidity:
| | | | | | | | | | | | | | |
(€ million) | | At June 30, 2026 | | At December 31, 2025 |
Cash, cash equivalents and financial securities(1) | | 34,577 | | | 31,508 | |
| Undrawn committed credit lines | | 13,839 | | | 18,287 | |
| Cash, cash equivalents and financial securities - included within Assets held for sale | | 4 | | | — | |
Total Available liquidity(2) | | 48,420 | | | 49,795 | |
| of which: Available liquidity of the Industrial Activities | | 44,145 | | | 45,711 | |
(1) Financial securities (€880 million at June 30, 2026 and €1,362 million at December 31, 2025) are comprised of short term or marketable securities which represent temporary investments but do not satisfy all the requirements to be classified as cash equivalents as they may be subject to risk of change in value (even if they are short-term in nature or marketable)
(2) The majority of our liquidity is available to our treasury operations in Europe and U.S.; however, liquidity is also available to certain subsidiaries which operate in other countries. Cash held in such countries may be subject to restrictions on transfer depending on the foreign jurisdictions in which these subsidiaries operate and mainly affects our industrial activities. Based on our review of such transfer restrictions in the countries in which we operate and maintain material cash balances, (and in particular in Argentina, in which we have €268 million cash and securities at June 30, 2026 (€354 million at December 31, 2025), and in Algeria, in which we have cash and cash equivalents at June 30, 2026 of €273 million (€276 million at December 31, 2025)), we do not believe such transfer restrictions had an adverse impact on the Company’s ability to meet its liquidity requirements at the dates presented above. Cash and cash equivalents also include €953 million at June 30, 2026 (€663 million at December 31, 2025) held in bank deposits which are restricted to the operations related to securitization programs and warehouses credit facilities of Stellantis Financial Services U.S. (“SFS U.S.”)
Available liquidity of the industrial activities at June 30, 2026 decreased by €1.6 billion from December 31, 2025, primarily due to €0.9 billion negative Free Cash Flow, €4.1 billion reduction in available credit lines and €2.5 billion bond repayment, partially offset by €4.9 billion proceeds from the issuance of Hybrid perpetual notes, €1.3 billion proceeds for the issuance of bonds and €0.4 billion foreign exchange translation.
Our Available liquidity is subject to intra-month and seasonal fluctuations resulting from business and collection-payment cycles as well as to changes in foreign exchange conversion rates. Moreover, we tend to operate with negative working capital as we generally receive payment for vehicles within a few days of shipment, whereas there is a lag between the time when parts and materials are received from suppliers and when we pay for such parts and materials; therefore, in periods in which our vehicle shipments decline materially we will suffer a significant negative impact on cash flow and liquidity as we continue to pay suppliers for components purchased in a high volume environment during a period in which we receive lower proceeds from vehicle shipments. Plant shutdowns, whether associated with model year changeovers, or other factors such as temporary supplier interruptions or government-imposed restrictions, can have a significant negative impact on our revenues and working capital as we continue to pay suppliers while we do not receive proceeds from vehicle sales. Refer to the section — Cash flows below for additional information regarding the change in cash and cash equivalents.
Our liquidity is principally denominated in Euro and U.S. Dollar, with the remainder being distributed in various countries and denominated in the relevant local currencies. Out of the total cash, cash equivalents and financial securities available at June 30, 2026, €19.2 billion, or 55 percent (€16.7 billion, or 53 percent at December 31, 2025), were denominated in Euro and €9.0 billion, or 26.0 percent (€8.1 billion, or 26 percent at December 31, 2025), were denominated in U.S. Dollar.
At June 30, 2026, undrawn committed credit lines of €13.8 billion include the syndicated revolving credit facility (“RCF”) of €12.0 billion, originally signed in July 2021, amended and extended in July 2024, with a group of 29 relationship banks. The RCF is available for general corporate purposes and is structured in two tranches: €6.0 billion, with a 3-year tenor, and €6.0 billion, with a 5-year tenor, with each tranche benefiting from two further extension options, each of one year exercisable on the first and second anniversary of the amendment signing date. In June 2026, the second-year extension option was exercised extending the maturities to July 2029 and July 2031, respectively, for the two tranches. The amount utilized under these credit lines was nil on June 30, 2026.
The committed credit line signed in January 2025, with a pool of relationship banks, of originally €4.0 billion, has been reduced to €1.5 billion effective from March 16, 2026 and further reduced to € 0.3 billion effective from June 12, 2026. The line originally had a one-year tenor with two extension options, at the Company’s discretion, of six months each. The first extension option was activated in December 2025, extending the maturity to July 2026. The second extension option was not exercised, so the facility will expire on July 15, 2026, with the drawdown period ending one month prior to expiration. The amount utilized under this credit line was nil on June 30, 2026.
In December 2025, SFS U.S. established a privately placed Commercial Paper (“CP”) program available up to a maximum of €1.9 billion ($2.2 billion). No CP was issued under the program in December 2025. Issuances under the CP program commenced in March 2026. At June 30, 2026, €0.4 billion ($0.5 billion) notes were outstanding under the CP program.
In connection with the establishment of the CP program, the €0.9 billion ($1 billion) committed USD credit facility originally signed by SFS U.S. in March 2024 was amended and refinanced (the "amended SFS RCF"). The amended SFS RCF is structured in two tranches: €1.1 billion ($1.3 billion), with a 364-days tenor, and €0.9 billion ($1 billion), with a three-year tenor, with each tranche benefiting from two further extension options, each of one year exercisable on the first and second anniversary of the amendment signing date. At June 30, 2026, the amount available under the amended SFS RCF, net of €0.4 billion of CP outstanding, was €1.5 billion ($1.7 billion).
Perpetual fixed rate resettable capital securities (“Hybrid perpetual notes”)
In March 2026, the Company issued a series of Hybrid perpetual notes:
•€2.2 billion Perpetual Fixed Rate Resettable Capital Securities, having a non-call period of 5.25 years, perpetual maturity and an annual coupon of 6.250 percent until the first reset date of June 16, 2031;
•€1.8 billion Perpetual Fixed Rate Resettable Capital Securities, having a non-call period of 8 years, perpetual maturity and an annual coupon of 6.875 percent until the first reset date of March 16, 2034; and
•£865 million (€997 million) Perpetual Fixed Rate Resettable Capital Securities, having a non-call period of 6.5 years, perpetual maturity and an annual coupon of 8.250 percent until the first reset date of September 16, 2032.
Refer to Note 18, Equity in the Interim Condensed Consolidated Financial Statements included in this Interim Report for additional information.
Euro Medium Term Note Programme (“EMTN”) and other Notes
In January and May 2026, respectively, the Company repaid at maturity, a €1,250 million note issued by FCA N.V. and a €1,000 million note issued by Peugeot S.A. each originally issued in 2020.
In June 2026, SFS U.S. issued two bonds:
•a USD bond with principal amount of $1,500 million with an interest rate of 5.4 percent and which matures in June 2029; and
•a USD bond with principal amount of $1,000 million with an interest rate of 5.8 percent and which matures in June 2031.
In June 2026, the Company issued two bonds under its EMTN:
•a EUR bond with principal amount of €750 million with an interest rate of 4.5 percent and which matures in January 2033; and
•a EUR bond with principal amount of €500 million with an interest rate of 5.1 percent and which matures in January 2037.
Warehouse credit facilities
In January 2026, the revolving credit floorplan facility (Stellantis Financial Floorplan Master Auto Owner Trust 2024-1) capacity was increased from €1.1 billion ($1.3 billion) to €1.8 billion ($2.0 billion) with the addition of 3 new lenders. Draw downs from the facility will bear an interest rate based on the lender’s asset-backed commercial paper cost of funds or Secured Overnight Financing Rate (“SOFR”), plus a spread. Borrowings are used to support the Company’s commercial floorplan lending business with floor plan receivables providing collateral. As of June 30, 2026, €1.3 billion ($1.5 billion) was outstanding under this facility.
SFS U.S. uses interest rate derivatives in order to reduce the interest rate risk of certain warehouse credit facilities where the underlying receivables carry fixed rates of interest and borrowings are based on the floating rate SOFR and CP indices.
Asset-backed securities (“ABS”) term notes
In January 2026, SFS U.S., through SFS Auto Receivables Securitization Trust 2026-1, issued six classes of ABS Term Notes totaling €1.3 billion ($1.5 billion) in aggregate. One class of notes bears interest at fixed and floating rates, with the remainder bearing interest rates at fixed rates. The ABS Term Notes are secured by a pool of prime retail loans.
In April 2026, SFS U.S., through First Investors Auto Owner Trust 2026-1, issued six classes of ABS Term Notes totaling €439 million ($500 million) in aggregate. The notes issued in each class bear a fixed rate. The ABS Term Notes are secured by a pool of near prime retail loans.
In May 2026, SFS U.S., through Stellantis Financial Underwritten Enhanced Lease Trust 2026-A, issued six classes of ABS Term Notes totaling €1.6 billion ($1.8 billion) in aggregate. One class of notes bears interest at fixed and floating rates, with the remainder bearing interest at fixed rates. The ABS Term Notes are secured by a pool of leases.
In June 2026, SFS U.S., through SFS Auto Receivables Securitization Trust 2026-2, issued six classes of ABS Term Notes totaling €1.1 billion ($1.3 billion) in aggregate. One class of notes bears interest at fixed and floating rates, with the remainder bearing interest at fixed rates. The ABS Term Notes are secured by a pool of prime retail loans.
Refer to Note 13, Debt in the Interim Condensed Consolidated Financial Statements included in this Interim Report for additional information.
Ratings
In February 2026, S&P revised Stellantis’ issuer credit rating and senior unsecured debt rating from “BBB” to “BBB-” with negative outlook.
In February 2026, Moody’s revised Stellantis’ long-term issuer rating and senior unsecured debt rating from “Baa2” to “Baa3” and changed the outlook from negative to stable.
Cash flows
The following table summarizes the cash flows from operating, investing and financing activities for the six months ended June 30, 2026 and 2025. Refer to the Interim Condensed Consolidated Statement of Cash Flows for the six months ended June 30, 2026 and 2025 in this Interim Report for additional information.
| | | | | | | | | | | | | | |
| | Six months ended June 30, |
(€ million) | | 2026 | | 2025 |
| Net cash from/(used in) operating activities | | (2,887) | | | (2,287) | |
| | | | |
| Net cash from/(used in) investing activities | | (3,020) | | | (2,146) | |
| | | | |
| Net cash from/(used in) financing activities | | 9,049 | | | 1,937 | |
| | | | |
| | | | |
Effects of changes in exchange rates | | 413 | | | (1,236) | |
| (Increase)/decrease in cash and cash equivalents included in asset held for sale | | (4) | | | 292 | |
| | | | |
| | | | |
| Increase/(decrease) in cash and cash equivalents | | 3,551 | | | (3,440) | |
| Net cash and cash equivalents at beginning of period | | 30,146 | | | 34,100 | |
| NET CASH AND CASH EQUIVALENTS AT END OF PERIOD | | 33,697 | | | 30,660 | |
Operating activities
For the six months ended June 30, 2026, cash flows used in operating activities was the result of Profit before taxes of €1,038 million adjusted primarily for the following items:
•Non-cash items of:
•€3,164 million for depreciation and amortization expense;
•€794 million for other non-cash items, including €507 million related to impairments of tangible and intangible assets of which €284 million of U.S. GHG-related Other intangible assets (refer to Company results for additional information) and the rest primarily related to program cancellations in North America;
• €1,985 million net decrease in provisions and employee benefits liabilities, primarily due to commercial risk provisions and warranty provisions, which is partially offset by an increase in sales incentives. The net decrease in provisions included €0.9 billion of cash payments related to charges recorded in the second half of 2025, as well as the release of U.S. GHG provisions (refer to Note 12, Provisions in the Interim Condensed Consolidated Financial Statements included in this Interim Report for additional information);
•the cash absorption of €2,076 million as a result of the increase in the carrying amount of leased vehicles related primarily to the financial services activity in North America;
•an increase in receivables from financing activities of €3,048 million, which was mainly attributable to growth in financial services activity;
•A net cash absorption of €930 million in working capital, which includes:
•an increase of €1,301 million in inventories driven by new vehicle stock build-up in Enlarged Europe and South America ahead of the planned summer production shutdown, to support new product launches and anticipated demand in the second half of the year;
•an increase of €1,592 million in trade receivables mainly reflecting increased volumes and a higher proportion of sales with extended credit terms in June as compared to December in both Enlarged Europe and South America;
•a negative impact of €1,370 million in other changes which is mainly related to the net tariff impact in North America and other receivables in South America; and
•an increase of €3,333 million in trade payables primarily reflecting increased production in May-June compared to November-December 2025 across the main regions.
For the six months ended June 30, 2025, cash flows used in operating activities was the result of Loss before taxes of €2,870 million primarily adjusted by the following items:
•Non-cash items of:
•€3,582 million for depreciation and amortization expense; and
•€2,155 million for other non-cash items, which was mainly attributable to impairments of Other intangible assets and Property, plant and equipment recognized in North America, Maserati and Enlarged Europe;
•an increase in receivables from financing activities of €1,738 million, which was mainly attributable to financial services activity in North America;
•the absorption of €2,824 million for the increase in carrying amount of leased vehicles related to financial services activity in North America;
•an €833 million net decrease in provisions, primarily due to a decrease in sales incentives, and;
•for the negative effect of the increase in working capital of €653 million, which includes:
•an increase of €2,145 million in inventories driven by higher new vehicles stock and manufacturing inventories;
•an increase of €1,094 million in trade receivables mainly reflecting the increased activity in June 2025 compared to December 2024; and
•a negative impact of €165 million in other changes.
This is partially offset by:
•an increase of €2,751 million in trade payables primarily reflecting higher production levels in June 2025 as compared to December 2024.
Investing activities
For the six months ended June 30, 2026, cash used in investing activities was primarily the result of:
•€2,744 million of investment in property, plant and equipment and intangible assets, including €1,273 million of capitalized development expenditures:
• €346 million decrease in payables related to investments in property, plant and equipment and intangible assets; and
• €258 million of acquisition of investments, mainly due to capital increases in joint ventures.
This is partially offset by:
• a decrease in securities of €462 million mainly due to the maturity of debt securities.
For the six months ended June 30, 2025, cash used in investing activities was primarily the result of:
•€4,447 million of investment in property, plant and equipment and intangible assets, including €1,705 million of capitalized development expenditures;
• €711 million decrease in payables related to investments in property, plant and equipment and intangible assets; and
•€247 million investment for acquisitions of consolidated subsidiaries and equity method and other investments which was primarily due to €89 million of capital injections to joint ventures and associates, and €158 million in acquisitions of consolidated subsidiaries and equity method investments associates.
This is partially offset by:
•the decrease in securities of €2,444 million mainly due to decrease in investments held by treasury companies; and
•€389 million net proceeds from disposals of shares in consolidated companies and of investments in non-consolidated companies.
Financing activities
For the six months ended June 30, 2026, net cash from financing activities totaled €9,049 million, primarily driven by:
•the issuance of Hybrid perpetual notes of €4,927 million, net (refer to Note 18, Equity in the Interim Condensed Consolidated Financial Statements included in this Interim Report for additional information);
•new long-term debt for €5,578 million, mainly to fund financial services in the U.S. and Brazil;
•issuance of bonds of €3,396 million, of which €2,157 million by SFS U.S.; and
•a net increase of €334 million in short-term debt and other financial assets and liabilities.
These inflows were partially offset by repayments of long-term debt, including:
•€2,514 million of bonds repaid at maturity; and
•€2,610 million of other long-term debt repayments.
For the six months ended June 30, 2025, cash used in financing activities resulted primarily from:
•the net increase in long-term debt of €6,301 million, including:
•the issuance of bonds for €3,566 million;
•the proceeds from the issuance of ABS Term Notes for €3,825 million;
•new other long-term debt of €1,427 million;
•the repayment of bonds for €650 million;
•the repayment of ABS Term Notes for € 1,226 million; and
•the repayment of other long-term debt of €641 million;
•the net decrease of €2,402 million in short-term debt and other financial liabilities; and
•the payment of dividends of €1,962 million.
Industrial free cash flows
The following table provides a reconciliation of Cash flows from operating activities, the most directly comparable measure included in our Interim Condensed Consolidated Statement of Cash Flows, to Industrial free cash flows for the six months ended June 30, 2026 and 2025:
| | | | | | | | | | | | | | |
| | Six months ended June 30, |
(€ million) | | 2026 | | 2025 |
| | | | |
| | | | |
| Cash flows from/(used in) operating activities | | (2,887) | | | (2,287) | |
| Less: Financial services, net of inter-segment eliminations | | (5,444) | | | (4,397) | |
| Less: Capital Expenditures and capitalized research and development expenditures and change in amounts payable on property, plant and equipment and intangible assets for industrial activities | | 3,066 | | | 5,136 | |
| Add: Proceeds from disposal of assets and other changes in investing activities | | (7) | | | 473 | |
| | | | |
| Less: Contributions of equity to joint ventures and minor acquisitions of consolidated subsidiaries and equity method and other investments | | 424 | | | 480 | |
| | | | |
| Add: Defined benefit pension contributions, net of tax | | 19 | | | 28 | |
| Industrial free cash flows | | (921) | | | (3,005) | |
| | | | |
| | | | |
Industrial free cash flows amounted to a net cash absorption of €921 million for the six months ended June 30, 2026, an improvement of €2,084 million, compared to the Industrial free cash flows net absorption of €3,005 million for the six months ended June 30, 2025. The main contributors to the improvement were:
•an increase of €447 million in cash flows from industrial operating activities, primarily as a result of:
•a €1,327 million increase in Profit before taxes from industrial activities net of non-cash items;
•a €372 million benefit from payments/refunds of income tax; partially offset by
•a €1,155 million increased absorption of cash due to change in provisions.
•a decrease in capital expenditures and capitalized research and development expenditures and change in amounts payable on property, plant and equipment and intangible assets for industrial activities of €2,070 million; partially offset by
•a €480 million decrease in proceeds from disposal of assets.
Industrial net financial position
| | | | | | | | | | | | | | | | | | | | | | | | | | | | | | | | | | | | | | | | |
| | At June 30, 2026 | | At December 31, 2025 | | |
(€ million) | | Stellantis | | Industrial activities | | Financial services | | Stellantis | | Industrial activities | | Financial services | | |
| Third parties debt (Principal) | | (51,593) | | | (23,331) | | | (28,262) | | | (45,318) | | | (24,616) | | | (20,702) | | | |
Capital market(1) | | (27,295) | | | (19,827) | | | (7,468) | | | (25,060) | | | (20,945) | | | (4,115) | | | |
Bank debt | | (2,281) | | | (623) | | | (1,658) | | | (1,931) | | | (867) | | | (1,064) | | | |
Other debt(2) | | (19,424) | | | (314) | | | (19,110) | | | (15,873) | | | (362) | | | (15,511) | | | |
Lease liabilities | | (2,593) | | | (2,567) | | | (26) | | | (2,454) | | | (2,442) | | | (12) | | | |
Accrued interest and other adjustments(3) | | (469) | | | (325) | | | (144) | | | (629) | | | (533) | | | (96) | | | |
| Debt with third parties (excluding held for sale) | | (52,062) | | | (23,656) | | | (28,406) | | | (45,947) | | | (25,149) | | | (20,798) | | | |
| Debt classified as held for sale | | — | | | — | | | — | | | — | | | — | | | — | | | |
| Debt with third parties including held for sale | | (52,062) | | | (23,656) | | | (28,406) | | | (45,947) | | | (25,149) | | | (20,798) | | | |
Intercompany, net(4) | | — | | | 796 | | | (796) | | | — | | | 1,756 | | | (1,756) | | | |
Current financial receivables from jointly-controlled financial services companies(5) | | 993 | | | 993 | | | — | | | 603 | | | 603 | | | — | | | |
Debt, net of intercompany, and current financial receivables from jointly-controlled financial service companies | | (51,069) | | | (21,867) | | | (29,202) | | | (45,344) | | | (22,790) | | | (22,554) | | | |
Derivative financial assets/(liabilities), net of collateral deposits(6) | | 106 | | | 77 | | | 29 | | | 181 | | | 188 | | | (7) | | | |
Financial securities(7) | | 880 | | | 604 | | | 276 | | | 1,362 | | | 1,098 | | | 264 | | | |
| Cash and cash equivalents | | 33,697 | | | 31,217 | | | 2,480 | | | 30,146 | | | 28,198 | | | 1,948 | | | |
| Cash and cash equivalents classified as held for sale | | 4 | | | 4 | | | — | | | — | | | — | | | — | | | |
Net financial position | | (16,382) | | | 10,035 | | | (26,417) | | | (13,655) | | | 6,694 | | | (20,349) | | | |
(1) Includes notes issued under the Medium Term Programme, or Medium Term Note (“MTN”) Programme, and other notes for €23,727 million at June 30, 2026 (€22,333 million at December 31, 2025), Schuldschein for €50 million (€314 million at December 31, 2025) and other financial instruments issued in financial markets, from financial services companies for €3,518 million (€2,413 million at December 31, 2025)
(2)Includes debt for securitizations programs, for €19,084 million at June 30, 2026 (€15,471 million at December 31, 2025), and other
asset-backed financing, i.e., sales of receivables for which de-recognition is not allowed under IFRS, for €36 million at June 30, 2026
(€8 million at December 31, 2025)
(3) Includes adjustments for purchase accounting and net (accrued)/deferred interest and other amortizing cost adjustments
(4) Net amount between industrial activities entities' financial receivables due from financial services entities (€1,530 million at June 30, 2026 and €2,237 million at December 31, 2025) and industrial activities entities' financial payables due to financial services entities (€734 million at June 30, 2026 and €481 million at December 31, 2025)
(5) Financial receivables due from Stellantis Financial Services Europe JVs
(6) Fair value of derivative financial instruments (net positive €89 million at June 30, 2026 and net positive €161 million at December 31, 2025) and collateral deposits (€17 million at June 30, 2026 and €20 million at December 31, 2025)
(7) Excludes certain financial securities held pursuant to applicable regulations (€386 million at June 30, 2026 and €376 million at December 31, 2025) and non-liquid equity investments (€874 million at June 30, 2026 and €608 million at December 31, 2025) and other non-liquid securities (€223 million at June 30, 2026 and €203 million at December 31, 2025)
The €3.3 billion improvement in Industrial net financial position at June 30, 2026, as compared to December 31, 2025, primarily reflects the proceeds from the Hybrid perpetual notes partially offset by the negative free cash flow for the six month period ended June 30, 2026.
Important events during the six months ended June 30, 2026
In February 2026, Stellantis announced an agreement for LG Energy Solution to acquire Stellantis’ 49 percent interest in NextStar Energy Inc, (“NextStar”) resulting in LG Energy Solution obtaining full ownership of NextStar. The transaction closed in March 2026. Refer to Note 2, Scope of consolidation in the Interim Condensed Consolidated Financial Statements included in this Interim Report for additional information.
In March 2026, the Company issued Hybrid perpetual notes in three tranches. Refer to Note 18, Equity in the Interim Condensed Consolidated Financial Statements included in this Interim Report for additional information.
In June 2026, following the loss of its right to representation on Archer’s Board of Directors, the Company reassessed the level of influence it exercises over its investment and, as a result, changed the accounting treatment applied to that investment. Refer to Note 2, Scope of Consolidation in the Interim Condensed Consolidated Financial Statements included in this Interim Report for additional information.
FaSTLAne 2030 STRATEGIC PLAN
In May 2026, the Company publicly presented the main elements of its FaSTLAne 2030 five-year strategic plan, emphasizing customer focus and disciplined capital allocation to regions and brands expected to deliver higher returns.
The strategy is structured around six core pillars:
1. Active management of brand portfolio
2. Investment in global platforms, powertrains and technology
3. Use of partnerships to complement core capabilities
4. Optimization of manufacturing footprint
5. Improvement in execution performance
6. Increased empowerment of regional and local teams
1. Active management of brand portfolio
The Company has revised its approach to managing its brand portfolio and product planning in order to improve capital efficiency, avoid duplication of expenditures and support profitability.
Under this approach, the Company expects, over the period to 2030, to introduce more than 60 new vehicle models and implement approximately 50 significant model refreshes across its brands and powertrain technologies. These launches are expected to include 29 battery-electric vehicles, 15 plug-in hybrid or range-extended electric vehicles, 24 hybrid electric vehicles and 39 internal combustion engine and mild hybrid electric vehicles.
The Company has identified four global brands (Jeep, Ram, Peugeot and FIAT) as having the greatest scale and potential for profitability. These brands, with their multi-regional presence, are natural first launchers for all new global assets. Approximately 70 percent of planned brand and product investments will be allocated to these brands, together with Pro One, the Company’s commercial vehicles business unit.
The Company’s regional brands—Chrysler, Dodge, Citroën, Opel and Alfa Romeo will to continue to operate in their core markets and will benefit from these same global assets and enhance their respective brand positioning.
DS and Lancia, which maintain a strong historical presence in France and Italy, respectively, will be managed within the Citroën and FIAT organizations and developed as specialty brands.
The Company also intends to support the long-term development of Maserati as a luxury brand, including the planned introduction of two new E-segment vehicles. Further details are expected to be communicated by December 2026.
2. Investment in global platforms, powertrains and technologies
The Company will leverage its global scale through planned investments exceeding €24 billion over the next five years, representing approximately 40 percent of total research and development and capital expenditure during the period. These investments are intended to support the development of global platforms, powertrains and technologies.
The Company’s platform strategy is based on modular architectures designed to improve efficiency and competitiveness. By 2030, approximately 50 percent of global annual volumes will be produced on three global platforms, including the STLA One architecture, which has been designed to maximize commonality.
The Company plans to expand its multi-energy powertrain offering, including hybrid, battery electric and internal combustion engine technologies. By 2030, nearly 50 percent of global annual volumes will utilize multi-regional powertrain solutions.
The Company’s technology strategy focuses on customer-oriented applications. In this context, the Company is developing scalable technology platforms, including STLA Brain (software and computing architecture), STLA SmartCockpit (in-vehicle user interface) and STLA AutoDrive (autonomous driving system), in collaboration with external partners. These technologies will be launched starting in 2027. By 2030, approximately 35 percent of global annual volumes are planned to incorporate at least one of these technologies, increasing to more than 70 percent by 2035.
3. Use of partnerships to complement core capabilities
The Company is leveraging its global presence to establish and expand strategic partnerships aimed at supporting value creation. These collaborations are intended to facilitate co-development and co-funding of products, improve access to additional markets, enhance technology capabilities, increase manufacturing capacity utilization and strengthen sourcing competitiveness.
The Company is entering into new partnerships or expanding existing ones, co-developing and co-funding products to gain access to additional markets, broadening technology optionality, increasing manufacturing capacity utilization, and improving sourcing competitiveness. These include its collaboration with Leapmotor through Leapmotor International (in which the Company holds a 51 percent interest) which will focus on joint purchasing initiatives and potential industrial cooperation, including the planned use of manufacturing capacity in Spain.
The Company is also enhancing its cooperation with Dongfeng Motor Group, with plans to produce selected Peugeot and Jeep models for sale in China and other regions. In addition, the Company intends to establish a European Stellantis-led joint venture with Dongfeng Motor Group and to collaborate in areas including distribution, engineering, sourcing and manufacturing.
Further partnerships include cooperation with Tata to support activities in Asia Pacific, Middle East and Africa and South America, and discussions with Jaguar Land Rover to explore potential collaboration opportunities in product and technology development in the U.S.
The Company is also developing strategic relationships with technology partners to complement internal capabilities in areas such as software, computing architecture, advanced driver assistance systems, artificial intelligence and battery technology.
4. Optimization of manufacturing footprint
Under the FaSTLAne 2030 plan, the Company aims to increase capacity utilization across regions through higher production volumes and targeted local actions.
•Enlarged Europe: Installed capacity is planned to be reduced by more than 800,000 units through plant repurposing and partnerships, while seeking to preserve employment. Capacity utilization is targeted to increase from approximately 60 percent to around 80 percent by 2030.
•North America: Higher production volumes are expected to support an increase in capacity utilization to approximately 80 percent by 2030.
•Middle East & Africa: Increased product localization is expected to support full capacity utilization by 2030.
5. Improvement of execution performance
Stellantis’ FaSTLAne 2030 plan prioritizes improvements in execution, including speed, quality and efficiency across regions. Management aims to reduce vehicle development cycles to approximately 24 months (from up to approximately 40 months currently) and to achieve top‑quartile quality performance over the plan period.
The recently launched multi‑year Value Creation Program is set to deliver approximately €6 billion run-rate of annual cost reductions by 2028 compared with a 2025 baseline, while supporting revenue initiatives.
Artificial intelligence is being deployed to enhance operational effectiveness, with more than 120 applications implemented across the Company’s processes.
6. Increased empowerment of regional and local teams
Automotive markets are primarily regional. Over the past year, the Company has decentralized decision‑making to regional organizations to better align with local market conditions and customer demand. Relationships with key stakeholders (including unions, dealers, suppliers, partners and local communities) have been maintained and further developed.
Under the FaSTLAne 2030 strategic plan, regions are responsible for developing and executing market‑specific plans while leveraging the Company’s global vehicle platforms and scale.
•North America: Targeted revenue growth of 25 percent and an AOI margin of 8–10 percent, driven by expanded market coverage (including 11 new models), increased volume, a broader offering in lower price segments, and cost actions under the Value Creation Program. Approximately 60 percent of the Company’s brand and product investment is allocated to this region.
•Enlarged Europe: Targeted revenue growth of 15 percent and an AOI margin of 3–5 percent, supported by portfolio refocusing, bringing greater differentiation to brands and expanding coverage with new C‑segment launches, competitive BEV offerings with STLA One platform and E-car, and higher capacity utilization.
•South America: Targeted revenue growth of 10 percent and an AOI margin of 8–10 percent, supported by continued leadership in core markets, new pickup launches, and expansion in the region.
•Middle East & Africa: Targeted revenue growth of 40 percent and an AOI margin of 10–12 percent driven by increased localization and increased imports through Asian partnerships.
•Asia Pacific: Targeted revenue growth of 100 percent and an AOI margin of 4–6 percent, leveraging strategic partnerships to enable asset-light growth locally and to export products to support other regions.
FaSTLAne 2030 Financial Targets
The Company has defined financial objectives aimed at supporting long‑term profitable growth, value creation and financial flexibility. These include:
•Target Net revenue growth, from €154 billion in 2025 to €175 billion by 2028 and €190 billion by 2030;
•AOI margin of 5 percent by 2028 and 7 percent by 2030, with improvements expected in the near term;
•Positive Industrial free cashflows expected by 2027, increasing to €3 billion by 2028 and increasing to €6 billion by 2030; and
•A cost reduction run-rate of €6 billion by 2028 compared with a 2025 baseline, with further improvements through 2030 under the Value Creation Program.
Risks and uncertainties
Except as noted below, the Company believes that the risks and uncertainties identified for the six months ended June 30, 2026 are in line with the main risks and uncertainties that were identified and discussed in the section Risk Management-Risk Factors in the Company's Annual Report and Form 20-F for the year ended December 31, 2025 filed with the SEC and AFM on February 26, 2026. Those risks and uncertainties should be read in conjunction with this Interim Report.
The fifth paragraph of the subsection “Risks Related to Our Business, Strategy and Operations - Our business may be adversely affected by global financial markets, general economic conditions, enforcement of government incentive programs, geopolitical volatility and protectionist trade policies, as well as other macro developments over which we have no control.” is deleted and replaced in its entirety with the following:
“We are subject to risks relating to geopolitical volatility and instability. For example, as a result of ongoing global conflicts, including the conflict in Iran, we may be subject to supply chain disruptions, energy and logistics cost inflation or other adverse impacts from increased global instability”.
The final paragraph of the subsection “Risks Related to the Industry in which We Operate - We face risks associated with increases in costs, disruptions of supply or shortages of raw materials, parts, components and systems used in our vehicles” is deleted and replaced in its entirety with the following:
“Any interruption in the supply or any increase in the cost of raw materials, parts, components and systems could negatively impact our ability to achieve our vehicle shipment objectives and profitability and delay commercial launches. The potential impact of an interruption is particularly high in instances where a part or component is sourced exclusively from a single supplier. Long-term interruptions in the supply of raw materials, parts, components and systems may result in a material impact on vehicle production, vehicle shipment objectives, and profitability. Cost increases which cannot be recouped through increases in vehicle prices, or countered by productivity gains, could have a material adverse effect on our business, financial condition and results of operations. This risk can increase during periods of economic uncertainty such as the crisis that resulted from the outbreak of COVID-19, as a result of regional economic disruptions such as that experienced in South America due to the deterioration in Argentina’s economic condition, the Russia-Ukraine conflict beginning in 2022, the increasing trade protectionism and barriers experienced in 2025, or the Iran conflict in 2026”.
GUIDANCE AND OUTLOOK
FULL YEAR 2026 STELLANTIS GUIDANCE
| | | | | | | | |
| Net revenue | | Mid-single digit percent increase |
| Adjusted operating income margin | | Low-single digit percent |
| Industrial free cash flows | | Improved year-over-year
Expect positive Industrial free cash flows in 2027 |
Net revenue:
•Reflects expanded product portfolio and expected volume recovery
AOI considerations:
• Continued focus on mitigating geopolitical, trade, inflationary, and commodity cost pressures
• Net tariff headwind now estimated at €1.0 billion to €1.2 billion, H1 2026 net tariff costs were €0.3 billion, including IEEPA refund of €0.4 billion
IFCF Considerations:
• Includes approximately €2 billion of cash payments related to H2 2025 charges, of which, approximately €0.9 billion already paid in H1 2026
•Full year 2026 capital expenditures and research and development estimated at 6.5 to 7 percent of Net revenues, consistent with FaSTLAne 2030 investment plan for this year
H2 2026 Dynamics:
•Performance expected to be weighted toward Q4, following Q3 summer production shutdown and continued operational performance improvements
INTERIM CONDENSED CONSOLIDATED FINANCIAL STATEMENTS AND NOTES AS OF AND FOR THE THREE AND SIX MONTHS ENDED JUNE 30, 2026
STELLANTIS N.V. AND SUBSIDIARIES
INTERIM CONDENSED CONSOLIDATED INCOME STATEMENT
(Unaudited)
| | | | | | | | | | | | | | | | | | | | | | | | | | | | | |
| | | Three months ended June 30, | | Six months ended June 30, |
(€ million, except per share amounts) | Note | | 2026 | | 2025 | | 2026 | | 2025 |
Net revenues | 3 | | 43,482 | | | 38,448 | | | 81,614 | | | 74,261 | |
Cost of revenues | | | 38,708 | | | 36,079 | | | 72,411 | | | 68,267 | |
Selling, general and other costs | | | 2,483 | | | 1,828 | | | 4,785 | | | 4,174 | |
Research and development costs | | | 1,308 | | | 1,938 | | | 2,748 | | | 3,371 | |
Gains/(losses) on disposal of investments | 2 | | 71 | | | (202) | | | 59 | | | (204) | |
Restructuring costs | 12 | | 384 | | | 399 | | | 482 | | | 522 | |
| Share of the profit/(loss) of equity method investees | | | 32 | | | (396) | | | 143 | | | (433) | |
| Operating income/(loss) | | | 702 | | | (2,394) | | | 1,390 | | | (2,710) | |
Net financial expenses/(income) | 4 | | 202 | | | 63 | | | 352 | | | 160 | |
Profit/(loss) before taxes | | | 500 | | | (2,457) | | | 1,038 | | | (2,870) | |
Tax expense/(benefit) | 5 | | 207 | | | (588) | | | 368 | | | (614) | |
| | | | | | | | | |
| | | | | | | | | |
Net profit/(loss) | | | 293 | | | (1,869) | | | 670 | | | (2,256) | |
| | | | | | | | | |
| | | | | | | | | |
| | | | | | | | | |
Net profit/(loss) attributable to: | | | | | | | | | |
Owners of the parent | | | 266 | | | (1,869) | | | 656 | | | (2,240) | |
Non-controlling interests | | | 27 | | | — | | | 14 | | | (16) | |
| | | | | | | | | |
Earnings/(loss) per share: | 19 | | | | | | | | |
Basic (loss)/earnings per share (€) | | | 0.07 | | | (0.65) | | | 0.20 | | | (0.78) | |
Diluted (loss)/earnings per share (€) | | | 0.07 | | | (0.65) | | | 0.20 | | | (0.78) | |
| | | | | | | | | |
| | | | | | | | | |
| | | | | | | | | |
| | | | | | | | | |
The accompanying notes are an integral part of the Interim Condensed Consolidated Financial Statements.
STELLANTIS N.V. AND SUBSIDIARIES
INTERIM CONDENSED CONSOLIDATED STATEMENT OF COMPREHENSIVE INCOME
(Unaudited)
| | | | | | | | | | | | | | | | | | | | | | | | | | | | | |
| | | Three months ended June 30, | | Six months ended June 30, |
(€ million) | Note | | 2026 | | 2025 | | 2026 | | 2025 |
| Consolidated profit/(loss) for the period | | | 293 | | | (1,869) | | | 670 | | | (2,256) | |
| | | | | | | | | |
| Fair value remeasurement of cash flow hedges | | | (48) | | | (17) | | | 122 | | | 260 | |
| of which, reclassified to the income statement | | | (72) | | | 226 | | | (101) | | | 221 | |
| of which, recognized in equity during the period | | | 24 | | | (243) | | | 223 | | | 39 | |
| Gains and losses from remeasurement of financial assets | | | (4) | | | (65) | | | (11) | | | 115 | |
| | | | | | | | | |
| of which, recognized in equity during the period | | | (4) | | | (65) | | | (11) | | | 115 | |
| Exchange differences on translating foreign operations | | | 402 | | | (3,018) | | | 1,655 | | | (4,340) | |
| Income tax (expense)/benefit | | | 2 | | | (65) | | | (18) | | | (137) | |
| Share of Other comprehensive income/(loss) of equity method investees | | | (63) | | | (175) | | | 4 | | | (304) | |
| | | | | | | | | |
| Amounts to be potentially reclassified to profit or loss | 15 | | 289 | | | (3,340) | | | 1,752 | | | (4,406) | |
| Actuarial gains and losses on defined benefit pension obligations | | | 159 | | | (257) | | | 339 | | | (119) | |
| Income tax (expense)/benefit | | | (30) | | | 65 | | | (81) | | | 32 | |
| Share of Other comprehensive income/(loss) for equity method investees | | | (2) | | | 2 | | | — | | | 9 | |
| | | | | | | | | |
| Amounts not to be reclassified to profit or loss | 15 | | 127 | | | (190) | | | 258 | | | (78) | |
| | | | | | | | | |
| TOTAL CONSOLIDATED COMPREHENSIVE INCOME/(LOSS) FOR THE PERIOD | | | 709 | | | (5,399) | | | 2,680 | | | (6,740) | |
| of which, attributable to equity holders of the parent | | | 680 | | | (5,402) | | | 2,662 | | | (6,713) | |
| of which, attributable to non-controlling interests | | | 29 | | | 3 | | | 18 | | | (27) | |
The accompanying notes are an integral part of the Interim Condensed Consolidated Financial Statements.
STELLANTIS N.V. AND SUBSIDIARIES
INTERIM CONDENSED CONSOLIDATED STATEMENT OF FINANCIAL POSITION
(Unaudited)
| | | | | | | | | | | | | | | | | |
(€ million) | Note | | At June 30, 2026 | | At December 31, 2025 |
| Assets | | | | | |
| Goodwill and intangible assets with indefinite useful lives | 6 | | 29,977 | | | 29,176 | |
| Other intangible assets | | | 15,793 | | | 15,709 | |
| Property, plant and equipment | | | 46,133 | | | 42,958 | |
Equity method investments | | | 7,343 | | | 7,276 | |
Non-current financial assets | 8 | | 1,895 | | | 1,794 | |
| Other non-current assets and prepaid expenses | 7 | | 15,103 | | | 11,125 | |
| Deferred tax assets | | | 6,558 | | | 6,383 | |
| Non-current tax receivables | | | 238 | | | 194 | |
| Total Non-current assets | | | 123,040 | | | 114,615 | |
| Inventories | 9 | | 23,987 | | | 22,153 | |
| Assets sold with a buyback commitment | | | 4,912 | | | 3,616 | |
| Trade receivables | | | 7,291 | | | 5,662 | |
| Current tax receivables | | | 931 | | | 1,199 | |
| Other current assets and prepaid expenses | 7 | | 17,586 | | | 15,770 | |
| Current financial assets | 8 | | 1,969 | | | 1,987 | |
| Cash and cash equivalents | | | 33,697 | | | 30,146 | |
| Assets held for sale | | | 10 | | | 5 | |
| Total Current assets | | | 90,383 | | | 80,538 | |
| Total Assets | | | 213,423 | | | 195,153 | |
| Equity and liabilities | | | | | |
| Equity | 18 | | | | |
| | | | | |
| | | | | |
| Equity attributable to owners of the parent | | | 61,279 | | | 53,551 | |
| Non-controlling interests | | | 458 | | | 450 | |
| Total Equity | | | 61,737 | | | 54,001 | |
| Liabilities | | | | | |
| Long-term debt | 13 | | 36,203 | | | 31,826 | |
| Other non-current financial liabilities | | | 6 | | | 7 | |
| Other non-current liabilities | 14 | | 5,758 | | | 5,475 | |
| Non-current provisions | 12 | | 16,393 | | | 18,596 | |
| Employee benefits liabilities | 11 | | 4,664 | | | 4,795 | |
| Non-current tax liabilities | | | 213 | | | 420 | |
| Deferred tax liabilities | | | 1,263 | | | 1,294 | |
| Total Non-current liabilities | | | 64,500 | | | 62,413 | |
| Short-term debt and current portion of long-term debt | 13 | | 15,859 | | | 14,121 | |
| Current provisions | 12 | | 14,775 | | | 14,317 | |
| Employee benefits liabilities | 11 | | 559 | | | 517 | |
| Trade payables | | | 33,604 | | | 29,999 | |
| Current tax liabilities | | | 713 | | | 491 | |
| Other liabilities | 14 | | 21,632 | | | 19,265 | |
| Other current financial liabilities | | | 30 | | | 29 | |
| Liabilities held for sale | | | 14 | | | — | |
| Total Current liabilities | | | 87,186 | | | 78,739 | |
| Total Equity and liabilities | | | 213,423 | | | 195,153 | |
The accompanying notes are an integral part of the Interim Condensed Consolidated Financial Statements.
STELLANTIS N.V. AND SUBSIDIARIES
INTERIM CONDENSED CONSOLIDATED STATEMENT OF CASH FLOWS
(Unaudited)
| | | | | | | | | | | | | | | | | |
| | | Six months ended June 30, |
(€ million) | Note | | 2026 | | 2025 |
| Profit/(loss) before taxes | | | 1,038 | | | (2,870) | |
| Adjustments for non-cash items and other: | | | | | |
| depreciation and amortization | | | 3,164 | | | 3,582 | |
| other non-cash items | | | 794 | | | 2,155 | |
| (gains)/losses on disposals | | | (51) | | | 154 | |
| share of the (profit)/loss of equity method investees | | | (143) | | | 433 | |
| Change in provisions and employee benefits liabilities | | | (1,985) | | | (833) | |
| Change in carrying amount of leased vehicles | | | (2,076) | | | (2,824) | |
| Net change in receivables related to financial services activities | | | (3,048) | | | (1,738) | |
| Dividend received | | | 185 | | | 227 | |
| Income tax received/(paid), net | | | 165 | | | 80 | |
| Changes in working capital | | | (930) | | | (653) | |
| Net cash from (used in) operating activities | | | (2,887) | | | (2,287) | |
| Proceeds from disposals of shares in consolidated companies and of investments in non-consolidated companies | | | 20 | | | 389 | |
| Acquisitions of consolidated subsidiaries and equity method investments | | | (258) | | | (247) | |
| Proceeds from disposals of property, plant and equipment and of intangible assets | | | 22 | | | 150 | |
| Investments in property, plant and equipment and intangible assets | | | (2,744) | | | (4,447) | |
| Change in amounts payable on property, plant and equipment and of intangible assets | | | (346) | | | (711) | |
| Changes in loans to joint ventures and associates | | | (173) | | | 275 | |
| Change in securities | | | 462 | | | 2,444 | |
| Other changes | | | (3) | | | 1 | |
| Net cash from (used in) investing activities | | | (3,020) | | | (2,146) | |
| Dividends paid: | | | | | |
| to Stellantis shareholders | | | — | | | (1,959) | |
| to minority shareholders of subsidiaries | | | (2) | | | (3) | |
| Proceeds from issuance of shares | | | 14 | | | — | |
| (Purchases)/sales of treasury shares | | | — | | | — | |
| Changes in short-term debt and other financial assets and liabilities | 13 | | 334 | | | (2,402) | |
| Gross outflows in repayments of long-term debt | 13 | | (5,124) | | | (2,517) | |
| Proceed from issuances of long-term debt | 13 | | 8,974 | | | 8,818 | |
| Issuance of Hybrid perpetual notes | 18 | | 4,927 | | | — | |
| Repayment of Hybrid perpetual notes | 18 | | — | | | — | |
| Coupons paid on Hybrid perpetual notes | 18 | | (35) | | | — | |
| Other changes | | | (39) | | | — | |
| Net cash from (used in) financing activities | | | 9,049 | | | 1,937 | |
| Effect of changes in exchange rates | | | 413 | | | (1,236) | |
| (Increase)/decrease in cash and cash equivalents included in asset held for sale | | | (4) | | | 292 | |
| Increase/(decrease) in cash and cash equivalents | | | 3,551 | | | (3,440) | |
| Net cash and cash equivalents at beginning of period | | | 30,146 | | | 34,100 | |
| Net cash and cash equivalents at end of the period | | | 33,697 | | | 30,660 | |
The accompanying notes are an integral part of the Interim Condensed Consolidated Financial Statements.
STELLANTIS N.V. AND SUBSIDIARIES
INTERIM CONDENSED CONSOLIDATED STATEMENT OF CHANGES IN EQUITY
(Unaudited)
| | | | | | | | | | | | | | | | | | | | | | | | | | | | | | | | | | | | | | | | | | | | | | | | | | | | | | | | | | | | | | | | | |
| Attributable to the Owners of the parent | | | | |
(€ million) | Share capital | | Treasury
shares | | Retained earnings and other reserves | | Cash flow hedges | | Remeasurement
of the fair value of financial assets | | Actuarial gains and losses on pension obligations plans | | Effect of change in exchange rates | | Cumulative
share of OCI of equity method investees | | Equity - Attributable
to Owners of the parent | | Non-controlling interests | | Total equity |
| At December 31, 2024 | 37 | | | (285) | | | 77,316 | | | (359) | | | 74 | | | 3,129 | | | 2,048 | | | (268) | | | 81,692 | | | 423 | | | 82,115 | |
| | | | | | | | | | | | | | | | | | | | | |
| Other comprehensive income | — | | | — | | | — | | | 176 | | | 62 | | | (87) | | | (4,329) | | | (295) | | | (4,473) | | | (11) | | | (4,484) | |
| Net profit/(loss) | — | | | — | | | (2,240) | | | — | | | — | | | — | | | — | | | — | | | (2,240) | | | (16) | | | (2,256) | |
| Total Other comprehensive income | — | | | — | | | (2,240) | | | 176 | | | 62 | | | (87) | | | (4,329) | | | (295) | | | (6,713) | | | (27) | | | (6,740) | |
| | | | | | | | | | | | | | | | | | | | | |
| | | | | | | | | | | | | | | | | | | | | |
| | | | | | | | | | | | | | | | | | | | | |
| Distributions | — | | | — | | | (1,959) | | | — | | | — | | | — | | | — | | | — | | | (1,959) | | | (3) | | | (1,962) | |
| Share-based compensation | — | | | — | | | 26 | | | — | | | — | | | — | | | — | | | — | | | 26 | | | — | | | 26 | |
Other changes(1) | — | | | — | | | 72 | | | (1) | | | — | | | — | | | — | | | — | | | 71 | | | 13 | | | 84 | |
| At June 30, 2025 | 37 | | | (285) | | | 73,215 | | | (184) | | | 136 | | | 3,042 | | | (2,281) | | | (563) | | | 73,117 | | | 406 | | | 73,523 | |
(1) Includes the effect of hyperinflation for entities whose functional currency is the Turkish Lira, beginning from January 1, 2022, and the Argentine Peso, from July 1, 2018 of €117 million at June 30, 2025. Also includes €1 million deferred net hedging gains/(losses) transferred to inventory, net of tax | | | | | | | | | | | | | | | | | | | | | | | | | | | | | | | | | | | | | | | | | | | | | | | | | | | | | | | | | | | | | | | | | | | | | | | |
| Attributable to the Owners of the parent | | | | |
(€ million) | Share capital | | Treasury
shares | | Hybrid perpetual notes | | Retained earnings and other reserves | | Cash flow hedges | | Remeasurement
of the fair value of financial assets | | Actuarial gains and losses on pension obligations plans | | Effect of change in exchange rates | | Cumulative
share of OCI of equity method investees | | Equity - Attributable
to Owners of the parent | | Non-controlling interests | | Total equity |
| At December 31, 2025 | 37 | | | (285) | | | — | | | 53,267 | | | 106 | | | 64 | | | 3,442 | | | (2,489) | | | (591) | | | 53,551 | | | 450 | | | 54,001 | |
| | | | | | | | | | | | | | | | | | | | | | | |
| Other comprehensive income | — | | | — | | | — | | | — | | | 104 | | | (11) | | | 258 | | | 1,651 | | | 4 | | | 2,006 | | | 4 | | | 2,010 | |
| Net profit/(loss) | — | | | — | | | — | | | 656 | | | — | | | — | | | — | | | — | | | — | | | 656 | | | 14 | | | 670 | |
| Total Other comprehensive income | — | | | — | | | — | | | 656 | | | 104 | | | (11) | | | 258 | | | 1,651 | | | 4 | | | 2,662 | | | 18 | | | 2,680 | |
| | | | | | | | | | | | | | | | | | | | | | | |
| | | | | | | | | | | | | | | | | | | | | | | |
| | | | | | | | | | | | | | | | | | | | | | | |
| Distributions | — | | | — | | | — | | | — | | | — | | | — | | | — | | | — | | | — | | | — | | | (2) | | | (2) | |
| Share-based compensation | — | | | — | | | — | | | 58 | | | — | | | — | | | — | | | — | | | — | | | 58 | | | — | | | 58 | |
| Hybrid perpetual notes | — | | | — | | | 5,000 | | | (73) | | | — | | | — | | | — | | | — | | | — | | | 4,927 | | | — | | | 4,927 | |
| Coupons on Hybrid perpetual notes | — | | | — | | | 65 | | | (100) | | | — | | | — | | | — | | | — | | | — | | | (35) | | | — | | | (35) | |
Other changes(1) | — | | | — | | | — | | | 120 | | | (4) | | | — | | | — | | | — | | | — | | | 116 | | | (8) | | | 108 | |
| At June 30, 2026 | 37 | | | (285) | | | 5,065 | | | 53,928 | | | 206 | | | 53 | | | 3,700 | | | (838) | | | (587) | | | 61,279 | | | 458 | | | 61,737 | |
(1) Includes the effect of hyperinflation for entities whose functional currency is the Turkish Lira, beginning from January 1, 2022, and the Argentine Peso, from July 1, 2018 of €108 million at June 30, 2026. Also includes €(4) million deferred net hedging gains/(losses) transferred to inventory, net of tax
The accompanying notes are an integral part of the Interim Condensed Consolidated Financial Statements.
STELLANTIS N.V. AND SUBSIDIARIES
NOTES TO THE INTERIM CONDENSED CONSOLIDATED FINANCIAL STATEMENTS
(Unaudited)
1. Basis of preparation
The accompanying Interim Condensed Consolidated Financial Statements together with the notes thereto (the “Interim Condensed Consolidated Financial Statements”) were authorized for issuance on July 30, 2026.
The Interim Condensed Consolidated Financial Statements, which have been prepared in accordance with IAS 34 – Interim Financial Reporting, do not include all of the information and notes required for complete financial statements and should be read in conjunction with the audited annual consolidated financial statements as of and for the year ended December 31, 2025 filed with the AFM and with the SEC on February 26, 2026 (the “Consolidated Financial Statements at December 31, 2025”), which are available on the Company’s corporate website at www.stellantis.com. The accounting policies are consistent with those used at December 31, 2025, except as described in the section — New standards and amendments effective from January 1, 2026 below. There is no effect on these Interim Condensed Consolidated Financial Statements resulting from differences between IFRS as issued by the IASB and IFRS as adopted by the European Union.
The Interim Condensed Consolidated Financial Statements are prepared under the historical cost method, modified for the measurement of certain financial instruments as required, as well as on a going concern basis. In this respect, the Company’s assessment is that no material uncertainties (as defined in IAS 1 - Presentation of Financial Statements) exist about its ability to continue as a going concern.
The preparation of the Interim Condensed Consolidated Financial Statements requires management to make estimates and assumptions that affect the reported amounts of revenues, expenses, assets, liabilities and disclosure of contingent liabilities. If in the future such estimates and assumptions, which are based on management’s best judgment at the date of the Interim Condensed Consolidated Financial Statements, deviate from the actual circumstances, the original estimates and assumptions will be modified as appropriate in the period in which the circumstances change. The Interim Condensed Consolidated Financial Statements include all adjustments considered necessary by management to fairly state the Company's results of operations, financial position and cash flows. For a description of the significant estimates, judgments and assumptions of the Company, refer to Note 2, Basis of preparation - Critical judgments and use of estimates in the Consolidated Financial Statements at December 31, 2025.
Segment reporting changes
Effective January 2026, the Company’s segment structure was updated to align with how the Chief Operating Decision Maker (“CODM”) reviews performance and allocates resources. Under the revised structure, the CODM reviews the business through the following operating and reportable segments: North America; Enlarged Europe; Middle East & Africa; South America; and Asia Pacific.
The changes in our segment reporting are summarized below:
•Maserati is no longer presented as a separate reportable segment as it is managed consistently with the other brands within the regions (and is therefore presented on a “where sold” basis);
•The Asia Pacific region is now managed as a single operating segment. Previously, the CODM reviewed two operating segments: (i) China and (ii) India & Asia Pacific, which were reported as one reportable segment under IFRS 8. From 2026, these activities are reviewed together, resulting in one operating and reportable segment: Asia Pacific. There is no impact on previously reported numbers as a result of this change; and
•European used car operations, previously included within Other activities, have been reclassified to the Enlarged Europe segment in line with the CODM’s oversight.
Comparative information has been restated to reflect the revised segment structure. The impact of these changes is presented in the following tables:
Net revenues
| | | | | | | | | | | | | | | | | | | | |
| | | Six months ended June 30, 2025 |
(€ million) | | As reported | | Adjustments | | As adjusted |
| North America | | 28,198 | | | 105 | | | 28,303 | |
| Enlarged Europe | | 29,241 | | | 1,316 | | | 30,557 | |
| Middle East & Africa | | 4,944 | | | 18 | | | 4,962 | |
| South America | | 7,769 | | | 2 | | | 7,771 | |
Asia Pacific | | 923 | | | 87 | | | 1,010 | |
| Maserati | | 369 | | | (369) | | | — | |
| Others | | 2,817 | | | (1,159) | | | 1,658 | |
| | | | | | | | | | | | | | | | | | | | |
| | | Three months ended June 30, 2025 |
(€ million) | | As reported | | Adjustments | | As adjusted |
| North America | | 13,782 | | | 52 | | | 13,834 | |
| Enlarged Europe | | 15,676 | | | 711 | | | 16,387 | |
| Middle East & Africa | | 2,664 | | | 10 | | | 2,674 | |
| South America | | 4,091 | | | 1 | | | 4,092 | |
Asia Pacific | | 476 | | | 48 | | | 524 | |
| Maserati | | 212 | | | (212) | | | — | |
| Others | | 1,547 | | | (610) | | | 937 | |
Adjusted operating income
| | | | | | | | | | | | | | | | | | | | |
| | | Six months ended June 30, 2025 |
(€ million) | | As reported | | Adjustments | | As adjusted |
| North America | | (951) | | | (31) | | | (982) | |
| Enlarged Europe | | 9 | | | (76) | | | (67) | |
| Middle East & Africa | | 768 | | | — | | | 768 | |
| South America | | 1,188 | | | 1 | | | 1,189 | |
Asia Pacific | | 19 | | | (19) | | | — | |
| Maserati | | (139) | | | 139 | | | — | |
| Others | | (354) | | | (14) | | | (368) | |
New standards and amendments effective from January 1, 2026
The following new standards, amendments and interpretations, which were effective from January 1, 2026, were adopted by the Company. The adoption of these amendments did not have a material impact on the Interim Condensed Consolidated Financial Statements.
•In May 2024, the IASB issued amendments to IFRS 9 and IFRS 7 regarding the classification and measurement of financial instruments. The amendments relate to the settling of financial liabilities using an electronic payment system, as well as assessing contractual cash flow characteristics of financial assets, including those with environmental, social and governance linked features.
•In July 2024, the IASB issued Annual Improvements to IFRS Accounting Standards – Volume 11, which included amendments to the following standards: updated wording regarding hedge accounting in IFRS 1 - First-time Adoption of IFRS, to address potential confusion from an inconsistency with the hedge accounting requirements of IFRS 9 Financial Instruments; replaced an obsolete reference in IFRS 7 – Financial Instruments: Disclosures, to IFRS 13 – Fair Value Measurement, and made other minor revisions regarding inconsistencies with IFRS 13; amended IFRS 9 Financial Instruments, to clarify how a lessee accounts for the derecognition of a lease liability and removed a potentially confusing cross reference to the term “transaction price” in IFRS 15 – Revenue from Contracts with Customers, as the term is used elsewhere in IFRS 9 and is not necessarily consistent with the definition in IFRS 15; revised the wording in IFRS 10 - Consolidated Financial Statements, to addresses a potential confusion arising from an inconsistency between two paragraphs related to an investor determining whether another party is acting on its behalf by aligning the language in both paragraphs; amended IAS 7 – Statement of Cash Flows, to remove a reference to the term “cost method” that is no longer defined in IFRS.
Exchange rates
The principal exchange rates used to translate other currencies into Euro were as follows:
| | | | | | | | | | | | | | | | | | | | | | | | | | | | | |
| For the six months ended June 30, 2026 | | At June 30, 2026 | | At December 31, 2025 | | For the six months ended June 30, 2025 | | At June 30, 2025 |
| U.S. Dollar (USD) | 1.166 | | 1.139 | | 1.175 | | 1.093 | | 1.172 |
| Canadian Dollar (CAD) | 1.607 | | 1.622 | | 1.609 | | 1.540 | | 1.603 |
| Mexican Peso (MXN) | 20.388 | | 19.903 | | 21.118 | | 21.815 | | 22.090 |
| Pound Sterling (GBP) | 0.868 | | 0.862 | | 0.873 | | 0.843 | | 0.856 |
| Polish Zloty (PLN) | 4.243 | | 4.296 | | 4.227 | | 4.233 | | 4.242 |
| Swiss Franc (CHF) | 0.918 | | 0.922 | | 0.931 | | 0.941 | | 0.935 |
Turkish Lira (TRY)(1) | n.a. | | 53.134 | | 50.331 | | n.a. | | 46.649 |
| Brazilian Real (BRL) | 6.016 | | 5.910 | | 6.469 | | 6.294 | | 6.422 |
Argentine Peso (ARS)(2) | n.a. | | 1,683.464 | | 1,707.560 | | n.a. | | 1,397.610 |
| Chinese Renminbi (CNY) | 8.009 | | 7.731 | | 8.226 | | 7.929 | | 8.397 |
| | | | | | | | | |
| | | | | | | | | |
| Japanese Yen (JPY) | 184.426 | | 185.080 | | 184.090 | | 162.110 | | 169.170 |
n.a. = not applicable
(1) From April 1, 2022, Türkiye’s economy was considered to be hyperinflationary. Transactions after January 1, 2022 for entities with the Turkish Lira as the functional currency were translated using the spot rate at the end of the period. The price indices used are published by the Turkish Statistical Institute
(2) From July 1, 2018, Argentina’s economy was considered to be hyperinflationary. Transactions after July 1, 2018 for entities with the Argentine Peso as the functional currency were translated using the spot rate at the end of the period. The price indices used are published by the Instituto Nacional de Estadistica y Censos de la Republica Argentina
2. Scope of consolidation
During the six months ended June 30, 2026, the effects of minor business disposals and minor business combinations were not material.
On March 31, 2026, Stellantis exited its joint venture with NextStar Energy Inc (“NextStar”). The investment had been classified as held for sale and fully written down in 2025, and the exit had no material financial impact in 2026.
In June 2026, Stellantis concluded, in accordance with IAS 28 - Investments in Associates and Joint Ventures, that it ceased to have significant influence over Archer Aviation Inc. (“Archer”) due to the loss of board representation rights, as Stellantis’ shareholding was no longer sufficient to nominate a director at the June 2026 shareholder meeting.
Following the loss of significant influence, Stellantis discontinued the application of the equity method and derecognized its investment in Archer as an associate at that date. The retained interest was remeasured at fair value on the date significant influence was lost, and this amount was recognized as the initial carrying value of a financial asset in accordance with IFRS 9 - Financial Instruments.
The resulting gain of €49 million, representing the difference between (i) the carrying amount of the equity-accounted investment and (ii) the fair value of the retained interest, together with the reclassification of amounts previously recognized in other comprehensive income, was recognized in the Interim Condensed Consolidated Income Statement within Gains/(losses) on disposal of investments for the six months ended June 30, 2026.
Stellantis has elected to present subsequent changes in the fair value of the retained interest in Archer in Other comprehensive income. Archer shares are accounted for as equity instruments and presented as non-current financial assets in the Condensed Consolidated Statement of Financial Position.
3. Net revenues
Net revenues were as follows:
| | | | | | | | | | | | | | | | | | | | | | | |
| Three months ended June 30, | | Six months ended June 30, |
(€ million) | 2026 | | 2025 | | 2026 | | 2025 |
| Revenues from: | | | | | | | |
| Shipments of vehicles and sales of other goods | 41,101 | | | 36,473 | | | 77,165 | | | 70,590 | |
| Other services provided | 1,398 | | | 1,247 | | | 2,705 | | | 2,426 | |
| | | | | | | |
| Lease installments from assets sold with a buyback commitment | 167 | | | 185 | | | 311 | | | 359 | |
| Interest income of financial services activities | 816 | | | 543 | | | 1,433 | | | 886 | |
| Total Net revenues | 43,482 | | | 38,448 | | | 81,614 | | | 74,261 | |
| | | | | | | | | | | | | | | | | | | | | | | | | | | | | | | | | | | | | | | | | | | | |
| Three months ended June 30, 2026 | | North America | | Enlarged Europe | | Middle East & Africa | | South America | | Asia Pacific | | Other activities | | Total |
(€ million) | | | | | | | | | | | | | | |
| Revenues from: | | | | | | | | | | | | | | |
| Shipments of vehicles and sales of other goods | | 17,866 | | | 15,916 | | | 2,545 | | | 4,209 | | | 486 | | | 79 | | | 41,101 | |
| Other services provided | | 327 | | | 340 | | | 21 | | | 85 | | | 13 | | | 612 | | | 1,398 | |
| | | | | | | | | | | | | | |
| Revenues from goods and services | | 18,193 | | | 16,256 | | | 2,566 | | | 4,294 | | | 499 | | | 691 | | | 42,499 | |
| | | | | | | | | | | | | | |
| Lease installments from assets sold with a buy-back commitment | | — | | | 167 | | | — | | | — | | | — | | | — | | | 167 | |
| Interest income from financial services activities | | — | | | — | | | — | | | — | | | — | | | 816 | | | 816 | |
| Total Net revenues | | 18,193 | | | 16,423 | | | 2,566 | | | 4,294 | | | 499 | | | 1,507 | | | 43,482 | |
| | | | | | | | | | | | | | | | | | | | | | | | | | | | | | | | | | | | | | | | | | | | |
| Three months ended June 30, 2025 | | North America | | Enlarged Europe | | Middle East & Africa | | South America | | Asia Pacific | | Other activities | | Total |
(€ million) | | | | | | | | | | | | | | |
| Revenues from: | | | | | | | | | | | | | | |
| Shipments of vehicles and sales of other goods | | 13,509 | | | 15,703 | | | 2,678 | | | 3,964 | | | 507 | | | 112 | | | 36,473 | |
| Other services provided | | 325 | | | 499 | | | (4) | | | 66 | | | 14 | | | 347 | | | 1,247 | |
| | | | | | | | | | | | | | |
| Revenues from goods and services | | 13,834 | | | 16,202 | | | 2,674 | | | 4,030 | | | 521 | | | 459 | | | 37,720 | |
| | | | | | | | | | | | | | |
| Lease installments from assets sold with a buy-back commitment | | — | | | 185 | | | — | | | — | | | — | | | — | | | 185 | |
| Interest income from financial services activities | | — | | | — | | | — | | | — | | | — | | | 543 | | | 543 | |
| Total Net revenues | | 13,834 | | | 16,387 | | | 2,674 | | | 4,030 | | | 521 | | | 1,002 | | | 38,448 | |
| | | | | | | | | | | | | | | | | | | | | | | | | | | | | | | | | | | | | | | | | | | | |
| Six months ended June 30, 2026 | | North America | | Enlarged Europe | | Middle East & Africa | | South America | | Asia Pacific | | Other activities | | Total |
(€ million) | | | | | | | | | | | | | | |
| Revenues from: | | | | | | | | | | | | | | |
| Shipments of vehicles and sales of other goods | | 33,656 | | | 29,801 | | | 4,918 | | | 7,728 | | | 910 | | | 152 | | | 77,165 | |
| Other services provided | | 651 | | | 685 | | | 35 | | | 149 | | | 24 | | | 1,161 | | | 2,705 | |
| | | | | | | | | | | | | | |
| Revenues from goods and services | | 34,307 | | | 30,486 | | | 4,953 | | | 7,877 | | | 934 | | | 1,313 | | | 79,870 | |
| | | | | | | | | | | | | | |
| Lease installments from assets sold with a buy-back commitment | | — | | | 311 | | | — | | | — | | | — | | | — | | | 311 | |
| Interest income from financial services activities | | — | | | — | | | — | | | — | | | — | | | 1,433 | | | 1,433 | |
| Total Net revenues | | 34,307 | | | 30,797 | | | 4,953 | | | 7,877 | | | 934 | | | 2,746 | | | 81,614 | |
| | | | | | | | | | | | | | | | | | | | | | | | | | | | | | | | | | | | | | | | | | | | |
| Six months ended June 30, 2025 | | North America | | Enlarged Europe | | Middle East & Africa | | South America | | Asia Pacific | | Other activities | | Total |
(€ million) | | | | | | | | | | | | | | |
| Revenues from: | | | | | | | | | | | | | | |
| Shipments of vehicles and sales of other goods | | 27,637 | | | 29,326 | | | 4,945 | | | 7,565 | | | 981 | | | 136 | | | 70,590 | |
| Other services provided | | 666 | | | 870 | | | 11 | | | 133 | | | 25 | | | 721 | | | 2,426 | |
| | | | | | | | | | | | | | |
| Revenues from goods and services | | 28,303 | | | 30,196 | | | 4,956 | | | 7,698 | | | 1,006 | | | 857 | | | 73,016 | |
| | | | | | | | | | | | | | |
| Lease installments from assets sold with a buyback commitment | | — | | | 359 | | | — | | | — | | | — | | | — | | | 359 | |
| Interest income from financial services activities | | — | | | — | | | — | | | — | | | — | | | 886 | | | 886 | |
| Total Net revenues | | 28,303 | | | 30,555 | | | 4,956 | | | 7,698 | | | 1,006 | | | 1,743 | | | 74,261 | |
4. Net financial expenses/(income)
The following table summarizes the Company’s financial income and expenses included within Net financial expenses/(income):
| | | | | | | | | | | | | | | | | | | | | | | |
| Three months ended June 30, | | Six months ended June 30, |
(€ million) | 2026 | | 2025 | | 2026 | | 2025 |
| Interest income and other financial income | 255 | | | 274 | | | 470 | | | 639 | |
| | | | | | | |
| Financial expenses: | | | | | | | |
| Interest expense and other financial expenses | 395 | | | 262 | | | 724 | | | 547 | |
| Interest on lease liabilities | 20 | | | 17 | | | 40 | | | 34 | |
| Write-down/(reversals of write-downs) of financial assets | 2 | | | 4 | | | 4 | | | 3 | |
| | | | | | | |
| Net interest expense on employee benefits provisions | 50 | | | 53 | | | 99 | | | 109 | |
| Total Financial expenses | 467 | | | 336 | | | 867 | | | 693 | |
| Net expenses/(income) from derivative financial instruments and exchange rate differences | (10) | | | 1 | | | (45) | | | 106 | |
| | | | | | | |
| Total Financial expenses and Net expenses from derivative financial instruments and exchange rate differences | 457 | | | 337 | | | 822 | | | 799 | |
| | | | | | | |
| Net financial expenses/(income) | 202 | | | 63 | | | 352 | | | 160 | |
For the three months ended June 30, 2026, the Company recorded Net financial expenses of €202 million compared to €63 million in the same period in 2025. The variance was primarily driven by higher interest on warranty provisions and lower capitalized interest.
For the six months ended June 30, 2026, the Company recorded Net financial expenses of €352 million compared to €160 million in the same period in 2025. The increase was primarily driven by lower interest income from liquidity investments, reflecting both reduced liquidity levels and a decline in short-term market rates, higher interest on warranty provisions and lower capitalized interest, partially offset by expenses recognized during 2025 upon termination of commodity derivative contracts of €138 million, which did not recur in 2026.
Net financial expenses for the six months ended June 30, 2026 included €37 million of losses (€70 million of losses for the six months ended June 30, 2025) on the net monetary position of entities whose functional currency is the currency of hyperinflationary economies, relating to the Argentine Peso and to the Turkish Lira. The decrease primarily reflects the disposal of Stellantis Türkiye that occurred in Q2 2025.
5. Tax expense/(benefit)
Tax expense/(benefit) was as follows: | | | | | | | | | | | | | | | | | | | | | | | |
| Three months ended June 30, | | Six months ended June 30, |
(€ million) | 2026 | | 2025 | | 2026 | | 2025 |
Current tax expense/(benefit) | 272 | | | 726 | | | 461 | | | 307 | |
Deferred tax expense/(benefit) | 11 | | | (1,256) | | | 21 | | | (870) | |
Tax expense/(benefit) relating to prior periods | (76) | | | (58) | | | (114) | | | (51) | |
| Total Tax expense/(benefit) | 207 | | | (588) | | | 368 | | | (614) | |
Tax expense was €207 million for the three months ended June 30, 2026, compared to a tax benefit of €588 million for the corresponding period in 2025. For the six months ended June 30, 2026, tax expense was €368 million, compared to a tax benefit of €614 million for the corresponding period in 2025. These variations primarily reflect the Company’s transition from pre-tax losses in the three and six month periods ended June 30, 2025 to pre-tax income in the corresponding periods of 2026.
The Company has assessed the impact of the Pillar Two tax rules on its operations. Many countries, including the Netherlands, where the Company is tax resident, enacted these rules in 2024. As a result, the Pillar Two rules are effective for Stellantis from January 1, 2024. For these quarterly Condensed Consolidated Financial Statements, the impact of Pillar Two is immaterial and relates to the Company’s operations in the United Arab Emirates, where the Pillar Two transitional safe harbor does not apply and the Pillar Two effective rate is below 15 percent. The Company has applied the mandatory exception to recognizing and disclosing information about deferred tax assets and liabilities arising from Pillar Two income taxes.
6. Goodwill and intangible assets with indefinite useful lives
Goodwill and intangible assets with indefinite useful lives at June 30, 2026 and at December 31, 2025 are summarized below:
| | | | | | | | | | | | | |
(€ million) | At June 30, 2026 | | | | At December 31, 2025 |
| Goodwill | 14,466 | | | | | 14,009 | |
| Other intangible assets with indefinite useful lives | 15,511 | | | | | 15,167 | |
| Total Goodwill and intangible assets with indefinite useful lives | 29,977 | | | | | 29,176 | |
At June 30, 2026, Goodwill amounted to €14,466 million, with gross value of €15,104 million and accumulated impairment losses of €638 million.
At December 31, 2025, Goodwill amounted to €14,009 million, with gross value of €14,647 million and accumulated impairment losses of €638 million.
The increase in Goodwill and Other intangible assets with indefinite useful lives during the six months ended June 30, 2026 is primarily related to currency translation impacts driven by the strengthening of the U.S. Dollar against the Euro.
7. Other assets and prepaid expenses
Other assets and prepaid expenses consisted of the following:
| | | | | | | | | | | | | | | | | | | | | | | | | | | | | | | | | | | |
| At June 30, 2026 | | At December 31, 2025 |
(€ million) | Current | | Non-current | | Total | | Current | | Non-current | | Total |
| Receivables from financing activities | 8,222 | | | 11,260 | | | 19,482 | | | 7,867 | | | 7,864 | | | 15,731 | |
| Other receivables and other assets | 3,819 | | | 1,264 | | | 5,083 | | | 3,052 | | | 884 | | | 3,936 | |
| Indirect tax receivables | 3,776 | | | 1,035 | | | 4,811 | | | 3,266 | | | 958 | | | 4,224 | |
| Defined benefit plan assets | — | | | 984 | | | 984 | | | — | | | 967 | | | 967 | |
| Derivative operating assets | 421 | | | 81 | | | 502 | | | 349 | | | 57 | | | 406 | |
| Prepaid expenses | 1,348 | | | 479 | | | 1,827 | | | 1,236 | | | 395 | | | 1,631 | |
| Total other assets and prepaid expenses | 17,586 | | | 15,103 | | | 32,689 | | | 15,770 | | | 11,125 | | | 26,895 | |
At June 30, 2026, Receivables from financing activities amounted to €19,482 million (€15,731 million at December 31, 2025). The increase is primarily due to growth in financing activities in SFS U.S.
At June 30, 2026, Other receivables and other assets amounted to €5,083 million (€3,936 million at December 31, 2025). The increase is largely attributable to assets of approximately €0.5 billion recognized related to tariff-related receivables during the six months ended June 30, 2026.
Transfer of financial assets
At June 30, 2026, the Company had receivables due after that date which had been transferred without recourse and which were derecognized in accordance with IFRS 9, Financial Instruments, amounting to €16,451 million (€16,074 million at December 31, 2025), of which 67 percent (69 percent at December 31, 2025) is mainly due from the sales network, were transferred to financing companies in partnership with Santander, BNP Paribas, Banco BBVA Argentina S.A. and Crédit Agricole.
8. Financial assets
| | | | | | | | | | | | | | | | | | | | | | | | | | | | | | | | | | | | | | | | |
| | | | At June 30, 2026 | | At December 31, 2025 |
(€ million) | | | | Current | | Non-current | | Total | | Current | | Non-current | | Total |
| Derivative financial assets | | | | 66 | | | 94 | | | 160 | | | 45 | | | 259 | | | 304 | |
| Financial securities measured at fair value through other comprehensive income | | | | 39 | | | 584 | | | 623 | | | 62 | | | 335 | | | 397 | |
| Financial securities measured at fair value through profit or loss | | | | 604 | | | 997 | | | 1,601 | | | 562 | | | 903 | | | 1,465 | |
| Financial securities measured at amortized cost | | | | 91 | | | 48 | | | 139 | | | 553 | | | 134 | | | 687 | |
Financial receivables(1) | | | | 1,169 | | | 155 | | | 1,324 | | | 763 | | | 145 | | | 908 | |
Collateral deposits(2) | | | | — | | | 17 | | | 17 | | | 2 | | | 18 | | | 20 | |
| Total financial assets | | | | 1,969 | | | 1,895 | | | 3,864 | | | 1,987 | | | 1,794 | | | 3,781 | |
(1) Measured at amortized cost
(2) Collateral deposits are held in connection with derivative transactions and debt obligations
9. Inventories
| | | | | | | | | | | |
(€ million) | At June 30, 2026 | | At December 31, 2025 |
| Finished goods and goods for resale | 13,491 | | | 12,161 | |
| Work-in-progress, raw materials and manufacturing supplies | 10,496 | | | 9,992 | |
| | | |
| Total Inventories | 23,987 | | | 22,153 | |
At June 30, 2026, Finished goods and goods for resale amounted to €13,491 million (€12,161 million at December 31, 2025). The increase is driven by new vehicle stock build-up in Enlarged Europe and South America ahead of the planned summer production shutdown and to support new product launches.
10. Share-based compensation
Long-Term Incentive Plan
The Company operates annual Long-Term Incentive Plans (“LTIPs”) approved by shareholders, granting Performance Share Units (“PSUs”), Restricted Share Units (“RSUs”), and Performance Restricted Share Units (“PRSUs”) to eligible employees. PSU awards are typically split across three performance metrics: Total Shareholder Return (TSR), Adjusted Operating Income (“AOI”), and either Electrification, Quality, or Compliance, each with independent payout scales. PSU, RSU and PRSUs have different vesting periods as summarized in the table below. Additionally, PRSUs vest subject to specific KPIs or multipliers. Fair values are determined using Monte Carlo simulations for TSR-based awards and for all other types of award the fair values are determined using the Stellantis share price on the grant date, adjusted for expected dividends at a constant yield as these awards do not have the right to receive ordinary dividends prior to vesting.
A summary of grants awarded in 2026 is provided below.
| | | | | | | | | | | | | | | | | | | | | | | | | | | | | |
| PSUs | RSUs | PRSUs |
| LTIP Period | PSUs Granted (millions)* | Performance Metrics | Metric Payout Range | Vesting period
Vesting Date | RSUs Granted (millions)* | Vesting period
Vesting Date | PRSUs Granted (millions)* | Metric Payout Range | Vesting period
Vesting Date |
| 2026-2028 | 16.8 | TSR (30%)
AOI (40%)
Quality (30%) | 0-200% | 2026-2028
Dec 2028 | 18.0 | 2026-2029
May 2029 | 0 | 0-150% | 2026-2028
Q2 2029 |
(*) Includes amounts related to awards granted during the current year in respect of the prior-year plan. presented based on the awards’ grant date
Share-based payment expense
Including previously granted awards, total expense of approximately €32 million and €68 million was recorded for the PSU, PRSU and RSU awards for the three months ended June 30, 2026 and the six months ended June 30, 2026, respectively. Total expense of approximately €18 million and €32 million was recorded for the PSU, PRSU and RSU awards for the three months ended June 30, 2025 and the six months ended June 30, 2025, respectively.
The total number of PSU, PRSU and RSU awards outstanding at June 30, 2026, was approximately 34.5 million, 0.5 million and 28.7 million shares, respectively.
11. Employee benefits liabilities
Employee benefits liabilities include provisions for both pension plans and health care, legal, severance indemnity and other post-employment benefits (“OPEB”) and consisted of the following:
| | | | | | | | | | | | | | | | | | | | | | | | | | | | | | | | | | | |
| At June 30, 2026 | | At December 31, 2025 |
(€ million) | Current | | Non-current | | Total | | Current | | Non-current | | Total |
| Pension benefits | 42 | | | 2,047 | | | 2,089 | | | 36 | | | 2,164 | | | 2,200 | |
| Health care and life insurance plans | 124 | | | 1,401 | | | 1,525 | | | 119 | | | 1,397 | | | 1,516 | |
| Other post-employment benefits | 46 | | | 583 | | | 629 | | | 37 | | | 578 | | | 615 | |
| Other provisions for employees | 347 | | | 633 | | | 980 | | | 325 | | | 656 | | | 981 | |
| Total Employee benefits liabilities | 559 | | | 4,664 | | | 5,223 | | | 517 | | | 4,795 | | | 5,312 | |
As of June 30, 2026, the U.S. and Canada pension plans, representing the largest portion of the Company’s pension benefits, were remeasured resulting in a decrease in the net liability of approximately €306 million due to changes in the discount rate and an additional decrease in the net liability of approximately €51 million due to favorable asset returns.
No curtailment losses were recognized during the six months ended June 30, 2026 and 2025.
Pension and OPEB costs included in the Interim Condensed Consolidated Income Statement were as follows:
| | | | | | | | | | | | | | | | | | | | | | | |
| Three months ended June 30, |
(€ million) | 2026 | | 2025 |
| Pension | | OPEB | | Pension | | OPEB |
| Current service cost | 27 | | | 13 | | | 29 | | | 19 | |
| Interest expense | 280 | | | 30 | | | 268 | | | 31 | |
| Interest (income) | (268) | | | (3) | | | (246) | | | (1) | |
| Other administrative costs | 19 | | | — | | | 21 | | | 4 | |
| | | | | | | |
| Total | 58 | | | 40 | | | 72 | | | 53 | |
| | | | | | | | | | | | | | | | | | | | | | | |
| Six months ended June 30, |
(€ million) | 2026 | | 2025 |
| Pension | | OPEB | | Pension | | OPEB |
| Current service cost | 54 | | | 27 | | | 63 | | | 32 | |
| Interest expense | 523 | | | 59 | | | 562 | | | 62 | |
| Interest (income) | (488) | | | (6) | | | (520) | | | (4) | |
| Other administrative costs | 39 | | | 4 | | | 43 | | | 1 | |
| | | | | | | |
| Total | 128 | | | 84 | | | 148 | | | 91 | |
Total contributions and direct benefit payments of €26 million were made to the pension plans in North America and Enlarged Europe during the six months ended June 30, 2026.
12. Provisions
| | | | | | | | | | | | | | | | | | | | | | | | | | | | | | | | | | | |
| At June 30, 2026 | | At December 31, 2025 |
(€ million) | Current | | Non-current | | Total | | Current | | Non-current | | Total |
| Product warranty and recall campaigns | 4,392 | | | 9,217 | | | 13,609 | | | 4,562 | | | 9,562 | | | 14,124 | |
| Sales incentives | 5,830 | | | — | | | 5,830 | | | 5,321 | | | — | | | 5,321 | |
| Restructuring | 702 | | | 399 | | | 1,101 | | | 637 | | | 405 | | | 1,042 | |
| Legal proceedings and disputes | 577 | | | 469 | | | 1,046 | | | 379 | | | 601 | | | 980 | |
| Commercial risks | 2,721 | | | 4,771 | | | 7,492 | | | 2,779 | | | 6,002 | | | 8,781 | |
| Other risks | 553 | | | 1,537 | | | 2,090 | | | 639 | | | 2,026 | | | 2,665 | |
| Total Provisions | 14,775 | | | 16,393 | | | 31,168 | | | 14,317 | | | 18,596 | | | 32,913 | |
Restructuring costs of €482 million and €522 million were recognized for the six months ended June 30, 2026 and 2025, respectively, the decrease was primarily related to lower workforce reductions mainly in Enlarged Europe.
The decrease in Commercial risks provision is primarily due to (i) €0.9 billion of cash payments related to charges recorded in the second half of 2025, (ii) approximately €300 million reduction in regulatory provisions in the U.S. due to revision in the estimated cost of contractual obligations, and (iii) reversal of the U.S. greenhouse gas (”GHG”) provision of €350 million as further explained below.
In February 2026, the U.S. Environmental Protection Agency finalized actions to rescind the 2009 GHG Endangerment Finding under the Clean Air Act. The Endangerment Finding had previously provided the legal basis for federal regulation of GHG emissions from motor vehicles. As a result of this regulatory development, during the six months ended June 30, 2026, Stellantis recognized a gain of €66 million within Cost of revenues which was excluded from AOI. The net gain consisted of an impairment of GHG-related Other intangible assets of €284 million and the reversal of the related GHG provision of €350 million, as mentioned above.
13. Debt
| | | | | | | | | | | | | | | | | | | | | | | | | | | | | | | | | | | |
| At June 30, 2026 | | At December 31, 2025 |
(€ million) | Current | | Non-current | | Total | | Current | | Non-current | | Total |
| Notes | 2,484 | | | 21,630 | | | 24,114 | | | 2,945 | | | 20,256 | | | 23,201 | |
| Borrowings from banks | 1,738 | | | 650 | | | 2,388 | | | 1,311 | | | 649 | | | 1,960 | |
| Asset-backed financing | 8,737 | | | 10,383 | | | 19,120 | | | 7,247 | | | 8,232 | | | 15,479 | |
| Lease liabilities | 889 | | | 1,704 | | | 2,593 | | | 818 | | | 1,636 | | | 2,454 | |
| Other debt | 2,011 | | | 1,836 | | | 3,847 | | | 1,800 | | | 1,053 | | | 2,853 | |
| Total Debt | 15,859 | | | 36,203 | | | 52,062 | | | 14,121 | | | 31,826 | | | 45,947 | |
Euro Medium Term Note Programme Notes
In January and May 2026, respectively, the Company repaid at maturity, a €1,250 million note issued by FCA N.V. and a €1,000 million note issued by Peugeot S.A. each originally issued in 2020.
On June 1, 2026, SFS U.S. issued two bonds:
•a USD bond with principal amount of $1,500 million with an interest rate of 5.4 percent and which matures in June 2029; and
•a USD bond with principal amount of $1,000 million with an interest rate of 5.8 percent and which matures in June 2031.
On June 12, 2026, the Company issued two bonds under its Euro Medium Term Notes Programme (“EMTN”):
•a EUR bond with principal amount of €750 million with an interest rate of 4.5 percent and which matures in January 2033; and
•a EUR bond with principal amount of €500 million with an interest rate of 5.1 percent and which matures in January 2037.
Undrawn committed credit lines
Stellantis N.V. has a syndicated revolving credit facility of €12.0 billion, structured in two tranches. The amount utilized under these credit lines was nil on June 30, 2026.
In December 2025, SFS U.S. established a privately placed CP program available up to a maximum of €1.9 billion ($2.2 billion). No CP was issued under the program in December 2025. Issuances under the CP program commenced in March 2026. At June 30, 2026, €0.4 billion ($0.5 billion) notes were outstanding under the CP program. These amounts are reported within the line item Other debt.
In connection with the establishment of the CP program, the €0.9 billion ($1 billion) committed USD credit facility originally signed by SFS U.S. in March 2024 was amended and refinanced (the "SFS RCF"). The amended SFS RCF is structured in two tranches: €1.1 billion ($1.3 billion), with a 364-days tenor, and €0.9 billion ($1 billion), with a three-year tenor, with each tranche benefiting from two further extension options, each of one year exercisable on the first and second anniversary of the amendment signing date. At June 30, 2026, the amount available under the amended SFS RCF, net of €0.4 billion of CP outstanding, was €1.5 billion ($1.7 billion).
Borrowings from banks
The increase of borrowings from banks is mainly due to issuance of new debt mainly in financial services companies.
Asset-backed financing
Asset-backed financing primarily represented the amount of financing received by SFS U.S. through USD denominated securitization programs and amounted to €18,336 million at June 30, 2026, (€14,759 million at December 31, 2025) that will be settled through the collection of a portfolio of receivables which originate from consumers and dealers. The increase in asset-backed financing at June 30, 2026, is primarily due to securitizations made to fund the increase in the SFS U.S. portfolio.
Warehouse credit facilities
There are three revolving warehouse credit facilities used to finance loan originations by SFS U.S.
In January 2026, the revolving credit floorplan facility (Stellantis Financial Floorplan Master Auto Owner Trust 2024-1) capacity was increased from €1.1 billion ($1.3 billion) to €1.8 billion ($2.0 billion) with the addition of 3 new lenders. Draw downs from the facility will bear an interest rate based on the lender’s asset-backed commercial paper cost of funds or Secured Overnight Financing Rate (“SOFR”), plus a spread. Borrowings are used to support the Company’s commercial floorplan lending business with floor plan receivables providing collateral. As of June 30, 2026, €1.3 billion ($1.5 billion) was outstanding under this facility.
SFS U.S. uses interest rate derivatives in order to reduce the interest rate risk of certain warehouse credit facilities where the underlying receivables carry fixed rates of interest and borrowings are based on the floating rate SOFR and CP indices.
The Company believes that the credit facilities will continue to be renewed or replaced, and that it will be able to secure additional sources of financing on satisfactory terms; however, there can be no assurance that it will be able to do so. In the event that the Company is unable to renew its facilities, the receivables pledged of €8.2 billion ($9.4 billion) as of June 30, 2026 would amortize over time to pay down the warehouse credit facilities; however, the Company would not be able to finance new receivables without alternative sources of funding. These amounts are reported within the line item Asset-backed financing within Debt.
ABS USD Term Notes
ABS USD Term Notes are issued in the U.S. by SFS U.S. for various classes ranging from Class A to Class E Notes. These notes are sequentially paid with Class A Notes paid first. The range of interest rates depends on the level of risk of loss and is determined by investor interest in each class of the notes. These amounts are reported within the line item Asset-backed financing within Debt.
In January 2026, SFS U.S., through SFS Auto Receivables Securitization Trust 2026-1, issued six classes of ABS Term Notes totaling €1.3 billion ($1.5 billion) in aggregate. One class of notes bears interest at fixed and floating rates, with the remainder bearing interest rates at fixed rates. The ABS Term Notes are secured by a pool of prime retail loans.
In April 2026, SFS U.S., through First Investors Auto Owner Trust 2026-1, issued six classes of ABS Term Notes totaling €439 million ($500 million) in aggregate. The notes issued in each class bear a fixed rate. The ABS Term Notes are secured by a pool of near prime retail loans.
In May 2026, SFS U.S., through Stellantis Financial Underwritten Enhanced Lease Trust 2026-A, issued six classes of ABS Term Notes totaling €1.6 billion ($1.8 billion) in aggregate. One class of notes bears interest at fixed and floating rates, with the remainder bearing interest at fixed rates. The ABS Term Notes are secured by a pool of leases.
In June 2026, SFS U.S., through SFS Auto Receivables Securitization Trust 2026-2, issued six classes of ABS Term Notes totaling €1.1 billion ($1.3 billion) in aggregate. One class of notes bears interest at fixed and floating rates, with the remainder bearing interest at fixed rates. The ABS Term Notes are secured by a pool of prime retail loans.
ABS USD Term Loans
ABS USD Term Loans are bilateral agreements provided by various banks which advance term loan proceeds secured by a pool of either retail loan receivables or consumer leases. Two asset-backed term loans outstanding as of June 30, 2026, with an aggregate balance of $1.0 billion (€0.9 billion) are secured by retail loan receivables with an aggregate balance of $1.3 billion (€1.1 billion). The remaining asset-backed term loan facility with a balance of $0.7 billion (€0.6 billion) as of June 30, 2026, is secured by $0.9 billion (€0.8 billion) in consumer lease receivables. These amounts are reported within the line item Asset-backed financing within Debt.
The terms governing the warehouse credit facilities and ABS Term Loans contain numerous covenants relating to the issuer’s business, the observance of certain financial covenants, the avoidance of certain levels of delinquency and credit loss experience and other matters. A breach of a covenant, if not cured within the time limits specified, could precipitate events of default that might result in the acceleration of the ABS Term Loan or warehouse credit facilities. The ABS Term Notes generally do not contain financial covenants or covenants related to delinquency experience or credit losses. SFS U.S. was not in default with respect to any financial and non-financial covenants governing these financing arrangements at June 30, 2026.
14. Other liabilities
Other liabilities consisted of the following:
| | | | | | | | | | | | | | | | | | | | | | | | | | | | | | | | | | | |
| At June 30, 2026 | | At December 31, 2025 |
(€ million) | Current | | Non-current | | Total | | Current | | Non-current | | Total |
| Payables for buy-back agreements | 6,907 | | | 2,957 | | | 9,864 | | | 5,313 | | | 2,576 | | | 7,889 | |
| Accrued expenses and deferred income | 6,718 | | | 784 | | | 7,502 | | | 6,323 | | | 789 | | | 7,112 | |
| Indirect tax payables | 1,613 | | | 5 | | | 1,618 | | | 1,354 | | | 7 | | | 1,361 | |
| Payables to personnel | 1,577 | | | 3 | | | 1,580 | | | 1,749 | | | 2 | | | 1,751 | |
| Social security payables | 591 | | | 2 | | | 593 | | | 472 | | | 2 | | | 474 | |
| | | | | | | | | | | |
| Service contract liabilities | 790 | | | 1,425 | | | 2,215 | | | 744 | | | 1,444 | | | 2,188 | |
| Derivatives operating liabilities | 102 | | | 28 | | | 130 | | | 150 | | | 27 | | | 177 | |
| Other | 3,334 | | | 554 | | | 3,888 | | | 3,160 | | | 628 | | | 3,788 | |
Total Other liabilities | 21,632 | | | 5,758 | | | 27,390 | | | 19,265 | | | 5,475 | | | 24,740 | |
At June 30, 2026, Payables for buy-back agreements amounted to €9,864 million (€7,889 million at December 31, 2025). The increase is mainly due to higher volumes of buy-back agreements in Enlarged Europe, consistent with the seasonal increase in activity during the second quarter.
15. Fair value measurement
Assets and liabilities that are measured at fair value on a recurring basis
The following table shows the fair value hierarchy, based on observable and unobservable inputs, for financial assets and liabilities that are measured at fair value on a recurring basis at June 30, 2026 and December 31, 2025:
| | | | | | | | | | | | | | | | | | | | | | | | | | | | | | | | | | | | | | | | | | | | | | | | | | | | |
| | | | At June 30, 2026 | | At December 31, 2025 |
(€ million) | | | | Level 1 | | Level 2 | | Level 3 | | Total | | Level 1 | | Level 2 | | Level 3 | | Total |
| Financial securities and equity instruments measured at FVOCI | | | | 324 | | | 8 | | | 291 | | | 623 | | | 108 | | | — | | | 289 | | | 397 | |
| Financial securities and equity instruments measured at FVPL | | | | 1,290 | | | 7 | | | 304 | | | 1,601 | | | 1,110 | | | 4 | | | 351 | | | 1,465 | |
Derivative financial assets | | | | — | | | 160 | | | — | | | 160 | | | — | | | 303 | | | 1 | | | 304 | |
| Derivative operating assets | | | | — | | | 498 | | | 4 | | | 502 | | | — | | | 397 | | | 9 | | | 406 | |
Collateral deposits | | | | 17 | | | — | | | — | | | 17 | | | 20 | | | — | | | — | | | 20 | |
Receivables from financing activities | | | | — | | | — | | | 2 | | | 2 | | | — | | | — | | | 3 | | | 3 | |
Trade receivables | | | | — | | | 21 | | | — | | | 21 | | | — | | | 4 | | | — | | | 4 | |
| | | | | | | | | | | | | | | | | | |
| | | | | | | | | | | | | | | | | | |
Money market securities | | | | 13,673 | | | — | | | — | | | 13,673 | | | 13,191 | | | — | | | — | | | 13,191 | |
Total Assets | | | | 15,304 | | | 694 | | | 601 | | | 16,599 | | | 14,429 | | | 708 | | | 653 | | | 15,790 | |
Derivative financial liabilities | | | | — | | | 36 | | | — | | | 36 | | | — | | | 36 | | | — | | | 36 | |
| Derivative operating liabilities | | | | — | | | 126 | | | 4 | | | 130 | | | — | | | 177 | | | — | | | 177 | |
Total Liabilities | | | | — | | | 162 | | | 4 | | | 166 | | | — | | | 213 | | | — | | | 213 | |
The fair value of derivative financial assets and liabilities is measured by taking into consideration market parameters at the balance sheet date and using valuation techniques widely accepted in the financial business environment, as described below:
•the fair value of forward contracts, swaps and options hedging currency risk is determined by using valuation techniques common in the financial markets and taking market parameters at the balance sheet date (in particular, exchange rates, interest rates and volatility rates);
•the fair value of interest rate swaps and forward rate agreements is determined by taking the prevailing interest rates at the balance sheet date and using the discounted expected cash flow method;
•the fair value of combined interest rate and currency swaps is determined using the exchange and interest rates prevailing at the balance sheet date and the discounted expected cash flow method; and
•the fair value of swaps and options hedging commodity price risk is determined by using valuation techniques common in the financial markets and taking market parameters at the balance sheet date (in particular, underlying prices, interest rates and volatility rates).
The fair value of money market securities is also based on available market quotations.
The fair value of Receivables from financing activities, which are classified in Level 3 of the fair value hierarchy, has been estimated using discounted cash flow models. The most significant inputs used in this measurement are market discount rates that reflect conditions applied in various reference markets on receivables with similar characteristics, adjusted in order to take into account the credit risk of the counterparties.
The fair values of Financial securities classified in level 3 are calculated using valuation techniques that incorporate inputs that are not directly observable in active markets. Therefore, the Company uses discounted cash flow models with the significant input being market discount rates along with the most recent financing rounds for certain investments.
The fair value of Other receivables is classified in Level 3 of the fair value hierarchy and has been estimated using discounted cash flow models. The most significant inputs used in this measurement are market discount rates.
For assets and liabilities recognized in the financial statements at fair value on a recurring basis, the Company determines whether transfers have occurred between levels in the hierarchy by re-assessing categorization at the end of each reporting period.
The following is a reconciliation of the changes in items measured at fair value and classified within Level 3:
| | | | | | | | | | | | | | | | | | | | | | | | | | | | | | |
| | Three months ended June 30, 2026 |
(€ million) | | Receivables from financing activities | | Financial securities | | Derivative assets/(liabilities) | | | | | | Other receivables |
| At April 1 | | 15 | | | 702 | | | 6 | | | | | | | — | |
| | | | | | | | | | | | |
| Gains/(losses) recognized in Consolidated Income Statement | | — | | | (8) | | | — | | | | | | | — | |
| Gains/(losses) recognized in Other comprehensive income/(loss) | | — | | | (14) | | | (5) | | | | | | | — | |
| Issues/(Settlements) | | (13) | | | (69) | | | (1) | | | | | | | — | |
| Purchases/(Sales) | | — | | | (16) | | | — | | | | | | | — | |
| | | | | | | | | | | | |
| | | | | | | | | | | | |
| At June 30 | | 2 | | | 595 | | | — | | | | | | | — | |
| | | | | | | | | | | | | | | | | | | | | | | | | | | | | | |
| | Three months ended June 30, 2025 |
(€ million) | | Receivables from financing activities | | Financial securities | | Derivative assets/(liabilities) | | | | | | Other receivables |
| At April 1 | | 83 | | | 1,027 | | | 2 | | | | | | | — | |
| Change in scope of consolidation | | — | | | 11 | | | — | | | | | | | — | |
| Gains/(losses) recognized in Consolidated Income Statement | | — | | | 4 | | | — | | | | | | | — | |
| Gains/(losses) recognized in Other comprehensive income/(loss) | | — | | | (76) | | | (1) | | | | | | | — | |
| Issues/(Settlements) | | 26 | | | — | | | — | | | | | | | — | |
| Purchases/(Sales) | | — | | | (49) | | | — | | | | | | | — | |
| | | | | | | | | | | | |
| Transfer (from)/to level 3 | | — | | | (9) | | | — | | | | | | | — | |
| At June 30 | | 109 | | | 908 | | | 1 | | | | | | | — | |
| | | | | | | | | | | | | | | | | | | | | | | | | | | | | | |
| | Six Months Ended June 30, 2026 |
(€ million) | | Receivables from financing activities | | Financial securities | | Derivative assets/(liabilities) | | | | | | Other receivables |
| At January 1 | | 3 | | | 640 | | | 10 | | | | | | | — | |
| | | | | | | | | | | | |
| Gains/(losses) recognized in Consolidated Income Statement | | — | | | (8) | | | — | | | | | | | — | |
| Gains/(losses) recognized in Other comprehensive income/(loss) | | — | | | — | | | (9) | | | | | | | — | |
| Issues/(Settlements) | | (1) | | | (69) | | | (1) | | | | | | | — | |
| Purchases/(Sales) | | — | | | (46) | | | — | | | | | | | — | |
| | | | | | | | | | | | |
| Transfer (from)/to level 3 | | — | | | 78 | | | — | | | | | | | — | |
| At June 30 | | 2 | | | 595 | | | — | | | | | | | — | |
| | | | | | | | | | | | | | | | | | | | | | | | | | | | | | |
| | Six Months Ended June 30, 2025 |
(€ million) | | Receivables from financing activities | | Financial securities | | Derivative assets/(liabilities) | | | | | | Other receivables |
| | | | |
| At January 1 | | — | | | 922 | | | (1) | | | | | | | 66 | |
| | | | | | | | | | | | |
| Gains/(losses) recognized in Consolidated Income Statement | | — | | | 4 | | | — | | | | | | | — | |
| Gains/(losses) recognized in Other comprehensive income/(loss) | | — | | | 78 | | | 2 | | | | | | | — | |
| Issues/(Settlements) | | 109 | | | — | | | — | | | | | | | (66) | |
| Purchases/(Sales) | | — | | | (87) | | | — | | | | | | | — | |
| | | | | | | | | | | | |
| Transfer (from)/to level 3 | | — | | | (9) | | | — | | | | | | | — | |
| At June 30 | | 109 | | | 908 | | | 1 | | | | | | | — | |
The gains/(losses) included in the Interim Condensed Consolidated Income Statements during the three and six months ended June 30, 2026 were recognized within Net revenues and for the three and six months ended June 30, 2025 were recognized within Net financial expenses. Total gains/(losses) recognized in Other comprehensive income are reported within the following line items:
| | | | | | | | | | | | | | | | | | | | | | | | | | |
| | Three months ended June 30, | | Six months ended June 30, |
(€ million) | | 2026 | | 2025 | | 2026 | | 2025 |
| Gains/(losses) recognized in Fair value remeasurement of cash flow hedges | | (5) | | | (209) | | | (9) | | | 2 | |
| Gains/(losses) recognized in Exchange differences on translating foreign operations | | (11) | | | (30) | | | 3 | | | (54) | |
| Gains/(losses) from remeasurement of financial assets | | (3) | | | 162 | | | (3) | | | 132 | |
Assets and liabilities not measured at fair value on recurring basis
The carrying value of debt securities measured at amortized cost, current receivables and payables is a reasonable approximation of fair value as the present value of future cash flows does not differ significantly from the carrying amount.
The carrying value of Cash at banks and Other cash equivalents usually approximate fair value due to the short maturity of these instruments.
The following table summarizes the carrying amount and fair value for financial assets and liabilities not measured at fair value on a recurring basis:
| | | | | | | | | | | | | | | | | | | | | | | | | | | | | |
| | | At June 30, 2026 | | At December 31, 2025 |
(€ million) | Note | | Carrying
amount | | Fair
Value | | Carrying
amount | | Fair
Value |
Dealer financing | | | 4,137 | | | 4,145 | | | 3,084 | | | 3,095 | |
Retail financing | | | 13,230 | | | 12,609 | | | 10,703 | | | 10,096 | |
Finance leases | | | 653 | | | 636 | | | 540 | | | 522 | |
Other receivables from financing activities | | | 1,460 | | | 1,466 | | | 1,401 | | | 1,360 | |
Total Receivables from financing activities(1) | 7 | | 19,480 | | | 18,856 | | | 15,728 | | | 15,073 | |
| | | | | | | | | |
Notes | | | 24,114 | | | 23,320 | | | 23,201 | | | 22,698 | |
Borrowings from banks & Other debt | | | 6,235 | | | 6,240 | | | 4,813 | | | 4,823 | |
Asset-backed financing | | | 19,120 | | | 19,091 | | | 15,479 | | | 15,331 | |
Total Debt, excluding Lease liabilities | 13 | | 49,469 | | | 48,651 | | | 43,493 | | | 42,852 | |
(1) Amounts exclude receivables measured at FVPL
The carrying value of financial securities measured at amortized cost was a reasonable approximation of fair value as the present value of future cash flows did not differ significantly from the carrying amount. Refer to Note 8, Financial assets for additional information.
Notes that are traded in active markets for which close or last trade pricing is available are classified within Level 1 of the fair value hierarchy. Notes for which such prices are not available are valued at the last available price or based on quotes received from independent pricing services or from dealers who trade in such securities and are categorized within Level 2. At June 30, 2026, €23,270 million and €50 million of Notes were categorized within Level 1 and Level 2, respectively. At December 31, 2025, €22,381 million and €317 million of Notes were categorized within Level 1 and Level 2, respectively.
The fair value of Borrowings from banks and Other debt classified within Level 2 of the fair value hierarchy has been estimated using discounted cash flow models. The main inputs used are market interest rates, adjusted for market expectations of the Company’s non-performance risk implied in quoted prices of traded securities issued by the Company and existing credit derivatives on Company liabilities. The fair value of the Borrowings from banks and Other debt that requires significant adjustments using unobservable inputs is categorized in Level 3. At June 30, 2026, €5,946 million and €294 million of Borrowings from banks and Other Debt were categorized within Level 2 and Level 3, respectively. At December 31, 2025, €4,465 million and €358 million of Borrowings from banks and Other Debt were categorized within Level 2 and Level 3, respectively.
16. Related party transactions
Related parties of the Company are entities and individuals capable of exercising control, joint control or significant influence over the Company and its subsidiaries. Related parties also include associates, joint ventures and unconsolidated subsidiaries of the Company, members of the Stellantis Board of Directors, executives with strategic responsibilities and certain members of their families. Related parties include companies affiliated with Exor N.V., which include Ferrari N.V., CNH Industrial N.V. (“CNHI”) and Iveco Group N.V. ("Iveco").
The amounts for transactions with related parties recognized in the Interim Condensed Consolidated Income Statement were as follows:
| | | | | | | | | | | | | | | | | | | | | | | | | | | | | | | | | | | | | | | | | | | | | | | |
| Three months ended June 30, |
| 2026 | | 2025 |
(€ million) | Net revenues | | Cost of revenues | | Selling, general and other costs/(income) | | Net financial expenses/(income) | | Net revenues(1) | | Cost of revenues | | Selling, general and other costs/(income) | | Net financial expenses/(income) |
| Joint arrangements and associates | 3,819 | | | 1,150 | | | 194 | | | 15 | | | 3,373 | | | 262 | | | (9) | | | 22 | |
| CNHI | — | | | 2 | | | — | | | — | | | 2 | | | — | | | — | | | — | |
| | | | | | | | | | | | | | | |
| Iveco | 36 | | | 2 | | | — | | | — | | | 31 | | | 3 | | | — | | | — | |
| | | | | | | | | | | | | | | | | | | | | | | | | | | | | | | | | | | | | | | | | | | | | | | |
| Six months ended June 30, |
| 2026 | | 2025 |
(€ million) | Net revenues | | Cost of revenues | | Selling, general and other costs/(income) | | Net financial expenses/(income) | | Net revenues(1) | | Cost of revenues | | Selling, general and other costs/(income) | | Net financial expenses/(income) |
| Joint arrangements and associates | 7,364 | | | 2,271 | | | 186 | | | 23 | | | 6,125 | | | 760 | | | (8) | | | 24 | |
| CNHI | — | | | — | | | — | | | — | | | 4 | | | — | | | — | | | — | |
| Ferrari N.V. | 1 | | | — | | | — | | | — | | | 1 | | | — | | | — | | | — | |
| Iveco | 70 | | | 4 | | | — | | | — | | | 57 | | | 4 | | | — | | | — | |
(1) Net revenues for the six months ended June 30, 2025, as previously reported, were reduced by €914 million to align the presentation of revenue from transactions with Leasys with the accounting treatment applied to buy-back transactions in the Condensed Consolidated Income Statement
The increase in Cost of revenues for transactions with joint arrangements and associates for the three and six months ended June 30, 2026 compared to the corresponding periods in 2025 is primarily due to increased volumes in Leapmotor branded vehicles and increased purchases of vehicles manufactured by Tofas.
Assets and liabilities from transactions with related parties were as follows:
| | | | | | | | | | | | | | | | | | | | | | | | | | | | | | | | | | | | | | | | | | | | | | | |
| At June 30, 2026 | | At December 31, 2025 |
(€ million) | Trade and other receivables | | Trade payables and Other liabilities | | Asset-backed financing | | Debt(1) | | Trade and other receivables | | Trade payables and Other liabilities(2) | | Asset-backed financing | | Debt(1) |
| Joint arrangements and associates | 4,013 | | | 3,301 | | | 24 | | | 78 | | | 2,793 | | | 2,620 | | | 6 | | | 103 | |
| CNHI | 3 | | | — | | | — | | | — | | | 3 | | | — | | | — | | | — | |
| Ferrari N.V. | 7 | | | — | | | — | | | — | | | 8 | | | — | | | — | | | — | |
| Iveco | 32 | | | 56 | | | — | | | — | | | 34 | | | 34 | | | — | | | — | |
(1) Related to Debt excluding Asset-backed financing, refer to Note 13, Debt for additional information
(2) Trade payables and Other liabilities at December 31, 2025 previously reported have been increased by €1,052 million to reflect the portion of payables for buy-back agreements related to transactions with Leasys
17. Guarantees granted, commitments and contingent liabilities
Guarantees granted and commitments
As of June 30, 2026, Stellantis N.V., guaranteed €1,395 million, or 49 percent of the total granted guarantees to third parties in respect of StarPlus Energy LLC’s total commitment of €2,848 million (€2,373 million at December 31, 2025).
As of June 30, 2026, Stellantis España guaranteed €112 million or 50 percent of the total granted guarantees to third parties in respect of Contemporary Star Energy’s total commitment of €223 million.
In 2024, NextStar entered into a loan facility with third‑party financial institutions for a notional amount of €1,144 million ($1,344 million at December 31, 2025), which was 49 percent guaranteed by Stellantis N.V. The facility was fully drawn at December 31, 2025. In March 2026, the Stellantis guarantees were terminated in connection with the exit from NextStar.
Litigation
Takata Airbag Recalls - Civil Litigation
We are subject to product liability claims, and consumer class, collective, and individual actions in several European jurisdictions and certain other countries, seeking compensation for the effects of Takata airbag recalls and stop-drive measures that we have progressively implemented since 2023. Given the number, preliminary status, and range of potential outcomes, at this stage we are unable to evaluate the likelihood that a material loss will be incurred with regard to these matters or estimate a range of possible loss.
Other commitments, arrangements and contractual rights
At June 30, 2026, total joint venture and associate capital commitments were €1,256 million covering the period through 2037.
18. Equity
Share capital
At June 30, 2026, the authorized share capital of Stellantis was ninety million Euro (€90,000,000), divided into 4.5 billion (4,500,000,000) Stellantis common shares, nominal value of one Euro cent (€0.01) per share and 4.5 billion (4,499,750,000) class A special voting shares, nominal value of one Euro cent (€0.01) per share each and two hundred and fifty thousand (250,000) class B special voting shares with a nominal value of one euro cent (€0.01) each.
At June 30, 2026, the fully paid-up share capital of Stellantis amounted to €37 million (€37 million at December 31, 2025) and consisted of 2,903,716,295 common shares (2,903,716,295 at December 31, 2025), of which 2,775,043 held in treasury (6,233,099 at December 31, 2025), 866,522,224 special voting shares A (866,522,224 at December 31, 2025) of which 139,606 held in treasury (113,162 at December 31, 2025).
At June 30, 2026 there were 2,900,941,252 outstanding common shares (2,897,483,196 at December 31, 2025). In the six months ended June 30, 2026, 3,458,056 were delivered in execution of the Share-based compensation plans.
Share buyback program
At the annual general meeting (“AGM”) on April 13, 2023, the Board of Directors was authorized to acquire common shares in the capital of the Company, either through purchase on a stock exchange, through a public tender offer, an offer for exchange or otherwise, up to a maximum number of shares equal to 10 percent of the Company’s issued common shares. The authorization was for a period of 18 months from the date of the 2023 AGM. The authorization was renewed in the same terms at the AGM on April 14, 2026.
Perpetual subordinated fixed rate resettable capital securities (“Hybrid perpetual notes”)
In March 2026, the Company issued three tranches of Hybrid perpetual notes:
•€2.2 billion with a non‑call period of 5.25 years and an annual coupon of 6.250 percent until the first reset date on June 16, 2031;
•€1.8 billion with a non‑call period of 8 years and an annual coupon of 6.875 percent until the first reset date on March 16, 2034; and
•GBP 865 million (€997 million) with a non‑call period of 6.5 years and an annual coupon of 8.250 percent until the first reset date on September 16, 2032.
Coupon
The fixed-rate coupons are subject to a reset every five years, beginning from the respective first reset date indicated above.
Coupon payments may be deferred indefinitely at the Company’s discretion, and Stellantis is not obligated to make any payments, subject to certain conditions. Deferred coupons will accumulate and will become payable only if the Hybrid perpetual notes are called by Stellantis. In limited circumstances such as the declaration of dividends, payments on junior securities or parity obligations, Stellantis is required to pay any then-deferred coupons.
The Hybrid perpetual notes have no maturity date, however, subject to applicable non-call periods, the Company may redeem them in whole at its discretion.
Accounting treatment
Debt and equity instruments are classified by the Company as either financial liabilities or as equity in accordance with the substance of the contractual arrangements and with the definitions of a financial liability and equity instrument set out in IAS 32 - Financial Instruments.
Equity instruments issued by the Company are recognized when the proceeds are received, net of direct issuance costs.
The repurchase of equity instruments issued by the Company is recognized and deducted directly in equity. No gain or loss is recognized in the profit or loss on the purchase, sale, issue or cancellation of equity instruments issued by the Company.
Distributions to holders of equity instruments are recognized directly in equity.
The characteristics of the Hybrid perpetual notes give the Company an unconditional right to avoid paying the principal or interest. As a result, and in accordance with IAS 32, these securities are classified as equity instruments, and any payment, net of taxes is accounted for as a deduction of equity.
The issuance discount and transaction costs related to these issuances amount to €73 million, and have been recorded in equity, in accordance with IAS 32.
19. Earnings/(loss) per share
In 2026, following the issuance of Hybrid perpetual notes classified as equity (refer to Note 18, Equity for additional information), coupons accrued on these instruments, together with the Hybrid perpetual notes, are accounted for in a separate reserve within equity, which is not available for distribution to equity holders. The deferred tax effect arising from the issuance discount and other costs on the Hybrid perpetual notes is also recognized directly in equity within Retained earnings and other reserves. Accordingly, the coupon accrued and the deferred tax impact are deducted from Net profit/(loss) attributable to the equity holders of the parent in calculating both basic and diluted earnings per share. No such adjustment was required in 2025, as no Hybrid perpetual notes were outstanding during that period.
Basic (loss)/earnings per share
Basic (loss)/earnings per share for the three and six months ended June 30, 2026 and 2025 was determined by dividing the Net profit/(loss) attributable to the equity holders of the parent adjusted for coupons on Hybrid perpetual notes, net of taxes, by the weighted average number of shares outstanding during each period.
The following table summarizes the amounts used to calculate the basic earnings/(loss) per share:
| | | | | | | | | | | | | | | | | | | | | | | | | | |
| | Three months ended June 30, | | Six months ended June 30, |
| | 2026 | | 2025 | | 2026 | | 2025 |
| Net profit/(loss) attributable to owners of the parent | million | 266 | | | (1,869) | | | 656 | | | (2,240) | |
| Coupon and tax impacts on Hybrid perpetual notes | million | (72) | | | — | | | (64) | | | — | |
| Weighted average number of shares outstanding | thousand | 2,898,791 | | | 2,884,704 | | | 2,898,144 | | | 2,882,611 | |
| Basic (loss)/earnings per share | | 0.07 | | | (0.65) | | | 0.20 | | | (0.78) | |
Diluted (loss)/earnings per share
In order to calculate the diluted (loss)/earnings per share during the three and six months ended June 30, 2026, the weighted average number of shares outstanding was increased to take into consideration the theoretical effect of the potential common shares that would be issued for the outstanding and unvested share-based compensation awards at June 30, 2026 as determined using the treasury stock method.
For the three and six months ended June 30, 2026, there were no instruments excluded from the calculation of diluted earnings per share because of an anti-dilutive effect.
For the three and six months ended June 30, 2025, as a result of the loss attributable to owners of the parent, the theoretical effect that would arise if the share-based payment plans were exercised was not taken into consideration in the calculation of diluted earnings/(loss) per share as this would have had an anti-dilutive effect.
The following table summarizes the amounts used to calculate the diluted (loss)/earnings per share for the six months ended June 30, 2026 and 2025: | | | | | | | | | | | | | | | | | | | | | | | | | | |
| | Three months ended June 30, | | Six months ended June 30, |
| | 2026 | | 2025 | | 2026 | | 2025 |
| Net profit/(loss) attributable to owners of the parent | million | 266 | | | (1,869) | | | 656 | | | (2,240) | |
| Coupon and tax impacts on Hybrid perpetual notes | million | (72) | | | — | | | (64) | | | — | |
| Weighted average number of shares outstanding | thousand | 2,898,791 | | | 2,884,704 | | | 2,898,144 | | | 2,882,611 | |
| Number of shares deployable for share-based compensation | thousand | 18,903 | | | — | | | 11,233 | | | — | |
| | | | | | | | |
| Weighted average number of shares outstanding for diluted earnings per share | thousand | 2,917,694 | | | 2,884,704 | | | 2,909,377 | | | 2,882,611 | |
| Diluted (loss)/earnings per share | | 0.07 | | | (0.65) | | | 0.20 | | | (0.78) | |
20. Segment reporting
The Company’s activities are carried out through five regional vehicle reportable segments: North America, Enlarged Europe, Middle East & Africa, South America and Asia Pacific. Refer to Note 1, Basis of Preparation for additional information on segment reporting changes.
See below for a reconciliation of Net profit, which is the most directly comparable measure included in our Interim Condensed Consolidated Income Statement, to Adjusted operating income. Operating assets are not included in the data reviewed by the chief operating decision maker, and as a result and as permitted by IFRS 8, the related information is not provided.
The following tables summarize selected financial information by segment for the three and six months ended June 30, 2026 and 2025:
| | | | | | | | | | | | | | | | | | | | | | | | | | | | | | | | | | | | | | | | | | | | | | | | | | |
| Three months ended June 30, 2026 | | North America | | Enlarged Europe | | Middle East & Africa | | South America | | Asia Pacific | | Other activities | | Unallocated items & eliminations | | Stellantis |
(€ million) | | |
| Net revenues from external customers | | 18,193 | | | 16,423 | | | 2,566 | | | 4,294 | | | 499 | | | 1,507 | | | — | | | 43,482 | |
| Net revenues from transactions with other segments | | — | | | 3 | | | (1) | | | 44 | | | — | | | 75 | | | (121) | | | — | |
| Net revenues | | 18,193 | | | 16,426 | | | 2,565 | | | 4,338 | | | 499 | | | 1,582 | | | (121) | | | 43,482 | |
| | | | | | | | | | | | | | | | |
| Net profit/(loss) | | | | | | | | | | | | | | | | 293 | |
| Tax expense/(benefit) | | | | | | | | | | | | | | | | 207 | |
| Net financial expenses/(income) | | | | | | | | | | | | | | | | 202 | |
| Operating income/(loss) | | | | | | | | | | | | | | | | 702 | |
| | | | | | | | | | | | | | | | |
| Adjustments: | | | | | | | | | | | | | | | | |
Restructuring and other costs, net of reversals(1) | | (14) | | | 358 | | | — | | | 37 | | | 1 | | | 2 | | | — | | | 384 | |
Takata airbags recall campaign(2) | | — | | | 51 | | | — | | | 1 | | | — | | | — | | | — | | | 52 | |
Costs related to product plan realignments and program cancellations(3) | | 40 | | | — | | | — | | | — | | | — | | | — | | | — | | | 40 | |
| U.S. GHG regulation change | | — | | | — | | | — | | | — | | | — | | | — | | | — | | | — | |
Renegotiated regulatory purchase commitments of credits(4) | | (317) | | | — | | | — | | | — | | | — | | | — | | | — | | | (317) | |
(Gains)/losses on disposal of investments(5) | | — | | | — | | | — | | | (2) | | | — | | | (69) | | | — | | | (71) | |
| Other | | (9) | | | (4) | | | 2 | | | — | | | (4) | | | (4) | | | 2 | | | (17) | |
| Total adjustments | | (300) | | | 405 | | | 2 | | | 36 | | | (3) | | | (71) | | | 2 | | | 71 | |
| Adjusted operating income/(loss) | | 284 | | | (94) | | | 329 | | | 402 | | | 27 | | | 79 | | | (254) | | | 773 | |
| | | | | | | | | | | | | | | | |
| Share of profit of equity method investees, excluding adjustments | | 66 | | | (111) | | | 20 | | | — | | | 12 | | | 45 | | | — | | | 32 | |
(1) Primarily related to workforce reductions, mainly in Enlarged Europe
(2) Related to stop-drive campaign on certain vehicles mainly in Enlarged Europe
(3) Primarily related to costs incurred as result of product plan realignments and program cancellations in North America
(4) Includes a net gain of €317 million within Cost of revenues related to renegotiated contractual commitments for the purchase of regulatory compliance credits
(5) Comprised primarily of gains recognized as a result of the loss of significant influence over Archer and the resulting termination of the equity method (refer to Note 2, Scope of consolidation for additional information), and a dilution gain related to the investment in Comau Group
| | | | | | | | | | | | | | | | | | | | | | | | | | | | | | | | | | | | | | | | | | | | | | | | | | |
| Three months ended June 30, 2025 | | North America | | Enlarged Europe | | Middle East & Africa | | South America | | Asia Pacific | | Other activities | | Unallocated items & eliminations | | Stellantis |
(€ million) | | |
| Net revenues from external customers | | 13,834 | | | 16,387 | | | 2,674 | | | 4,030 | | | 521 | | | 1,002 | | | — | | | 38,448 | |
| Net revenues from transactions with other segments | | — | | | — | | | — | | | 62 | | | 3 | | | 29 | | | (94) | | | — | |
Net revenues(1) | | 13,834 | | | 16,387 | | | 2,674 | | | 4,092 | | | 524 | | | 1,031 | | | (94) | | | 38,448 | |
| | | | | | | | | | | | | | | | |
| Net profit/(loss) | | | | | | | | | | | | | | | | (1,869) | |
| Tax expense/(benefit) | | | | | | | | | | | | | | | | (588) | |
| Net financial expenses/(income) | | | | | | | | | | | | | | | | 63 | |
| Operating income/(loss) | | | | | | | | | | | | | | | | (2,394) | |
| | | | | | | | | | | | | | | | |
| Adjustments: | | | | | | | | | | | | | | | | |
Restructuring and other costs, net of reversals(2) | | (3) | | | 370 | | | — | | | 4 | | | — | | | 28 | | | — | | | 399 | |
Takata airbags recall campaign(3) | | — | | | 174 | | | — | | | — | | | — | | | — | | | — | | | 174 | |
Platform impairments(4) | | — | | | 578 | | | — | | | — | | | — | | | — | | | — | | | 578 | |
Costs related to program cancellations(5) | | 165 | | | 122 | | | 8 | | | — | | | 1 | | | — | | | — | | | 296 | |
Fuel cell program discontinuation(6) | | — | | | 733 | | | — | | | — | | | — | | | — | | | — | | | 733 | |
CAFE penalty rate(7) | | 269 | | | — | | | — | | | — | | | — | | | — | | | — | | | 269 | |
Stellantis Türkiye disposal(8) | | — | | | — | | | 246 | | | — | | | — | | | — | | | — | | | 246 | |
Other(9) | | (63) | | | 5 | | | — | | | (1) | | | (1) | | | (33) | | | 5 | | | (88) | |
| Total adjustments | | 368 | | | 1,982 | | | 254 | | | 3 | | | — | | | (5) | | | 5 | | | 2,607 | |
| Adjusted operating income | | (440) | | | (359) | | | 392 | | | 782 | | | 20 | | | (164) | | | (18) | | | 213 | |
| | | | | | | | | | | | | | | | |
| Share of profit of equity method investees, excluding adjustments | | 1 | | | (481) | | | 13 | | | 2 | | | 7 | | | 62 | | | — | | | (396) | |
(1) With effect from January 1, 2026, the Company’s segment structure was updated to align with how the CODM reviews performance and allocates resources. Under the revised structure, the CODM reviews the business through the following operating and reportable segments: North America; Enlarged Europe; Middle East & Africa; South America; and Asia Pacific. Refer to Note 1, Basis of Preparation for additional information
(2) Primarily related to workforce reductions, mainly in Enlarged Europe
(3) Related to stop-drive campaign on certain vehicles in Enlarged Europe announced in June 2025
(4) Due to reduced volumes, platforms used for Maserati and Alfa Romeo vehicles were impaired and recognized in Enlarged Europe for €578 million
(5) Primarily related to costs incurred as result of program cancellations
(6) During the three months ended June 30, 2025, Stellantis decided to discontinue its fuel cell strategy. As a result, the following items have been impaired: (i) investment in Symbio (€179 million), (ii) loans granted to Symbio (€162 million), (iii) capitalized development expenditures and property, plant and equipment related to fuel cells (€329 million) and (iv) in addition, provisions for risks were recognized (€63 million)
(7) As a result of the elimination of CAFE fines with the enactment of One Big Beautiful Bill Act, net expense of €269 million included (i) elimination of the CAFE provision of €844 million, (ii) impairment of the regulatory credit assets of €609 million, and (iii) onerous contracts related to contractual purchase commitments for CAFE credits of €504 million
(8) Sale of Stellantis Türkiye to the Company’s joint venture, Tofas, for which the Company recognized an estimated loss on disposal of €246 million, driven primarily by the recycling of the cumulative translation reserve from Equity to the Consolidated Income Statement upon disposal
(9) Comprised primarily of (i) adjustments to costs previously recognized to support the workforce during the transformation of certain plants in North America, (ii) gains on disposal of investments in Enlarged Europe and (iii) a gain from dilution related to the investment in Archer
| | | | | | | | | | | | | | | | | | | | | | | | | | | | | | | | | | | | | | | | | | | | | | | | | | |
| Six months ended June 30, 2026 | | North America | | Enlarged Europe | | Middle East & Africa | | South America | | Asia Pacific | | Other activities | | Unallocated items & eliminations | | Stellantis |
(€ million) | | |
| Net revenues from external customers | | 34,307 | | | 30,797 | | | 4,953 | | | 7,877 | | | 934 | | | 2,746 | | | — | | | 81,614 | |
| Net revenues from transactions with other segments | | — | | | 4 | | | — | | | 84 | | | — | | | 129 | | | (217) | | | — | |
| Net revenues | | 34,307 | | | 30,801 | | | 4,953 | | | 7,961 | | | 934 | | | 2,875 | | | (217) | | | 81,614 | |
| | | | | | | | | | | | | | | | |
| Net profit/(loss) | | | | | | | | | | | | | | | | 670 | |
| Tax expense/(benefit) | | | | | | | | | | | | | | | | 368 | |
| Net financial expenses/(income) | | | | | | | | | | | | | | | | 352 | |
| Operating income/(loss) | | | | | | | | | | | | | | | | 1,390 | |
| | | | | | | | | | | | | | | | |
| Adjustments: | | | | | | | | | | | | | | | | |
Restructuring and other costs, net of reversals(1) | | (21) | | | 458 | | | 4 | | | 37 | | | 2 | | | 2 | | | — | | | 482 | |
Takata airbags recall campaign(2) | | — | | | 100 | | | 5 | | | 1 | | | — | | | — | | | — | | | 106 | |
Costs related to product plan realignments and program cancellations(3) | | 221 | | | (25) | | | — | | | — | | | — | | | — | | | — | | | 196 | |
U.S. GHG regulation change(4) | | (66) | | | — | | | — | | | — | | | — | | | — | | | — | | | (66) | |
Renegotiated regulatory purchase commitments of credits(5) | | (317) | | | — | | | — | | | — | | | — | | | — | | | — | | | (317) | |
(Gains)/losses on disposal of investments(6) | | — | | | 12 | | | — | | | (2) | | | — | | | (69) | | | — | | | (59) | |
| Other | | 8 | | | (3) | | | 2 | | | — | | | (4) | | | (3) | | | 1 | | | 1 | |
| Total adjustments | | (175) | | | 542 | | | 11 | | | 36 | | | (2) | | | (70) | | | 1 | | | 343 | |
| Adjusted operating income/(loss) | | 547 | | | (86) | | | 611 | | | 795 | | | (3) | | | 265 | | | (396) | | | 1,733 | |
| | | | | | | | | | | | | | | | |
| Share of profit of equity method investees, excluding adjustments | | 96 | | | (93) | | | 29 | | | 1 | | | (5) | | | 115 | | | — | | | 143 | |
(1) Primarily related to workforce reductions, mainly in Enlarged Europe
(2) Related to stop-drive campaign on certain vehicles mainly in Enlarged Europe
(3) Primarily related to costs incurred as result of product plan realignments and program cancellations, including €221 million recognized in North America, as well as a provision reversal of €25 million in Enlarged Europe
(4) Following the repeal of the U.S. GHG emissions standards, the Company recognized a gain of €66 million within Cost of revenues. The net gain consisted of an impairment of GHG-related Other intangible assets of €284 million and the elimination of the related GHG provision of €350 million
(5) Includes a net gain of €317 million within Cost of revenues related to renegotiated contractual commitments for the purchase of regulatory compliance credits
(6) Comprised primarily of (i) gains recognized as a result of the loss of significant influence over Archer and the resulting termination of the equity method (refer to Note 2, Scope of consolidation for additional information), and a dilution gain related to the investment in Comau Group, and (ii) gains/(losses) recognized on the disposal of non-significant assets in Enlarged Europe
| | | | | | | | | | | | | | | | | | | | | | | | | | | | | | | | | | | | | | | | | | | | | | | | | | |
| Six Months Ended June 30, 2025 | | North America | | Enlarged Europe | | Middle East & Africa | | South America | | Asia Pacific | | Other activities | | Unallocated items & eliminations | | Stellantis |
(€ million) | | |
| Net revenues from external customers | | 28,303 | | | 30,555 | | | 4,956 | | | 7,698 | | | 1,006 | | | 1,743 | | | — | | | 74,261 | |
| Net revenues from transactions with other segments | | — | | | 2 | | | 6 | | | 73 | | | 4 | | | 130 | | | (215) | | | — | |
Net revenues(1) | | 28,303 | | | 30,557 | | | 4,962 | | | 7,771 | | | 1,010 | | | 1,873 | | | (215) | | | 74,261 | |
| | | | | | | | | | | | | | | | |
| Net profit/(loss) | | | | | | | | | | | | | | | | (2,256) | |
| Tax expense/(benefit) | | | | | | | | | | | | | | | | (614) | |
| Net financial expenses/(income) | | | | | | | | | | | | | | | | 160 | |
| Operating income/(loss) | | | | | | | | | | | | | | | | (2,710) | |
| | | | | | | | | | | | | | | | |
| Adjustments: | | | | | | | | | | | | | | | | |
Restructuring and other costs, net of reversals(2) | | (41) | | | 531 | | | — | | | 4 | | | — | | | 28 | | | — | | | 522 | |
Takata airbags recall campaign(3) | | — | | | 239 | | | — | | | — | | | — | | | — | | | — | | | 239 | |
Platform impairments(4) | | — | | | 578 | | | — | | | — | | | — | | | — | | | — | | | 578 | |
Costs related to program cancellations(5) | | 327 | | | 134 | | | 8 | | | 319 | | | 1 | | | — | | | — | | | 789 | |
Fuel cell program discontinuation(6) | | — | | | 733 | | | — | | | — | | | — | | | — | | | — | | | 733 | |
CAFE penalty rate(7) | | 269 | | | — | | | — | | | — | | | — | | | — | | | — | | | 269 | |
Stellantis Türkiye disposal(8) | | — | | | — | | | 246 | | | — | | | — | | | — | | | — | | | 246 | |
Other(9) | | (83) | | | (23) | | | — | | | — | | | 2 | | | (17) | | | (5) | | | (126) | |
| Total adjustments | | 472 | | | 2,192 | | | 254 | | | 323 | | | 3 | | | 11 | | | (5) | | | 3,250 | |
| Adjusted operating income | | (982) | | | (67) | | | 768 | | | 1,189 | | | — | | | (73) | | | (295) | | | 540 | |
| | | | | | | | | | | | | | | | |
| Share of profit of equity method investees, excluding adjustments | | 6 | | | (555) | | | 8 | | | — | | | (15) | | | 123 | | | — | | | (433) | |
(1) With effect from January 1, 2026, the Company’s segment structure was updated to align with how the CODM reviews performance and allocates resources. Under the revised structure, the CODM reviews the business through the following operating and reportable segments: North America; Enlarged Europe; Middle East & Africa; South America; and Asia Pacific. Refer to Note 1, Basis of Preparation for additional information
(2) Primarily related to workforce reductions, mainly in Enlarged Europe, partially offset by a €41 million reduction in estimated North America restructuring costs
(3) Related to stop-drive campaign on certain vehicles in Enlarged Europe announced in June 2025
(4) Due to reduced volumes, platforms used for Maserati and Alfa Romeo vehicles were impaired and recognized in Enlarged Europe for €578 million
(5) Primarily related to costs incurred as result of program cancellations
(6) During the six months ended June 30, 2025, Stellantis decided to discontinue its fuel cell strategy. As a result, the following items have been impaired: (i) investment in Symbio (€179 million), (ii) loans granted to Symbio (€162 million), (iii) capitalized development expenditures and property, plant and equipment related to fuel cells (€329 million) and (iv) in addition, provisions for risks were recognized (€63 million)
(7) As a result of the elimination of CAFE fines with the enactment of OBBB, the Company recognized a net expense of €97 million, comprised of net €172 million of CAFE credits recognized as a reduction of Cost of revenues, which remains included in Adjusted operating income as these amounts reduced prior year CAFE fines, and a net expense of €269 million, which is excluded from AOI and comprised of (i) elimination of the CAFE provision of €844 million, (ii) impairment of the regulatory credit assets of €609 million, and (iii) onerous contracts related to contractual purchase commitments for CAFE credits of €504 million
(8) Sale of Stellantis Türkiye to the Company’s joint venture, Tofas, for which the Company recognized an estimated loss on disposal of €246 million, driven primarily by the recycling of the cumulative translation reserve from Equity to the Consolidated Income Statement upon disposal
(9) Comprised primarily of (i) adjustments to costs previously recognized to support the workforce during the transformation of certain plants in North America, (ii) gains on sales of real estate in Enlarged Europe, and (iii) a gain from dilution related to the investment in Archer
21. Subsequent events
In July 2026, SFS U.S., through Stellantis Financial Underwritten Enhanced Trust 2026-B, issued six classes of ABS Term Notes totaling €0.9 billion ($1.0 billion) in aggregate principal amount. One class of notes bears interest at fixed and floating rates with the remainder bearing interest rate at fixed rate. The ABS Term Notes are secured by a pool of leases.
In July 2026, SFS Funding, LLC, the Company’s primary syndicated secured warehouse facility, was upsized from U.S.$8 billion to U.S.$12 billion. In connection with the upsizing, the number of participating banks increased from 12 to 16. No material changes were made to the facility’s terms and conditions, and the scheduled termination date was extended to July 24, 2028. The facility continues to bear interest at variable commercial paper rates plus a spread or SOFR plus a spread.The facility was originally established in August 2022 and has subsequently been renewed and expanded.
In July 2026, the Company announced that it had entered into an agreement to dispose of its entire interest in Free2move's car-sharing business. Completion of the transaction remains subject to customary closing conditions and regulatory approvals. The transaction is not expected to have a material effect on the Company's Consolidated Financial Statements.
Responsibility statement
The Board of Directors is responsible for preparing the Interim Report, inclusive of the Interim Condensed Consolidated Financial Statements and the Management Discussion and Analysis, in accordance with the Dutch Financial Supervision Act and the applicable International Financial Reporting Standards (IFRS) for interim reporting, IAS 34 - Interim Financial Reporting.
In accordance with Section 5:25d, paragraph 2 of the Dutch Financial Supervision Act, the Board of Directors states that, to the best of its knowledge, the Interim Condensed Consolidated Financial Statements prepared in accordance with applicable accounting standards provide a true and fair view of the assets, liabilities, financial position and profit or loss of Stellantis and its subsidiaries, and the undertakings included in the consolidation as a whole, and the Management Discussion and Analysis provides a fair review of the information required pursuant to Section 5:25d, paragraphs 8 and 9 of the Dutch Financial Supervision Act.
July 30, 2026
The Board of Directors
John Elkann
Antonio Filosa
Robert Peugeot
Henri de Castries
Fiona Clare Cicconi
Nicolas Dufourcq
Juergen Esser
Ann Godbehere
Claudia Parzani
Daniel Ramot
Benoît Ribadeau-Dumas
Alice Davey Schroeder