Exhibit 99.2
Cenovus Energy Inc.
Management’s Discussion and Analysis (unaudited)
For the Periods Ended June 30, 2026
(Canadian Dollars)
MANAGEMENT’S DISCUSSION AND ANALYSIS 
| | |
For the periods ended June 30, 2026 |
This Management’s Discussion and Analysis (“MD&A”) for Cenovus Energy Inc. (which includes references to “we”, “our”, “us”, “its”, the “Company”, or “Cenovus”, and means Cenovus Energy Inc., the subsidiaries of, joint arrangements, and partnership interests held directly or indirectly by, Cenovus Energy Inc.) dated July 28, 2026, should be read in conjunction with our June 30, 2026 unaudited interim Consolidated Financial Statements and accompanying notes (“interim Consolidated Financial Statements”), the December 31, 2025 audited Consolidated Financial Statements and accompanying notes (“Consolidated Financial Statements”) and the December 31, 2025 MD&A (“annual MD&A”). All of the information and statements contained in this MD&A are made as at July 28, 2026, unless otherwise indicated. This MD&A contains forward-looking information about our current expectations, estimates, projections and assumptions. See the Advisory for information on the risk factors that could cause actual results to differ materially and the assumptions underlying our forward-looking information. Cenovus management (“Management”) prepared the MD&A. The Audit Committee of the Cenovus Board of Directors (“the Board”) reviewed and recommended the MD&A for approval by the Board, which occurred on July 28, 2026. Additional information about Cenovus, including our quarterly and annual reports, Annual Information Form (“AIF”) and Form 40-F, is available on SEDAR+ at sedarplus.ca, on EDGAR at sec.gov and on our website at cenovus.com. Information on or connected to our website, even if referred to in this MD&A, do not constitute part of this MD&A. Basis of Presentation
This MD&A and the interim Consolidated Financial Statements were prepared in Canadian dollars (which includes references to “dollar” or “$”), except where another currency is indicated, and in accordance with International Financial Reporting Standards (“IFRS”) as issued by the International Accounting Standards Board (“IASB”) (the “IFRS Accounting Standards”). Production volumes are presented on a before royalties basis. Refer to the Abbreviations and Definitions section for commonly used oil and gas terms.
| | | | | |
Cenovus Energy Inc. – Q2 2026 Management's Discussion and Analysis | 2 |
We are a Canadian-based integrated energy company headquartered in Calgary, Alberta. We are one of the largest Canadian-based crude oil and natural gas producers, with upstream operations in Canada and the Asia Pacific region, and one of the largest Canadian-based refiners and upgraders, with downstream operations in Canada and the United States (“U.S.”).
Our upstream operations include oil sands projects in northern Alberta; thermal and conventional crude oil, natural gas and natural gas liquids (“NGLs”) projects across Western Canada; crude oil production offshore Newfoundland and Labrador; and natural gas and NGLs production offshore China and Indonesia. Our downstream operations include upgrading and refining operations in Canada and the U.S.
Our operations involve activities across the full value chain to develop, produce, refine, transport and market crude oil, natural gas and refined petroleum products in North America and internationally. Our physically and economically integrated upstream and downstream operations help us mitigate the impact of volatility in light-heavy crude oil price differentials and contribute to our net earnings by capturing value from crude oil, natural gas and NGLs production through to the sale of finished products such as transportation fuels.
| | |
|
QUARTERLY RESULTS OVERVIEW |
In the second quarter of 2026, we safely delivered strong and reliable operating performance across our business, successfully completing turnarounds at our Oil Sands and Canadian Refining assets, while advancing our growth projects. Our financial results reflect the impact of a volatile commodity price environment through the second quarter.
•Ongoing commitment to safety. Strengthening our safety record and maintaining reliable operations throughout our portfolio continues to be our focus. We safely completed turnarounds at Foster Creek and the Lloydminster Upgrader (“Upgrader”) during the quarter. Safety continues to be our top value.
•Consistent upstream production. Total upstream production was 970.4 thousand BOE per day, compared with 972.1 thousand BOE per day in the first quarter of 2026. Production was supported by the successful optimization of base wells, solid performance from redevelopment programs across our Oil Sands assets and a strong ramp-up of production at Narrows Lake. Upstream production was impacted by an unplanned disruption at Foster Creek in late May 2026.
•Advanced Oil Sands growth. We completed the Foster Creek Amine Claus enhanced sulphur recovery project, achieving a safe and successful start-up. We continued to progress the facility expansion project and advance optimization activities at Christina Lake North. At Sunrise, the first new well pad in the east development area was brought online and production commenced. At Lloydminster Thermal, fabrication and earthworks began for our first commercial Diluent Solvent Aided Process (“DilSAP”) project.
•Progressed the West White Rose project. We commenced drilling operations and remain on track to deliver first oil late in the third quarter of 2026.
•Strong downstream operations. Average crude oil throughput (“throughput”) across our downstream assets was 451.5 thousand barrels per day, representing crude unit utilization of 95 percent. In Canadian Refining, we completed a turnaround at the Upgrader while our U.S. Refining assets continue to demonstrate reliable operations.
•Reported solid financial results. Adjusted Funds Flow was $5.0 billion, up from $3.4 billion in the first quarter of 2026, driven by higher commodity prices and strong operational performance across our assets. Cash from operating activities was $5.6 billion, compared with $2.2 billion in the first quarter of 2026.
•Debt reduction. We repaid the remaining $2.2 billion under our term loan facility, which was obtained to fund a portion of the acquisition of MEG Energy Corp. (“MEG”) through a plan of arrangement that closed on November 13, 2025 (the “MEG Acquisition”). As at June 30, 2026, our Net Debt was $5.4 billion, a decrease from $8.1 billion at March 31, 2026, and long-term debt declined to $8.6 billion, from $10.6 billion.
•Delivered significant returns to shareholders. We returned $1.4 billion to shareholders, including $1.0 billion through the purchase of 26.2 million common shares under our normal course issuer bid (“NCIB”) and $411 million through common share dividends. On July 28, 2026, the Board declared a third quarter dividend of $0.22 per common share.
| | | | | |
Cenovus Energy Inc. – Q2 2026 Management's Discussion and Analysis | 3 |
Summary of Quarterly Results
| | | | | | | | | | | | | | | | | | | | | | | | | | | | | | | | | | | | | | | | | | | | | | | | | | | | | | | | | | | | | | | |
| Six Months Ended June 30, | | 2026 | | 2025 | | | | 2024 |
| ($ millions, except where indicated) | 2026 | | 2025 | | Q2 | | Q1 | | | | Q4 | | Q3 | | Q2 | | Q1 | | | | Q4 | | Q3 |
| | | | | | | | | | | | | | | | | | | | | | | |
Upstream Production Volumes (1) (2) (MBOE/d) | 971.3 | | | 792.2 | | | 970.4 | | | 972.1 | | | | | 917.9 | | | 832.9 | | | 765.9 | | | 818.9 | | | | | 816.0 | | | 771.3 | |
| | | | | | | | | | | | | | | | | | | | | | | |
Downstream Total Processed Inputs (3) (4) (Mbbls/d) | 483.8 | | | 707.7 | | | 483.3 | | | 484.4 | | | | | 498.4 | | | 757.6 | | | 714.9 | | | 700.5 | | | | | 700.5 | | | 674.4 | |
| | | | | | | | | | | | | | | | | | | | | | | |
Crude Oil Unit Throughput (3) (Mbbls/d) | 455.0 | | | 665.7 | | | 451.5 | | | 458.5 | | | | | 465.5 | | | 710.7 | | | 665.8 | | | 665.4 | | | | | 666.7 | | | 642.9 | |
| | | | | | | | | | | | | | | | | | | | | | | |
Downstream Production Volumes (1) (3) (Mbbls/d) | 503.8 | | | 725.8 | | | 498.3 | | | 509.3 | | | | | 527.5 | | | 770.3 | | | 729.4 | | | 722.4 | | | | | 722.6 | | | 685.2 | |
| | | | | | | | | | | | | | | | | | | | | | | |
Revenues (5) | 29,783 | | | 25,618 | | | 17,427 | | | 12,356 | | | | | 10,883 | | | 13,195 | | | 12,319 | | | 13,299 | | | | | 12,813 | | | 13,819 | |
| | | | | | | | | | | | | | | | | | | | | | | |
Operating Margin (6) | 10,310 | | | 4,877 | | | 5,868 | | | 4,442 | | | | | 2,777 | | | 2,954 | | | 2,066 | | | 2,811 | | | | | 2,274 | | | 2,408 | |
Operating Margin – Upstream (7) | 8,623 | | | 5,185 | | | 4,915 | | | 3,708 | | | | | 2,628 | | | 2,590 | | | 2,137 | | | 3,048 | | | | | 2,670 | | | 2,731 | |
Operating Margin – Downstream (7) | 1,687 | | | (308) | | | 953 | | | 734 | | | | | 149 | | | 364 | | | (71) | | | (237) | | | | | (396) | | | (323) | |
| | | | | | | | | | | | | | | | | | | | | | | |
| Cash From (Used In) Operating Activities | 7,817 | | | 3,689 | | | 5,636 | | | 2,181 | | | | | 2,408 | | | 2,131 | | | 2,374 | | | 1,315 | | | | | 2,029 | | | 2,474 | |
| | | | | | | | | | | | | | | | | | | | | | | |
Adjusted Funds Flow (6) | 8,363 | | | 3,731 | | | 4,986 | | | 3,377 | | | | | 2,674 | | | 2,466 | | | 1,519 | | | 2,212 | | | | | 1,601 | | | 1,960 | |
Per Share – Basic (6) ($) | 4.48 | | | 2.05 | | | 2.68 | | | 1.80 | | | | | 1.47 | | | 1.38 | | | 0.84 | | | 1.21 | | | | | 0.88 | | | 1.06 | |
Per Share – Diluted (6) ($) | 4.47 | | | 2.04 | | | 2.66 | | | 1.80 | | | | | 1.46 | | | 1.38 | | | 0.84 | | | 1.21 | | | | | 0.87 | | | 1.05 | |
| | | | | | | | | | | | | | | | | | | | | | | |
| Capital Investment | 2,370 | | | 2,393 | | | 1,200 | | | 1,170 | | | | | 1,360 | | | 1,154 | | | 1,164 | | | 1,229 | | | | | 1,478 | | | 1,346 | |
| | | | | | | | | | | | | | | | | | | | | | | |
Free Funds Flow (6) | 5,993 | | | 1,338 | | | 3,786 | | | 2,207 | | | | | 1,314 | | | 1,312 | | | 355 | | | 983 | | | | | 123 | | | 614 | |
| | | | | | | | | | | | | | | | | | | | | | | |
Excess Free Funds Flow (6) | 4,980 | | | 67 | | | 3,257 | | | 1,723 | | | | | (1,597) | | | 745 | | | (306) | | | 373 | | | | | (416) | | | 146 | |
| | | | | | | | | | | | | | | | | | | | | | | |
| Net Earnings (Loss) | 4,440 | | | 1,710 | | | 2,870 | | | 1,570 | | | | | 934 | | | 1,286 | | | 851 | | | 859 | | | | | 146 | | | 820 | |
Per Share – Basic ($) | 2.38 | | | 0.94 | | | 1.54 | | | 0.84 | | | | | 0.51 | | | 0.72 | | | 0.47 | | | 0.47 | | | | | 0.08 | | | 0.44 | |
Per Share – Diluted ($) | 2.37 | | | 0.92 | | | 1.53 | | | 0.83 | | | | | 0.50 | | | 0.72 | | | 0.45 | | | 0.47 | | | | | 0.07 | | | 0.42 | |
| | | | | | | | | | | | | | | | | | | | | | | |
| Total Assets | 65,118 | | | 55,820 | | | 65,118 | | | 64,848 | | | | | 63,424 | | | 53,573 | | | 55,820 | | | 56,380 | | | | | 56,539 | | | 54,680 | |
| | | | | | | | | | | | | | | | | | | | | | | |
| | | | | | | | | | | | | | | | | | | | | | | |
| | | | | | | | | | | | | | | | | | | | | | | |
Long-Term Debt, Including Current Portion | 8,558 | | | 7,241 | | | 8,558 | | | 10,633 | | | | | 11,032 | | | 7,156 | | | 7,241 | | | 7,524 | | | | | 7,534 | | | 7,199 | |
| | | | | | | | | | | | | | | | | | | | | | | |
Net Debt | 5,388 | | | 4,934 | | | 5,388 | | | 8,058 | | | | | 8,292 | | | 5,255 | | | 4,934 | | | 5,079 | | | | | 4,614 | | | 4,196 | |
| | | | | | | | | | | | | | | | | | | | | | | |
| Cash Returns to Common and Preferred Shareholders | 2,465 | | | 1,414 | | | 1,430 | | | 1,035 | | | | | 1,094 | | | 1,274 | | | 819 | | | 595 | | | | | 706 | | | 1,070 | |
| Common Shares – Base Dividends | 788 | | | 691 | | | 411 | | | 377 | | | | | 376 | | | 356 | | | 364 | | | 327 | | | | | 330 | | | 329 | |
Base Dividends Per Common Share ($) | 0.42 | | | 0.38 | | | 0.22 | | | 0.20 | | | | | 0.20 | | | 0.20 | | | 0.20 | | | 0.18 | | | | | 0.18 | | | 0.18 | |
| | | | | | | | | | | | | | | | | | | | | | | |
| | | | | | | | | | | | | | | | | | | | | | | |
Purchase of Common Shares Under NCIB | 1,375 | | | 363 | | | 1,019 | | | 356 | | | | | 714 | | | 918 | | | 301 | | | 62 | | | | | 108 | | | 732 | |
| | | | | | | | | | | | | | | | | | | | | | | |
| Dividends Paid on Preferred Shares | 2 | | | 10 | | | — | | | 2 | | | | | 4 | | | — | | | 4 | | | 6 | | | | | 18 | | | 9 | |
| Preferred Share Redemptions | 300 | | | 350 | | | — | | | 300 | | | | | — | | | — | | | 150 | | | 200 | | | | | 250 | | | — | |
(1)Refer to the Operating and Financial Results section of this MD&A for a summary of total production by product type.
(2)Includes results of the MEG Acquisition from November 13, 2025.
(3)Represents Cenovus’s net interest in refining operations. On September 30, 2025, Cenovus divested its entire 50 percent interest in the jointly-owned Wood River and Borger refineries held through WRB Refining LP (“WRB”) (the “WRB Divestiture”). Following the WRB Divestiture, all refining operations are wholly-owned.
(4)Total processed inputs include crude oil and other feedstocks. Blending is excluded.
(5)2024 comparative periods reflect certain revisions. See the Prior Period Revisions section in our annual MD&A for the year ended December 31, 2024, for further details.
(6)Non-GAAP financial measure or contains a non-GAAP financial measure. See the Specified Financial Measures Advisory of this MD&A.
(7)Specified financial measure. See the Specified Financial Measures Advisory of this MD&A.
| | | | | |
Cenovus Energy Inc. – Q2 2026 Management's Discussion and Analysis | 4 |
| | |
|
OPERATING AND FINANCIAL RESULTS |
Selected Operating Results — Upstream
| | | | | | | | | | | | | | | | | | | | | | | | | | | | | | | | | | | | | | | |
| Three Months Ended June 30, | | Six Months Ended June 30, | | | | |
| | | Percent Change | | | | | | Percent Change | | | | | | |
| 2026 | | | 2025 | | 2026 | | | 2025 | | | |
Production Volumes by Segment (1) (MBOE/d) | | | | | | | | | | | | | | | |
Oil Sands (2) | 786.4 | | 36 | | | 579.8 | | 780.7 | | 29 | | | 602.9 | | | | |
Conventional (3) | 118.2 | | (1) | | | 119.8 | | 119.9 | | (2) | | | 121.8 | | | | |
Offshore (3) | 65.8 | | (1) | | | 66.3 | | 70.7 | | 5 | | | 67.5 | | | | |
Total Production Volumes | 970.4 | | 27 | | | 765.9 | | 971.3 | | 23 | | | 792.2 | | | | |
| | | | | | | | | | | | | | | |
Production Volumes by Product (1) | | | | | | | | | | | | | | | |
Bitumen (Mbbls/d) | 755.4 | | 37 | | | 552.1 | | 749.5 | | 30 | | | 577.1 | | | | |
Heavy Crude Oil (Mbbls/d) | 28.4 | | 14 | | | 25.0 | | 28.7 | | 23 | | | 23.4 | | | | |
Light Crude Oil (Mbbls/d) | 21.3 | | 25 | | | 17.0 | | 22.9 | | 36 | | | 16.9 | | | | |
NGLs (Mbbls/d) | 30.4 | | 2 | | | 29.9 | | 31.7 | | 6 | | | 29.9 | | | | |
Conventional Natural Gas (MMcf/d) | 809.8 | | (5) | | | 851.4 | | 830.8 | | (4) | | | 869.5 | | | | |
Total Production Volumes (MBOE/d) | 970.4 | | 27 | | | 765.9 | | 971.3 | | 23 | | | 792.2 | | | | |
| | | | | | | | | | | | | | | |
| | | | | | | | | | | | | | | |
| | | | | | | | | | | | | | | |
| | | | | | | | | | | | | | | |
| | | | | | | | | | | | | | | |
| | | | | | | | | | | | | | | |
| | | | | | | | | | | | | | | |
| | | | | | | | | | | | | | | |
| | | | | | | | | | | | | | | |
| | | | | | | | | | | | | | | |
(1)Refer to the Oil Sands, Conventional and Offshore reportable segments section of this MD&A for a summary of production by product type.
(2)Results for the three and six months ended June 30, 2026, include the MEG Acquisition, which closed on November 13, 2025.
(3)Reported production volumes in the Conventional and Offshore segments include Cenovus’s 30 percent equity interest in the Duvernay Energy Corporation (“Duvernay”) joint venture and 40 percent equity interest in the Husky-CNOOC Madura Limited (“HCML”) joint venture, respectively. Our equity interests in Duvernay and HCML are accounted for using the equity method in the interim Consolidated Financial Statements.
Total upstream production increased in the three and six months ended June 30, 2026, compared with the same periods in 2025, primarily due to:
•Additional production from the MEG Acquisition, solid performance from the redevelopment programs at Christina Lake and new sustaining well pads following the completion of the Narrows Lake tie-back to Christina Lake in the third quarter of 2025.
•Incremental production from the completion of the Foster Creek optimization project in the fourth quarter of 2025, and the successful ramp-up of new well pads and base well optimization activities.
•Positive results from redevelopment and sustaining programs at Sunrise, including strong production following the ramp-up of the first well pad in the east development area.
The increase in upstream production in the first half of 2026 was further supported by strong production from our Atlantic operations following the completion of the SeaRose asset life extension (“ALE”) project in the first quarter of 2025.
Selected Operating Results — Downstream
| | | | | | | | | | | | | | | | | | | | | | | | | | | | | | | | | | | |
| Three Months Ended June 30, | | Six Months Ended June 30, |
| | | Percent Change | | | | | | Percent Change | | |
| 2026 | | | 2025 | | 2026 | | | 2025 |
Crude Oil Unit Throughput by Segment (Mbbls/d) | | | | | | | | | | | |
Canadian Refining | 101.7 | | (10) | | | 112.4 | | 108.5 | | (3) | | | 112.2 |
U.S. Refining | 349.8 | | (37) | | | 553.4 | | 346.5 | | (37) | | | 553.5 |
Total Crude Oil Unit Throughput | 451.5 | | (32) | | | 665.8 | | 455.0 | | (32) | | | 665.7 | |
| | | | | | | | | | | |
Production Volumes by Product (1) (Mbbls/d) | | | | | | | | | | | |
Gasoline | 185.5 | | (33) | | | 277.1 | | 185.3 | | (34) | | | 280.9 |
Distillates (2) | 139.4 | | (37) | | | 221.9 | | 138.9 | | (38) | | | 223.1 |
Synthetic Crude Oil | 47.3 | | (14) | | | 55.3 | | 49.6 | | (8) | | | 53.8 |
Asphalt | 29.8 | | (27) | | | 41.0 | | 32.2 | | (23) | | | 41.6 |
Ethanol | 5.0 | | — | | | 5.0 | | 5.3 | | 15 | | | 4.6 |
Other | 91.3 | | (29) | | | 129.1 | | 92.5 | | (24) | | | 121.8 |
Total Production Volumes | 498.3 | | (32) | | | 729.4 | | 503.8 | | (31) | | | 725.8 |
| | | | | | | | | | | |
| | | | | | | | | | | |
| | | | | | | | | | | |
| | | | | | | | | | | |
| | | | | | | | | | | |
| | | | | | | | | | | |
| | | | | | | | | | | |
| | | | | | | | | | | |
(1)Refer to the Canadian Refining and U.S. Refining reportable segments section of this MD&A for a summary of production by product type.
(2)Includes diesel and jet fuel.
| | | | | |
Cenovus Energy Inc. – Q2 2026 Management's Discussion and Analysis | 5 |
In the three and six months ended June 30, 2026, total downstream throughput and refined product production decreased compared with the same periods in 2025, primarily due to the WRB Divestiture completed on September 30, 2025, and the turnaround completed at the Upgrader in the second quarter of 2026. The decreases were partially offset by reliable operations at our Canadian and U.S. Refining assets, and no turnarounds in the U.S. Refining segment in the first half of 2026.
Selected Consolidated Financial Results
Revenues
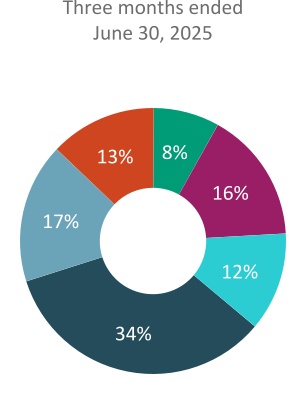
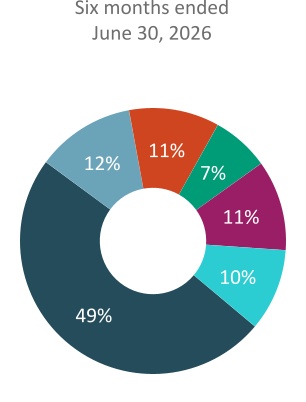
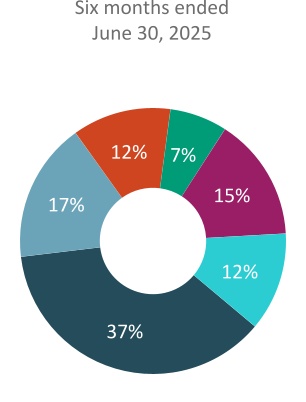
Revenues increased 41 percent to $17.4 billion and 16 percent to $29.8 billion in the three and six months ended June 30, 2026, respectively, compared with the same periods in 2025. The increases were primarily due to higher benchmark crude oil and refined product pricing, and higher sales volumes from our Oil Sands segment, partially offset by lower sales volumes in our U.S. Refining segment.
Operating Margin
Operating Margin is a non-GAAP financial measure and is used to provide a consistent measure of the cash-generating performance of our assets for comparability of our underlying financial performance between periods.
| | | | | | | | | | | | | | | | | | | | | | | | | |
| Three Months Ended June 30, | | Six Months Ended June 30, | | |
| ($ millions) | 2026 | | 2025 | | 2026 | | 2025 | | |
Gross Sales | | | | | | | | | |
| External Sales | 19,088 | | | 12,940 | | | 32,427 | | | 27,145 | | | |
Intersegment Sales | 3,300 | | | 2,197 | | | 5,958 | | | 4,949 | | | |
| 22,388 | | | 15,137 | | | 38,385 | | | 32,094 | | | |
| Royalties | (1,661) | | | (621) | | | (2,644) | | | (1,527) | | | |
| Revenues | 20,727 | | | 14,516 | | | 35,741 | | | 30,567 | | | |
| Expenses | | | | | | | | | |
| Purchased Product | 8,737 | | | 7,989 | | | 14,359 | | | 16,238 | | | |
| Transportation and Blending | 4,582 | | | 2,621 | | | 7,957 | | | 5,868 | | | |
| Operating Expenses | 1,476 | | | 1,843 | | | 3,049 | | | 3,590 | | | |
Realized (Gain) Loss on Risk Management | 64 | | | (3) | | | 66 | | | (6) | | | |
Operating Margin | 5,868 | | | 2,066 | | | 10,310 | | | 4,877 | | | |
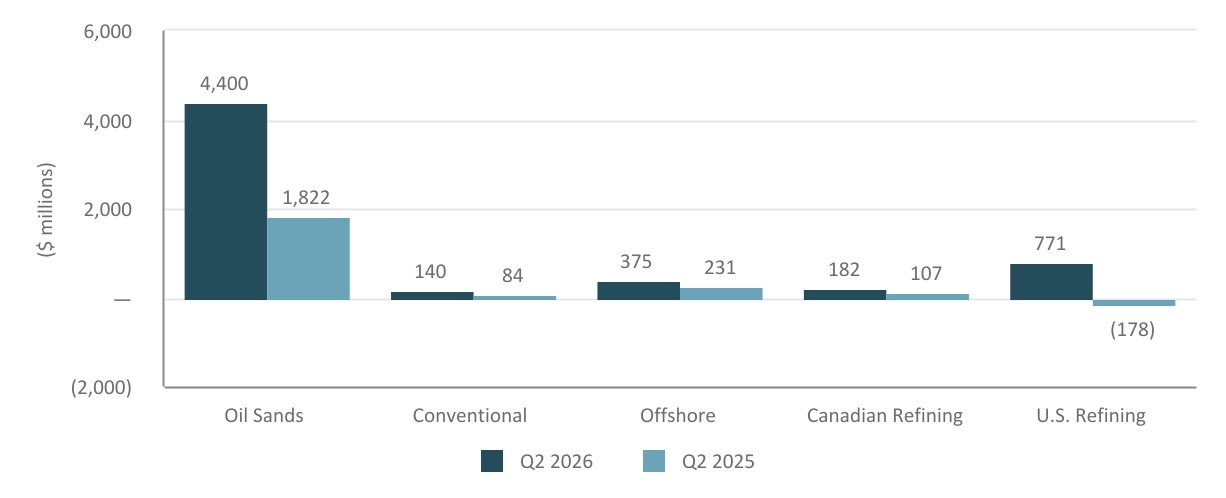
Operating Margin by Segment
Three Months Ended June 30, 2026 and 2025
| | | | | |
Cenovus Energy Inc. – Q2 2026 Management's Discussion and Analysis | 6 |
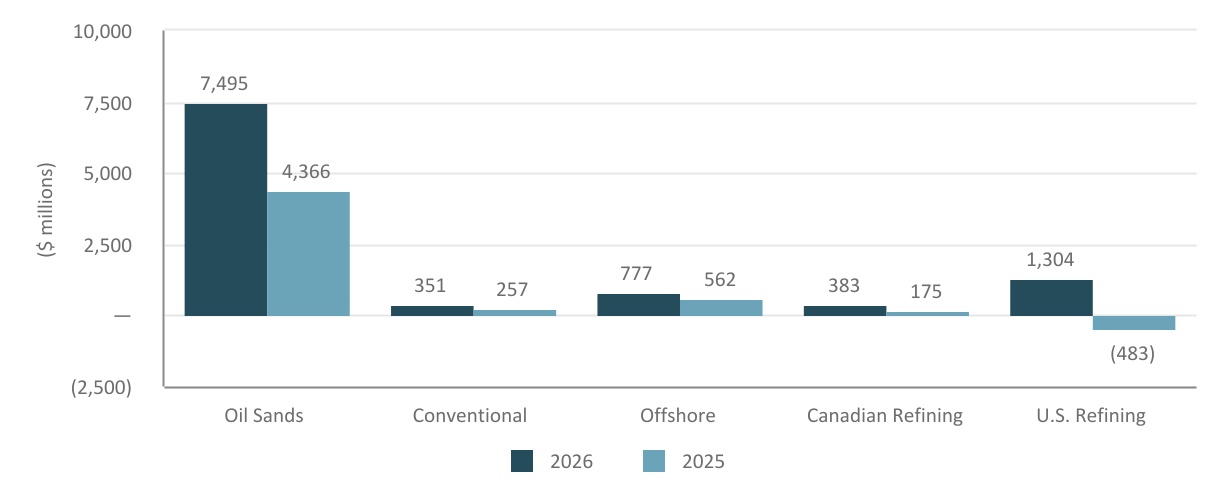
Six Months Ended June 30, 2026 and 2025
Operating Margin increased in the three and six months ended June 30, 2026, compared with 2025, primarily due to:
•Overall increases to benchmark crude oil prices, positively impacting our upstream results.
•Increased sales volumes from our Oil Sands and Atlantic assets.
•Higher Gross Margin in our downstream segments due to higher refined product pricing and reliable operations.
Cash From (Used in) Operating Activities and Adjusted Funds Flow
Adjusted Funds Flow is a non-GAAP financial measure commonly used in the oil and gas industry to assist in measuring a company’s ability to finance its capital programs and meet its financial obligations.
| | | | | | | | | | | | | | | | | | | | | | | | | |
| Three Months Ended June 30, | | Six Months Ended June 30, | |
| ($ millions) | 2026 | | 2025 | | 2026 | | 2025 | | |
| Cash From (Used in) Operating Activities | 5,636 | | | 2,374 | | | 7,817 | | | 3,689 | | | |
| (Add) Deduct: | | | | | | | | | |
Settlement of Decommissioning Liabilities | (39) | | | (68) | | | (92) | | | (104) | | | |
| Net Change in Non-Cash Working Capital | 689 | | | 923 | | | (454) | | | 62 | | | |
Adjusted Funds Flow | 4,986 | | | 1,519 | | | 8,363 | | | 3,731 | | | |
Adjusted Funds Flow and cash from operating activities were higher in the three and six months ended June 30, 2026, compared with the same periods in 2025, primarily due to increased Operating Margin, partially offset by higher current tax expense.
For the three months ended June 30, 2026, changes in non-cash working capital further increased cash from operating activities by $689 million, compared with $923 million in second quarter of 2025. For the six months ended June 30, 2026, changes in non-cash working capital decreased cash from operating activities by $454 million. For further details, see the Liquidity and Capital Resources section of this MD&A.
Net Earnings (Loss)
Net earnings for the three and six months ended June 30, 2026, were $2.9 billion and $4.4 billion, respectively, compared with $851 million and $1.7 billion, respectively, in 2025. The increase in both periods is primarily due to higher Operating Margin, partially offset by higher income tax expense, DD&A expense and foreign exchange losses in 2026, compared with gains in 2025.
Net Debt
| | | | | | | | | | | | | | | | | |
As at | June 30, 2026 | | | | December 31, 2025 | | | | |
| | | | | | | | | |
| Current Portion of Long-Term Debt | — | | | | | — | | | | | |
| Long-Term Portion of Long-Term Debt | 8,558 | | | | | 11,032 | | | | | |
Total Debt | 8,558 | | | | | 11,032 | | | | | |
| Less: Cash and Cash Equivalents | (3,170) | | | | | (2,740) | | | | | |
Net Debt | 5,388 | | | | | 8,292 | | | | | |
| | | | | |
Cenovus Energy Inc. – Q2 2026 Management's Discussion and Analysis | 7 |
Total Debt decreased by $2.5 billion from December 31, 2025, primarily due to the repayment of $2.7 billion under our term loan facility in the first half of 2026, partially offset by unrealized foreign exchange losses on U.S. dollar denominated long-term debt due to the weakening of the Canadian dollar.
Net Debt decreased by $2.9 billion from December 31, 2025, due to cash from operating activities of $7.8 billion, partially offset by returns to shareholders of $2.5 billion and capital investment of $2.4 billion. For further details, see the Liquidity and Capital Resources section of this MD&A.
Capital Investment (1)
| | | | | | | | | | | | | | | | | | | | | | | | | | | |
| Three Months Ended June 30, | | | | Six Months Ended June 30, | | |
| ($ millions) | 2026 | 2025 | | | | 2026 | | 2025 | | |
| Upstream | | | | | | | | | | | |
| Oil Sands | 821 | | | 644 | | | | | 1,672 | | | 1,407 | | | |
| Conventional | 108 | | | 73 | | | | | 201 | | | 195 | | | |
| Offshore | 134 | | | 270 | | | | | 276 | | | 511 | | | |
| Total Upstream | 1,063 | | | 987 | | | | | 2,149 | | | 2,113 | | | |
| Downstream | | | | | | | | | | | |
| Canadian Refining | 52 | | | 28 | | | | | 76 | | | 50 | | | |
| U.S. Refining | 82 | | | 146 | | | | | 140 | | | 223 | | | |
| Total Downstream | 134 | | | 174 | | | | | 216 | | | 273 | | | |
| Corporate and Eliminations | 3 | | | 3 | | | | | 5 | | | 7 | | | |
| Total Capital Investment | 1,200 | | | 1,164 | | | | | 2,370 | | | 2,393 | | | |
(1)Includes expenditures on property, plant and equipment (“PP&E”), exploration and evaluation (“E&E”) assets, and capitalized interest. Excludes capital expenditures related to joint ventures accounted for using the equity method in the interim Consolidated Financial Statements.
Capital investment in the first half of 2026 was primarily related to:
•Sustaining activities in our Oil Sands segment.
•Sustaining activities in our refining segments and the turnaround at the Upgrader.
•Drilling, completion, tie-in and infrastructure projects in the Conventional segment.
•The support and progression of our growth initiatives.
Through the end of the second quarter of 2026, we advanced growth initiatives across our business:
•At Christina Lake, we continued to progress the facility expansion project and advance optimization activities.
•At Sunrise, the first new well pad in the east development area was brought online and production commenced.
•We commenced fabrication and earthworks for our first commercial DilSAP project at Lloydminster Thermal.
•We achieved completion and full start-up of the Foster Creek enhanced sulphur recovery project.
In the second quarter of 2026, we commenced drilling operations at West White Rose. We remain on track to deliver first oil late in the third quarter of 2026.
Drilling Activity
| | | | | | | | | | | | | | | | | | | | | | | |
| Net Stratigraphic Test Wells and Observation Wells | | Net Production Wells (1) |
| Six Months Ended June 30, | 2026 | | 2025 | | 2026 | | 2025 |
Foster Creek | 78 | | | 73 | | | 14 | | | 25 | |
Christina Lake (2) | 111 | | | 65 | | | 38 | | | 13 | |
| Sunrise | 18 | | | 21 | | | 4 | | | 2 | |
Lloydminster Thermal | 2 | | | — | | | 12 | | | 12 | |
| Lloydminster Conventional Heavy Oil | — | | | — | | | 7 | | | 15 | |
| | | | | | | |
| | | | | | | |
| 209 | | | 159 | | | 75 | | | 67 | |
(1)Steam-assisted gravity drainage (“SAGD”) well pairs in the Oil Sands segment are counted as a single producing well.
(2)Results for the six months ended June 30, 2026, include the MEG Acquisition, which closed on November 13, 2025.
Stratigraphic test wells were drilled to help identify future well pad locations and to further evaluate our assets. Observation wells were drilled to gather information and monitor reservoir conditions.
| | | | | | | | | | | | | | | | | | | | | | | | | | | | | | | | | | | |
| Six Months Ended June 30, 2026 | | Six Months Ended June 30, 2025 |
| (net wells) | Drilled | | Completed | | Tied-in | | Drilled | | Completed | | Tied-in |
Conventional (1) | 21 | | | 23 | | | 23 | | | 18 | | | 24 | | | 21 | |
(1)Includes values attributable to Cenovus’s 30 percent equity interest in the Duvernay joint venture.
In the Offshore segment, no wells were drilled or completed in the first half of 2026 or 2025.
| | | | | |
Cenovus Energy Inc. – Q2 2026 Management's Discussion and Analysis | 8 |
| | |
|
COMMODITY PRICES UNDERLYING OUR FINANCIAL RESULTS |
The following table shows selected market benchmark prices and average exchange rates to assist in understanding our financial results. For a full discussion of our commodity prices and related key performance drivers, refer to our 2025 annual MD&A.
Selected Benchmark Prices and Exchange Rates (1)
| | | | | | | | | | | | | | | | | | | | | | | | | | | | | | | | | | | | | | | | | |
| Six Months Ended June 30, | | | | | | | | | | | | |
| (Average US$/bbl, unless otherwise indicated) | 2026 | | Percent Change | | 2025 | | Q2 2026 | | Q1 2026 | | Q2 2025 | | | | | | |
Dated Brent | 92.57 | | | 29 | | | 71.74 | | | 104.52 | | | 80.61 | | | 67.82 | | | | | | | |
| WTI | 82.36 | | | 22 | | | 67.58 | | | 92.79 | | | 71.93 | | | 63.74 | | | | | | | |
Differential Dated Brent – WTI | 10.21 | | | 145 | | | 4.16 | | | 11.73 | | | 8.68 | | | 4.08 | | | | | | | |
| WCS at Hardisty | 67.94 | | | 21 | | | 56.11 | | | 78.12 | | | 57.76 | | | 53.47 | | | | | | | |
Differential WTI – WCS at Hardisty | 14.42 | | | 26 | | | 11.47 | | | 14.67 | | | 14.17 | | | 10.27 | | | | | | | |
WCS at Hardisty (C$/bbl) | 93.60 | | | 18 | | | 79.13 | | | 107.98 | | | 79.21 | | | 73.96 | | | | | | | |
| WCS at Nederland | 76.29 | | | 19 | | | 64.37 | | | 87.36 | | | 65.21 | | | 61.00 | | | | | | | |
Differential WTI – WCS at Nederland | 6.07 | | | 89 | | | 3.21 | | | 5.43 | | | 6.72 | | | 2.74 | | | | | | | |
| Condensate (C5 at Edmonton) | 83.43 | | | 25 | | | 66.67 | | | 95.47 | | | 71.40 | | | 63.46 | | | | | | | |
Differential Condensate – WTI Premium/(Discount) | 1.07 | | | (218) | | | (0.91) | | | 2.68 | | | (0.53) | | | (0.28) | | | | | | | |
Differential Condensate – WCS at Hardisty Premium/(Discount) | 15.49 | | | 47 | | | 10.56 | | | 17.35 | | | 13.64 | | | 9.99 | | | | | | | |
Condensate (C$/bbl) | 114.95 | | | 22 | | | 94.03 | | | 131.99 | | | 97.91 | | | 87.77 | | | | | | | |
| Synthetic at Edmonton | 86.33 | | | 29 | | | 66.89 | | | 101.12 | | | 71.54 | | | 64.72 | | | | | | | |
Differential Synthetic – WTI Premium/(Discount) | 3.97 | | | (675) | | | (0.69) | | | 8.33 | | | (0.39) | | | 0.98 | | | | | | | |
Synthetic at Edmonton (C$/bbl) | 118.95 | | | 26 | | | 94.32 | | | 139.80 | | | 98.10 | | | 89.52 | | | | | | | |
| Refined Product Prices | | | | | | | | | | | | | | | | | |
| Chicago Regular Unleaded Gasoline (“RUL”) | 106.42 | | | 27 | | | 83.85 | | | 131.60 | | | 81.24 | | | 84.61 | | | | | | | |
| Chicago Ultra-low Sulphur Diesel (“ULSD”) | 130.36 | | | 48 | | | 88.01 | | | 154.77 | | | 105.95 | | | 86.91 | | | | | | | |
Refining Benchmarks | | | | | | | | | | | | | | | | | |
Chicago 3-2-1 Crack Spread (2) | 32.04 | | | 81 | | | 17.66 | | | 46.54 | | | 17.55 | | | 21.64 | | | | | | | |
Group 3 3-2-1 Crack Spread (2) | 29.31 | | | 48 | | | 19.77 | | | 41.45 | | | 17.16 | | | 23.07 | | | | | | | |
| Renewable Identification Numbers (“RINs”) | 11.25 | | | 107 | | | 5.44 | | | 13.78 | | | 8.71 | | | 6.12 | | | | | | | |
Upgrading Differential (3) (C$/bbl) | 25.16 | | | 67 | | | 15.08 | | | 31.76 | | | 18.55 | | | 15.46 | | | | | | | |
| Natural Gas Prices | | | | | | | | | | | | | | | | | |
AECO (4) (C$/Mcf) | 1.82 | | | (6) | | | 1.93 | | | 1.63 | | | 2.01 | | | 1.69 | | | | | | | |
NYMEX (5) (US$/Mcf) | 3.97 | | | 12 | | | 3.55 | | | 2.90 | | | 5.04 | | | 3.44 | | | | | | | |
Differential AECO – NYMEX (US$/Mcf) | (2.65) | | | 22 | | | (2.18) | | | (1.72) | | | (3.58) | | | (2.22) | | | | | | | |
| Foreign Exchange Rates | | | | | | | | | | | | | | | | | |
US$ per C$1 – Average | 0.726 | | | 2 | | | 0.710 | | | 0.723 | | | 0.729 | | | 0.723 | | | | | | | |
US$ per C$1 – End of Period | 0.704 | | | (4) | | | 0.733 | | | 0.704 | | | 0.717 | | | 0.733 | | | | | | | |
Chinese Yuan (“RMB”) per C$1 – Average | 4.981 | | | (3) | | | 5.148 | | | 4.916 | | | 5.048 | | | 5.226 | | | | | | | |
(1)These benchmark prices are not our Realized Sales Prices and represent approximate values. For our Realized Sales Prices refer to the Netback tables in the upstream reportable segments section of this MD&A.
(2)The average 3-2-1 crack spread is an indicator of the adjusted refining margin and is valued on a last-in, first-out accounting basis.
(3)The upgrading differential is the difference between synthetic crude oil at Edmonton and Lloydminster Blend crude oil at Hardisty. The upgrading differential does not precisely mirror the configuration and the product output of our Canadian Refining assets; however, it is used as a general market indicator.
(4)Alberta Energy Company (“AECO”) 5A natural gas daily index.
(5)New York Mercantile Exchange (“NYMEX”) natural gas monthly index.
| | | | | |
Cenovus Energy Inc. – Q2 2026 Management's Discussion and Analysis | 9 |
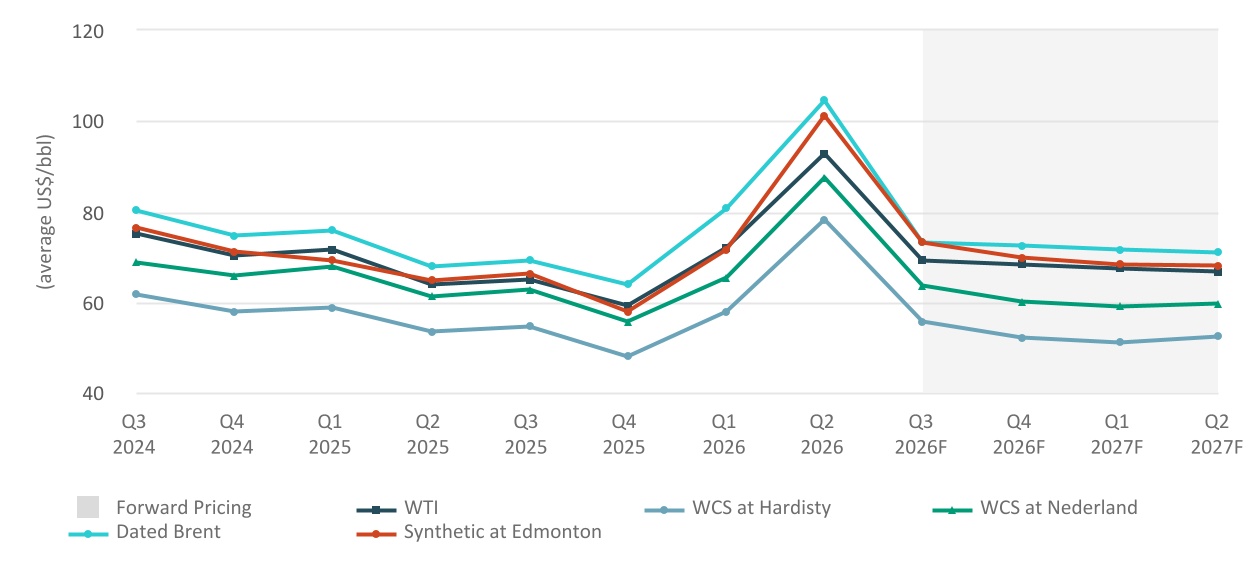
Crude Oil and Condensate Benchmarks
In the six months ended June 30, 2026, global crude oil benchmark prices, Brent and WTI, increased compared with the same periods in 2025. Global crude oil prices entered 2026 at lower levels than the previous year, as global supply exceeded demand, leading to a continued building of inventory globally. However, prices spiked following the commencement of the U.S.-Iran conflict as markets rapidly priced in a higher risk of supply disruption. The effective closure of the Strait of Hormuz, a narrow maritime choke point crucial to large volumes of global crude and refined products trade, stranded volumes resulting in a significant shortfall in global supply and prolonged higher prices. The Dated Brent-WTI spread widened considerably following the conflict due to a combination of surging freight rates, as well as international buyers scrambling for physical supply. Brent prices are tied to our East Coast Canada production as well as select Asia Pacific gas sales agreements.
The WTI-WCS differential at both Hardisty and Nederland widened in the six months ended June 30, 2026, compared with 2025. Heavy crude weakened relative to WTI due to high global supply of heavy grades as OPEC+ continued to unwind production cuts, with further downward pressure due to higher Canadian supply, incremental Venezuelan heavy barrels re-entering the export market and drawing of U.S. Strategic Petroleum Reserves, which are largely medium-sour grades.
In Canada, we upgrade heavy crude oil and bitumen into a sweet synthetic crude oil, the Husky Synthetic Blend (“HSB”), at the Upgrader. The price realized for HSB is primarily driven by the price of WTI, and by the supply and demand of sweet synthetic crude oil from Western Canada, which influences the WTI-Synthetic differential.
In the six months ended June 30, 2026, synthetic crude oil at Edmonton strengthened relative to WTI compared with the same period in 2025. The strength in pricing was driven in part by strong diesel pricing, as synthetic crude yields a higher proportion of diesel than other crude grades. Upgrader turnarounds also supported synthetic pricing.
In the six months ended June 30, 2026, the average Edmonton condensate benchmark traded at a premium to WTI, compared with a discount in 2025, due to tight Canadian supply, strong synthetic pricing, robust demand for heavy crude blending and a shortage of naphtha globally.
Crude Oil Benchmark Prices (1)
(1)Forward pricing as at June 30, 2026.
Refining Benchmarks
RUL and ULSD benchmark prices are representative of inland refined product prices and are used to derive the Chicago 3-2-1 market crack spread. The 3-2-1 market crack spread is an indicator of the adjusted refining margin generated by converting three barrels of crude oil into two barrels of regular unleaded gasoline and one barrel of ultra-low sulphur diesel, using current-month WTI-based crude oil feedstock prices and valued on a last-in, first-out basis.
In the six months ended June 30, 2026, refined product crack spreads in Chicago and Group 3 increased compared with the same period in 2025, primarily due to a sharp spike in gasoline and diesel pricing following the U.S.-Iran conflict, which has limited global supply of refined products and crude. Pricing was further supported by low refined product inventories and unplanned refinery outages in the U.S. Midwest. The average cost of RINs was higher in the six months ended June 30, 2026, compared with 2025, due to increasing volumetric requirements raising demand, and weak U.S. production and imports of renewable diesel and biodiesel causing a shortfall in RINs generation.
| | | | | |
Cenovus Energy Inc. – Q2 2026 Management's Discussion and Analysis | 10 |
North American refining crack spreads are expressed on a WTI basis, while refined products are generally set by global prices. The strength of refining market crack spreads in the U.S. Midwest and Midcontinent generally reflects the differential between Brent and WTI benchmark prices. In the second quarter of 2026, light crudes sourced for U.S. refiners such as Bakken and Midland grades traded at high premiums to the WTI month average due to trading complexities related to backwardation in the forward curve structure. As a result, the cost of certain refinery feedstocks negatively impacted margin relative to the benchmark market crack spreads.
The benchmark market crack spreads do not precisely mirror the configuration and product output of our refineries, or the location we sell product; however, they are used as a general market indicator. Our adjusted refining margin is affected by various other factors such as the quality and purchase location of crude oil feedstock, refinery configuration and product output. Refer to the Specified Financial Measures Advisory of this MD&A for further details.
Refined Product Benchmarks (1)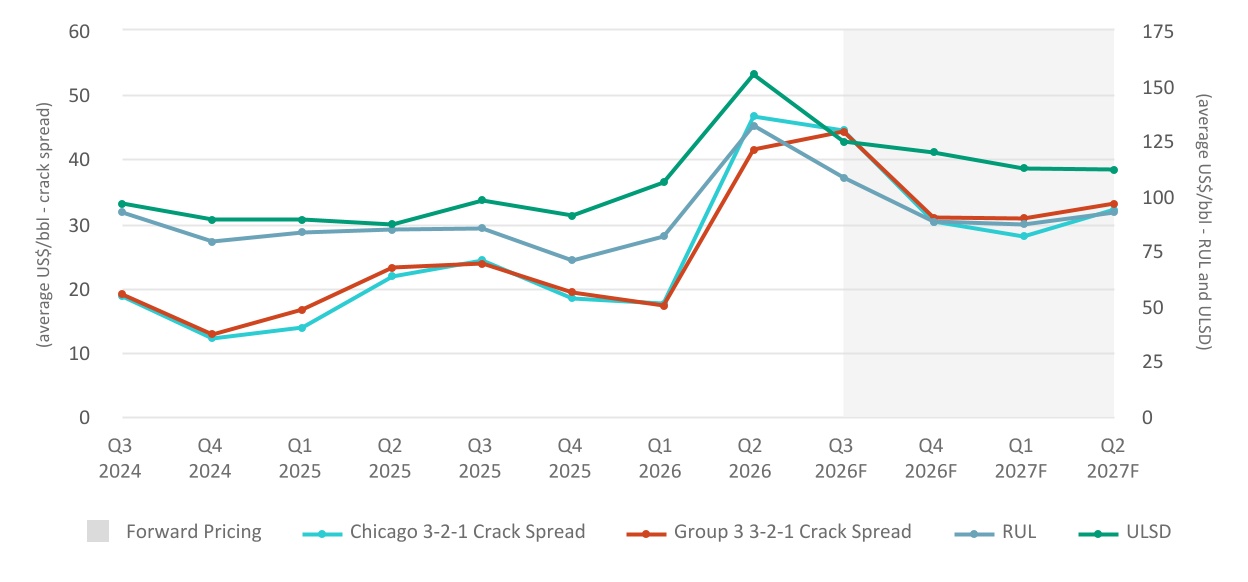
(1)Forward pricing as at June 30, 2026.
Natural Gas Benchmarks
In the six months ended June 30, 2026, AECO prices decreased while NYMEX prices increased compared with the same period in 2025. The increase in NYMEX prices was supported by strong liquified natural gas (“LNG”) demand and winter-driven heating demand, while the decrease in AECO prices was impacted by limited Western Canadian takeaway capacity, causing the AECO discount to NYMEX to widen. In the second quarter of 2026, NYMEX prices decreased due to lower demand resulting from unusually cool temperatures throughout the quarter. The price received for our Asia Pacific natural gas production is largely based on long-term contracts.
Foreign Exchange and Interest Rate Benchmarks
Our revenues are subject to foreign exchange exposure as the sales prices of our crude oil, NGLs, natural gas and refined products are determined by reference to U.S. dollar benchmark prices. In the six months ended June 30, 2026, on average, the Canadian dollar strengthened relative to the U.S. dollar compared with the six months ended June 30, 2025, negatively impacting our reported revenues and positively impacting our U.S. Refining operating expenses.
A portion of our long-term sales contracts in the Asia Pacific region are priced in RMB. An increase in the value of the Canadian dollar relative to the RMB will decrease the revenues received in Canadian dollars from the sale of natural gas commodities in the region. In the six months ended June 30, 2026, on average, the Canadian dollar decreased slightly relative to the RMB, compared with June 30, 2025.
Our interest income, floating rate borrowing costs, reported decommissioning liabilities and fair value measurements are impacted by fluctuations in interest rates. A change in interest rates could change our net finance costs, affect how certain liabilities are measured, and impact our cash flow and financial results.
As at June 30, 2026, the Bank of Canada’s policy interest rate was 2.25 percent. On July 15, 2026, the Bank of Canada held the policy interest rate at 2.25 percent.
| | | | | |
Cenovus Energy Inc. – Q2 2026 Management's Discussion and Analysis | 11 |
Commodity Price Outlook
Global crude oil prices entered 2026 lower than the second quarter of 2025, as supply growth outpaced demand following the unwinding of OPEC+ voluntary cuts, with risks that oversupply was likely to continue throughout the year and weigh on prices. The U.S.-Iran conflict resulted in an immediate spike in global prices in March 2026 and altered the short-to-medium-term outlook for all aspects of the energy industry. The effective closure of the Strait of Hormuz introduced high volatility across crude oil, refined products and natural gas prices, and the significant shortfall in global supply has resulted in prolonged higher prices relative to pre-war levels. The Strait of Hormuz reopened briefly following the U.S.-Iran announcement of a Memorandum of Understanding in mid-June, designed to cease hostilities and create a framework for negotiating a broader long-term agreement. On July 8, 2026, the ceasefire broke down, reintroducing high levels of risk to the future flows through the Strait of Hormuz.
Globally, a wide range of countries have withdrawn strategic petroleum reserves to mitigate the impact of the Strait of Hormuz closure, and some countries have implemented fuel rationing measures to reduce refined product demand amid shortages. Price direction remains highly uncertain and dependent on any deescalation or intensification of the conflict, damage to infrastructure, inventory constraints, production shut-ins, refinery curtailment in the Middle East and other areas dependent on supply from that region and the impact to the economy among other unpredictable variables. OPEC+ policy continues to remain crucial to global oil supply and demand balances, and prices amid this conflict. Over the long-term, the United Arab Emirates decision to leave OPEC may result in increased crude oil supply, but in the short-to-medium term, crude oil supply is expected to continue to be impacted by the status of the Strait of Hormuz and physical constraints facing Middle Eastern countries restarting production. Policy and sanction uncertainty related to Venezuelan crude exports also continues to influence global heavy crude oil supply and trade flows. The global trade war and ongoing geopolitical tensions may reduce global GDP growth and oil demand, while increasing recessionary risks and potentially having additional knock-on effects to the economy.
In addition to the above, our commodity pricing outlook for the next 12 months is influenced by the following:
•OPEC+ policy and the pace at which Middle East producers are able to bring back curtailed supply.
•In the near-term, there is a higher risk of a tariff-induced global economic slowdown that could slow oil demand.
•We expect the WTI-WCS at Hardisty differential will remain largely tied to global supply factors and heavy crude oil processing capacity, as long as supply does not exceed Canadian crude oil export capacity.
•Refined product prices and market crack spreads are likely to continue to fluctuate, adjusting for seasonal trends and refinery utilization in North America and globally.
•RINs prices will continue to be impacted by future policy decisions including small refinery exemption waivers, reallocation of exempted volumes and policies around imported biofuel RINs generation.
•Light crudes sourced for U.S. refiners, such as Bakken and Midland grades, have normalized relative to the WTI calendar month average heading into the third quarter of 2026. These differentials may continue to fluctuate with the volatility in the forward curve structure.
•Condensate prices will fluctuate seasonally with oil sands blending demand, import pipeline utilization, and global supply and demand factors.
•AECO and NYMEX natural gas prices are expected to remain volatile, impacted by LNG export capacity and weather-driven demand factors.
•We expect the Canadian dollar to continue to be impacted by the pace at which the U.S. Federal Reserve Board and the Bank of Canada raise or lower benchmark lending rates relative to each other, the U.S. Administration’s policies toward Canada-U.S. trade, crude oil prices and emerging macro-economic factors.
While we expect to see volatility in crude oil prices, we have the ability to partially mitigate the impact of crude oil and refined product differentials through the following:
•Transportation commitments and arrangements – using our existing firm service commitments for takeaway capacity and supporting transportation projects that move crude oil from our production areas to consuming markets, including tidewater markets.
•Integration – heavy oil refining capacity allows us to capture value from both the WTI-WCS differential for Canadian crude oil and spreads on refined products.
•Monitoring market fundamentals and optimizing run rates at our refineries accordingly.
•Traditional crude oil storage tanks in various geographic locations.
| | | | | |
Cenovus Energy Inc. – Q2 2026 Management's Discussion and Analysis | 12 |
Policy and Regulatory Developments
In early July 2026, the Government of Canada, the Government of Alberta and Oil Sands Alliance member companies announced they had entered a trilateral memorandum of understanding (the “MOU”) to support Canada’s ambition to become a global energy superpower.
The MOU contemplates a series of regulatory reforms and fiscal measures intended to support future oil sands production growth and expand market access. It also outlines a policy and fiscal framework to advance the Pathways Carbon Capture and Storage Project (the “Pathways Project”). Advancing the proposed Pathways Project as outlined in the MOU is subject to execution of definitive agreements and regulatory approvals.
2026 Corporate Guidance
Our 2026 guidance, as updated on July 28, 2026, is available on our website at cenovus.com.
Changes to our updated guidance include:
•An increase at the midpoint of total upstream production due to the impacts of strong performance in the Oil Sands and optimization of turnaround activity at Foster Creek and Christina Lake.
•An increase at the midpoint for total downstream throughput due to strong year-to-date performance in the Canadian Refining segment.
The following table is a sub-set of our full guidance for 2026:
| | | | | | | | | | | | | | | | | |
| Capital Investment ($ millions) | | Production (MBOE/d) | | Crude Oil Unit Throughput (Mbbls/d) |
| Upstream | | | | | |
| Oil Sands | 3,500 - 3,600 | | 780 - 805 | | |
| Conventional | 450 - 500 | | 120 - 125 | | |
| Offshore | 450 - 500 | | 70 - 80 | | |
| Upstream Total | 4,400 - 4,600 | | 970 - 1,010 | | |
| Downstream | | | | | |
| Canadian Refining | | | | | 110 - 115 |
| U.S. Refining | | | | | 325 - 340 |
| Downstream Total | 600 - 700 | | | | 435 - 455 |
| Corporate and Eliminations | Up to 25 | | | | |
We continue to execute our capital program and there have been no changes to our full year expected capital investment range of $5.0 billion and $5.3 billion. This includes $3.5 billion to $3.6 billion directed towards sustaining capital to maintain base production and support continued safe and reliable operations, and between $1.2 billion and $1.4 billion directed towards growth projects.
| | | | | |
Cenovus Energy Inc. – Q2 2026 Management's Discussion and Analysis | 13 |
For a description of our reportable segments, refer to Note 1 of the interim Consolidated Financial Statements.
UPSTREAM
Oil Sands
Financial Results
| | | | | | | | | | | | | | | | | | | | | | | | | |
| Three Months Ended June 30, | | Six Months Ended June 30, | | |
| ($ millions) | 2026 | | 2025 | | 2026 | | 2025 | | |
| Gross Sales | | | | | | | | | |
External Sales | 10,417 | | | 4,793 | | | 17,309 | | | 10,697 | | | |
Intersegment Sales | 2,398 | | | 1,717 | | | 4,290 | | | 3,670 | | | |
| 12,815 | | | 6,510 | | | 21,599 | | | 14,367 | | | |
| Royalties | (1,600) | | | (589) | | | (2,540) | | | (1,450) | | | |
| Revenues | 11,215 | | | 5,921 | | | 19,059 | | | 12,917 | | | |
| Expenses | | | | | | | | | |
| Purchased Product | 1,530 | | | 856 | | | 2,147 | | | 1,488 | | | |
| Transportation and Blending | 4,497 | | | 2,535 | | | 7,780 | | | 5,686 | | | |
Operating | 759 | | | 700 | | | 1,585 | | | 1,377 | | | |
| Realized (Gain) Loss on Risk Management | 29 | | | 8 | | | 52 | | | — | | | |
| Operating Margin | 4,400 | | | 1,822 | | | 7,495 | | | 4,366 | | | |
Unrealized (Gain) Loss on Risk Management | 57 | | | 16 | | | (33) | | | 9 | | | |
| Depreciation, Depletion and Amortization | 1,062 | | | 749 | | | 2,089 | | | 1,583 | | | |
| Exploration Expense | 3 | | | 2 | | | 4 | | | 6 | | | |
| (Income) Loss from Equity-Accounted Affiliates | (28) | | | (38) | | | (28) | | | (38) | | | |
| Segment Income (Loss) | 3,306 | | | 1,093 | | | 5,463 | | | 2,806 | | | |
Operating Results
| | | | | | | | | | | | | | | | | | | | | | | | | | | | |
| Three Months Ended June 30, | | Six Months Ended June 30, | | | | | |
| 2026 | | 2025 | | 2026 | | 2025 | | | | | |
Total Sales Volumes (1) (MBOE/d) | 784.8 | | | 568.2 | | | 775.7 | | | 602.2 | | | | | | |
| | | | | | | | | | | | |
Crude Oil Production by Asset (Mbbls/d) | | | | | | | | | | | | |
| Foster Creek | 214.5 | | | 186.1 | | | 218.7 | | | 194.3 | | | | | | |
Christina Lake (2) | 372.1 | | | 217.9 | | | 365.5 | | | 227.8 | | | | | | |
Sunrise | 65.7 | | | 50.3 | | | 62.6 | | | 51.2 | | | | | | |
| Lloydminster Thermal | 103.1 | | | 97.8 | | | 102.7 | | | 103.8 | | | | | | |
| Lloydminster Conventional Heavy Oil | 28.4 | | | 25.0 | | | 28.7 | | | 23.4 | | | | | | |
Total Crude Oil Production (3) (Mbbls/d) | 783.8 | | | 577.1 | | | 778.2 | | | 600.5 | | | | | | |
Natural Gas (1) (MMcf/d) | 15.6 | | | 16.5 | | | 15.0 | | | 13.9 | | | | | | |
Total Production (MBOE/d) | 786.4 | | | 579.8 | | | 780.7 | | | 602.9 | | | | | | |
| | | | | | | | | | | | |
Effective Royalty Rate (4) (percent) | 23.6 | | | 18.9 | | | 21.8 | | | 20.2 | | | | | | |
| | | | | | | | | | | | |
Netback (5) ($/bbl) | | | | | | | | | | | | |
Realized Sales Price | 103.71 | | | 70.78 | | | 91.97 | | | 76.16 | | | | | | |
Royalties | 22.44 | | | 11.43 | | | 18.09 | | | 13.33 | | | | | | |
Transportation and Blending | 8.48 | | | 10.18 | | | 8.66 | | | 10.01 | | | | | | |
Operating | 10.80 | | | 13.60 | | | 11.35 | | | 12.64 | | | | | | |
Netback ($/bbl) | 61.99 | | | 35.57 | | | 53.87 | | | 40.18 | | | | | | |
| | | | | | | | | | | | |
| | | | | | | | | | | | |
(1)Bitumen, heavy crude oil and natural gas. Natural gas is a conventional natural gas product type.
(2)Results for the three and six months ended June 30, 2026, include the MEG Acquisition, which closed on November 13, 2025.
(3)Crude oil production is primarily bitumen, except for Lloydminster conventional heavy oil, which is heavy crude oil.
(4)Effective royalty rates are equal to royalty expense divided by product revenue, net of transportation expenses, excluding realized (gain) loss on risk management.
(5)Contains a non-GAAP financial measure. See the Specified Financial Measures Advisory of this MD&A.
| | | | | |
Cenovus Energy Inc. – Q2 2026 Management's Discussion and Analysis | 14 |
Revenues
Gross sales increased in the three and six months ended June 30, 2026, compared with the same periods in 2025, due to higher Realized Sales Prices and higher sales volumes.
Price
Our bitumen and heavy oil production is blended with condensate in order to transport it to market through pipelines. In our Netback calculations, Realized Sales Price excludes the impact of purchased condensate but is influenced by condensate pricing. As the cost of condensate increases relative to the price of blended crude oil or our blend ratio increases, our realized bitumen and heavy oil sales price decreases.
Our Realized Sales Price increased 47 percent and 21 percent in the three and six months ended June 30, 2026, respectively, compared with the same periods in 2025, primarily due to higher WTI benchmark prices, partially offset by the widening of the WTI-WCS differential.
Sales by Location
In the three and six months ended June 30, 2026, approximately 28 percent and 30 percent, respectively, of our sales volumes were sold to third parties at destinations outside of Alberta, which includes the West Coast of Canada, USGC and PADD II. Approximately 19 percent and 21 percent of our sales volumes were sold to our downstream operations in the three and six months ended June 30, 2026, respectively.
Production Volumes
Oil Sands crude oil production increased in the three and six months ended June 30, 2026, compared with 2025, primarily due to:
•Additional production from the MEG Acquisition, solid performance from the redevelopment programs at Christina Lake and new sustaining well pads following the completion of the Narrows Lake tie-back to Christina Lake in the third quarter of 2025.
•Incremental production from the completion of the Foster Creek optimization project in the fourth quarter of 2025, and the successful ramp-up of new well pads and base well optimization activities.
•Positive results from redevelopment and sustaining programs at Sunrise, including strong production following the ramp-up of the first well pad in the east development area.
•Successful redevelopment at our Lloydminster assets resulting in higher reservoir performance.
Oil Sands production was impacted by an unplanned disruption at Foster Creek in late May 2026, and wildfire activity at Christina Lake in late May 2025.
Royalties
Royalty calculations for our Oil Sands segment are based on government prescribed royalty regimes in Alberta and Saskatchewan. Refer to our 2025 annual MD&A for further details.
For the three and six months ended June 30, 2026, the Oil Sands effective royalty rate increased compared with 2025, primarily due to higher Realized Sales Prices and higher Alberta sliding scale oil sands royalty rates.
| | | | | |
Cenovus Energy Inc. – Q2 2026 Management's Discussion and Analysis | 15 |
Oil Sands royalties increased in the three and six months ended June 30, 2026, compared with 2025, primarily due to the factors discussed above and higher sales volumes.
Expenses
Transportation and Blending
In the three and six months ended June 30, 2026, blending expenses increased compared with 2025, primarily due to higher sales volumes and condensate prices.
In the three and six months ended June 30, 2026, transportation expenses increased compared with the same periods in 2025, primarily due to higher sales volumes, partially offset by lower per-unit transportation expenses. The lower per-unit transportation expenses reflect global pricing volatility in the first half of 2026, compared with 2025, which enabled higher non-equity crude movements on the Trans Mountain Expansion pipeline (“TMX”) to enhance margins, resulting in increased equity volumes sold in Alberta.
Per-Unit Transportation Expenses (1)
| | | | | | | | | | | | | | | | | | | | | | | | | |
| Three Months Ended June 30, | | Six Months Ended June 30, | | |
| ($/bbl) | 2026 | | 2025 | | 2026 | | 2025 | | |
Foster Creek | 12.92 | | | 18.41 | | | 12.59 | | | 17.01 | | | |
Christina Lake | 7.83 | | | 6.07 | | | 7.95 | | | 6.10 | | | |
Sunrise | 8.95 | | | 15.28 | | | 11.02 | | | 16.66 | | | |
Lloydminster (2) | 2.99 | | | 3.28 | | | 2.93 | | | 3.35 | | | |
Total Oil Sands | 8.48 | | | 10.18 | | | 8.66 | | | 10.01 | | | |
(1)Specified financial measure. See the Specified Financial Measures Advisory of this MD&A.
(2)Includes Lloydminster thermal and Lloydminster conventional heavy oil assets.
Per-unit transportation expenses decreased in the three and six months ended June 30, 2026, compared with 2025, primarily due to:
•Lower volumes sold on TMX from Foster Creek and Sunrise, which resulted in lower transportation rates. At Foster Creek, volumes sold at West Coast destinations in the three and six months ended June 30, 2026, were 24 percent (2025 – 38 percent and 35 percent, respectively). At Sunrise, volumes sold at West Coast destinations were 17 percent and 22 percent, respectively (2025 – 51 percent and 62 percent, respectively).
•Lower volumes sold to U.S. destinations from Foster Creek and Lloydminster, which resulted in lower transportation rates. At Foster Creek, volumes sold to U.S. destinations in the three and six months ended June 30, 2026, were 33 percent and 34 percent, respectively (2025 – 47 percent and 41 percent, respectively). At Lloydminster, one percent of volumes were sold to U.S. destinations in the second quarter of 2026 (2025 – two percent). Volumes sold to U.S. destinations in the first half of 2026 were nominal (2025 – two percent).
•Lower volumes sold to U.S. destinations from Sunrise, which resulted in lower transportation rates in the second quarter of 2026. Quarter-over-quarter, volumes sold to U.S. destinations decreased to 29 percent from 38 percent. Year-over-year, volumes sold to U.S. destinations were consistent.
The lower oil sands transportation rates, discussed above, were partially offset by higher transportation rates at Christina Lake, primarily due to higher sales volumes on TMX following the MEG Acquisition. In both the three and six months ended June 30, 2026, eight percent of our sales volumes were sold at West Coast destinations (three and six months ended June 30, 2025 – nil). Christina Lake sales volumes sold to U.S. destinations were relatively consistent quarter-over-quarter and year-over-year at 15 percent and 16 percent, respectively (2025 – 16 percent and 15 percent, respectively).
Operating
Primary drivers of our operating expenses in the first half of 2026 were energy, workforce, and repairs and maintenance costs. Total operating expenses increased in the three and six months ended June 30, 2026, compared with the same periods in 2025, primarily due to higher overall operating costs at our Christina Lake assets related to the additional production from the MEG Acquisition.
| | | | | |
Cenovus Energy Inc. – Q2 2026 Management's Discussion and Analysis | 16 |
Per-Unit Operating Expenses (1)
| | | | | | | | | | | | | | | | | | | | | | | | | | | | | | | | | | | | | | | |
| Three Months Ended June 30, | | Six Months Ended June 30, | | | | |
($/bbl) | 2026 | | Percent
Change | | 2025 | | 2026 | | Percent
Change | | 2025 | | | | |
| Foster Creek | | | | | | | | | | | | | | | |
Fuel | 2.35 | | | (19) | | | 2.90 | | | 2.44 | | | (7) | | | 2.63 | | | | | |
Non-Fuel | 7.32 | | | (22) | | | 9.44 | | | 7.55 | | | (9) | | | 8.34 | | | | | |
Total | 9.67 | | | (22) | | | 12.34 | | | 9.99 | | | (9) | | | 10.97 | | | | | |
| Christina Lake | | | | | | | | | | | | | | | |
| Fuel | 2.32 | | | 2 | | | 2.28 | | | 2.66 | | | 11 | | | 2.40 | | | | | |
| Non-Fuel | 5.82 | | | (9) | | | 6.42 | | | 6.00 | | | (5) | | | 6.33 | | | | | |
Total | 8.14 | | | (6) | | | 8.70 | | | 8.66 | | | (1) | | | 8.73 | | | | | |
| Sunrise | | | | | | | | | | | | | | | |
| Fuel | 3.28 | | | (29) | | | 4.59 | | | 3.68 | | | (18) | | | 4.47 | | | | | |
| Non-Fuel | 11.30 | | | (28) | | | 15.67 | | | 12.32 | | | (15) | | | 14.45 | | | | | |
Total | 14.58 | | | (28) | | | 20.26 | | | 16.00 | | | (15) | | | 18.92 | | | | | |
Lloydminster (2) | | | | | | | | | | | | | | | |
| Fuel | 2.95 | | | (6) | | | 3.13 | | | 3.07 | | | (10) | | | 3.41 | | | | | |
| Non-Fuel | 15.18 | | | (16) | | | 17.99 | | | 15.63 | | | (5) | | | 16.37 | | | | | |
Total | 18.13 | | | (14) | | | 21.12 | | | 18.70 | | | (5) | | | 19.78 | | | | | |
| Total Oil Sands | | | | | | | | | | | | | | | |
| Fuel | 2.52 | | | (12) | | | 2.87 | | | 2.75 | | | (4) | | | 2.86 | | | | | |
| Non-Fuel | 8.28 | | | (23) | | | 10.73 | | | 8.60 | | | (12) | | | 9.78 | | | | | |
Total | 10.80 | | | (21) | | | 13.60 | | | 11.35 | | | (10) | | | 12.64 | | | | | |
(1)Specified financial measure. See the Specified Financial Measures Advisory of this MD&A.
(2)Includes Lloydminster thermal and Lloydminster conventional heavy oil assets.
Total Oil Sands per-unit fuel expenses decreased in the three and six months ended June 30, 2026, compared with the same periods in 2025, primarily due to higher sales volumes and lower average AECO benchmark pricing, partially offset by higher natural gas consumption from the MEG Acquisition.
Total Oil Sands per-unit non-fuel expenses decreased in the three and six months ended June 30, 2026, compared with 2025, primarily due to decreases at:
•Sunrise, primarily due to higher sales volumes, lower GHG compliance costs, and lower repairs and maintenance costs.
•Foster Creek, primarily due to higher sales volumes, and lower repairs and maintenance costs, partially offset by higher GHG compliance costs.
•Lloydminster, primarily due to higher sales volumes, lower waste fluid handling and trucking costs, and lower GHG compliance costs.
•Christina Lake, primarily due to higher sales volumes and lower GHG compliance costs, partially offset by higher repairs and maintenance, and workforce costs.
Depreciation, Depletion and Amortization
In the three and six months ended June 30, 2026, Oil Sands DD&A expense increased $313 million and $506 million, respectively, compared with 2025, primarily as a result of the MEG Acquisition.
| | | | | |
Cenovus Energy Inc. – Q2 2026 Management's Discussion and Analysis | 17 |
Conventional
Financial Results
| | | | | | | | | | | | | | | | | | | | | | | | | |
| Three Months Ended June 30, | | Six Months Ended June 30, | | |
| ($ millions) | 2026 | | 2025 | | 2026 | | 2025 | | |
| | | | | | | | | |
| Gross Sales | | | | | | | | | |
External Sales | 429 | | | 281 | | | 997 | | | 724 | | | |
Intersegment Sales | 477 | | | 268 | | | 946 | | | 769 | | | |
| 906 | | | 549 | | | 1,943 | | | 1,493 | | | |
| Royalties | (37) | | | (12) | | | (55) | | | (32) | | | |
| Revenues | 869 | | | 537 | | | 1,888 | | | 1,461 | | | |
| Expenses | | | | | | | | | |
| Purchased Product | 548 | | | 255 | | | 1,171 | | | 790 | | | |
Transportation and Blending | 78 | | | 83 | | | 163 | | | 173 | | | |
| Operating | 104 | | | 115 | | | 214 | | | 242 | | | |
| Realized (Gain) Loss on Risk Management | (1) | | | — | | | (11) | | | (1) | | | |
| Operating Margin | 140 | | | 84 | | | 351 | | | 257 | | | |
Unrealized (Gain) Loss on Risk Management | — | | | (1) | | | 4 | | | (1) | | | |
| Depreciation, Depletion and Amortization | 134 | | | 117 | | | 268 | | | 237 | | | |
| Exploration Expense | — | | | — | | | — | | | — | | | |
| (Income) Loss From Equity-Accounted Affiliates | — | | | 1 | | | (1) | | | 1 | | | |
| Segment Income (Loss) | 6 | | | (33) | | | 80 | | | 20 | | | |
Operating Results (1)
| | | | | | | | | | | | | | | | | | | | | | | | | |
| Three Months Ended June 30, | | Six Months Ended June 30, | | |
| 2026 | | 2025 | | 2026 | | 2025 | | |
Total Sales Volumes (MBOE/d) | 116.6 | | | 119.8 | | | 118.6 | | | 121.8 | | | |
| | | | | | | | | |
Realized Sales Price (2) ($/BOE) | | | | | | | | | |
Light Crude Oil ($/bbl) | 131.02 | | | 77.83 | | | 112.34 | | | 83.86 | | | |
NGLs ($/bbl) | 61.49 | | | 47.56 | | | 57.70 | | | 56.22 | | | |
Conventional Natural Gas ($/Mcf) | 2.59 | | | 2.77 | | | 3.47 | | | 3.45 | | | |
| | | | | | | | | |
| Production by Product | | | | | | | | | |
Light Crude Oil (Mbbls/d) | 6.7 | | | 4.5 | | | 6.4 | | | 4.8 | | | |
NGLs (Mbbls/d) | 22.2 | | | 20.4 | | | 22.5 | | | 20.5 | | | |
Conventional Natural Gas (MMcf/d) | 535.9 | | | 569.2 | | | 546.1 | | | 579.2 | | | |
Total Production (MBOE/d) | 118.2 | | 119.8 | | 119.9 | | 121.8 | | |
| | | | | | | | | |
Conventional Natural Gas Production (percentage of total) | 76 | | | 79 | | | 76 | | | 79 | | | |
Crude Oil and NGLs Production (percentage of total) | 24 | | | 21 | | | 24 | | | 21 | | | |
| | | | | | | | | |
Effective Royalty Rate (3) (percent) | 15.1 | | | 7.4 | | | 12.1 | | | 8.3 | | | |
| | | | | | | | | |
Netback (2) ($/BOE) | | | | | | | | | |
Realized Sales Price | 30.94 | | | 24.19 | | | 32.73 | | | 29.16 | | | |
Royalties | 3.55 | | | 1.18 | | | 2.65 | | | 1.51 | | | |
Transportation and Blending | 4.23 | | | 5.27 | | | 4.22 | | | 5.38 | | | |
Operating | 9.13 | | | 9.95 | | | 9.37 | | | 10.44 | | | |
Total Netback ($/BOE) | 14.03 | | | 7.79 | | | 16.49 | | | 11.83 | | | |
| | | | | | | | | |
| | | | | | | | | |
| | | | | | | | | |
| | | | | | | | | |
| | | | | | | | | |
| | | | | | | | | |
(1)Reported production volumes, sales volumes, associated per-unit values and effective royalty rates include Cenovus’s 30 percent equity interest in the Duvernay joint venture.
(2)Contains a non-GAAP financial measure. See the Specified Financial Measures Advisory of this MD&A.
(3)Effective royalty rates are equal to royalty expense divided by product revenue, net of transportation expenses, excluding realized (gain) loss on risk management.
| | | | | |
Cenovus Energy Inc. – Q2 2026 Management's Discussion and Analysis | 18 |
Revenues
Gross sales increased in the three and six months ended June 30, 2026, compared with the same periods in 2025, due to higher Realized Sales Prices and commodity trading volumes sourced from third parties, partially offset by a slight decrease in sales volumes.
Price
Realized Sales Price increased quarter-over-quarter, primarily due to higher average crude oil benchmark prices, and higher oil and NGL sales volumes, partially offset by lower average natural gas benchmark prices and a slight decrease in natural gas sales to U.S. destinations. In the second quarter of 2026, 31 percent of our natural gas sales volumes were sold at U.S. destinations (2025 – 33 percent).
Year-over-year, our Realized Sales Price increased primarily reflecting higher NYMEX pricing and a slight increase in natural gas sales to U.S. destinations, partially offset by lower AECO pricing. In the first half of 2026, 31 percent of our natural gas sales volumes were sold at U.S. destinations (2025 – 30 percent).
For the three and six months ended June 30, 2026, the NYMEX natural gas benchmark price averaged US$2.90 per Mcf and US$3.97 per Mcf, respectively (2025 – US$3.44 per Mcf and US$3.55 per Mcf, respectively), and the AECO natural gas benchmark price averaged $1.63 per Mcf and $1.82 per Mcf, respectively (2025 – $1.69 per Mcf and $1.93 per Mcf, respectively).
Production Volumes
Production volumes decreased slightly in the three and six months ended June 30, 2026, compared with 2025, primarily due to third-party maintenance, partially offset by higher oil and NGL volumes reflecting a continued focus on liquids-rich production.
Royalties
The Conventional assets are subject to royalty regimes in Alberta and British Columbia. Royalties and the effective royalty rate increased in the three and six months ended June 30, 2026, compared with 2025, primarily due to higher benchmark prices used to calculate our royalties and lower Gas Cost Allowance deductions.
Expenses
Transportation
Total and per-unit transportation expenses decreased in the three and six months ended June 30, 2026, compared with 2025, primarily due to lower NGL delivery costs, partially offset by higher natural gas tolls.
Operating
Primary drivers of operating expenses in the first half of 2026 were repairs and maintenance, workforce and property tax costs.
Total and per-unit operating expenses decreased in the three and six months ended June 30, 2026, compared with 2025, due to lower repairs and maintenance, GHG compliance and electricity costs, partially offset by higher waste fluid handling costs in the second quarter of 2026 and higher workover costs in the first half of 2026.
| | | | | |
Cenovus Energy Inc. – Q2 2026 Management's Discussion and Analysis | 19 |
Offshore
Financial Results
| | | | | | | | | | | | | | | | | | | | | | | | | | | | | | | | | | | |
| Three Months Ended June 30, |
| 2026 | | 2025 |
| ($ millions) | Atlantic | | Asia Pacific | | Offshore | | Atlantic | | Asia Pacific | | Offshore |
| Gross Sales | | | | | | | | | | | |
External Sales | 218 | | 292 | | 510 | | 72 | | 263 | | 335 |
Intersegment Sales | — | | — | | — | | — | | — | | — |
| 218 | | 292 | | 510 | | 72 | | 263 | | 335 |
Royalties | (2) | | (22) | | (24) | | — | | (20) | | (20) |
| Revenues | 216 | | 270 | | 486 | | 72 | | 243 | | 315 |
| Expenses | | | | | | | | | | | |
| Purchased Product | (4) | | — | | (4) | | — | | — | | — |
Transportation and Blending | 7 | | — | | 7 | | 3 | | — | | 3 |
Operating | 79 | | 29 | | 108 | | 48 | | 33 | | 81 |
Operating Margin (1) | 134 | | 241 | | 375 | | 21 | | 210 | | 231 |
| Depreciation, Depletion and Amortization | | | | | 106 | | | | | | 93 |
| Exploration Expense | | | | | 1 | | | | | | 1 |
| (Income) Loss from Equity-Accounted Affiliates | | | | | (18) | | | | | | (7) |
| Segment Income (Loss) | | | | | 286 | | | | | | 144 |
| | | | | | | | | | | | | | | | | | | | | | | | | | | | | | | | | | | |
| Six Months Ended June 30, |
| 2026 | | 2025 |
| ($ millions) | Atlantic | | Asia Pacific | | Offshore | | Atlantic | | Asia Pacific | | Offshore |
| Gross Sales | | | | | | | | | | | |
External Sales | 470 | | 589 | | 1,059 | | 218 | | 568 | | 786 |
Intersegment Sales | — | | — | | — | | — | | — | | — |
| 470 | | 589 | | 1,059 | | 218 | | 568 | | 786 |
Royalties | (4) | | (45) | | (49) | | (2) | | (43) | | (45) |
| Revenues | 466 | | 544 | | 1,010 | | 216 | | 525 | | 741 |
| Expenses | | | | | | | | | | | |
| Purchased Product | — | | — | | — | | — | | — | | — |
Transportation and Blending | 14 | | — | | 14 | | 9 | | — | | 9 |
Operating | 161 | | 58 | | 219 | | 112 | | 58 | | 170 |
Operating Margin (1) | 291 | | 486 | | 777 | | 95 | | 467 | | 562 |
| Depreciation, Depletion and Amortization | | | | | 235 | | | | | | 223 |
| Exploration Expense | | | | | 12 | | | | | | 2 |
| (Income) Loss from Equity-Accounted Affiliates | | | | | (33) | | | | | | (15) |
| Segment Income (Loss) | | | | | 563 | | | | | | 352 |
(1)Atlantic and Asia Pacific Operating Margin are non-GAAP financial measures. See the Specified Financial Measures Advisory of this MD&A.
| | | | | |
Cenovus Energy Inc. – Q2 2026 Management's Discussion and Analysis | 20 |
Operating Results
| | | | | | | | | | | | | | | | | | | | | | | |
| Three Months Ended June 30, | | Six Months Ended June 30, |
| 2026 | | 2025 | | 2026 | | 2025 |
Sales Volumes | | | | | | | |
Atlantic (Mbbls/d) | 14.7 | | | 7.9 | | | 18.9 | | | 11.8 | |
Asia Pacific (MBOE/d) | | | | | | | |
| China | 37.1 | | 37.9 | | 39.4 | | 39.8 |
Indonesia (1) | 14.1 | | 15.9 | | 14.8 | | 15.6 |
| Total Asia Pacific | 51.2 | | 53.8 | | 54.2 | | 55.4 |
Total Sales Volumes (MBOE/d) | 65.9 | | 61.7 | | 73.1 | | 67.2 |
| | | | | | | |
| Production by Product | | | | | | | |
Atlantic – Light Crude Oil (Mbbls/d) | 14.6 | | 12.5 | | 16.5 | | 12.1 |
Asia Pacific (1) | | | | | | | |
NGLs (Mbbls/d) | 8.2 | | 9.5 | | 9.2 | | 9.4 |
Conventional Natural Gas (MMcf/d) | 258.3 | | 265.7 | | 269.7 | | 276.4 |
| Total Asia Pacific (MBOE/d) | 51.2 | | 53.8 | | 54.2 | | 55.4 |
| Total Production (MBOE/d) | 65.8 | | 66.3 | | 70.7 | | 67.5 |
| | | | | | | |
Effective Royalty Rate (2) (percent) | | | | | | | |
| Atlantic | 1.0 | | | 0.9 | | | 1.0 | | | 1.0 | |
Asia Pacific (1) | 11.5 | | | 11.9 | | | 11.4 | | | 12.3 | |
| | | | | | | |
| | | | | | | |
(1)Reported sales volumes, production volumes and royalty rates reflect Cenovus’s 40 percent equity interest in the HCML joint venture.
(2)Effective royalty rates are equal to royalty expense divided by product revenue, net of transportation expenses, excluding realized (gain) loss on risk management.
Netbacks (1)
| | | | | | | | | | | | | | | | | | | | | | | | | | |
| Three Months Ended June 30, 2026 |
| ($/BOE, except where indicated) | Atlantic ($/bbl) | | China | Indonesia | Total Offshore (2) |
| | | | | | | | |
Realized Sales Price | | 162.57 | | | 86.74 | | | 65.76 | | | 99.14 | |
Royalties | | 1.70 | | | 6.49 | | | 16.81 | | | 7.63 | |
| Transportation and Blending | | 4.65 | | | — | | | — | | | 1.04 | |
| Operating Expenses | | 55.80 | | | 8.27 | | | 10.73 | | | 19.39 | |
Netback | | 100.42 | | | 71.98 | | | 38.22 | | | 71.08 | |
| | | | | | | | | | | | | | | | | | | | | | | | | | |
| Three Months Ended June 30, 2025 |
| ($/BOE, except where indicated) | Atlantic ($/bbl) | | China | Indonesia | Total Offshore (2) |
| | | | | | | | |
Realized Sales Price | | 100.23 | | | 76.49 | | | 59.06 | | | 75.01 | |
Royalties | | 0.94 | | | 5.88 | | | 14.65 | | | 7.52 | |
| Transportation and Blending | | 4.14 | | | — | | | — | | | 0.53 | |
| Operating Expenses | | 61.44 | | | 8.72 | | | 10.56 | | | 15.94 | |
Netback | | 33.71 | | | 61.89 | | | 33.85 | | | 51.02 | |
| | | | | | | | | | | | | | | | | | | | | | | | | | |
| Six Months Ended June 30, 2026 |
| ($/BOE, except where indicated) | Atlantic ($/bbl) | | China | Indonesia | Total Offshore (2) |
| | | | | | | | |
Realized Sales Price | | 134.99 | | | 82.87 | | | 62.10 | | | 92.11 | |
Royalties | | 1.29 | | | 6.24 | | | 15.61 | | | 6.87 | |
| Transportation and Blending | | 3.99 | | | — | | | — | | | 1.03 | |
| Operating Expenses | | 45.80 | | | 7.83 | | | 9.84 | | | 18.04 | |
Netback | | 83.91 | | | 68.80 | | | 36.65 | | | 66.17 | |
(1)Contains a non-GAAP financial measure. See the Specified Financial Measures Advisory of this MD&A.
(2)Reported per-unit values reflect Cenovus’s 40 percent equity interest in the HCML joint venture.
| | | | | |
Cenovus Energy Inc. – Q2 2026 Management's Discussion and Analysis | 21 |
Netbacks (1) – Continued
| | | | | | | | | | | | | | | | | | | | | | | | | | |
| Six Months Ended June 30, 2025 |
| ($/BOE, except where indicated) | Atlantic ($/bbl) | | China | Indonesia | Total Offshore (2) |
| | | | | | | | |
Realized Sales Price | | 101.82 | | | 78.85 | | | 61.77 | | | 78.92 | |
Royalties | | 1.00 | | | 6.01 | | | 16.98 | | | 7.68 | |
| Transportation and Blending | | 4.21 | | | — | | | — | | | 0.74 | |
| Operating Expenses | | 50.84 | | | 7.30 | | | 10.61 | | | 15.71 | |
Netback | | 45.77 | | | 65.54 | | | 34.18 | | | 54.79 | |
(1)Contains a non-GAAP financial measure. See the Specified Financial Measures Advisory of this MD&A.
(2)Reported per-unit values reflect Cenovus’s 40 percent equity interest in the HCML joint venture.
Revenues
Gross sales increased in the three and six months ended June 30, 2026, compared with the same periods in 2025, due to higher Realized Sales Prices and higher sales volumes.
Price
Our Atlantic Realized Sales Price increased in the three and six months ended June 30, 2026, compared with 2025, due to higher Brent benchmark pricing. The prices we receive for natural gas sold in Asia Pacific are set under long-term contracts.
Production Volumes
Atlantic production volumes increased in the three and six months ended June 30, 2026, compared with the same periods in 2025, primarily due to strong production from the Terra Nova field. The increase in the first half of 2026 was further supported by strong production from the White Rose field following the completion of the SeaRose ALE project in the first quarter of 2025.
Asia Pacific production volumes decreased in the three and six months ended June 30, 2026, compared with the same periods in 2025, primarily due to lower buyer nominations in Indonesia, lower contracted sales volumes in China and increased maintenance activities as we completed the umbilical replacement at the Liuhua 29-1 field.
Royalties
Atlantic royalties increased in the three and six months ended June 30, 2026, compared with 2025, primarily due to higher Realized Sales Prices and higher sales volumes.
Effective royalty rates in Atlantic and Asia Pacific were consistent in the three and six months ended June 30, 2026, and 2025.
Expenses
Transportation
Transportation expenses include the costs of transporting crude oil from the SeaRose and Terra Nova floating production, storage and offloading units (“FPSO”) to onshore terminals and storage costs. In the three and six months ended June 30, 2026, transportation expenses increased to $7 million and $14 million, respectively (2025 – $3 million and $9 million, respectively), primarily due to higher Atlantic Sales volumes.
Operating
In the first half of 2026, primary drivers of our Atlantic operating expenses were repairs and maintenance, vessel and air service costs, and workforce costs. Total operating expenses increased in the three and six months ended June 30, 2026, compared with 2025, primarily due to higher repairs and maintenance, workforce, and vessel and air service costs. Per-unit operating expenses decreased in the three and six months ended June 30, 2026, compared with 2025, as the increased sales volumes more than offset the increase in total operating expenses discussed above.
Primary drivers of our China operating expenses in the first half of 2026 were repairs and maintenance, workforce and insurance costs. Total and per-unit operating expenses decreased quarter-over-quarter, primarily due to lower repairs and maintenance, and insurance costs, partially offset by higher workforce and chemical costs. Total and per-unit operating expenses increased year-over-year, primarily due to higher workforce, chemical, and repairs and maintenance costs, partially offset by lower insurance, and vessel and air service costs.
Primary drivers of our Indonesia operating expenses in the first half of 2026 were repairs and maintenance, and workforce costs. Per-unit operating expenses were relatively consistent in the second quarter of 2026, compared with 2025. Per-unit operating expenses decreased year-over-year, primarily due to lower vessel and air service, and workforce costs, partially offset by lower sales volumes.
| | | | | |
Cenovus Energy Inc. – Q2 2026 Management's Discussion and Analysis | 22 |
DOWNSTREAM
Canadian Refining
Financial Results
| | | | | | | | | | | | | | | | | | | | | | | |
| Three Months Ended June 30, | | Six Months Ended June 30, |
($ millions) | 2026 | | 2025 | | 2026 | | 2025 |
| | | | | | | |
| | | | | | | |
| | | | | | | |
| Revenues | 1,608 | | | 1,288 | | | 3,015 | | | 2,570 | |
| | | | | | | |
| | | | | | | |
| Purchased Product | 1,279 | | | 1,040 | | | 2,339 | | | 2,116 | |
Gross Margin (1) | 329 | | | 248 | | | 676 | | | 454 | |
| Expenses | | | | | | | |
| Operating | 147 | | | 141 | | | 293 | | | 279 | |
| Operating Margin | 182 | | | 107 | | | 383 | | | 175 | |
| Depreciation, Depletion and Amortization | 45 | | | 52 | | | 90 | | | 99 | |
| Segment Income (Loss) | 137 | | | 55 | | | 293 | | | 76 | |
| | | | | | | |
| | | | | | | |
| | | | | | | |
| | | | | | | |
| | | | | | | |
| | | | | | | |
| | | | | | | |
| | | | | | | |
| | | | | | | |
| | | | | | | |
| | | | | | | |
| | | | | | | |
| | | | | | | |
| | | | | | | |
| | | | | | | |
| | | | | | | |
| | | | | | | |
| | | | | | | |
| | | | | | | |
| | | | | | | |
(1)Non-GAAP financial measure. See the Specified Financial Measures Advisory of this MD&A.
| | | | | | | | | | | | | | | | | | | | | | | |
| Three Months Ended June 30, | | Six Months Ended June 30, |
($ millions, except where indicated) | 2026 | | 2025 | | 2026 | | 2025 |
| | | | | | | |
| | | | | | | |
| Gross Margin | 329 | | 248 | | 676 | | 454 |
Add (Deduct): | | | | | | | |
Inventory Holding (Gain) Loss (1) | 8 | | (12) | | (39) | | (9) |
Adjusted Gross Margin (2) | 337 | | 236 | | 637 | | 445 |
| | | | | | | |
| | | | | | | |
| | | | | | | |
| | | | | | | |
Adjusted Refining Margin (3) ($/bbl) | 30.21 | | 19.64 | | 27.07 | | 18.50 |
| | | | | | | |
| | | | | | | |
(1)Inventory holding (gain) loss reflects the difference between the cost of volumes produced at current-period costs and the cost of volumes produced under the first-in, first-out (“FIFO”) or weighted average cost basis, as required by IFRS Accounting Standards.
(2)Non-GAAP financial measure. See the Specified Financial Measures Advisory of this MD&A.
(3)Contains a non-GAAP financial measure. See the Specified Financial Measures Advisory of this MD&A. Revenues from the Upgrader, the Lloydminster Refinery and the commercial fuels business for the three and six months ended June 30, 2026, were $1.5 billion and $2.9 billion, respectively (2025 – $1.2 billion and $2.4 billion, respectively).
Revenues, Adjusted Gross Margin and Adjusted Refining Margin
Revenues increased in the three and six months ended June 30, 2026, compared with the same periods in 2025, primarily due to higher refined product pricing, mainly driven by an increase in diesel and synthetic crude oil pricing, partially offset by lower sales volumes due to the turnaround completed at the Upgrader in the second quarter of 2026. Sales from the Lloydminster Refinery are seasonal and increase during paving season, which typically runs from May through October each year.
Adjusted Gross Margin and Adjusted Refining Margin increased in the three and six months ended June 30, 2026, compared with 2025, primarily due to higher refined product pricing, as discussed above, and the widening of the WTI-WCS differential. The increases were partially offset by the turnaround completed at the Upgrader, which decreased distillate and synthetic crude oil production.
Operating Results
| | | | | | | | | | | | | | | | | | | | | | | |
| Three Months Ended June 30, | | Six Months Ended June 30, |
| (Mbbls/d, except where indicated) | 2026 | | 2025 | | 2026 | | 2025 |
| | | | | | | |
| | | | | | | |
| | | | | | | |
| | | | | | | |
| | | | | | | |
| | | | | | | |
| | | | | | | |
| | | | | | | |
| | | | | | | |
| | | | | | | |
| | | | | | | |
| | | | | | | |
Operable Capacity | 108.0 | | | 108.0 | | | 108.0 | | | 108.0 | |
| | | | | | | |
Total Processed Inputs | 110.4 | | | 120.7 | | | 117.4 | | | 120.1 | |
| | | | | | | |
| Crude Oil Unit Throughput | 101.7 | | | 112.4 | | | 108.5 | | | 112.2 | |
| | | | | | | |
Crude Unit Utilization (percent) | 94 | | | 104 | | | 100 | | | 104 | |
| | | | | | | |
Total Production | 118.7 | | | 129.0 | | | 125.6 | | | 127.6 | |
| Synthetic Crude Oil | 47.3 | | | 55.3 | | | 49.6 | | | 53.8 | |
| Asphalt | 17.4 | | | 16.7 | | | 17.6 | | | 16.6 | |
| Diesel | 12.3 | | | 15.1 | | | 14.6 | | | 15.3 | |
| Other | 36.7 | | | 36.9 | | | 38.5 | | | 37.3 | |
| Ethanol | 5.0 | | | 5.0 | | | 5.3 | | | 4.6 | |
| | | | | |
Cenovus Energy Inc. – Q2 2026 Management's Discussion and Analysis | 23 |
During the three and six months ended June 30, 2026, throughput and total production decreased compared with the same periods in 2025, due to the turnaround at the Upgrader, partially offset by our assets running reliably.
In the three and six months ended June 30, 2026, 10 percent and 11 percent, respectively, of our Oil Sands segment’s sales volumes were purchased by our Canadian Refining segment as a source of crude oil feedstock (2025 – 16 percent and 15 percent, respectively).
Operating Expenses (1)
| | | | | | | | | | | | | | | | | | | | | | | |
| Three Months Ended June 30, | | Three Months Ended June 30, |
| ($ millions, except where indicated) | 2026 | | 2025 | | 2026 | | 2025 |
| Operating Expenses – Upgrading and Refining | 124 | | | 117 | | | 249 | | | 234 | |
| | | | | | | |
| | | | | | | |
Per-Unit Operating Expenses (2) ($/bbl) | 12.33 | | | 10.70 | | | 11.71 | | | 10.75 | |
| | | | | | | |
| | | | | | | |
(1)Represents expenses associated with the Upgrader, the Lloydminster Refinery and the commercial fuels business.
(2)Specified financial measure. See the Specified Financial Measures Advisory of this MD&A.
Primary drivers of operating expenses in the first half of 2026 were repairs and maintenance, and workforce.
In the three and six months ended June 30, 2026, total operating expenses increased compared with the same periods in 2025, mainly due to higher repairs and maintenance, and GHG compliance costs. Per-unit operating expenses increased in the three and six months ended June 30, 2026, compared with 2025, due to higher operating expenses, as discussed above, and lower total processed inputs due to the turnaround at the Upgrader.
U.S. Refining
Financial Results
| | | | | | | | | | | | | | | | | | | | | | | |
| Three Months Ended June 30, | | Six Months Ended June 30, |
($ millions) | 2026 | | 2025 | | 2026 | | 2025 |
| | | | | | | |
| | | | | | | |
| | | | | | | |
| Revenues | 6,549 | | | 6,455 | | | 10,769 | | | 12,878 | |
| | | | | | | |
| | | | | | | |
| Purchased Product | 5,384 | | | 5,838 | | | 8,702 | | | 11,844 | |
Gross Margin (1) | 1,165 | | | 617 | | | 2,067 | | | 1,034 | |
| Expenses | | | | | | | |
| | | | | | | |
| Operating | 358 | | | 806 | | | 738 | | | 1,522 | |
| Realized (Gain) Loss on Risk Management | 36 | | | (11) | | | 25 | | | (5) | |
| Operating Margin | 771 | | | (178) | | | 1,304 | | | (483) | |
| Unrealized (Gain) Loss on Risk Management | (32) | | | — | | | (2) | | | (8) | |
| Depreciation, Depletion and Amortization | 113 | | | 149 | | | 225 | | | 307 | |
| Segment Income (Loss) | 690 | | | (327) | | | 1,081 | | | (782) | |
| | | | | | | |
| | | | | | | |
| | | | | | | |
| | | | | | | |
| | | | | | | |
| | | | | | | |
| | | | | | | |
| | | | | | | |
| | | | | | | |
| | | | | | | |
| | | | | | | |
| | | | | | | |
| | | | | | | |
| | | | | | | |
| | | | | | | |
| | | | | | | |
| | | | | | | |
| | | | | | | |
| | | | | | | |
| | | | | | | |
| | | | | | | |
(1)Non-GAAP financial measure. See the Specified Financial Measures Advisory of this MD&A.
| | | | | | | | | | | | | | | | | | | | | | | |
| Three Months Ended June 30, | | Six Months Ended June 30, |
| ($ millions, except where indicated) | 2026 | | 2025 | | 2026 | | 2025 |
| | | | | | | |
| | | | | | | |
| | | | | | | |
| Gross Margin | 1,165 | | | 617 | | | 2,067 | | | 1,034 | |
Add (Deduct): | | | | | | | |
Inventory Holding (Gain) Loss (1) | (152) | | | 62 | | | (609) | | | 85 | |
Adjusted Gross Margin (2) | 1,013 | | | 679 | | | 1,458 | | | 1,119 | |
| | | | | | | |
| | | | | | | |
Adjusted Refining Margin (2) ($/bbl) | 29.83 | | | 12.57 | | | 21.97 | | | 10.53 | |
| | | | | | | |
Weighted Average Crack Spread, Net of RINs (US$/bbl) | 32.15 | | | 15.80 | | | 20.46 | | | 12.63 | |
Weighted Average Crack Spread, Net of RINs (C$/bbl) | 44.46 | | | 21.86 | | | 28.18 | | | 17.79 | |
| | | | | | | |
| | | | | | | |
Adjusted Market Capture (2) (percent) | 67 | | | 58 | | | 78 | | | 59 | |
| | | | | | | |
| | | | | | | |
| | | | | | | |
| | | | | | | |
| | | | | | | |
| | | | | | | |
| | | | | | | |
| | | | | | | |
| | | | | | | |
| | | | | | | |
| | | | | | | |
| | | | | | | |
| | | | | | | |
| | | | | | | |
| | | | | | | |
| | | | | | | |
| | | | | | | |
| | | | | | | |
| | | | | | | |
| | | | | | | |
| | | | | | | |
(1)Inventory holding (gain) loss reflects the difference between the cost of volumes produced at current-period costs and the cost of volumes produced under the FIFO or weighted average cost basis, as required by IFRS Accounting Standards.
(2)Non-GAAP financial measure or contains a non-GAAP financial measure. See the Specified Financial Measures Advisory of this MD&A.
Revenues
Revenues decreased in the six months ended June 30, 2026, compared with 2025, primarily due to lower sales volumes as a result of the WRB Divestiture, partially offset by higher refined product pricing, mainly driven by strong distillate and gasoline pricing. In the second quarter of 2026, revenues increased compared with the second quarter of 2025, as the impacts of the WRB divestiture were more than offset by higher refined product pricing.
| | | | | |
Cenovus Energy Inc. – Q2 2026 Management's Discussion and Analysis | 24 |
Adjusted Gross Margin, Adjusted Refining Margin and Adjusted Market Capture
Adjusted Gross Margin increased in the three and six months ended June 30, 2026, compared with 2025, primarily due to:
•Strong refined product pricing and product yields.
•Safe and reliable operations across our refineries, while maximizing our ability to process heavy crude volumes and capture value from wider WTI-WCS differentials.
•No planned turnarounds in the first half of 2026. In the second quarter of 2025, we completed a turnaround at the Toledo Refinery which reduced throughput and refined product production.
•Portfolio optimization through the capture of regional synergies, supporting improved product yield realization and stronger pricing outcomes across the portfolio.
•Enhanced crude slate selection and refinery configuration to align with operational requirements, enabling increased margin capture.
This was partially offset by higher feedstock costs on domestic sweet crude barrels due to market volatility.
Adjusted Refining Margin increased in the three and six months ended June 30, 2026, compared with the same periods in 2025, reflecting higher Adjusted Gross Margin, increased weighted average crack spreads, net of RINs, and lower total processed inputs.
Our weighted average crack spread, net of RINs, increased in the three and six months ended June 30, 2026, primarily driven by the Chicago 3-2-1 crack spread, which increased 115 percent and 81 percent, respectively, compared with the same periods in 2025. The increases in market crack spreads were partially offset by higher RINs costs, with the average cost of RINs increasing 125 percent and 107 percent in the three and six months ended June 30, 2026, respectively, compared with 2025.
Adjusted Market Capture increased in the three and six months ended June 30, 2026, compared with 2025, due to wider WTI-WCS differentials, no turnaround activity in the first half of 2026 and high reliability, as discussed above.
Operating Results
| | | | | | | | | | | | | | | | | | | | | | | |
| Three Months Ended June 30, | | Six Months Ended June 30, |
| (Mbbls/d, except where indicated) | 2026 | | 2025 | | 2026 | | 2025 |
| | | | | | | |
| | | | | | | |
| | | | | | | |
| | | | | | | |
| | | | | | | |
| | | | | | | |
| | | | | | | |
| | | | | | | |
| | | | | | | |
| | | | | | | |
| | | | | | | |
| | | | | | | |
| | | | | | | |
| | | | | | | |
| | | | | | | |
| | | | | | | |
Operable Capacity (1) | 364.8 | | | 612.3 | | | 364.8 | | | 612.3 | |
| | | | | | | |
| Total Processed Inputs | 372.9 | | | 594.2 | | | 366.4 | | | 587.6 | |
| | | | | | | |
| Crude Oil Unit Throughput | 349.8 | | | 553.4 | | | 346.5 | | | 553.5 | |
| Heavy Crude Oil | 137.5 | | | 214.2 | | | 144.8 | | | 220.2 | |
| Light/Medium Crude Oil | 212.3 | | | 339.2 | | | 201.7 | | | 333.3 | |
| | | | | | | |
Crude Unit Utilization (percent) | 96 | | | 90 | | | 95 | | | 90 | |
| | | | | | | |
Total Refined Product Production | 379.6 | | | 600.4 | | | 378.2 | | | 598.2 | |
| Gasoline | 185.5 | | | 277.1 | | | 185.3 | | | 280.9 | |
Distillates (2) | 127.1 | | | 206.8 | | | 124.3 | | | 207.8 | |
| Asphalt | 12.4 | | | 24.3 | | | 14.6 | | | 25.0 | |
| Other | 54.6 | | | 92.2 | | | 54.0 | | | 84.5 | |
(1)Reported operable capacity reflects the impact of the WRB Divestiture completed on September 30, 2025.
(2)Includes diesel and jet fuel.
Throughput and refined product production decreased in the three and six months ended June 30, 2026, compared with 2025, primarily due to the WRB Divestiture, partially offset by safe and reliable operations across our assets, and no turnaround activity in the first half of 2026.
Operating Expenses
| | | | | | | | | | | | | | | | | | | | | | | |
| Three Months Ended June 30, | | Six Months Ended June 30, |
| ($ millions, except where indicated) | 2026 | | 2025 | | 2026 | | 2025 |
Operating Expenses | 358 | | | 806 | | | 738 | | | 1,522 | |
| | | | | | | |
| | | | | | | |
Per-Unit Operating Expenses (1) ($/bbl) | 10.55 | | | 14.92 | | | 11.13 | | | 14.31 | |
(1)Specified financial measure. See the Specified Financial Measures Advisory of this MD&A.
Primary drivers of operating expenses in the first half of 2026 were repairs and maintenance, and workforce.
Overall, operating expenses decreased in the three and six months ended June 30, 2026, compared with the same periods in 2025, due to the WRB Divestiture.
| | | | | |
Cenovus Energy Inc. – Q2 2026 Management's Discussion and Analysis | 25 |
Operating expenses and related per-unit metrics decreased across our operated assets in the three and six months ended June 30, 2026, compared with 2025, primarily attributable to higher operating expenses and lower total processed inputs in the second quarter of 2025, as a result of the turnaround completed at the Toledo Refinery.
CORPORATE AND ELIMINATIONS
Financial Results
| | | | | | | | | | | | | | | | | | | | | | | |
| Three Months Ended June 30, | | Six Months Ended June 30, |
| ($ millions) | 2026 | | 2025 | | 2026 | | 2025 |
| Realized (Gain) Loss on Risk Management | 19 | | | (20) | | | 27 | | | (25) | |
| Unrealized (Gain) Loss on Risk Management | (44) | | | (84) | | | 11 | | | (46) | |
| | | | | | | |
General and Administrative | 218 | | | 153 | | | 629 | | | 350 | |
| Finance Costs, Net | 181 | | | 114 | | | 375 | | | 250 | |
| Integration, Transaction and Other Costs | 36 | | | 77 | | | 68 | | | 79 | |
| Foreign Exchange (Gain) Loss, Net | 163 | | | (353) | | | 342 | | | (353) | |
| (Gain) Loss on Divestiture of Assets | (4) | | | (3) | | | (90) | | | (3) | |
| | | | | | | |
Other (Income) Loss, Net | (55) | | | (26) | | | (93) | | | (32) | |
General and Administrative
Primary drivers of our general and administrative expense in the three and six months ended June 30, 2026, were long-term incentive costs and workforce costs. General and administrative expenses increased in the three and six months ended June 30, 2026, compared with 2025, primarily due to higher long-term incentive costs as a result of changes in our common share price.
Finance Costs, Net
Net finance costs were higher in the three and six months ended June 30, 2026, compared with 2025, primarily due to increased interest expense from higher average debt and lower interest income. Refer to the Liquidity and Capital Resources section of this MD&A for further details on long-term debt.
The annualized weighted average interest rate on outstanding debt for the three and six months ended June 30, 2026, and 2025 was 4.5 percent.
Foreign Exchange (Gain) Loss, Net
| | | | | | | | | | | | | | | | | | | | | | | |
| Three Months Ended June 30, | | Six Months Ended June 30, |
| ($ millions) | 2026 | | 2025 | | 2026 | | 2025 |
| Unrealized Foreign Exchange (Gain) Loss | 237 | | | (420) | | | 417 | | | (401) | |
| Realized Foreign Exchange (Gain) Loss | (74) | | | 67 | | | (75) | | | 48 | |
| 163 | | | (353) | | | 342 | | | (353) | |
For the three and six months ended June 30, 2026, unrealized foreign exchange losses were primarily due to the translation of U.S. dollar denominated debt. As at June 30, 2026, the Canadian dollar weakened slightly relative to the U.S. dollar as at December 31, 2025. In the same period of 2025, the Canadian dollar strengthened.
Income Taxes
| | | | | | | | | | | | | | | | | | | | | | | |
| Three Months Ended June 30, | | Six Months Ended June 30, |
| ($ millions) | 2026 | | 2025 | | 2026 | | 2025 |
| Current Tax | | | | | | | |
| Canada | 674 | | | 224 | | | 1,153 | | | 503 | |
| United States | 35 | | | — | | | 41 | | | — | |
| Asia Pacific | 54 | | | 57 | | | 108 | | | 102 | |
| Other International | 8 | | | 11 | | | 16 | | | 24 | |
| Total Current Tax Expense (Recovery) | 771 | | | 292 | | | 1,318 | | | 629 | |
| Deferred Tax Expense (Recovery) | 301 | | | (127) | | | 268 | | | (193) | |
| 1,072 | | | 165 | | | 1,586 | | | 436 | |
For the six months ended June 30, 2026, we recorded current tax expense related to operations in all jurisdictions in which we operate. The increase in current tax expense is due to higher earnings compared with 2025. The effective tax rate for the six months ended June 30, 2026, was 26.3 percent, an increase from 20.3 percent in the same period of 2025.
| | | | | |
Cenovus Energy Inc. – Q2 2026 Management's Discussion and Analysis | 26 |
Tax interpretations, regulations and legislation in the various jurisdictions in which Cenovus and its subsidiaries operate are subject to change. We believe that our provision for income taxes is adequate. There are usually a number of tax matters under review, and with consideration of the current economic environment, income taxes are subject to measurement uncertainty. The timing of the recognition of income and deductions for the purpose of current tax expense is determined by relevant tax legislation.
| | |
|
LIQUIDITY AND CAPITAL RESOURCES |
Our capital allocation framework enables us to preserve our balance sheet, provide flexibility in both high and low commodity price environments, and deliver value to shareholders.
We expect to fund our near-term cash requirements through cash from operating activities, the prudent use of our cash and cash equivalents, and other sources of liquidity. Our other sources of liquidity include draws on our committed credit facility, draws on our uncommitted demand facilities, and other corporate and financial opportunities, which provide timely access to funding to supplement cash flow. The cost and availability of borrowing, and access to sources of liquidity and capital are dependent on current credit ratings and market conditions.
| | | | | | | | | | | | | | | | | | | | | | | |
| Three Months Ended June 30, | | Six Months Ended June 30, |
($ millions) | 2026 | | 2025 | | 2026 | | 2025 |
| Cash From (Used In) | | | | | | | |
| Operating Activities | 5,636 | | | 2,374 | | | 7,817 | | | 3,689 | |
| Investing Activities | (1,167) | | | (1,375) | | | (2,237) | | | (2,723) | |
| Net Cash Provided (Used) Before Financing Activities | 4,469 | | | 999 | | | 5,580 | | | 966 | |
| Financing Activities | (3,925) | | | (1,078) | | | (5,260) | | | (1,372) | |
| Effect of Foreign Exchange on Cash and Cash Equivalents | 51 | | | (126) | | | 110 | | | (124) | |
| Increase (Decrease) in Cash and Cash Equivalents | 595 | | | (205) | | | 430 | | | (530) | |
| | | | | | | |
| | | | | June 30, | | December 31, |
| As at ($ millions) | | | | | 2026 | | 2025 |
Cash and Cash Equivalents | | | | | 3,170 | | | 2,740 | |
Total Debt | | | | | 8,558 | | | 11,032 | |
Cash From (Used in) Operating Activities
In the three and six months ended June 30, 2026, cash from operating activities increased compared with the same periods in 2025, primarily due to increased Operating Margin, partially offset by an increase in income tax expense and changes in non-cash working capital.
For the three months ended June 30, 2026, changes in non-cash working capital increased cash from operating activities by $689 million, primarily due to higher income tax payable and lower accounts receivable, partially offset by higher inventories.
For the six months ended June 30, 2026, changes in non-cash working capital decreased cash from operating activities by $454 million, primarily due to higher inventories and accounts receivable, partially offset by higher income tax payable and accounts payable.
Cash From (Used in) Investing Activities
Cash used in investing activities decreased in the three and six months ended June 30, 2026, compared with 2025. Cash used in investing activities primarily relates to capital investment.
Cash From (Used in) Financing Activities
In the three and six months ended June 30, 2026, cash used in financing activities increased compared with 2025, primarily due to the repayment of the term loan facility in 2026 and higher share purchases under the Company’s NCIB.
Working Capital
Working capital as at June 30, 2026, was $4.6 billion (December 31, 2025 – $3.6 billion). The increase was primarily driven by higher inventories and accounts receivable, partially offset by an increase in income tax payable.
We anticipate that we will continue to meet our payment obligations as they come due.
| | | | | |
Cenovus Energy Inc. – Q2 2026 Management's Discussion and Analysis | 27 |
Short-Term Borrowings
As at June 30, 2026, the Company had uncommitted demand facilities of $1.5 billion (December 31, 2025 – $1.5 billion) in place, of which $1.4 billion may be drawn for general purposes, or the full amount may be available to issue letters of credit. There were no direct borrowings on our uncommitted demand facilities as at June 30, 2026, or December 31, 2025.
Long-Term Debt, Including Current Portion
| | | | | | | | | | | | | | |
| | June 30, | | December 31, |
| As at ($ millions) | | 2026 | | 2025 |
| Term Loan Facility | | — | | 2,700 |
U.S. Dollar Denominated Senior Unsecured Notes | | 6,104 | | 5,887 |
Canadian Dollar Senior Unsecured Notes | | 2,450 | | 2,450 |
| Total Debt Principal | | 8,554 | | 11,037 |
In the six months ended June 30, 2026, the Company fully repaid the $2.7 billion term loan facility. The term loan facility was subsequently cancelled.
As at June 30, 2026, we were in compliance with all of the terms of our debt agreements, which includes the terms of our committed credit facility. We are required to maintain a debt to capitalization ratio, as defined in the debt agreements, not to exceed 65 percent. We are below this limit.
Available Sources of Liquidity
The following sources of liquidity are available as at June 30, 2026:
| | | | | | | | | | | | | | | | | |
| ($ millions) | Maturity | | | | | | | | Amount Available |
| Cash and Cash Equivalents | n/a | | | | | | | | 3,170 | |
Committed Credit Facility (1) | | | | | | | | | |
Revolving Credit Facility – Tranche A | September 19, 2029 | | | | | | | | 3,300 | |
Revolving Credit Facility – Tranche B | September 19, 2028 | | | | | | | | 2,200 | |
| | | | | | | | | |
Uncommitted Demand Facilities (2) | n/a | | | | | | | | 1,081 | |
(1)No amount was drawn on the committed credit facility as at June 30, 2026 (December 31, 2025 – $nil).
(2)Represents amounts available for cash draws. Our uncommitted demand facilities include $1.5 billion, of which $1.4 billion may be drawn for general purposes, or the full amount can be available to issue letters of credit. As at June 30, 2026, there were outstanding letters of credit aggregating to $369 million (December 31, 2025 – $341 million) and no direct borrowings (December 31, 2025 – $nil).
As at June 30, 2026, the Company had in place a committed credit facility that consists of a $3.3 billion tranche maturing on September 19, 2029, and a $2.2 billion tranche maturing on September 19, 2028. As at June 30, 2026, no amount was drawn on the credit facility (December 31, 2025 – $nil).
Base Shelf Prospectus
On November 28, 2025, Cenovus filed a base shelf prospectus that allows the Company to offer, from time to time, debt securities, common shares, preferred shares, subscription receipts, warrants, share purchase contracts and units in Canada, the U.S. and elsewhere as permitted by law. The base shelf prospectus will expire in December 2028. Offerings under the base shelf prospectus are subject to market conditions on terms set forth in one or more prospectus supplements.
Financial Metrics
We monitor our capital structure and financing requirements using, among other things, Total Debt, Net Debt to Adjusted Funds Flow and Net Debt to Capitalization. Refer to Note 12 of the interim Consolidated Financial Statements for further details, including definitions and calculations of these metrics.
| | | | | | | | | | | | | |
| As at | June 30, 2026 | | December 31, 2025 | | |
Net Debt to Adjusted Funds Flow Ratio (times) | 0.4 | | 0.9 | | |
Net Debt to Capitalization Ratio (percent) | 14 | | | 21 | | | |
| | | | | |
Cenovus Energy Inc. – Q2 2026 Management's Discussion and Analysis | 28 |
We target a Net Debt to Adjusted Funds Flow ratio of approximately 1.0 times and Net Debt at or below $4.0 billion over the long-term at a WTI price of US$45.00 per barrel. These measures may fluctuate periodically outside this range due to factors such as persistently high or low commodity prices or the strengthening or weakening of the Canadian dollar relative to the U.S. dollar. Our objective is to maintain a high level of capital discipline and manage our capital structure to help ensure we have sufficient liquidity through all stages of the economic cycle. To ensure financial resilience, we may, among other actions, adjust capital and operating spending, steward working capital, draw down on our credit facilities or repay existing debt, adjust dividends paid to shareholders, purchase our common shares for cancellation, issue new debt, or issue new shares. Our Net Debt to Adjusted Funds Flow ratio and Net Debt to Capitalization ratio as at June 30, 2026, decreased compared with December 31, 2025, primarily as a result of higher Operating Margin and lower Net Debt. See the Operating and Financial Results section of this MD&A for more information on changes in Operating Margin and Net Debt.
Share Capital and Stock-Based Compensation Plans
Our common shares are listed on the Toronto Stock Exchange and New York Stock Exchange. As at June 30, 2026, there were approximately 1,849.5 million common shares outstanding (December 31, 2025 – 1,883.4 million common shares).
For the six months ended June 30, 2026, the employee benefit plan trust (the “Trust”), through an independent trustee, purchased 3.3 million common shares for a total of $109 million and distributed 3.8 million common shares for a total of $87 million under the employee benefit plan. As at June 30, 2026, there were 4.8 million common shares held by the Trust (December 31, 2025 – 5.3 million common shares). Refer to Note 15 of the interim Consolidated Financial Statements for further details.
On March 31, 2026, Cenovus exercised its right to redeem all 10.7 million of the Company’s series 1 preferred shares and all 1.3 million of the Company’s series 2 preferred shares. The preferred shares were redeemed at a price of $25.00 per share, for a total of $300 million. Following the redemptions on March 31, 2026, the Company no longer has preferred shares outstanding within its capital structure.
The common share purchase warrants expired on January 1, 2026. Refer to Note 15 of the interim Consolidated Financial Statements for further details.
Refer to Note 17 of the interim Consolidated Financial Statements for further details on our stock option plans and our performance share unit, restricted share unit and deferred share unit plans. Our outstanding share data is as follows:
| | | | | | | | | | | |
| As at July 24, 2026 | Units Outstanding (thousands) | | Units Exercisable (thousands) |
Common Shares | 1,844,245 | | n/a |
| | | |
| | | |
| | | |
Stock Options | 10,154 | | 3,834 |
| Other Stock-Based Compensation Plans | 20,466 | | 2,059 |
Returns to Shareholders
For a full discussion of our returns to shareholders target, refer to the Liquidity and Capital Resources section of our 2025 annual MD&A.
In the three months ended June 30, 2026, we returned $1.4 billion to shareholders, including $1.0 billion through the purchase of 26.2 million common shares under our NCIB program and $411 million through common share dividends.
In the six months ended June 30, 2026, we returned $2.5 billion to shareholders, including $1.4 billion through the purchase of 37.7 million common shares under our NCIB program, $790 million through common and preferred share dividends and $300 million for the redemption of the Company’s series 1 and 2 preferred shares.
The allocation of Excess Free Funds Flow to shareholder returns may be accelerated, deferred or reallocated between quarters at Management’s discretion.
Dividends
Common Share Dividends
In the three and six months ended June 30, 2026, we declared and paid base dividends of $411 million and $788 million, respectively, or $0.22 and $0.42 per common share, respectively (three and six months ended June 30, 2025 – $364 million and $691 million, respectively, or $0.20 and $0.38 per common share, respectively).
On July 28, 2026, the Board declared a third quarter base dividend of $0.22 per common share. The dividend is payable on September 29, 2026, to common shareholders of record as at September 15, 2026.
The declaration of common share dividends is at the sole discretion of the Board and is considered quarterly.
| | | | | |
Cenovus Energy Inc. – Q2 2026 Management's Discussion and Analysis | 29 |
Cumulative Redeemable Preferred Share Dividends
In the six months ended June 30, 2026, the Company paid preferred share dividends of $2 million (2025 – $10 million).
Share Repurchases
We have an NCIB program to purchase up to 120.3 million common shares from November 11, 2025, to November 10, 2026.
| | | | | | | | | | | | | | | | | | | | | | | |
| Three Months Ended June 30, | | Six Months Ended June 30, |
| 2026 | | 2025 | | 2026 | | 2025 |
Common Shares Purchased and Cancelled Under NCIB (millions of common shares) | 26.2 | | | 17.2 | | | 37.7 | | | 20.2 | |
Weighted Average Price per Common Share ($) | 38.16 | | | 17.12 | | | 35.77 | | | 17.64 | |
Purchase of Common Shares Under NCIB ($ millions) | 1,019 | | | 301 | | | 1,375 | | | 363 | |
From July 1, 2026, to July 24, 2026, the Company purchased an additional 5.6 million common shares for $213 million. As at July 24, 2026, the Company can further purchase up to 69.6 million common shares under the NCIB.
Contractual Commitments and Obligations
We have obligations for goods and services entered into in the normal course of business. Obligations that have original maturities of less than one year are excluded from our total commitments disclosed below. For further information, see Note 22 of the interim Consolidated Financial Statements.
Our total commitments were $49.7 billion as at June 30, 2026 (December 31, 2025 – $39.7 billion), of which $47.0 billion are for various transportation and storage commitments. Transportation commitments include $19.1 billion that are subject to regulatory approval or were approved but are not yet in service. Terms are up to 20 years on commencement.
As at June 30, 2026, our total commitments included commitments with Husky Midstream Limited Partnership (“HMLP”) of $1.7 billion related to long-term transportation and storage commitments (December 31, 2025 – $1.7 billion).
As at June 30, 2026, outstanding letters of credit issued as security for performance under certain contracts totaled $369 million (December 31, 2025 – $341 million).
Legal Proceedings
We are involved in a limited number of legal claims associated with the normal course of operations. We believe that any liabilities that might arise from such matters, to the extent not provided for, are not likely to have a material effect on our interim Consolidated Financial Statements.
Transactions with Related Parties
Husky Midstream Limited Partnership
The Company holds a 35 percent interest in, and is the operator of, HMLP. The Company charges HMLP for construction and management services, and incurs costs for the use of HMLP’s pipeline systems, as well as transportation and storage services. Access fees and transportation and storage services are based on contractually agreed rates with HMLP.
The following table summarizes revenues and associated expenses related to HMLP:
| | | | | | | | | | | | | | | | | | | | | | | |
| Three Months Ended June 30, | | Six Months Ended June 30, |
| ($ millions) | 2026 | | 2025 | | 2026 | | 2025 |
| Revenues from Construction and Management Services | 43 | | 37 | | 76 | | 66 |
| Transportation Expenses | 70 | | 69 | | 135 | | 137 |
| | |
|
RISK MANAGEMENT AND RISK FACTORS |
For a full understanding of the risks that impact us, the following discussion should be read in conjunction with the Risk Management and Risk Factors section of our 2025 annual MD&A.
We are exposed to a number of risks through the pursuit of our strategic objectives. Some of these risks impact the energy industry as a whole and others are unique to our operations. The impact of any risk or a combination of risks may adversely affect, among other things, our business, reputation, financial condition, results of operations and cash flows, which may, without limitation, reduce or restrict our ability to pursue our strategic priorities, meet our targets or outlooks, goals, initiatives and ambitions, respond to changes in our operating environment, repurchase our shares, pay dividends to our shareholders and fulfill our obligations (including debt servicing requirements) and may materially affect the market price of our securities.
| | | | | |
Cenovus Energy Inc. – Q2 2026 Management's Discussion and Analysis | 30 |
| | |
|
CRITICAL ACCOUNTING JUDGMENTS, ESTIMATION UNCERTAINTIES AND ACCOUNTING POLICIES |
Management is required to make estimates and assumptions, as well as use judgment, in the application of accounting policies that could have a significant impact on our financial results. Actual results may differ from estimates and those differences may be material. The estimates and assumptions used are subject to updates based on experience and the application of new information. Our material accounting policies are reviewed annually by the Audit Committee of the Board. Further details on the basis of preparation and our material accounting policies can be found in the notes to the Consolidated Financial Statements for the year ended December 31, 2025.
Critical Judgments in Applying Accounting Policies and Key Sources of Estimation Uncertainty
Critical judgments are those judgments made by Management in the process of applying accounting policies that have the most significant effect on the amounts recorded in our annual and interim Consolidated Financial Statements. A full list of the critical judgments used in applying accounting policies and key sources of estimation uncertainty can be found in the notes to the Consolidated Financial Statements for the year ended December 31, 2025.
Update to Accounting Policies
Effective January 1, 2026, the Company adopted the amendments to IFRS 9, “Financial Instruments” (“IFRS 9”) and IFRS 7, “Financial Instruments: Disclosures” (“IFRS 7”). The amendments clarify the derecognition of financial liabilities and the classification of certain financial assets. The adoption of the amendments to IFRS 9 and IFRS 7 did not have a material impact on the Company’s interim Consolidated Financial Statements.
New Accounting Standards and Interpretations Not Yet Adopted
On April 9, 2024, the IASB issued IFRS 18, “Presentation and Disclosure in Financial Statements” (“IFRS 18”), which will replace International Accounting Standard 1, “Presentation of Financial Statements”. IFRS 18 will establish a revised structure for the Consolidated Statements of Comprehensive Income (Loss), including new defined subtotals, enhanced principles on aggregation and disaggregation, and additional disclosure requirements related to management-defined performance measures (“MPMs”). The objective of the standard is to improve comparability across entities and reporting periods. IFRS 18 will not impact recognition or measurement of income and expenses.
Cenovus has executed a parallel system environment to reflect the new presentation requirements. The changes will primarily reflect a re-mapping of line items on the Consolidated Statements of Comprehensive Income (Loss) to newly defined categories. Items such as foreign exchange gains and losses will require segregation. The primary impact on the Consolidated Statements of Cash Flows will be the movement of certain finance costs from operating activities to financing activities. The Company has also identified Operating Margin as an MPM. The Company will continue to evaluate the impacts until adoption on January 1, 2027. The standard will be applied retrospectively, with certain transition provisions.
Management, including our President & Chief Executive Officer and Executive Vice-President & Chief Financial Officer, assessed the design and effectiveness of Internal Control Over Financial Reporting (“ICFR”) and Disclosure Controls and Procedures (“DC&P”) as at June 30, 2026. In making its assessment, Management used the Committee of Sponsoring Organizations of the Treadway Commission Framework in Internal Control – Integrated Framework (2013) to evaluate the design and effectiveness of ICFR. Based on our evaluation, Management has concluded that both ICFR and DC&P were effective as at June 30, 2026.
On November 13, 2025, Cenovus completed the MEG Acquisition. As permitted by, and in accordance with, National Instrument 52‑109, “Certification and Disclosure in Issuers’ Annual and Interim Filings”, and guidance issued by the U.S. Securities and Exchange Commission, Management has limited the scope and design of ICFR and DC&P to exclude the controls, policies and procedures in respect of the business acquired from MEG. Such scope limitation is primarily due to the time required for Management to assess the ICFR and DC&P relating to the business acquired from MEG in a manner consistent with our other operations. Further integration will take place throughout the remainder of 2026 as processes and systems align.
Assets attributable to MEG as at June 30, 2026, represented approximately 15 percent of Cenovus’s total assets. For the three and six months ended June 30, 2026, revenues attributable to MEG represented approximately eight percent of Cenovus’s total revenues.
Internal control systems, no matter how well designed, have inherent limitations. Therefore, even those systems determined to be effective can provide only reasonable assurance with respect to financial statement preparation and presentation. Also, projections of any evaluation of effectiveness to future periods are subject to the risk that controls may become inadequate because of changes in conditions, or that the degree of compliance with the policies or procedures may deteriorate.
| | | | | |
Cenovus Energy Inc. – Q2 2026 Management's Discussion and Analysis | 31 |
Oil and Gas Information
Barrels of Oil Equivalent – natural gas volumes are converted to BOE on the basis of six Mcf to one bbl. BOE may be misleading, particularly if used in isolation. A conversion ratio of one bbl to six Mcf is based on an energy equivalency conversion method primarily applicable at the burner tip and does not represent value equivalency at the wellhead. Given that the value ratio based on the current price of crude oil compared with natural gas is significantly different from the energy equivalency conversion ratio of 6:1, utilizing a conversion on a 6:1 basis is not an accurate reflection of value.
Light crude oil – Light crude oil corresponds to light crude oil and medium crude oil combined as defined by National Instrument 51-101 “Standards of Disclosure for Oil and Gas Activities” (“NI 51-101”). Cenovus does not produce medium crude oil.
Forward-looking Information
This document contains forward-looking statements and other information (collectively “forward-looking information”) about the Company’s current expectations, estimates and projections, made in light of the Company’s experience and perception of historical trends. Although the Company believes that the expectations represented by such forward-looking information are reasonable, there can be no assurance that such expectations will prove to be correct.
This forward-looking information is identified by words such as “advance”, “allocate”, “anticipate”, “believe”, “commit”, “continue”, “could”, “deliver”, “expect”, “F”, “focus”, “future”, “growth”, “impact”, “maintain”, “may”, “mitigate”, “on track”, “objective”, “ongoing”, “opportunities”, “optimization”, “potential”, “priority”, “progress”, “steward”, “target”, and “will”, or similar expressions and includes suggestions of future outcomes, including, but not limited to, statements about: our strategic objectives; shareholder returns; commitment to safety and strengthening our safety record while maintaining reliable operations throughout our portfolio; capital allocation framework enabling us to preserve our balance sheet, provide flexibility in both high and low commodity price environments and deliver value to shareholders; our physically and economically integrated upstream and downstream operations helping us mitigate the impact of volatility in light-heavy crude oil price differentials and contribute to our net earnings by capturing value from crude oil, natural gas and NGLs production through the sale of finished products such as transportation fuels; market and commodity price volatility and stability; price alignment and volatility management strategies; dividends; liquidity; funding our near-term cash requirements through cash from operating activities, the prudent use of our cash and cash equivalents, and other sources of liquidity; our 2026 corporate guidance; factors influencing commodity price outlook; the impact of the global trade war and geopolitical tensions, including the status of the Strait of Hormuz; allocating Excess Free Funds Flow to shareholder returns; progressing growth initiatives, including the Christina Lake North expansion project and remaining on track to deliver first oil at West White Rose late in the third quarter of 2026; continued success from the redevelopment and sustaining programs at Sunrise; heavy oil refining capacity allows us to capture value from both the WTI-WCS differential for Canadian crude oil and spreads on refined products monitoring market fundamentals, and optimizing run rates at our refineries; safe and reliable operations; being best-in-class operators; maintaining a strong balance sheet; costs; margins; provision for income taxes; funding near-term cash requirements; credit ratings; meeting payment obligations; general outlook for crude oil and refined product prices; price volatility and geopolitical risks, including related to OPEC+ policy, the U.S-Iran conflict, the pace at which Middle East producers are able to bring back curtailed supply and the risk of a tariff-induced global economic slowdown that could slow oil demand; impact of future policy decisions, including small refinery exemption waivers, reallocation of exempted volumes and policies around imported biofuel RINs generation, on RINs prices; possibility of continued fluctuations for light crude differentials relative to the WTI average with volatility in the forward curve structure; impact of current and future economic and trade arrangements between Canada and the U.S.; advancing the proposed Pathways Project as outlined in the MOU, which is subject to execution of definitive agreements and regulatory approvals; continuing to execute our capital program, including $3.5 billion to $3.6 billion directed towards sustaining capital to maintain base production and support continued safe and reliable operations, and between $1.2 billion and $1.4 billion directed towards growth projects; continued focus on liquids-rich production; Net Debt to Adjusted Funds Flow and Net Debt to Capitalization ratios; maintaining capital discipline to ensure sufficient liquidity; financial resilience; liabilities from legal proceedings; transportation and storage commitments; and the Company’s outlook for commodities and the Canadian dollar, the factors that affect such outlook, and the influences and effects on Cenovus.
Readers are cautioned not to place undue reliance on forward-looking information as the Company’s actual results may differ materially from those expressed or implied. Developing forward-looking information involves reliance on a number of assumptions and consideration of certain risks and uncertainties, some of which are specific to the Company and others that apply to the industry generally. The factors or assumptions on which the forward-looking information is based include, but are not limited to: forecast bitumen, crude oil and natural gas, NGLs, condensate and refined products prices, and light-heavy and light-medium crude oil price differentials; the Company’s ability to realize the anticipated benefits of acquisitions; the accuracy of any assessments undertaken in connection with acquisitions; forecast production and crude throughput volumes and timing thereof; forecast prices and costs, projected capital investment levels, the flexibility of capital spending plans and associated sources of funding; the absence of significant adverse changes to government policies, legislation and regulations (including related to climate change Indigenous relations, title or rights claims, royalty regimes, interest rates, inflation, foreign exchange rates, global economic activity, competitive conditions, trade sanctions, restrictive trade measures or countermeasures, and the supply and demand for bitumen, crude oil and natural gas, NGLs, condensate and refined products and the political, economic
| | | | | |
Cenovus Energy Inc. – Q2 2026 Management's Discussion and Analysis | 32 |
and social stability of jurisdictions in which the Company operates; the absence of significant disruption of operations, including as a result of harsh weather, natural disaster, accident, third-party actions, civil unrest or other similar events; the prevailing climatic conditions in the Company’s operating locations; achievement of further cost reductions and sustainability thereof; applicable royalty regimes, including expected royalty rates; future improvements in availability of product transportation capacity; increase to the Company’s share price and market capitalization over the long-term; opportunities to purchase shares for cancellation at prices acceptable to the Company; the Company’s ability to use financial risk management activities and physical positions to manage its exposure to fluctuations in commodity prices and, foreign exchange and interest rates, optimize supply costs or sales of production; the Company’s ability to use fixed-price commitments for the purchase or sale of commodities; the sufficiency of cash balances, internally generated cash flows, existing credit facilities, management of the Company’s asset portfolio and access to capital and insurance coverage to pursue and fund future investments and development plans and dividends, including any increase thereto; realization of expected capacity to store within the Company’s oil sands reservoirs barrels not yet produced, including that the Company will be able to time production and sales of its inventory at later dates when demand has increased, pipeline and/or storage capacity has improved and future crude oil differentials have narrowed; the WTI-WCS differential at Hardisty remains largely tied to global supply factors and heavy crude oil processing capacity, as long as supply does not exceed Canadian crude oil export capacity; the Company’s ability to produce from oil sands facilities on an unconstrained basis; estimates of quantities of oil, bitumen, NGLs from properties and other sources not currently classified as proved; the accuracy of accounting estimates and judgments; the Company’s ability to obtain necessary regulatory and partner approvals; the successful, timely and cost effective implementation of capital projects, development projects or stages thereof; the Company’s ability to meet current and future obligations; estimated abandonment and reclamation costs, including associated levies and regulations applicable thereto; the Company’s ability to obtain and retain qualified staff and equipment in a timely and cost-efficient manner; the Company’s ability to complete acquisitions and divestitures, including with desired transaction metrics and within expected timelines; the accuracy of climate scenarios and assumptions, including third-party data on which the Company relies; ability to access and implement all technology and equipment necessary to achieve expected future results, including in respect of sustainability commitments and the Pathways Project, and the commercial viability and scalability of related technology and products; expected benefits of investments in sustainability focus areas; collaboration with the government, Oil Sands Alliance and other industry organizations; market and business conditions; forecast inflation and other assumptions inherent in the Company’s 2026 guidance available on cenovus.com and as set out below; and other risks and uncertainties described from time to time in the filings the Company makes with securities regulatory authorities.
2026 guidance dated July 28, 2026, and available on cenovus.com, assumes: Brent prices of US$80.00 per barrel, WTI prices of US$75.00 per barrel; WCS of US$61.00 per barrel; Differential WTI-WCS of US$14.00 per barrel; AECO natural gas prices of $2.00 per Mcf; Chicago 3-2-1 crack spread of US$34.00 per barrel; RINs of US$14.00 per barrel; and an exchange rate of $0.72 US$/C$.
The risk factors and uncertainties that could cause the Company’s actual results to differ materially from the forward-looking information, include, but are not limited to: the Company’s ability to realize the anticipated benefits of acquisitions in a timely manner or at all; the Company’s ability to successfully integrate acquired business with its own in a timely and cost effective manner or at all; unforeseen or underestimated liabilities associated with acquisitions; risks associated with acquisitions and divestitures; the Company’s ability to access or implement some or all of the technology necessary to efficiently and effectively operate its assets and achieve expected future results including in respect of sustainability commitments and the Pathways Project and the commercial viability and scalability of related technology and products; the effect of new significant shareholders; volatility of and other assumptions regarding commodity prices; the duration and impact of any market downturn; the Company’s ability to integrate upstream and downstream operations to help mitigate the impact of volatility in light-heavy crude oil differentials and contribute to its net earnings; foreign exchange risk, including related to agreements denominated in foreign currencies; the Company’s continued liquidity being sufficient to sustain operations through a prolonged market downturn; WTI-WCS differential at Hardisty does not remain largely tied to global supply factors and heavy crude processing capacity; the Company’s ability to realize the expected impacts of its capacity to store within its oil sands reservoirs barrels not yet produced, including possible inability to time production and sales at later dates when pipeline and/or storage capacity and crude oil differentials have improved; the effectiveness of the Company’s risk management program; the accuracy of the Company’s outlook for commodity prices and currency and interest rates; changes in laws or enforcement of existing laws, exchange rate fluctuations, trade disputes, trade agreements or treaties, new or increased tariffs, economic sanctions and other restrictive trade measures or countermeasures, and responses thereto; product supply and demand; the accuracy of the Company’s share price and market capitalization assumptions; market competition, including from alternative energy sources; risks inherent in the Company’s marketing operations, including credit risks, exposure to counterparties and partners, including the ability and willingness of such parties to satisfy contractual obligations in a timely manner; risks inherent in the operation of the Company’s crude-by-rail terminal, including health, safety and environmental risks; the Company’s ability to maintain a desirable Net Debt to Adjusted Funds Flow ratio; the Company’s ability to access various sources of debt and equity capital, generally, and on acceptable terms; the Company’s ability to finance growth and sustaining capital expenditures; the ability to complete and optimize drilling, completion, tie in and infrastructure projects; the ability of the Company to ramp-up activities at its refineries on its anticipated timelines; changes in credit ratings applicable to the Company
| | | | | |
Cenovus Energy Inc. – Q2 2026 Management's Discussion and Analysis | 33 |
or any of its securities; changes to the Company’s dividend plans; the Company’s ability to utilize tax losses in the future; tax audits and reassessments; the accuracy of the Company’s reserves, future production and future net revenue estimates; the accuracy of factors influencing decisions on the priority and timing of development of undeveloped reserves; potential disruptions and risks associated with the adoption, development and integration of AI; the accuracy of the Company’s accounting estimates and judgements; the Company’s ability to replace and expand crude oil and natural gas reserves; the costs to acquire exploration rights, undertake geological studies, appraisal drilling and project developments; potential requirements under applicable accounting standards for impairment or reversal of estimated recoverable amounts of some or all of the Company’s assets or goodwill from time to time; the Company’s ability to maintain its relationships with its partners and to successfully manage and operate its integrated operations and business; reliability of the Company’s assets including in order to meet production targets; potential disruption or unexpected technical difficulties in developing new products and refining processes; the occurrence of unexpected events resulting in operational interruptions, including at facilities operated by our partners or third parties, such as blowouts, fires, explosions, railcar incidents or derailments, aviation incidents, iceberg collisions, gaseous leaks, migration of harmful substances, loss of containment, releases or spills, including releases or spills from offshore facilities and shipping vessels at terminals or hubs and as a result of pipeline or other leaks, corrosion, epidemics and pandemics; and catastrophic events, including, but not limited to, war, adverse sea conditions, extreme weather events, natural disasters, acts of activism, vandalism and terrorism, and other accidents or hazards that may occur at or during transport to or from commercial or industrial sites and other accidents or similar events; refining and marketing margins; cost escalations, including inflationary pressures on operating costs, such as labour, materials, natural gas and other energy sources used in oil sands processes and downstream operations and increased insurance deductibles or premiums; the cost and availability of equipment necessary to the Company’s operations; potential failure of products to achieve or maintain acceptance in the market; risks associated with the energy industry’s and the Company’s reputation, social licence to operate and litigation related thereto; legal challenges or opposition to infrastructure projects associated with Indigenous title or other rights claims; unexpected cost increases or technical difficulties in operating, constructing or modifying refining or refining facilities; unexpected difficulties in producing, transporting or refining bitumen and/or crude oil into petroleum and chemical products; risks associated with technology and equipment and its application to the Company’s business, including potential cyberattacks; geo-political and other risks associated with the Company’s international operations; risks associated with climate change and the Company’s assumptions relating thereto; the timing and the costs of well and pipeline construction; the Company’s ability to access markets and to secure adequate and cost effective product transportation including sufficient pipeline, crude-by-rail, marine or alternate transportation, including to address any gaps caused by constraints in the pipeline system or storage capacity; availability of, and the Company’s ability to attract and retain, critical talent and integrate new personnel acquired in transactions; possible failure to obtain and retain qualified leadership and personnel, and equipment in a timely and cost efficient manner; changes in labour demographics and relationships, including with any unionized workforces; unexpected abandonment and reclamation costs; changes in the regulatory frameworks, permits and approvals in any of the locations in which the Company operates or to any of the infrastructure upon which it relies; climate change-related regulatory, climactic transition risks; failure to achieve our sustainability goals, or a perception among key stakeholders that our actions or goals are insufficient or unattainable; government actions or regulatory initiatives to curtail energy operations or pursue broader climate change agendas; changes to regulatory approval processes and land use designations, royalty, tax, environmental, GHG, carbon, climate change and other laws or regulations, or changes to the interpretation of such laws and regulations, as adopted or proposed, the impact thereof and the costs associated with compliance; the expected impact and timing of various accounting pronouncements, rule changes and standards on the Company’s business, its financial results and Consolidated Financial Statements; changes in general economic, market and business conditions; OPEC+ policy; actions of OPEC and non-OPEC members, including compliance or non-compliance with agreed upon quotas and decisions to impose production quotas; the political, social and economic conditions in the jurisdictions in which the Company operates or supplies; the status of the Company’s relationships with the communities in which it operates, including with Indigenous communities; the occurrence of unexpected events such as protests, pandemics, war, terrorist threats and the instability resulting therefrom; and risks associated with existing and potential future lawsuits, shareholder proposals and regulatory actions against the Company. In addition, there are risks that the effect of actions taken by us in attempting to achieve goals for sustainability focus areas may have a negative impact on our existing business, growth plans and future results from operations, or that the benefits may be less than expected.
Except as required by applicable securities laws, Cenovus disclaims any intention or obligation to publicly update or revise any forward‐looking statements, whether as a result of new information, future events or otherwise. Readers are cautioned that the foregoing lists are not exhaustive and are made as at the date hereof. Events or circumstances could cause our actual results to differ materially from those estimated or projected and expressed in, or implied by, the forward-looking information. For a full discussion of the Company’s material risk factors, see Risk Management and Risk Factors in the Company’s most recently filed annual MD&A, and the risk factors described in other documents the Company files from time to time with securities regulatory authorities in Canada, available on SEDAR+ at sedarplus.ca, and with the U.S. Securities and Exchange Commission on EDGAR at sec.gov, and on the Company’s website at cenovus.com.
Information on or connected to the Company’s website at cenovus.com does not form part of this MD&A unless expressly incorporated by reference herein.
| | | | | |
Cenovus Energy Inc. – Q2 2026 Management's Discussion and Analysis | 34 |
ABBREVIATIONS AND DEFINITIONS
Abbreviations
The following abbreviations and definitions are used in this document:
| | | | | | | | | | | | | | | | | |
| Crude Oil and NGLs | Natural Gas | Other |
| | | | | |
| bbl | barrel | Mcf | thousand cubic feet | BOE | barrel of oil equivalent |
| Mbbls/d | thousand barrels per day | MMcf | million cubic feet | MBOE/d | thousand barrels of oil
equivalent per day |
| MMbbls | million barrels | MMcf/d | million cubic feet per day | MMBOE | million barrels of oil equivalent |
| WCS | Western Canadian Select | Bcf | billion cubic feet | DD&A | depreciation, depletion and
amortization |
| WTI | West Texas Intermediate | | | GHG | greenhouse gas |
| | | | FPSO | floating production, storage and
offloading vessel |
| | | | NCIB | normal course issuer bid |
| | | | AECO | Alberta Energy Company |
| | | | NYMEX | New York Mercantile Exchange |
| | | | OPEC | Organization of Petroleum
Exporting Countries |
| | | | OPEC+ | OPEC and a group of 11
non-OPEC members |
| | | | PADD II | Petroleum Administration for
Defense District II |
| | | | USGC | U.S. Gulf Coast |
| | | | | |
Cenovus Energy Inc. – Q2 2026 Management's Discussion and Analysis | 35 |
SPECIFIED FINANCIAL MEASURES
Certain financial measures in this document do not have a standardized meaning as prescribed by IFRS Accounting Standards including Operating Margin, Operating Margin by asset, Adjusted Funds Flow, Adjusted Funds Flow Per Share – Basic, Adjusted Funds Flow Per Share – Diluted, Free Funds Flow, Excess Free Funds Flow, Realized Sales Price, Conventional, Offshore and Asia Pacific Per-Unit Operating Expenses, Netbacks (including the total Netback per BOE), Gross Margin, Adjusted Gross Margin, Adjusted Refining Margin and Adjusted Market Capture.
These measures may not be comparable to similar measures presented by other issuers. These measures are described and presented in order to provide shareholders and potential investors with additional measures for analyzing our ability to generate funds to finance our operations and information regarding our liquidity. This additional information should not be considered in isolation, or as a substitute for, measures prepared in accordance with IFRS Accounting Standards. The definition and reconciliation, if applicable, of each specified financial measure is presented in this Advisory and may also be presented in the Operating and Financial Results section of this MD&A. Refer to the Specified Financial Measures Advisory of the relevant period’s MD&A for reconciliations of Operating Margin, Adjusted Funds Flow, Free Funds Flow and Excess Free Funds Flow for prior period information from 2025 and 2024 that is not found below.
Non-GAAP Financial Measures and Non-GAAP Ratios
Operating Margin
Operating Margin and Operating Margin by asset are non-GAAP financial measures, and Operating Margin for upstream or downstream operations are specified financial measures. These are used to provide a consistent measure of the cash-generating performance of our operations and assets for comparability of our underlying financial performance between periods. Operating Margin is defined as revenues less purchased product, transportation and blending expenses, operating expenses, plus realized gains less realized losses on risk management activities. Items within the Corporate and Eliminations segment are excluded from the calculation of Operating Margin. The following tables provide a reconciliation to our interim Consolidated Financial Statements.
Operating Margin
| | | | | | | | | | | | | | | | | | | | | | | | | | | | | | | | | | | |
| Three Months Ended June 30, |
| 2026 | | 2025 | | 2026 | | 2025 | | 2026 | | 2025 |
| ($ millions) | Upstream (1) | | Downstream (1) | | Total |
| Gross Sales | | | | | | | | | | | |
| External Sales | 11,356 | | 5,409 | | 7,732 | | 7,531 | | 19,088 | | 12,940 |
Intersegment Sales | 2,875 | | 1,985 | | 425 | | 212 | | 3,300 | | 2,197 |
| 14,231 | | 7,394 | | 8,157 | | 7,743 | | 22,388 | | 15,137 |
Royalties | (1,661) | | (621) | | — | | — | | (1,661) | | (621) |
| Revenues | 12,570 | | 6,773 | | 8,157 | | 7,743 | | 20,727 | | 14,516 |
| Expenses | | | | | | | | | | | |
Purchased Product | 2,074 | | 1,111 | | 6,663 | | 6,878 | | 8,737 | | 7,989 |
Transportation and Blending | 4,582 | | 2,621 | | — | | — | | 4,582 | | 2,621 |
Operating | 971 | | 896 | | 505 | | 947 | | 1,476 | | 1,843 |
| Realized (Gain) Loss on Risk Management | 28 | | 8 | | 36 | | (11) | | 64 | | (3) |
| Operating Margin | 4,915 | | 2,137 | | 953 | | (71) | | 5,868 | | 2,066 |
(1)Found in Note 1 of the interim Consolidated Financial Statements.
| | | | | |
Cenovus Energy Inc. – Q2 2026 Management's Discussion and Analysis | 36 |
| | | | | | | | | | | | | | | | | | | | | | | | | | | | | | | | | | | |
| Six Months Ended June 30, |
| 2026 | | 2025 | | 2026 | | 2025 | | 2026 | | 2025 |
| ($ millions) | Upstream (1) | | Downstream (1) | | Total |
| Gross Sales | | | | | | | | | | | |
| External Sales | 19,365 | | 12,207 | | 13,062 | | 14,938 | | 32,427 | | 27,145 |
Intersegment Sales | 5,236 | | 4,439 | | 722 | | 510 | | 5,958 | | 4,949 |
| 24,601 | | 16,646 | | 13,784 | | 15,448 | | 38,385 | | 32,094 |
Royalties | (2,644) | | (1,527) | | — | | — | | (2,644) | | (1,527) |
| Revenues | 21,957 | | 15,119 | | 13,784 | | 15,448 | | 35,741 | | 30,567 |
| Expenses | | | | | | | | | | | |
Purchased Product | 3,318 | | 2,278 | | 11,041 | | 13,960 | | 14,359 | | 16,238 |
Transportation and Blending | 7,957 | | 5,868 | | — | | — | | 7,957 | | 5,868 |
Operating | 2,018 | | 1,789 | | 1,031 | | 1,801 | | 3,049 | | 3,590 |
| Realized (Gain) Loss on Risk Management | 41 | | (1) | | 25 | | (5) | | 66 | | (6) |
| Operating Margin | 8,623 | | 5,185 | | 1,687 | | (308) | | 10,310 | | 4,877 |
| | | | | | | | | | | |
(1)Found in Note 1 of the interim Consolidated Financial Statements.
Operating Margin by Asset
| | | | | | | | | | | | | | | | | | | | | | | | | | | | | | | | | | | |
| Three Months Ended June 30, 2026 | | Six Months Ended June 30, 2026 |
| ($ millions) | Atlantic | | Asia Pacific | | Offshore (1) | | Atlantic | | Asia Pacific | | Offshore (1) |
| Gross Sales | 218 | | 292 | | 510 | | 470 | | 589 | | 1,059 |
Royalties | (2) | | (22) | | (24) | | (4) | | (45) | | (49) |
| Revenues | 216 | | 270 | | 486 | | 466 | | 544 | | 1,010 |
| Expenses | | | | | | | | | | | |
| Purchased Product | (4) | | — | | (4) | | — | | — | | — |
Transportation and Blending | 7 | | — | | 7 | | 14 | | — | | 14 |
Operating | 79 | | 29 | | 108 | | 161 | | 58 | | 219 |
| Operating Margin | 134 | | 241 | | 375 | | 291 | | 486 | | 777 |
| | | | | | | | | | | | | | | | | | | | | | | | | | | | | | | | | | | |
| Three Months Ended June 30, 2025 | | Six Months Ended June 30, 2025 |
| ($ millions) | Atlantic | | Asia Pacific | | Offshore (1) | | Atlantic | | Asia Pacific | | Offshore (1) |
| Gross Sales | 72 | | 263 | | 335 | | 218 | | 568 | | 786 |
Royalties | — | | (20) | | (20) | | (2) | | (43) | | (45) |
| Revenues | 72 | | 243 | | 315 | | 216 | | 525 | | 741 |
| Expenses | | | | | | | | | | | |
| Purchased Product | — | | — | | — | | — | | — | | — |
Transportation and Blending | 3 | | — | | 3 | | 9 | | — | | 9 |
Operating | 48 | | 33 | | 81 | | 112 | | 58 | | 170 |
| Operating Margin | 21 | | 210 | | 231 | | 95 | | 467 | | 562 |
(1)Found in Note 1 of the interim Consolidated Financial Statements.
Adjusted Funds Flow, Free Funds Flow and Excess Free Funds Flow
Adjusted Funds Flow is a non-GAAP financial measure commonly used in the oil and gas industry to assist in measuring a company’s ability to finance its capital programs and meet its financial obligations, in total and on a per-share basis. Adjusted Funds Flow is defined as cash from (used in) operating activities, excluding settlement of decommissioning liabilities and net change in operating non-cash working capital. Operating non-cash working capital is composed of accounts receivable and accrued revenues, income tax receivable, inventories (excluding non-cash inventory write-downs and reversals), accounts payable and accrued liabilities, and income tax payable. Adjusted Funds Flow Per Share – Basic is defined as Adjusted Funds Flow divided by the basic weighted average number of shares. Adjusted Funds Flow Per Share – Diluted is defined as Adjusted Funds Flow divided by the diluted weighted average number of shares.
Free Funds Flow is a non-GAAP financial measure used to assist in measuring the available funds the Company has after financing its capital programs. Free Funds Flow is defined as cash from (used in) operating activities, excluding settlement of decommissioning liabilities and net change in operating non-cash working capital, minus capital investment.
| | | | | |
Cenovus Energy Inc. – Q2 2026 Management's Discussion and Analysis | 37 |
Excess Free Funds Flow is a non-GAAP financial measure used by the Company to deliver shareholder returns and allocate capital according to our shareholder returns and capital allocation framework. Excess Free Funds Flow is defined as Free Funds Flow minus base dividends paid on common shares, dividends paid on preferred shares, net purchases of common shares under the employee benefit plan, other uses of cash (including settlement of decommissioning liabilities and principal repayment of leases), and expenditures for acquisitions net of cash acquired, plus proceeds from, or payments related to, divestitures.
| | | | | | | | | | | | | | | | | | | | | | | | | |
| Three Months Ended June 30, | | Six Months Ended June 30, | | |
| ($ millions) | 2026 | | 2025 | | 2026 | | 2025 | | |
| Cash From (Used in) Operating Activities | 5,636 | | | 2,374 | | | 7,817 | | | 3,689 | | | |
| (Add) Deduct: | | | | | | | | | |
Settlement of Decommissioning Liabilities | (39) | | | (68) | | | (92) | | | (104) | | | |
| Net Change in Non-Cash Working Capital | 689 | | | 923 | | | (454) | | | 62 | | | |
| Adjusted Funds Flow | 4,986 | | | 1,519 | | | 8,363 | | | 3,731 | | | |
Capital Investment | 1,200 | | | 1,164 | | | 2,370 | | | 2,393 | | | |
Free Funds Flow | 3,786 | | | 355 | | | 5,993 | | | 1,338 | | | |
| Add (Deduct): | | | | | | | | | |
| Base Dividends Paid on Common Shares | (411) | | | (364) | | | (788) | | | (691) | | | |
| Dividends Paid on Preferred Shares | — | | | (4) | | | (2) | | | (10) | | | |
Purchase of Common Shares Under Employee
Benefit Plan | (58) | | | (15) | | | (109) | | | (73) | | | |
Settlement of Decommissioning Liabilities | (39) | | | (68) | | | (92) | | | (104) | | | |
| Principal Repayment of Leases | (88) | | | (94) | | | (178) | | | (177) | | | |
| Acquisitions, Net of Cash Acquired | (5) | | | (129) | | | (15) | | | (229) | | | |
| Proceeds From Divestitures | 72 | | | 13 | | | 171 | | | 13 | | | |
Excess Free Funds Flow | 3,257 | | | (306) | | | 4,980 | | | 67 | | | |
Gross Margin, Adjusted Gross Margin, Adjusted Refining Margin and Adjusted Market Capture
Gross Margin and Adjusted Gross Margin are non-GAAP financial measures that are used to evaluate the performance of our downstream operations. We define Gross Margin as revenues less purchased product and Adjusted Gross Margin as revenues less purchased product, excluding the impact of inventory holding gains or losses.
Inventory holding gains or losses reflects the difference between the cost of volumes produced at current-period costs, which is an indication of current market conditions, and the cost of volumes produced under the FIFO or weighted average cost basis as required by IFRS Accounting Standards, which generally reflects the market conditions at the time feedstock was purchased. The purchase and sale of inventories creates a timing difference that could be anywhere from several weeks to several months. This measure is an estimate of the impact of current-period costs to FIFO or weighted average cost, and assumes that all opening volumes are sold in the current period. Cenovus uses inventory holding gains or losses to analyze the performance of our assets and increase comparability with refining peers.
Adjusted Refining Margin and Adjusted Market Capture contain non-GAAP financial measures. Adjusted Refining Margin is used to evaluate our downstream operations after adjusting for inventory holding gains or losses. Adjusted Market Capture is used in our U.S. Refining segment to provide an indication of margin captured relative to what was available in the market based on widely-used benchmarks. These measures are useful to consistently measure the performance of our downstream operations.
We define Adjusted Refining Margin as Adjusted Gross Margin divided by total processed inputs and Adjusted Market Capture as Adjusted Refining Margin divided by the weighted average 3-2-1 market benchmark crack, net of RINs, expressed as a percentage. The weighted average crack spread, net of RINs, is calculated on Cenovus’s operable capacity-weighted average of the Chicago and Group 3 3-2-1 benchmark market crack spreads, net of RINs.
| | | | | |
Cenovus Energy Inc. – Q2 2026 Management's Discussion and Analysis | 38 |
Canadian Refining
| | | | | | | | | | | | | | | | | | | | | |
| Three Months Ended June 30, 2026 | | | | |
($ millions, except where indicated) | Lloydminster Upgrader and Lloydminster Refinery Total | | Other (1) | | Total Canadian Refining (2) | | | | |
Revenues | 1,524 | | 84 | | 1,608 | | | | |
| Purchased Product | 1,229 | | 50 | | 1,279 | | | | |
| Gross Margin | 295 | | 34 | | 329 | | | | |
Add (Deduct): | | | | | | | | | |
| Inventory Holding (Gain) Loss | 8 | | — | | 8 | | | | |
| Adjusted Gross Margin | 303 | | 34 | | 337 | | | | |
| | | | | | | | | |
Total Processed Inputs (Mbbls/d) | 110.4 | | | | | | | | |
| | | | | | | | | |
| | | | | | | | | |
Adjusted Refining Margin ($/bbl) | 30.21 | | | | | | | | |
| | | | | | | | | | | | | | | | | |
| Three Months Ended June 30, 2025 |
($ millions, except where indicated) | Lloydminster Upgrader and Lloydminster Refinery Total | | Other (1) | | Total Canadian Refining (2) |
Revenues | 1,211 | | 77 | | 1,288 |
| Purchased Product | 983 | | 57 | | 1,040 |
| Gross Margin | 228 | | 20 | | 248 |
Add (Deduct): | | | | | |
| Inventory Holding (Gain) Loss | (12) | | — | | (12) |
| Adjusted Gross Margin | 216 | | 20 | | 236 |
| | | | | |
Total Processed Inputs (Mbbls/d) | 120.7 | | | | |
| | | | | |
| | | | | |
Adjusted Refining Margin ($/bbl) | 19.64 | | | | |
(1)Includes ethanol operations and crude-by-rail operations.
(2)Revenues and purchased product are found in Note 1 of the interim Consolidated Financial Statements.
| | | | | | | | | | | | | | | | | | | | | |
| Six Months Ended June 30, 2026 | | | | |
($ millions, except where indicated) | Lloydminster Upgrader and Lloydminster Refinery Total | | Other (1) | | Total Canadian Refining (2) | | | | |
Revenues | 2,851 | | 164 | | 3,015 | | | | |
| Purchased Product | 2,237 | | 102 | | 2,339 | | | | |
| Gross Margin | 614 | | 62 | | 676 | | | | |
Add (Deduct): | | | | | | | | | |
| Inventory Holding (Gain) Loss | (39) | | — | | (39) | | | | |
| Adjusted Gross Margin | 575 | | 62 | | 637 | | | | |
| | | | | | | | | |
Total Processed Inputs (Mbbls/d) | 117.4 | | | | | | | | |
| | | | | | | | | |
| | | | | | | | | |
Adjusted Refining Margin ($/bbl) | 27.07 | | | | | | | | |
(1)Includes ethanol operations and crude-by-rail operations.
(2)Revenues and purchased product are found in Note 1 of the interim Consolidated Financial Statements.
| | | | | |
Cenovus Energy Inc. – Q2 2026 Management's Discussion and Analysis | 39 |
| | | | | | | | | | | | | | | | | |
| Six Months Ended June 30, 2025 |
($ millions, except where indicated) | Lloydminster Upgrader and Lloydminster Refinery Total | | Other (1) | | Total Canadian Refining (2) |
Revenues | 2,432 | | 138 | | 2,570 |
| Purchased Product | 2,020 | | 96 | | 2,116 |
| Gross Margin | 412 | | 42 | | 454 |
Add (Deduct): | | | | | |
| Inventory Holding (Gain) Loss | (9) | | — | | (9) |
| Adjusted Gross Margin | 403 | | 42 | | 445 |
| | | | | |
Total Processed Inputs (Mbbls/d) | 120.1 | | | | |
| | | | | |
| | | | | |
Adjusted Refining Margin ($/bbl) | 18.50 | | | | |
(1)Includes ethanol operations and crude-by-rail operations.
(2)Revenues and purchased product are found in Note 1 of the interim Consolidated Financial Statements.
U.S. Refining
| | | | | | | | | | | | | | | | | | | | | | | | |
| Three Months Ended June 30, | | Six Months Ended June 30, | |
($ millions, except where indicated) | 2026 | | 2025 | | 2026 | | 2025 | |
Revenues (1) | 6,549 | | | 6,455 | | | 10,769 | | | 12,878 | | |
Purchased Product (1) | 5,384 | | | 5,838 | | | 8,702 | | | 11,844 | | |
| Gross Margin | 1,165 | | | 617 | | | 2,067 | | | 1,034 | | |
Add (Deduct): | | | | | | | | |
| Inventory Holding (Gain) Loss | (152) | | | 62 | | | (609) | | | 85 | | |
| Adjusted Gross Margin | 1,013 | | | 679 | | | 1,458 | | | 1,119 | | |
| | | | | | | | |
Total Processed Inputs (Mbbls/d) | 372.9 | | | 594.2 | | | 366.4 | | | 587.6 | | |
| | | | | | | | |
| | | | | | | | |
Adjusted Refining Margin ($/bbl) | 29.83 | | | 12.57 | | | 21.97 | | | 10.53 | | |
| | | | | | | | |
Operable Capacity (Mbbls/d) | 364.8 | | | 612.3 | | | 364.8 | | | 612.3 | | |
| | | | | | | | |
Operable Capacity by Regional Benchmark (percent) | | | | | | | | |
Chicago 3-2-1 Crack Spread Weighting | 88 | | | 81 | | | 88 | | | 81 | | |
| Group 3 3-2-1 Crack Spread Weighting | 12 | | | 19 | | | 12 | | | 19 | | |
| | | | | | | | |
Benchmark Prices and Exchange Rate | | | | | | | | |
Chicago 3-2-1 Crack Spread (US$/bbl) | 46.54 | | | 21.64 | | | 32.04 | | | 17.66 | | |
Group 3 3-2-1 Crack Spread (US$/bbl) | 41.45 | | | 23.07 | | | 29.31 | | | 19.77 | | |
RINs (US$/bbl) | 13.78 | | | 6.12 | | | 11.25 | | | 5.44 | | |
US$ per C$1 – Average | 0.723 | | | 0.723 | | | 0.726 | | | 0.710 | | |
| | | | | | | | |
Weighted Average Crack Spread, Net of RINs ($/bbl) | 44.46 | | | 21.86 | | | 28.18 | | | 17.79 | | |
| | | | | | | | |
| | | | | | | | |
Adjusted Market Capture (percent) | 67 | | | 58 | | | 78 | | | 59 | | |
(1)Found in Note 1 of the interim Consolidated Financial Statements.
| | | | | |
Cenovus Energy Inc. – Q2 2026 Management's Discussion and Analysis | 40 |
Netback Reconciliations and Realized Sales Price
Netback is a non-GAAP financial measure commonly used in the oil and gas industry to assist in measuring operating performance. Our Netback calculation is substantially aligned with the definition found in the Canadian Oil and Gas Evaluation Handbook. Netback is defined as gross sales less royalties, transportation and blending, and operating expenses. Netbacks do not reflect non-cash write-downs or reversals of product inventory until it is realized when the product is sold and exclude risk management activities. Condensate or butane (diluent) is blended with crude oil to transport it to market. Netback per barrel of oil equivalent contains a non-GAAP measure. Netbacks per barrel of oil equivalent reflect our margin on a per-barrel of oil equivalent basis. Per-unit measures are divided by sales volumes.
Netback calculations reflect our proportionate share of revenues and expenses for joint ventures that are accounted for using the equity method of accounting. Offshore and Asia Pacific Netbacks include HCML, and the Conventional Netback includes Duvernay, resulting in non-GAAP measures when line items are presented independently and containing non-GAAP measures when presented on a per-unit basis.
Realized Sales Price contains a non-GAAP measure. It includes our gross sales, purchased diluent costs and profit from optimization activities, such as cogeneration, third-party processing and trading.
The following tables provide a reconciliation of Netback to Operating Margin found in our interim Consolidated Financial Statements.
Oil Sands
| | | | | | | | | | | | | | | | | | | | | | | | |
| Basis of Netback Calculation |
Three Months Ended June 30, 2026 ($ millions) | Foster Creek | Christina Lake | Sunrise | Lloydminster (1) | | | | | | Total Oil Sands (2) |
| Gross Sales | 2,147 | | 3,384 | | 664 | | 1,199 | | | | | | | 7,394 | |
| Royalties | (539) | | (846) | | (48) | | (167) | | | | | | | (1,600) | |
| Revenues | 1,608 | | 2,538 | | 616 | | 1,032 | | | | | | | 5,794 | |
| Expenses | | | | | | | | | | |
| Purchased Product | — | | — | | — | | — | | | | | | | — | |
| Transportation and Blending | 245 | | 266 | | 58 | | 35 | | | | | | | 604 | |
| Operating | 183 | | 276 | | 95 | | 216 | | | | | | | 770 | |
| Netback | 1,180 | | 1,996 | | 463 | | 781 | | | | | | | 4,420 | |
| Realized (Gain) Loss on Risk Management | | | | | | | | | | 29 | |
| Operating Margin | | | | | | | | | | 4,391 | |
| | | | | | | | | | | | | | | | | | | | | | | |
| Basis of Netback Calculation | Adjustments | | |
Three Months Ended June 30, 2026 ($ millions) | Total Oil Sands (2) | | Condensate | Third-party Sourced | Other (3) | | Total Oil Sands (4) |
| Gross Sales | 7,394 | | | 3,820 | | 1,400 | | 201 | | | 12,815 | |
| Royalties | (1,600) | | | — | | — | | — | | | (1,600) | |
| Revenues | 5,794 | | | 3,820 | | 1,400 | | 201 | | | 11,215 | |
| Expenses | | | | | | | |
| Purchased Product | — | | | — | | 1,400 | | 130 | | | 1,530 | |
| Transportation and Blending | 604 | | | 3,820 | | — | | 73 | | | 4,497 | |
| Operating | 770 | | | — | | — | | (11) | | | 759 | |
| Netback | 4,420 | | | — | | — | | 9 | | | 4,429 | |
| Realized (Gain) Loss on Risk Management | 29 | | | — | | — | | — | | | 29 | |
| Operating Margin | 4,391 | | | — | | — | | 9 | | | 4,400 | |
(1)Includes Lloydminster thermal and Lloydminster conventional heavy oil assets.
(2)Includes bitumen and heavy oil.
(3)Other includes midstream operations, transportation and blending and third-party cogeneration.
(4)These amounts, excluding Netback, are found in Note 1 of the interim Consolidated Financial Statements.
| | | | | |
Cenovus Energy Inc. – Q2 2026 Management's Discussion and Analysis | 41 |
| | | | | | | | | | | | | | | | | | | | | | | | |
| Basis of Netback Calculation |
Three Months Ended June 30, 2025 ($ millions) | Foster Creek | Christina Lake | Sunrise | Lloydminster (1) | | | | | | Total Oil Sands (2) |
| Gross Sales | 1,275 | | 1,265 | | 317 | | 789 | | | | | | | 3,646 | |
| Royalties | (200) | | (274) | | (16) | | (99) | | | | | | | (589) | |
| Revenues | 1,075 | | 991 | | 301 | | 690 | | | | | | | 3,057 | |
| Expenses | | | | | | | | | | |
| Purchased Product | — | | — | | — | | — | | | | | | | — | |
| Transportation and Blending | 301 | | 117 | | 70 | | 38 | | | | | | | 526 | |
| Operating | 202 | | 168 | | 92 | | 239 | | | | | | | 701 | |
| Netback | 572 | | 706 | | 139 | | 413 | | | | | | | 1,830 | |
| Realized (Gain) Loss on Risk Management | | | | | | | | | | 8 | |
| Operating Margin | | | | | | | | | | 1,822 | |
| | | | | | | | | | | | | | | | | | | | | | | |
| Basis of Netback Calculation | Adjustments | | |
Three Months Ended June 30, 2025 ($ millions) | Total Oil Sands (2) | | Condensate | Third-party Sourced | Other (3) | | Total Oil Sands (4) |
| Gross Sales | 3,646 | | | 1,989 | | 769 | | 106 | | | 6,510 | |
| Royalties | (589) | | | — | | — | | — | | | (589) | |
| Revenues | 3,057 | | | 1,989 | | 769 | | 106 | | | 5,921 | |
| Expenses | | | | | | | |
| Purchased Product | — | | | — | | 769 | | 87 | | | 856 | |
| Transportation and Blending | 526 | | | 1,989 | | — | | 20 | | | 2,535 | |
| Operating | 701 | | | — | | — | | (1) | | | 700 | |
| Netback | 1,830 | | | — | | — | | — | | | 1,830 | |
| Realized (Gain) Loss on Risk Management | 8 | | | — | | — | | — | | | 8 | |
| Operating Margin | 1,822 | | | — | | — | | — | | | 1,822 | |
(1)Includes Lloydminster thermal and Lloydminster conventional heavy oil assets.
(2)Includes bitumen and heavy oil.
(3)Other includes construction, and transportation and blending.
(4)These amounts, excluding Netback, are found in Note 1 of the interim Consolidated Financial Statements.
| | | | | | | | | | | | | | | | | | | | | | | | |
| Basis of Netback Calculation |
Six Months Ended June 30, 2026 ($ millions) | Foster Creek | Christina Lake | Sunrise | Lloydminster (1) | | | | | | Total Oil Sands (2) |
| Gross Sales | 3,903 | | 5,824 | | 1,098 | | 2,063 | | | | | | | 12,888 | |
| Royalties | (872) | | (1,365) | | (59) | | (238) | | | | | | | (2,534) | |
| Revenues | 3,031 | | 4,459 | | 1,039 | | 1,825 | | | | | | | 10,354 | |
| Expenses | | | | | | | | | | |
| Purchased Product | — | | — | | — | | — | | | | | | | — | |
| Transportation and Blending | 496 | | 519 | | 130 | | 69 | | | | | | | 1,214 | |
| Operating | 393 | | 566 | | 189 | | 442 | | | | | | | 1,590 | |
| Netback | 2,142 | | 3,374 | | 720 | | 1,314 | | | | | | | 7,550 | |
| Realized (Gain) Loss on Risk Management | | | | | | | | | | 52 | |
| Operating Margin | | | | | | | | | | 7,498 | |
(1)Includes Lloydminster thermal and Lloydminster conventional heavy oil assets.
(2)Includes bitumen and heavy oil.
| | | | | |
Cenovus Energy Inc. – Q2 2026 Management's Discussion and Analysis | 42 |
| | | | | | | | | | | | | | | | | | | | | | | |
| Basis of Netback Calculation | Adjustments | | |
Six Months Ended June 30, 2026 ($ millions) | Total Oil Sands (1) | | Condensate | Third-party Sourced | Other (2) | | Total Oil Sands (3) |
| Gross Sales | 12,888 | | | 6,449 | | 1,947 | | 315 | | | 21,599 | |
| Royalties | (2,534) | | | — | | — | | (6) | | | (2,540) | |
| Revenues | 10,354 | | | 6,449 | | 1,947 | | 309 | | | 19,059 | |
| Expenses | | | | | | | |
| Purchased Product | — | | | — | | 1,947 | | 200 | | | 2,147 | |
| Transportation and Blending | 1,214 | | | 6,449 | | — | | 117 | | | 7,780 | |
| Operating | 1,590 | | | — | | — | | (5) | | | 1,585 | |
| Netback | 7,550 | | | — | | — | | (3) | | | 7,547 | |
| Realized (Gain) Loss on Risk Management | 52 | | | — | | — | | — | | | 52 | |
| Operating Margin | 7,498 | | | — | | — | | (3) | | | 7,495 | |
(1)Includes bitumen and heavy oil.
(2)Other includes midstream operations, transportation and blending and third-party cogeneration.
(3)These amounts, excluding Netback, are found in Note 1 of the interim Consolidated Financial Statements.
| | | | | | | | | | | | | | | | | | | | | | | | |
| Basis of Netback Calculation |
Six Months Ended June 30, 2025 ($ millions) | Foster Creek | Christina Lake | Sunrise | Lloydminster (1) | | | | | | Total Oil Sands (2) |
| Gross Sales | 2,992 | | 2,884 | | 706 | | 1,699 | | | | | | | 8,281 | |
| Royalties | (542) | | (672) | | (36) | | (198) | | | | | | | (1,448) | |
| Revenues | 2,450 | | 2,212 | | 670 | | 1,501 | | | | | | | 6,833 | |
| Expenses | | | | | | | | | | |
| Purchased Product | — | | — | | — | | — | | | | | | | — | |
| Transportation and Blending | 613 | | 249 | | 150 | | 77 | | | | | | | 1,089 | |
| Operating | 395 | | 357 | | 170 | | 452 | | | | | | | 1,374 | |
| Netback | 1,442 | | 1,606 | | 350 | | 972 | | | | | | | 4,370 | |
| Realized (Gain) Loss on Risk Management | | | | | | | | | | — | |
| Operating Margin | | | | | | | | | | 4,370 | |
| | | | | | | | | | | | | | | | | | | | | | | |
| Basis of Netback Calculation | Adjustments | | |
Six Months Ended June 30, 2025 ($ millions) | Total Oil Sands (2) | | Condensate | Third-party Sourced | Other (3) | | Total Oil Sands (4) |
| Gross Sales | 8,281 | | | 4,564 | | 1,322 | | 200 | | | 14,367 | |
| Royalties | (1,448) | | | — | | — | | (2) | | | (1,450) | |
| Revenues | 6,833 | | | 4,564 | | 1,322 | | 198 | | | 12,917 | |
| Expenses | | | | | | | |
| Purchased Product | — | | | — | | 1,322 | | 166 | | | 1,488 | |
| Transportation and Blending | 1,089 | | | 4,564 | | — | | 33 | | | 5,686 | |
| Operating | 1,374 | | | — | | — | | 3 | | | 1,377 | |
| Netback | 4,370 | | | — | | — | | (4) | | | 4,366 | |
| Realized (Gain) Loss on Risk Management | — | | | — | | — | | — | | | — | |
| Operating Margin | 4,370 | | | — | | — | | (4) | | | 4,366 | |
(1)Includes Lloydminster thermal and Lloydminster conventional heavy oil assets.
(2)Includes bitumen and heavy oil.
(3)Other includes construction, and transportation and blending.
(4)These amounts, excluding Netback, are found in Note 1 of the interim Consolidated Financial Statements.
| | | | | |
Cenovus Energy Inc. – Q2 2026 Management's Discussion and Analysis | 43 |
Conventional
| | | | | | | | | | | | | | | | | | | | |
| Basis of Netback Calculation | | Adjustments | | |
Three Months Ended June 30, 2026 ($ millions) | Conventional (1) | | Third-party Sourced | Other (1) (2) | | Conventional (3) |
| Gross Sales | 329 | | | 548 | | 29 | | | 906 | |
| Royalties | (38) | | | — | | 1 | | | (37) | |
| Revenues | 291 | | | 548 | | 30 | | | 869 | |
| Expenses | | | | | | |
| Purchased Product | — | | | 548 | | — | | | 548 | |
| Transportation and Blending | 45 | | | — | | 33 | | | 78 | |
| Operating | 97 | | | — | | 7 | | | 104 | |
| Netback | 149 | | | — | | (10) | | | 139 | |
| Realized (Gain) Loss on Risk Management | 2 | | | — | | (3) | | | (1) | |
| Operating Margin | 147 | | | — | | (7) | | | 140 | |
| | | | | | |
| | | | | | | | | | | | | | | | | | | | |
| Basis of Netback Calculation | | Adjustments | | |
Three Months Ended June 30, 2025 ($ millions) | Conventional (1) | | Third-party Sourced | Other (1) (2) | | Conventional (3) |
| Gross Sales | 264 | | | 256 | | 29 | | | 549 | |
| Royalties | (13) | | | — | | 1 | | | (12) | |
| Revenues | 251 | | | 256 | | 30 | | | 537 | |
| Expenses | | | | | | |
| Purchased Product | — | | | 256 | | (1) | | | 255 | |
| Transportation and Blending | 58 | | | — | | 25 | | | 83 | |
| Operating | 108 | | | — | | 7 | | | 115 | |
| Netback | 85 | | | — | | (1) | | | 84 | |
| Realized (Gain) Loss on Risk Management | — | | | — | | — | | | — | |
| Operating Margin | 85 | | | — | | (1) | | | 84 | |
| | | | | | |
(1)Includes revenues and expenses related to the Duvernay joint venture.
(2)Other includes reclassification of costs primarily related to third-party cogeneration, processing and transportation.
(3)These amounts, excluding Netback, are found in Note 1 of the interim Consolidated Financial Statements.
| | | | | | | | | | | | | | | | | | | | |
| Basis of Netback Calculation | | Adjustments | | |
Six Months Ended June 30, 2026 ($ millions) | Conventional (1) | | Third-party Sourced | Other (1) (2) | | Conventional (3) |
| Gross Sales | 703 | | | 1,171 | | 69 | | | 1,943 | |
| Royalties | (57) | | | — | | 2 | | | (55) | |
| Revenues | 646 | | | 1,171 | | 71 | | | 1,888 | |
| Expenses | | | | | | |
| Purchased Product | — | | | 1,171 | | — | | | 1,171 | |
| Transportation and Blending | 91 | | | — | | 72 | | | 163 | |
| Operating | 201 | | | — | | 13 | | | 214 | |
| Netback | 354 | | | — | | (14) | | | 340 | |
| Realized (Gain) Loss on Risk Management | (8) | | | — | | (3) | | | (11) | |
| Operating Margin | 362 | | | — | | (11) | | | 351 | |
| | | | | | |
(1)Includes revenues and expenses related to the Duvernay joint venture.
(2)Other includes reclassification of costs primarily related to third-party cogeneration, processing and transportation.
(3)These amounts, excluding Netback, are found in Note 1 of the interim Consolidated Financial Statements.
| | | | | |
Cenovus Energy Inc. – Q2 2026 Management's Discussion and Analysis | 44 |
| | | | | | | | | | | | | | | | | | | | |
| Basis of Netback Calculation | | Adjustments | | |
Six Months Ended June 30, 2025 ($ millions) | Conventional (1) | | Third-party Sourced | Other (1) (2) | | Conventional (3) |
| Gross Sales | 643 | | | 790 | | 60 | | | 1,493 | |
| Royalties | (33) | | | — | | 1 | | | (32) | |
| Revenues | 610 | | | 790 | | 61 | | | 1,461 | |
| Expenses | | | | | | |
| Purchased Product | — | | | 790 | | — | | | 790 | |
| Transportation and Blending | 119 | | | — | | 54 | | | 173 | |
| Operating | 230 | | | — | | 12 | | | 242 | |
| Netback | 261 | | | — | | (5) | | | 256 | |
| Realized (Gain) Loss on Risk Management | (1) | | | — | | — | | | (1) | |
| Operating Margin | 262 | | | — | | (5) | | | 257 | |
| | | | | | |
(1)Includes revenues and expenses related to the Duvernay joint venture.
(2)Other includes reclassification of costs primarily related to third-party cogeneration, processing and transportation.
(3)These amounts, excluding Netback, are found in Note 1 of the interim Consolidated Financial Statements.
Offshore
| | | | | | | | | | | | | | | | | | | | | | | | | | | | | | | | | | | |
| Basis of Netback Calculation | | Adjustments | | |
Three Months Ended June 30, 2026 ($ millions) | Atlantic | China | Indonesia (1) | Total
Asia Pacific | | Total Offshore | | Equity Adjustment (1) | Other (2) | | Total Offshore (3) |
| Gross Sales | 218 | | 292 | | 85 | | 377 | | | 595 | | | (85) | | — | | | 510 | |
| Royalties | (2) | | (22) | | (22) | | (44) | | | (46) | | | 22 | | — | | | (24) | |
| Revenues | 216 | | 270 | | 63 | | 333 | | | 549 | | | (63) | | — | | | 486 | |
| Expenses | | | | | | | | | | | |
| Purchased Product | — | | — | | — | | — | | | — | | | — | | (4) | | | (4) | |
| Transportation and Blending | 7 | | — | | — | | — | | | 7 | | | — | | — | | | 7 | |
| Operating | 74 | | 28 | | 13 | | 41 | | | 115 | | | (12) | | 5 | | | 108 | |
| Netback | 135 | | 242 | | 50 | | 292 | | | 427 | | | (51) | | (1) | | | 375 | |
| Realized (Gain) Loss on Risk Management | | | | | | — | | | — | | — | | | — | |
| Operating Margin | | | | | | 427 | | | (51) | | (1) | | | 375 | |
| | | | | | | | | | | | | | | | | | | | | | | | | | | | | | | | | | | |
| Basis of Netback Calculation | | Adjustments | | |
Three Months Ended June 30, 2025 ($ millions) | Atlantic | China | Indonesia (1) | Total
Asia Pacific | | Total Offshore | | Equity Adjustment (1) | Other (2) | | Total Offshore (3) |
| Gross Sales | 72 | | 263 | | 86 | | 349 | | | 421 | | | (86) | | — | | | 335 | |
| Royalties | — | | (20) | | (21) | | (41) | | | (41) | | | 21 | | — | | | (20) | |
| Revenues | 72 | | 243 | | 65 | | 308 | | | 380 | | | (65) | | — | | | 315 | |
| Expenses | | | | | | | | | | | |
| Purchased Product | — | | — | | — | | — | | | — | | | — | | — | | | — | |
| Transportation and Blending | 3 | | — | | — | | — | | | 3 | | | — | | — | | | 3 | |
| Operating | 45 | | 30 | | 15 | | 45 | | | 90 | | | (12) | | 3 | | | 81 | |
| Netback | 24 | | 213 | | 50 | | 263 | | | 287 | | | (53) | | (3) | | | 231 | |
| Realized (Gain) Loss on Risk Management | | | | | | — | | | — | | — | | | — | |
| Operating Margin | | | | | | 287 | | | (53) | | (3) | | | 231 | |
(1)Revenues and expenses related to the HCML joint venture.
(2)Includes other activities not attributable to the production of crude oil and natural gas.
(3)These amounts, excluding Netback, are found in Note 1 of the interim Consolidated Financial Statements.
| | | | | |
Cenovus Energy Inc. – Q2 2026 Management's Discussion and Analysis | 45 |
| | | | | | | | | | | | | | | | | | | | | | | | | | | | | | | | | | | |
| Basis of Netback Calculation | | Adjustments | | |
Six Months Ended June 30, 2026 ($ millions) | Atlantic | China | Indonesia (1) | Total
Asia Pacific | | Total Offshore | | Equity Adjustment (1) | Other (2) | | Total Offshore (3) |
| Gross Sales | 461 | | 589 | | 167 | | 756 | | | 1,217 | | | (167) | | 9 | | | 1,059 | |
| Royalties | (4) | | (45) | | (42) | | (87) | | | (91) | | | 42 | | — | | | (49) | |
| Revenues | 457 | | 544 | | 125 | | 669 | | | 1,126 | | | (125) | | 9 | | | 1,010 | |
| Expenses | | | | | | | | | | | |
| Purchased Product | — | | — | | — | | — | | | — | | | — | | — | | | — | |
| Transportation and Blending | 14 | | — | | — | | — | | | 14 | | | — | | — | | | 14 | |
| Operating | 156 | | 56 | | 26 | | 82 | | | 238 | | | (23) | | 4 | | | 219 | |
| Netback | 287 | | 488 | | 99 | | 587 | | | 874 | | | (102) | | 5 | | | 777 | |
| Realized (Gain) Loss on Risk Management | | | | | | — | | | — | | — | | | — | |
| Operating Margin | | | | | | 874 | | | (102) | | 5 | | | 777 | |
| | | | | | | | | | | | | | | | | | | | | | | | | | | | | | | | | | | |
| Basis of Netback Calculation | | Adjustments | | |
Six Months Ended June 30, 2025 ($ millions) | Atlantic | China | Indonesia (1) | Total
Asia Pacific | | Total Offshore | | Equity Adjustment (1) | Other (2) | | Total Offshore (3) |
| Gross Sales | 218 | | 568 | | 175 | | 743 | | | 961 | | | (175) | | — | | | 786 | |
| Royalties | (2) | | (43) | | (48) | | (91) | | | (93) | | | 48 | | — | | | (45) | |
| Revenues | 216 | | 525 | | 127 | | 652 | | | 868 | | | (127) | | — | | | 741 | |
| Expenses | | | | | | | | | | | |
| Purchased Product | — | | — | | — | | — | | | — | | | — | | — | | | — | |
| Transportation and Blending | 9 | | — | | — | | — | | | 9 | | | — | | — | | | 9 | |
| Operating | 109 | | 53 | | 30 | | 83 | | | 192 | | | (25) | | 3 | | | 170 | |
| Netback | 98 | | 472 | | 97 | | 569 | | | 667 | | | (102) | | (3) | | | 562 | |
| Realized (Gain) Loss on Risk Management | | | | | | — | | | — | | — | | | — | |
| Operating Margin | | | | | | 667 | | | (102) | | (3) | | | 562 | |
(1)Revenues and expenses related to the HCML joint venture.
(2)Includes other activities not attributable to the production of crude oil and natural gas.
(3)These amounts, excluding Netback, are found in Note 1 of the interim Consolidated Financial Statements.
Upstream Sales Volumes (1)
The following table provides the sales volumes used to calculate Netback:
| | | | | | | | | | | | | | | | | | | | | | | |
| Three Months Ended June 30, | | Six Months Ended June 30, |
| (MBOE/d) | 2026 | | 2025 | | 2026 | | 2025 |
Oil Sands (2) | | | | | | | |
| Foster Creek | 208.4 | | | 179.8 | | | 217.6 | | | 199.1 | |
| Christina Lake | 372.9 | | | 212.2 | | | 360.9 | | | 225.8 | |
| Sunrise | 71.5 | | | 49.8 | | | 65.2 | | | 49.6 | |
Lloydminster | 130.6 | | | 124.5 | | | 130.6 | | | 126.3 | |
| Total Oil Sands | 783.4 | | | 566.3 | | | 774.3 | | | 600.8 | |
| | | | | | | |
Conventional (3) | 116.6 | | | 119.8 | | | 118.6 | | | 121.8 | |
| | | | | | | |
| Offshore | | | | | | | |
| Atlantic | 14.7 | | | 7.9 | | | 18.9 | | | 11.8 | |
| Asia Pacific | | | | | | | |
| China | 37.1 | | | 37.9 | | | 39.4 | | | 39.8 | |
Indonesia (4) | 14.1 | | | 15.9 | | | 14.8 | | | 15.6 | |
| Total Asia Pacific | 51.2 | | | 53.8 | | | 54.2 | | | 55.4 | |
| Total Offshore | 65.9 | | | 61.7 | | | 73.1 | | | 67.2 | |
| | | | | | | |
| | | | | | | |
| | | | | | | |
| | | | | | | |
(1)Sales volumes exclude the impact of purchased condensate.
(2)Includes bitumen and heavy crude oil sales.
(3)Reported sales volumes reflect Cenovus’s 30 percent equity interest in the Duvernay joint venture.
(4)Reported sales volumes reflect Cenovus’s 40 percent equity interest in the HCML joint venture.
| | | | | |
Cenovus Energy Inc. – Q2 2026 Management's Discussion and Analysis | 46 |
Other Specified Financial Measures
Per-Unit Operating Expenses
Per-unit operating expenses are specified financial measures used to evaluate the performance of our upstream and downstream operations. Our upstream per-unit operating expenses are defined as total operating expenses divided by sales volumes and are part of our Netback calculation, which can be found above.
We define Canadian Refining per-unit operating expenses as total operating expenses from the Upgrader, the Lloydminster Refinery and the commercial fuels business, divided by total processed inputs. We define U.S. Refining per-unit operating expenses as operating expenses divided by total processed inputs.
Per-Unit Transportation Expenses
Per-unit transportation expenses are specified financial measures used to measure transportation expenses on a per-unit basis in our upstream segments. We define per-unit transportation expenses as the total transportation expenses divided by sales volumes. Our upstream per-unit transportation expenses are part of the transportation and blending line in our Netback calculation, which can be found above.
| | | | | |
Cenovus Energy Inc. – Q2 2026 Management's Discussion and Analysis | 47 |