Pay vs Performance Disclosure
Mar. 31, 2026
USD ($)
$ / shares
Mar. 31, 2025
USD ($)
$ / shares
Mar. 31, 2024
USD ($)
$ / shares
Mar. 31, 2023
USD ($)
$ / shares
Mar. 28, 2024
$ / shares
Mar. 31, 2022
$ / shares
Pay Versus Performance
We are required by SEC rules to disclose the following information regarding compensation paid to our Principal Executive Officer (the “PEO”) and our other NEOs (collectively, the “Non-PEO NEOs”). The amounts set forth below under the headings “Compensation Actually Paid to PEO” and “Average Compensation Actually Paid to Non-PEO NEOs” have been calculated in a manner prescribed by the SEC rules and do not necessarily align with how we or the Compensation Committee view the link between our performance and the pay of our NEOs.
Year(1) (a) | Summary Compensation Table Total for PEO(2) (b) | Compensation Actually Paid to PEO(3) (c) | Average Summary Compensation Table Total for Non-PEO NEOs(2) (d) | Average Compensation Actually Paid to Non-PEO NEOs(3) (e) | Value of Initial Fixed $100 Investment Based On: | Net (Loss) Income ($ Millions)(6) (h) | Share Price ($)(7) (i) | |||||||||||||||||
Roivant TSR(4) (f) | Peer Group TSR(5) (g) | |||||||||||||||||||||||
Fiscal 2025 | $3,096,190 | $382,436,735 | $38,292,008 | $230,820,261 | $561 | $145 | $(397.9) | $27.70 | ||||||||||||||||
Fiscal 2024 | $163,293,744 | $120,292,276 | $54,974,046 | $43,159,484 | $204 | $104 | $(356.7) | $10.09 | ||||||||||||||||
Fiscal 2023 | $738,189 | $45,536,504 | $4,740,297 | $8,126,392 | $213 | $108 | $4,231.2 | $10.54 | ||||||||||||||||
Fiscal 2022 | $48,978,825 | $97,617,266 | $48,706,774 | $97,819,396 | $149 | $100 | $(1,115.5) | $7.38 | ||||||||||||||||
(1) | Matthew Gline, our Chief Executive Officer, was our PEO for each of the fiscal years presented. The individuals comprising the Non-PEO NEOs for each year presented are listed below. |
Fiscal 2025 | Fiscal 2024 | Fiscal 2023 | Fiscal 2022 | ||||||
Richard Pulik Mayukh Sukhatme Eric Venker Frank Torti | Richard Pulik Mayukh Sukhatme Eric Venker Jennifer Humes Rakhi Kumar | Richard Pulik Rakhi Kumar | Mayukh Sukhatme Eric Venker | ||||||
(2) | The dollar amounts reported in these columns represent the amount of total compensation reported for our PEO and on average for our Non-PEO NEOs for each covered fiscal year in the “Total” column of the Summary Compensation Table. |
(3) | The applicable Summary Compensation Table totals reported for the PEO and the average of the Non-PEO NEOs for each year were subject to the following adjustments per Item 402(v)(2)(iii) of Regulation S-K to calculate “Compensation Actually Paid.” The equity award adjustments reflected in this reconciliation relate solely to equity awards denominated in the Company’s common shares and exclude equity awards denominated in shares of Immunovant common stock held by Dr. Venker and Dr. Torti, which were granted by the Immunovant Board or Compensation Committee in a separate, independent process, and which were not determined by the Roivant Board and Compensation Committee. For additional details regarding the pay versus performance disclosure of Immunovant, please refer to the Proxy Statement for Immunovant’s Annual Meeting of Shareholders filed with the SEC on July 22, 2026. |
Fiscal 2025 | ||||||
PEO | Average for Non- PEO NEOs | |||||
Summary Compensation Table Total | $3,096,190 | $38,292,008 | ||||
Adjustments | ||||||
- Grant date fair value of Company equity awards granted during the covered fiscal year | — | $28,509,818 | ||||
+ Fair value as of the end of the covered fiscal year of all Company equity awards granted during the covered fiscal year that are outstanding and unvested at the end of the covered fiscal year | — | $93,195,873 | ||||
+/- Change in fair value as of the end of the covered fiscal year (from the end of the prior fiscal year) of any Company equity awards granted in any prior fiscal year that are outstanding and unvested as of the end of the covered fiscal year | $338,027,130 | $99,671,595 | ||||
+ Fair value as of the vesting date of any Company equity awards that were granted and vested in the covered fiscal year | — | $2,543,622 | ||||
+/- Change in fair value as of the vesting date (from the end of the prior fiscal year) of any Company equity awards granted in any prior fiscal year for which all applicable vesting conditions were satisfied at the end of or during the covered fiscal year | $41,313,414 | $25,626,980 | ||||
Compensation Actually Paid | $382,436,735 | $230,820,261 | ||||
Note: Certain amounts may not sum due to rounding.
The fair values set forth in the table above are computed in accordance with Topic 718 as of the end of Fiscal 2025, other than fair values of awards that vest in the covered year, which are valued as of the applicable vesting date.
(4) | Roivant TSR assumes $100 was invested at market close on March 31, 2022 and is calculated by dividing (i) the sum of the cumulative amount of dividends for the measurement period, assuming dividend reinvestment, and the difference between our share price at market close at the end of the measurement period (March 31, 2026 for Fiscal 2025; March 31, 2025 for Fiscal 2024; March 28, 2024 for Fiscal 2023; and March 31, 2023 for Fiscal 2022) and our share price at market close at the beginning of the measurement period (March 31, 2022) by (ii) our share price at market close at the beginning of the measurement period (March 31, 2022). On March 31, 2026 |
and 2025, March 28, 2024 and March 31, 2023 and 2022, the per share closing prices for our common shares were $27.70, $10.09, $10.54, $7.38 and $4.94, respectively. No dividends were paid for any periods presented.
(5) | The Peer Group TSR set forth in this table utilizes the Nasdaq Biotechnology Index, which we also utilize in the stock performance graph required by Item 201(e) of Regulation S-K included in our Annual Report on Form 10-K for the fiscal year ended March 31, 2026. The comparison assumes $100 was invested for the period from March 31, 2022 to March 31, 2026. |
(6) | Reflects “Net (loss) income” in the Company’s Consolidated Statements of Operations included in the Company’s Annual Reports on Form 10-K for each of Fiscal 2025, Fiscal 2024, Fiscal 2023 and Fiscal 2022. |
(7) | Reflects the per share closing price for our common shares on each of March 31, 2026, March 31, 2025, March 28, 2024 and March 31, 2023. |
(1) | Matthew Gline, our Chief Executive Officer, was our PEO for each of the fiscal years presented. The individuals comprising the Non-PEO NEOs for each year presented are listed below. |
Fiscal 2025 | Fiscal 2024 | Fiscal 2023 | Fiscal 2022 | ||||||
Richard Pulik Mayukh Sukhatme Eric Venker Frank Torti | Richard Pulik Mayukh Sukhatme Eric Venker Jennifer Humes Rakhi Kumar | Richard Pulik Rakhi Kumar | Mayukh Sukhatme Eric Venker | ||||||
(5) | The Peer Group TSR set forth in this table utilizes the Nasdaq Biotechnology Index, which we also utilize in the stock performance graph required by Item 201(e) of Regulation S-K included in our Annual Report on Form 10-K for the fiscal year ended March 31, 2026. The comparison assumes $100 was invested for the period from March 31, 2022 to March 31, 2026. |
(3) | The applicable Summary Compensation Table totals reported for the PEO and the average of the Non-PEO NEOs for each year were subject to the following adjustments per Item 402(v)(2)(iii) of Regulation S-K to calculate “Compensation Actually Paid.” The equity award adjustments reflected in this reconciliation relate solely to equity awards denominated in the Company’s common shares and exclude equity awards denominated in shares of Immunovant common stock held by Dr. Venker and Dr. Torti, which were granted by the Immunovant Board or Compensation Committee in a separate, independent process, and which were not determined by the Roivant Board and Compensation Committee. For additional details regarding the pay versus performance disclosure of Immunovant, please refer to the Proxy Statement for Immunovant’s Annual Meeting of Shareholders filed with the SEC on July 22, 2026. |
Fiscal 2025 | ||||||
PEO | Average for Non- PEO NEOs | |||||
Summary Compensation Table Total | $3,096,190 | $38,292,008 | ||||
Adjustments | ||||||
- Grant date fair value of Company equity awards granted during the covered fiscal year | — | $28,509,818 | ||||
+ Fair value as of the end of the covered fiscal year of all Company equity awards granted during the covered fiscal year that are outstanding and unvested at the end of the covered fiscal year | — | $93,195,873 | ||||
+/- Change in fair value as of the end of the covered fiscal year (from the end of the prior fiscal year) of any Company equity awards granted in any prior fiscal year that are outstanding and unvested as of the end of the covered fiscal year | $338,027,130 | $99,671,595 | ||||
+ Fair value as of the vesting date of any Company equity awards that were granted and vested in the covered fiscal year | — | $2,543,622 | ||||
+/- Change in fair value as of the vesting date (from the end of the prior fiscal year) of any Company equity awards granted in any prior fiscal year for which all applicable vesting conditions were satisfied at the end of or during the covered fiscal year | $41,313,414 | $25,626,980 | ||||
Compensation Actually Paid | $382,436,735 | $230,820,261 | ||||
Note: Certain amounts may not sum due to rounding.
The fair values set forth in the table above are computed in accordance with Topic 718 as of the end of Fiscal 2025, other than fair values of awards that vest in the covered year, which are valued as of the applicable vesting date.
(3) | The applicable Summary Compensation Table totals reported for the PEO and the average of the Non-PEO NEOs for each year were subject to the following adjustments per Item 402(v)(2)(iii) of Regulation S-K to calculate “Compensation Actually Paid.” The equity award adjustments reflected in this reconciliation relate solely to equity awards denominated in the Company’s common shares and exclude equity awards denominated in shares of Immunovant common stock held by Dr. Venker and Dr. Torti, which were granted by the Immunovant Board or Compensation Committee in a separate, independent process, and which were not determined by the Roivant Board and Compensation Committee. For additional details regarding the pay versus performance disclosure of Immunovant, please refer to the Proxy Statement for Immunovant’s Annual Meeting of Shareholders filed with the SEC on July 22, 2026. |
Fiscal 2025 | ||||||
PEO | Average for Non- PEO NEOs | |||||
Summary Compensation Table Total | $3,096,190 | $38,292,008 | ||||
Adjustments | ||||||
- Grant date fair value of Company equity awards granted during the covered fiscal year | — | $28,509,818 | ||||
+ Fair value as of the end of the covered fiscal year of all Company equity awards granted during the covered fiscal year that are outstanding and unvested at the end of the covered fiscal year | — | $93,195,873 | ||||
+/- Change in fair value as of the end of the covered fiscal year (from the end of the prior fiscal year) of any Company equity awards granted in any prior fiscal year that are outstanding and unvested as of the end of the covered fiscal year | $338,027,130 | $99,671,595 | ||||
+ Fair value as of the vesting date of any Company equity awards that were granted and vested in the covered fiscal year | — | $2,543,622 | ||||
+/- Change in fair value as of the vesting date (from the end of the prior fiscal year) of any Company equity awards granted in any prior fiscal year for which all applicable vesting conditions were satisfied at the end of or during the covered fiscal year | $41,313,414 | $25,626,980 | ||||
Compensation Actually Paid | $382,436,735 | $230,820,261 | ||||
Note: Certain amounts may not sum due to rounding.
The fair values set forth in the table above are computed in accordance with Topic 718 as of the end of Fiscal 2025, other than fair values of awards that vest in the covered year, which are valued as of the applicable vesting date.
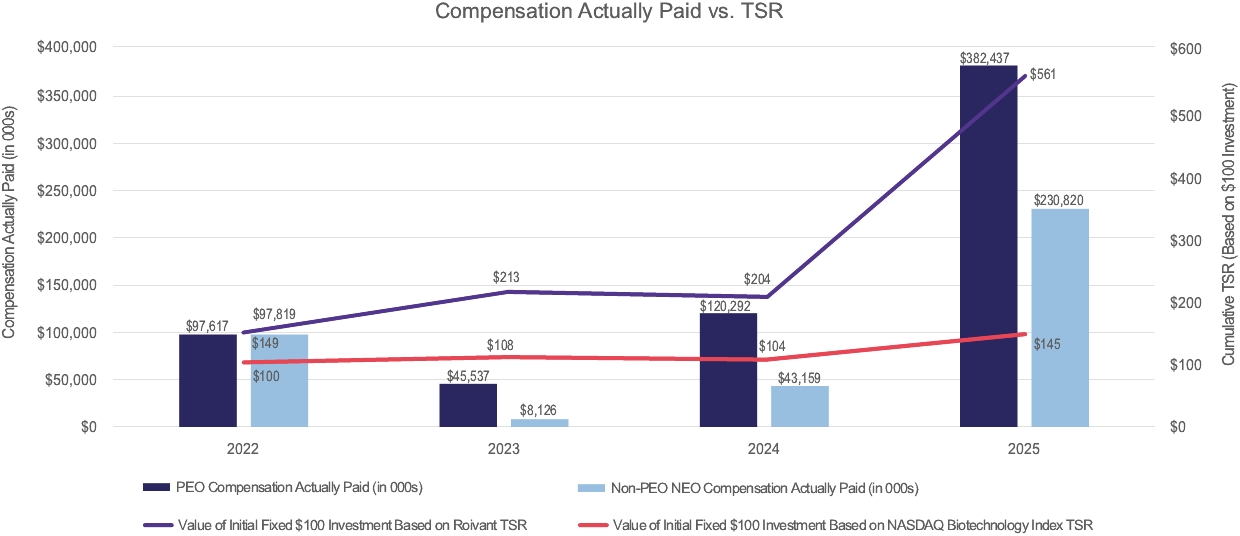
Relationship Between PEO and Non-PEO NEO Compensation Actually Paid and Total Shareholder Return (“TSR”)
The following chart sets forth the relationship between Compensation Actually Paid to our PEO, the average of Compensation Actually Paid to our Non-PEO NEOs, Roivant TSR over the four most recently completed fiscal years and the Nasdaq Biotechnology Index TSR (our Peer Group TSR) over the same period.
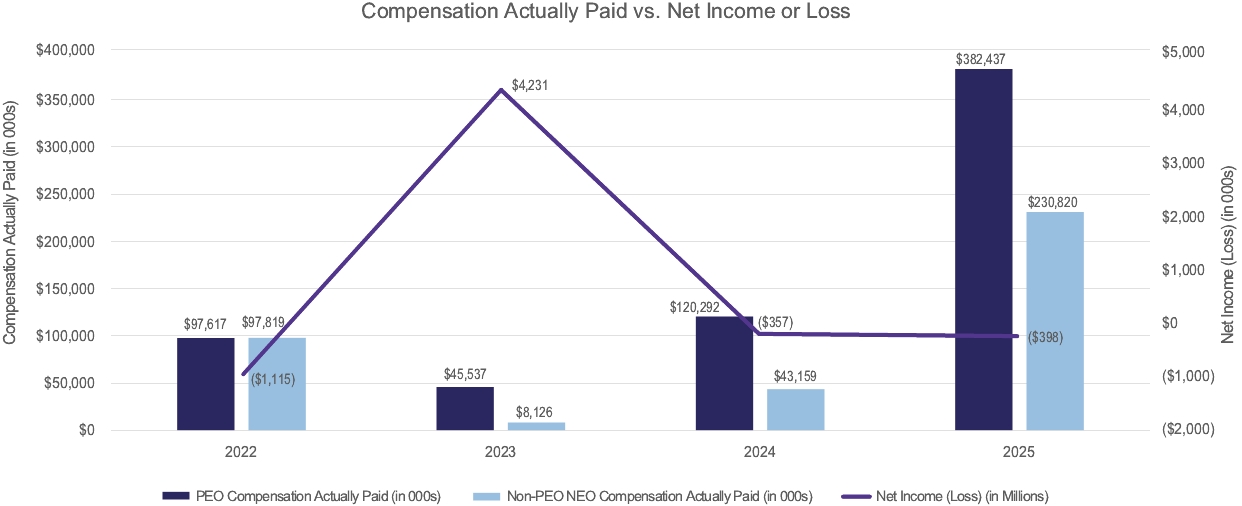
Relationship Between PEO and Non-PEO NEO Compensation Actually Paid and Net (Loss) Income
The following chart sets forth the relationship between Compensation Actually Paid to our PEO, the average of Compensation Actually Paid to our Non-PEO NEOs and our Net Income (Loss) during the four most recently completed fiscal years.
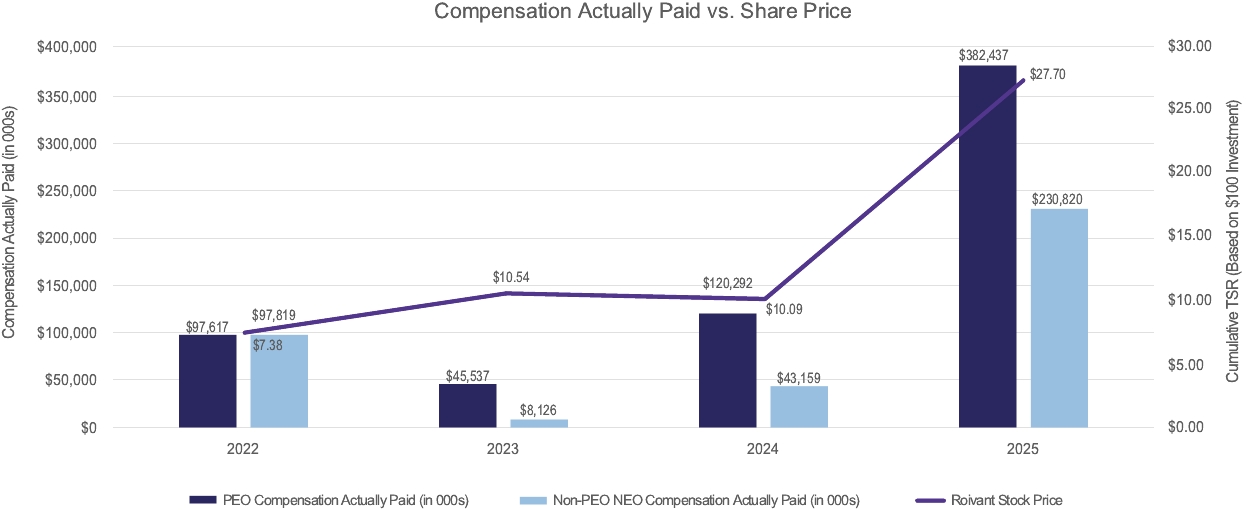
Relationship Between PEO and Non-PEO NEO Compensation Actually Paid and Share Price
The following chart sets forth the relationship between Compensation Actually Paid to our PEO, the average of Compensation Actually Paid to our Non-PEO NEOs and the closing price of our common shares as reported by Nasdaq as of the last business day of each of Fiscal 2025, Fiscal 2024, Fiscal 2023 and Fiscal 2022.
Relationship Between PEO and Non-PEO NEO Compensation Actually Paid and Total Shareholder Return (“TSR”)
The following chart sets forth the relationship between Compensation Actually Paid to our PEO, the average of Compensation Actually Paid to our Non-PEO NEOs, Roivant TSR over the four most recently completed fiscal years and the Nasdaq Biotechnology Index TSR (our Peer Group TSR) over the same period.
For Fiscal 2025, we did not use any financial performance measure to link “Compensation Actually Paid to PEO” or “Average Compensation Actually Paid to Non-PEO NEOs” to the Company’s performance, other than the Company’s share price, which was used as a performance vesting condition for the PSU awards granted to certain of our NEOs during Fiscal 2025, as described in more detail on page 18 above. Specifically, certain share price hurdles are used as performance vesting conditions for these PSU awards. The Compensation Committee believes this metric is the most reflective of our value. For further information regarding our performance-based approach to executive compensation and how the Compensation Committee aligns executive compensation with the Company’s performance, see “Compensation Discussion and Analysis” above.
Performance Measure | ||||||
Share price | ||||||
Other than our share price, the Company does not use any other financial performance measures to link executive compensation actually paid to Company performance and, as permitted by the SEC rules, is not required to disclose any other measure as its most important financial performance measures. We utilize operational goals and objectives in our annual cash bonus program to link pay-with-performance. For details on such goals, see page 17 above.