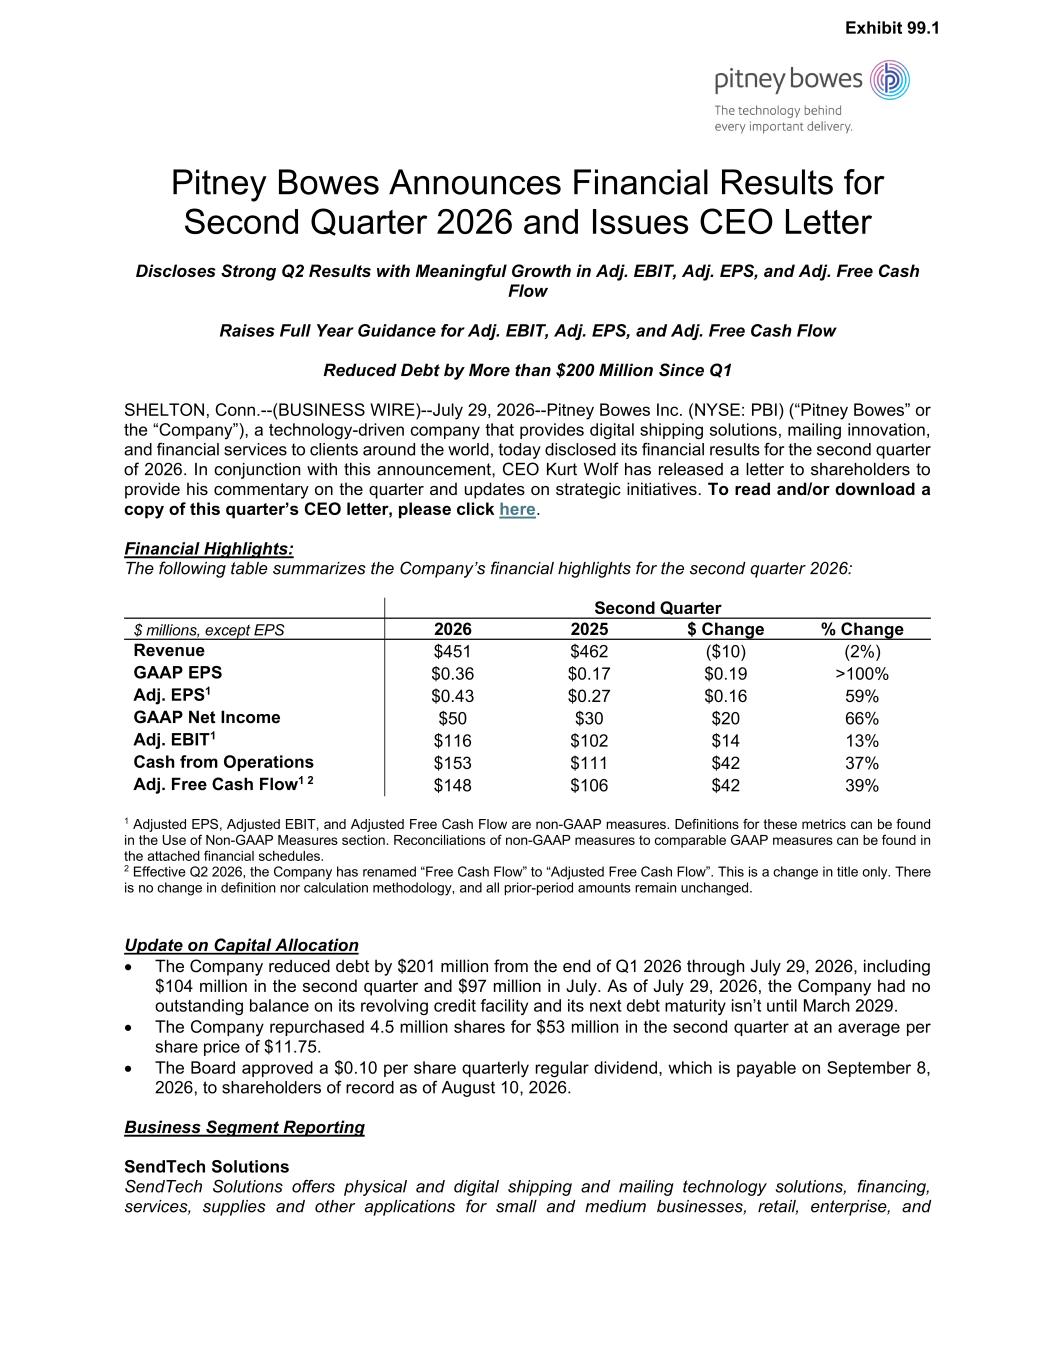
Pitney Bowes Announces Financial Results for Second Quarter 2026 and Issues CEO Letter Discloses Strong Q2 Results with Meaningful Growth in Adj. EBIT, Adj. EPS, and Adj. Free Cash Flow Raises Full Year Guidance for Adj. EBIT, Adj. EPS, and Adj. Free Cash Flow Reduced Debt by More than $200 Million Since Q1 SHELTON, Conn.--(BUSINESS WIRE)--July 29, 2026--Pitney Bowes Inc. (NYSE: PBI) (“Pitney Bowes” or the “Company”), a technology-driven company that provides digital shipping solutions, mailing innovation, and financial services to clients around the world, today disclosed its financial results for the second quarter of 2026. In conjunction with this announcement, CEO Kurt Wolf has released a letter to shareholders to provide his commentary on the quarter and updates on strategic initiatives. To read and/or download a copy of this quarter’s CEO letter, please click here. Financial Highlights: The following table summarizes the Company’s financial highlights for the second quarter 2026: Second Quarter $ millions, except EPS 2026 2025 $ Change % Change Revenue $451 $462 ($10) (2%) GAAP EPS $0.36 $0.17 $0.19 >100% Adj. EPS1 $0.43 $0.27 $0.16 59% GAAP Net Income $50 $30 $20 66% Adj. EBIT1 $116 $102 $14 13% Cash from Operations $153 $111 $42 37% Adj. Free Cash Flow1 2 $148 $106 $42 39% 1 Adjusted EPS, Adjusted EBIT, and Adjusted Free Cash Flow are non-GAAP measures. Definitions for these metrics can be found in the Use of Non-GAAP Measures section. Reconciliations of non-GAAP measures to comparable GAAP measures can be found in the attached financial schedules. 2 Effective Q2 2026, the Company has renamed “Free Cash Flow” to “Adjusted Free Cash Flow”. This is a change in title only. There is no change in definition nor calculation methodology, and all prior-period amounts remain unchanged. Update on Capital Allocation • The Company reduced debt by $201 million from the end of Q1 2026 through July 29, 2026, including $104 million in the second quarter and $97 million in July. As of July 29, 2026, the Company had no outstanding balance on its revolving credit facility and its next debt maturity isn’t until March 2029. • The Company repurchased 4.5 million shares for $53 million in the second quarter at an average per share price of $11.75. • The Board approved a $0.10 per share quarterly regular dividend, which is payable on September 8, 2026, to shareholders of record as of August 10, 2026. Business Segment Reporting SendTech Solutions SendTech Solutions offers physical and digital shipping and mailing technology solutions, financing, services, supplies and other applications for small and medium businesses, retail, enterprise, and Exhibit 99.1
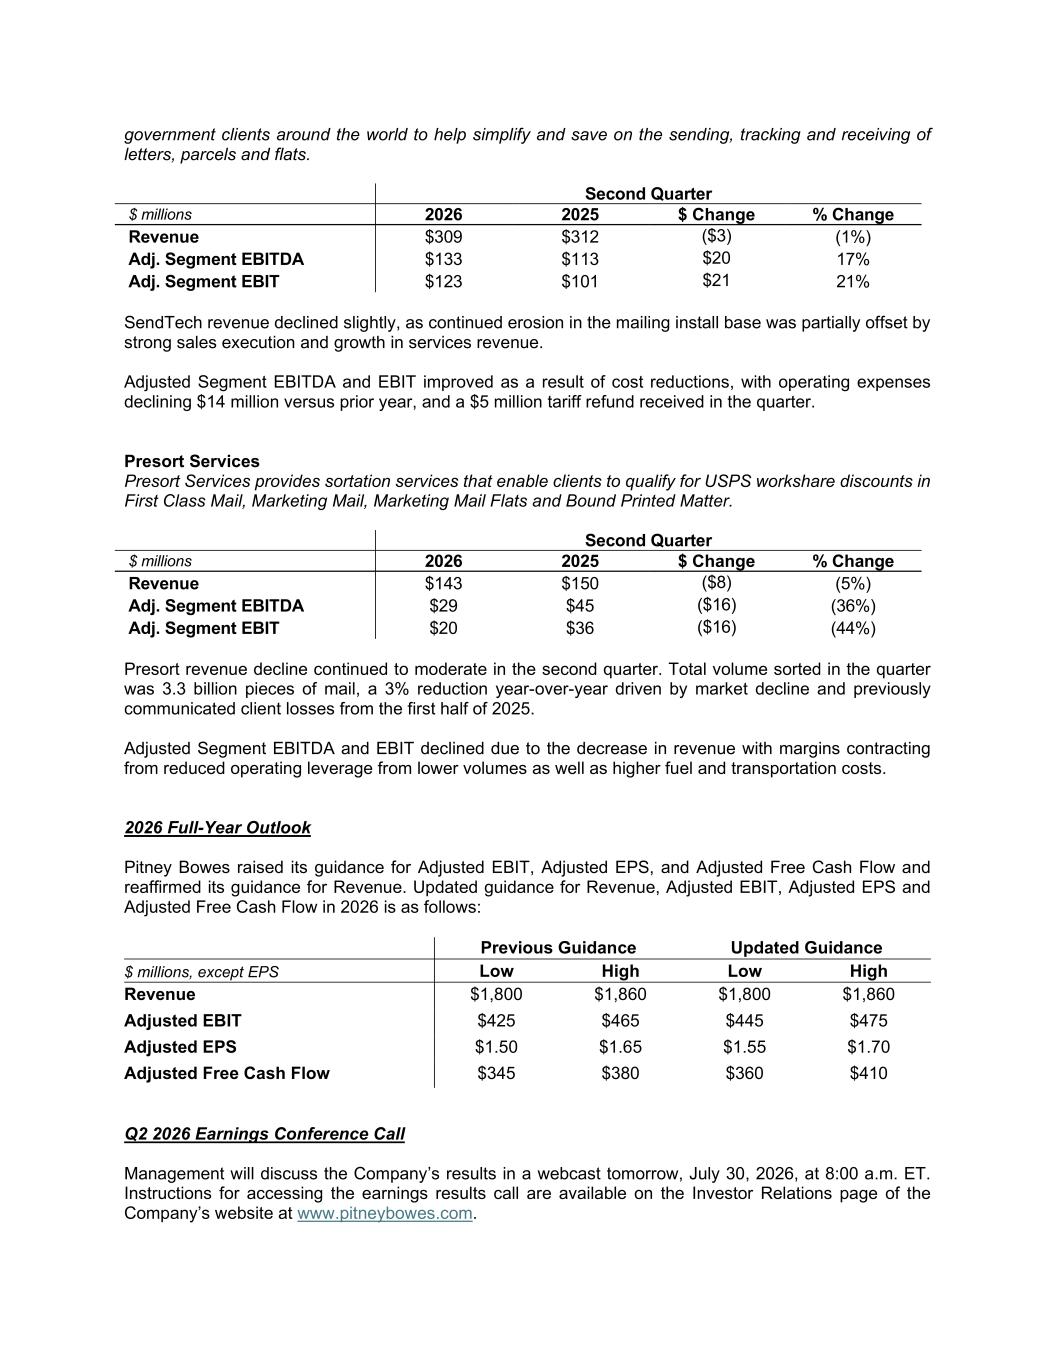
government clients around the world to help simplify and save on the sending, tracking and receiving of letters, parcels and flats. Second Quarter $ millions 2026 2025 $ Change % Change Revenue $309 $312 ($3) (1%) Adj. Segment EBITDA $133 $113 $20 17% Adj. Segment EBIT $123 $101 $21 21% SendTech revenue declined slightly, as continued erosion in the mailing install base was partially offset by strong sales execution and growth in services revenue. Adjusted Segment EBITDA and EBIT improved as a result of cost reductions, with operating expenses declining $14 million versus prior year, and a $5 million tariff refund received in the quarter. Presort Services Presort Services provides sortation services that enable clients to qualify for USPS workshare discounts in First Class Mail, Marketing Mail, Marketing Mail Flats and Bound Printed Matter. Second Quarter $ millions 2026 2025 $ Change % Change Revenue $143 $150 ($8) (5%) Adj. Segment EBITDA $29 $45 ($16) (36%) Adj. Segment EBIT $20 $36 ($16) (44%) Presort revenue decline continued to moderate in the second quarter. Total volume sorted in the quarter was 3.3 billion pieces of mail, a 3% reduction year-over-year driven by market decline and previously communicated client losses from the first half of 2025. Adjusted Segment EBITDA and EBIT declined due to the decrease in revenue with margins contracting from reduced operating leverage from lower volumes as well as higher fuel and transportation costs. 2026 Full-Year Outlook Pitney Bowes raised its guidance for Adjusted EBIT, Adjusted EPS, and Adjusted Free Cash Flow and reaffirmed its guidance for Revenue. Updated guidance for Revenue, Adjusted EBIT, Adjusted EPS and Adjusted Free Cash Flow in 2026 is as follows: Previous Guidance Updated Guidance $ millions, except EPS Low High Low High Revenue $1,800 $1,860 $1,800 $1,860 Adjusted EBIT $425 $465 $445 $475 Adjusted EPS $1.50 $1.65 $1.55 $1.70 Adjusted Free Cash Flow $345 $380 $360 $410 Q2 2026 Earnings Conference Call Management will discuss the Company’s results in a webcast tomorrow, July 30, 2026, at 8:00 a.m. ET. Instructions for accessing the earnings results call are available on the Investor Relations page of the Company’s website at www.pitneybowes.com.
***As a reminder, to read and/or download a copy of this quarter’s CEO letter, please click here*** About Pitney Bowes Pitney Bowes (NYSE: PBI) is a technology-driven company that provides digital shipping solutions, mailing innovation, and financial services to clients around the world – including more than 90 percent of the Fortune 500. Small businesses to large enterprises, and government entities rely on Pitney Bowes to reduce the complexity of sending mail and parcels. For the latest news, corporate announcements, and financial results, visit www.pitneybowes.com/us/newsroom. For additional information, visit Pitney Bowes at www.pitneybowes.com. Adjusted Segment EBIT Adjusted Segment EBIT is the primary measure of profitability and operational performance at the segment level. Adjusted Segment EBIT includes segment revenues and related costs and expenses attributable to the segment, but excludes interest, taxes, general corporate expenses, restructuring charges, and other items not allocated to a business segment. Effective January 1, 2026, Adjusted Segment EBIT also excludes pension expense related to U.S. and Canada pension plans that we have taken steps to terminate. We also report Adjusted Segment EBITDA as an additional useful measure of segment profitability and operational performance, which is calculated as Adjusted Segment EBIT plus depreciation and amortization expense of the segment. Use of Non-GAAP Measures Pitney Bowes’ financial results are reported in accordance with generally accepted accounting principles (GAAP). Pitney Bowes also discloses certain non-GAAP measures, such as adjusted earnings before interest and taxes (Adjusted EBIT), adjusted earnings before interest, taxes, depreciation and amortization (Adjusted EBITDA), adjusted earnings per share (Adjusted EPS) and adjusted free cash flow. Adjusted EBIT, Adjusted EBITDA and Adjusted EPS exclude the impact of restructuring charges, foreign currency gains and losses on intercompany loans, certain costs associated with the Ecommerce Restructuring, gains and losses on debt redemptions and other unusual items that we believe are not indicative of our core business operations. For the 2026 periods, these measures also exclude pension expense related to the U.S. and Canada pension plans that we have taken steps to terminate. Effective Q2 2026, the Company has renamed “Free Cash Flow” to “Adjusted Free Cash Flow”. This is a change in title only. There is no change in definition nor calculation methodology, and all prior-period amounts remain unchanged. Adjusted free cash flow adjusts cash flow from operations calculated in accordance with GAAP for capital expenditures, restructuring payments and other special items. Management believes adjusted free cash flow provides better insight into the amount of cash available for other discretionary uses. Reconciliations of non-GAAP measures to comparable GAAP measures can be found in the attached financial schedules and at the Company's website at: https://www.investorrelations.pitneybowes.com. We do not provide a reconciliation of forward‑looking non‑GAAP measures to the most comparable GAAP measures because items necessary for such reconciliation are not available on a reasonable basis without unreasonable efforts. Forward-Looking Statements This document contains “forward-looking statements” about the Company’s expected or potential future business and financial performance, including, but not limited to, statements about future revenue and profitability, earnings guidance, future events or conditions, capital allocation strategy, expected cost savings and efficiency improvements, and strategic initiatives and priorities. Forward-looking statements
are not guarantees of future performance and involve risks and uncertainties that could cause actual results to differ materially from those projected. Factors which could cause future performance to differ materially from expectations include, without limitation, changes in postal regulations or the operations and financial health of posts in the U.S. or other major markets or changes to the broader postal or shipping markets; accelerated or sudden declines in physical mail volumes or shipping volumes; the loss of some of our larger clients; changes in trade policies, tariffs and regulations; periods of difficult economic conditions, the impacts of inflation and rising prices, higher interest rates and a slow-down in economic activity, including a global recession, or a prolonged U.S. government shutdown, to the Company and our clients; changes in labor and transportation availability and costs; and other factors as more fully outlined in the Company's Annual Report on Form 10-K/A for the year ended December 31, 2025 and subsequent reports filed with the Securities and Exchange Commission. Pitney Bowes assumes no obligation to update any forward- looking statements contained in this document as a result of new information, events, or developments, except as required by law. Contacts: For Investors: Alex Brown investorrelations@pb.com
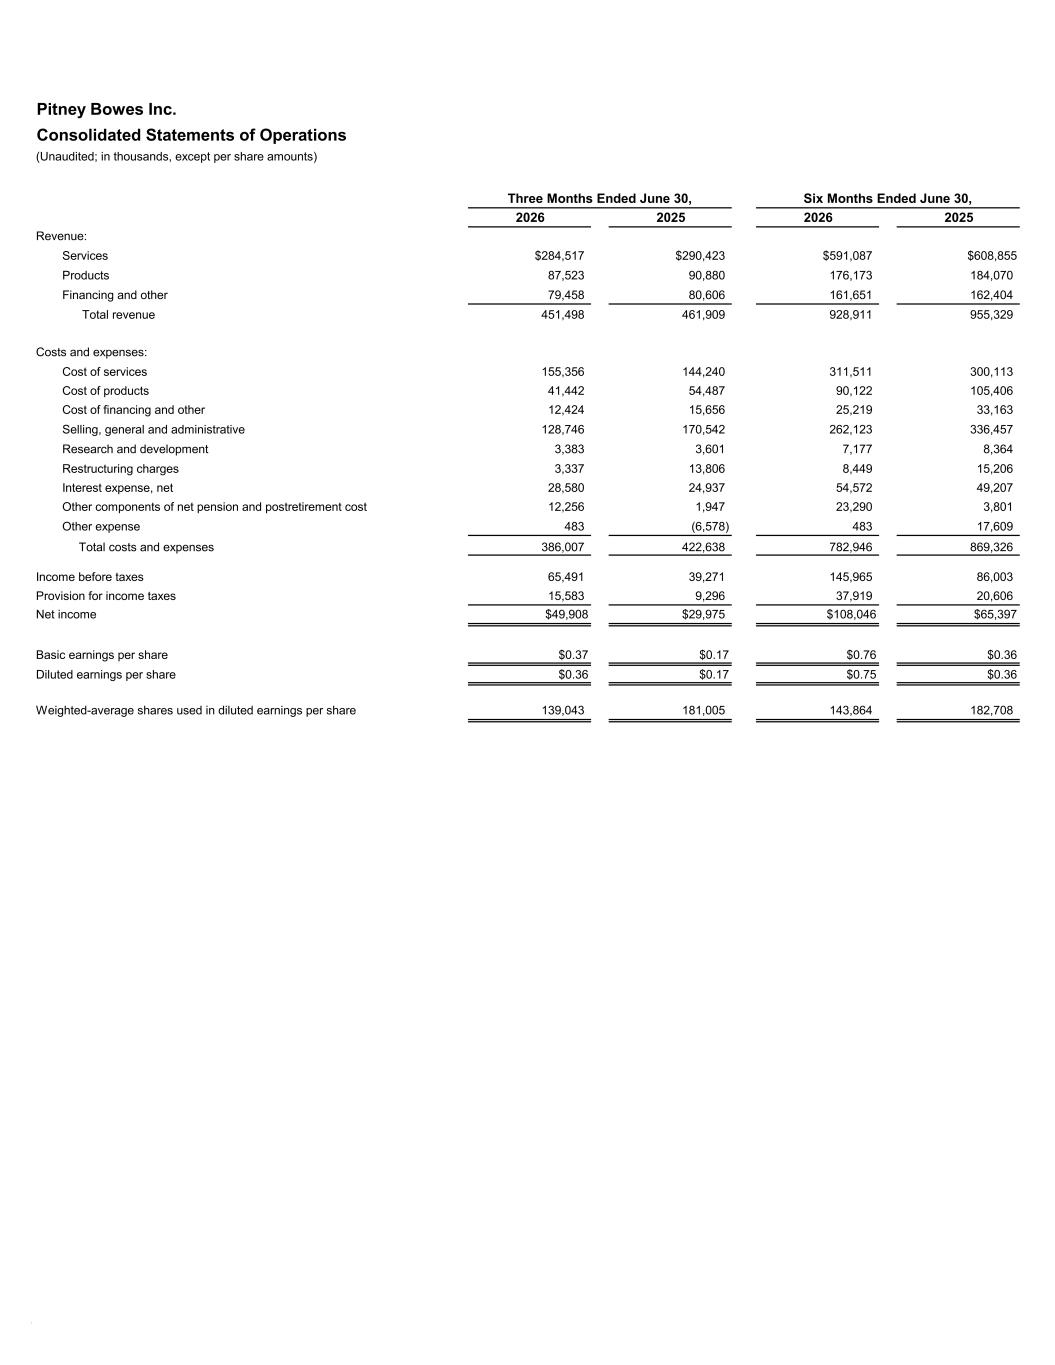
Pitney Bowes Inc. Consolidated Statements of Operations (Unaudited; in thousands, except per share amounts) 2026 2025 2026 2025 Revenue: Services $284,517 $290,423 $591,087 $608,855 Products 87,523 90,880 176,173 184,070 Financing and other 79,458 80,606 161,651 162,404 Total revenue 451,498 461,909 928,911 955,329 Costs and expenses: Cost of services 155,356 144,240 311,511 300,113 Cost of products 41,442 54,487 90,122 105,406 Cost of financing and other 12,424 15,656 25,219 33,163 Selling, general and administrative 128,746 170,542 262,123 336,457 Research and development 3,383 3,601 7,177 8,364 Restructuring charges 3,337 13,806 8,449 15,206 Interest expense, net 28,580 24,937 54,572 49,207 Other components of net pension and postretirement cost 12,256 1,947 23,290 3,801 Other expense 483 (6,578) 483 17,609 Total costs and expenses 386,007 422,638 782,946 869,326 Income before taxes 65,491 39,271 145,965 86,003 Provision for income taxes 15,583 9,296 37,919 20,606 Net income $49,908 $29,975 $108,046 $65,397 Basic earnings per share $0.37 $0.17 $0.76 $0.36 Diluted earnings per share $0.36 $0.17 $0.75 $0.36 Weighted-average shares used in diluted earnings per share 139,043 181,005 143,864 182,708 Six Months Ended June 30,Three Months Ended June 30, #
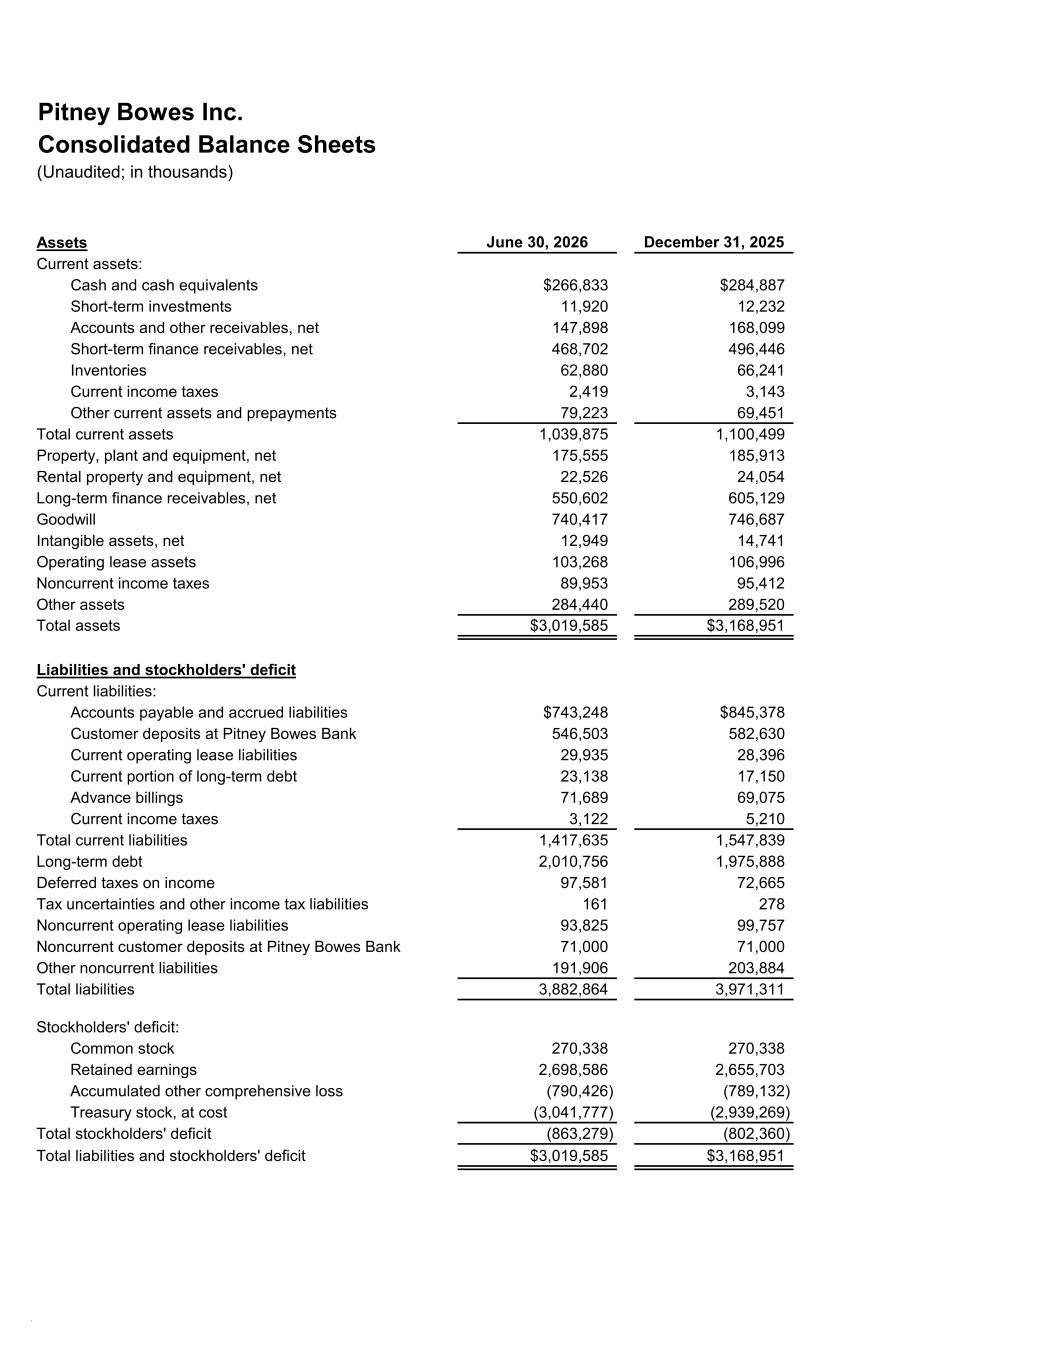
Pitney Bowes Inc. Consolidated Balance Sheets (Unaudited; in thousands) Assets June 30, 2026 December 31, 2025 Current assets: Cash and cash equivalents $266,833 $284,887 Short-term investments 11,920 12,232 Accounts and other receivables, net 147,898 168,099 Short-term finance receivables, net 468,702 496,446 Inventories 62,880 66,241 Current income taxes 2,419 3,143 Other current assets and prepayments 79,223 69,451 Total current assets 1,039,875 1,100,499 Property, plant and equipment, net 175,555 185,913 Rental property and equipment, net 22,526 24,054 Long-term finance receivables, net 550,602 605,129 Goodwill 740,417 746,687 Intangible assets, net 12,949 14,741 Operating lease assets 103,268 106,996 Noncurrent income taxes 89,953 95,412 Other assets 284,440 289,520 Total assets $3,019,585 $3,168,951 Liabilities and stockholders' deficit Current liabilities: Accounts payable and accrued liabilities $743,248 $845,378 Customer deposits at Pitney Bowes Bank 546,503 582,630 Current operating lease liabilities 29,935 28,396 Current portion of long-term debt 23,138 17,150 Advance billings 71,689 69,075 Current income taxes 3,122 5,210 Total current liabilities 1,417,635 1,547,839 Long-term debt 2,010,756 1,975,888 Deferred taxes on income 97,581 72,665 Tax uncertainties and other income tax liabilities 161 278 Noncurrent operating lease liabilities 93,825 99,757 Noncurrent customer deposits at Pitney Bowes Bank 71,000 71,000 Other noncurrent liabilities 191,906 203,884 Total liabilities 3,882,864 3,971,311 Stockholders' deficit: Common stock 270,338 270,338 Retained earnings 2,698,586 2,655,703 Accumulated other comprehensive loss (790,426) (789,132) Treasury stock, at cost (3,041,777) (2,939,269) Total stockholders' deficit (863,279) (802,360) Total liabilities and stockholders' deficit $3,019,585 $3,168,951 #
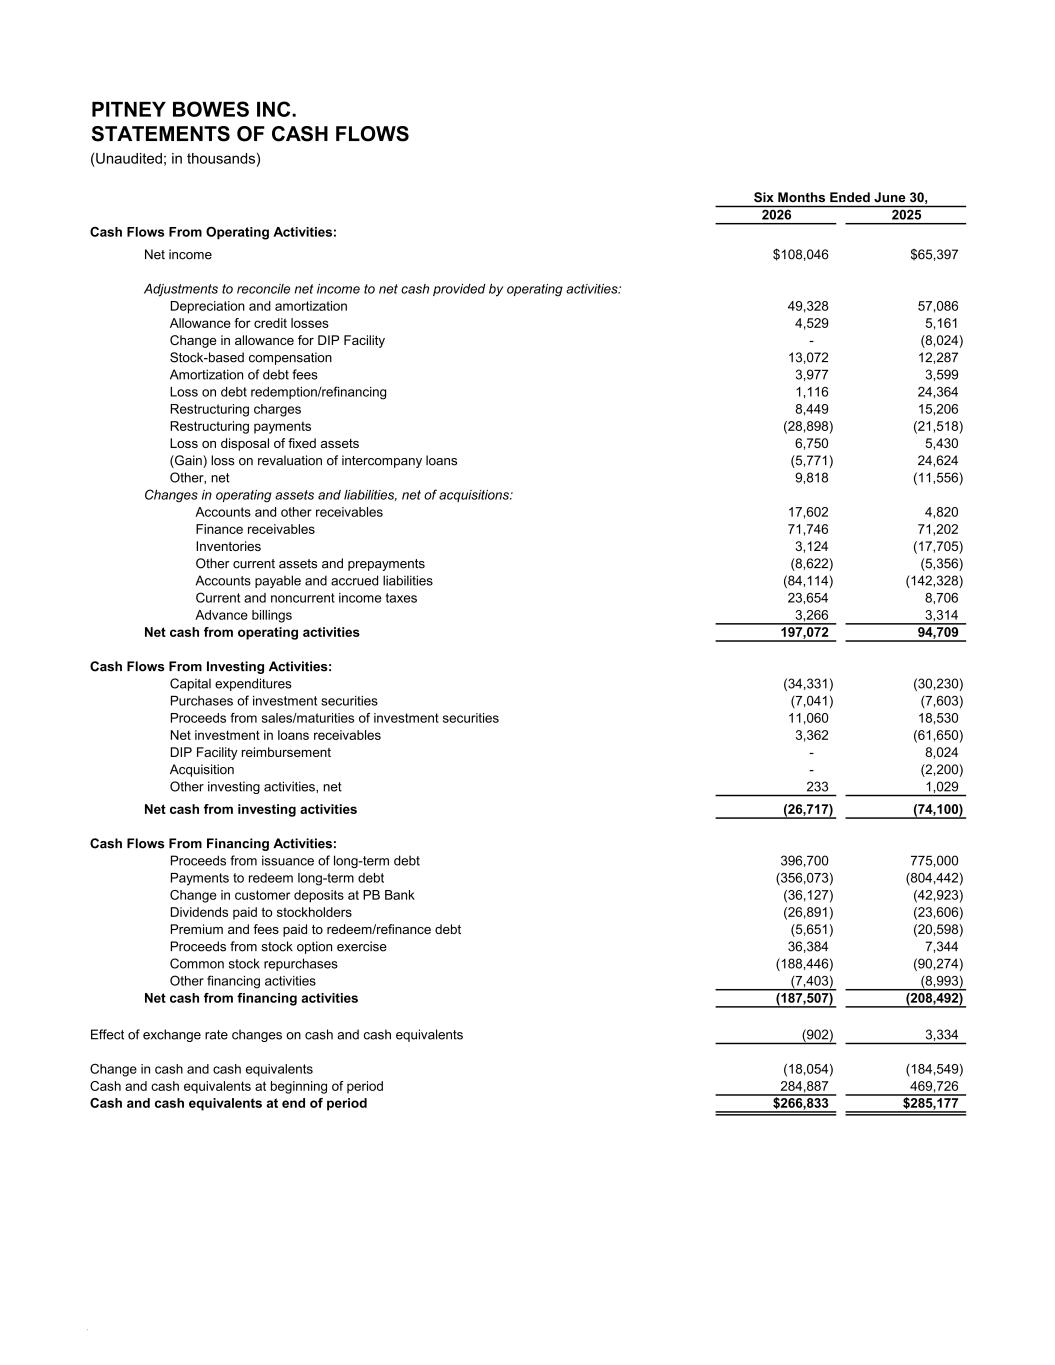
2026 2025 Cash Flows From Operating Activities: Net income $108,046 $65,397 Adjustments to reconcile net income to net cash provided by operating activities: Depreciation and amortization 49,328 57,086 Allowance for credit losses 4,529 5,161 Change in allowance for DIP Facility - (8,024) Stock-based compensation 13,072 12,287 Amortization of debt fees 3,977 3,599 Loss on debt redemption/refinancing 1,116 24,364 Restructuring charges 8,449 15,206 Restructuring payments (28,898) (21,518) Loss on disposal of fixed assets 6,750 5,430 (Gain) loss on revaluation of intercompany loans (5,771) 24,624 Other, net 9,818 (11,556) Changes in operating assets and liabilities, net of acquisitions: Accounts and other receivables 17,602 4,820 Finance receivables 71,746 71,202 Inventories 3,124 (17,705) Other current assets and prepayments (8,622) (5,356) Accounts payable and accrued liabilities (84,114) (142,328) Current and noncurrent income taxes 23,654 8,706 Advance billings 3,266 3,314 Net cash from operating activities 197,072 94,709 Cash Flows From Investing Activities: Capital expenditures (34,331) (30,230) Purchases of investment securities (7,041) (7,603) Proceeds from sales/maturities of investment securities 11,060 18,530 Net investment in loans receivables 3,362 (61,650) DIP Facility reimbursement - 8,024 Acquisition - (2,200) Other investing activities, net 233 1,029 Net cash from investing activities (26,717) (74,100) Cash Flows From Financing Activities: Proceeds from issuance of long-term debt 396,700 775,000 Payments to redeem long-term debt (356,073) (804,442) Change in customer deposits at PB Bank (36,127) (42,923) Dividends paid to stockholders (26,891) (23,606) Premium and fees paid to redeem/refinance debt (5,651) (20,598) Proceeds from stock option exercise 36,384 7,344 Common stock repurchases (188,446) (90,274) Other financing activities (7,403) (8,993) Net cash from financing activities (187,507) (208,492) Effect of exchange rate changes on cash and cash equivalents (902) 3,334 Change in cash and cash equivalents (18,054) (184,549) Cash and cash equivalents at beginning of period 284,887 469,726 Cash and cash equivalents at end of period $266,833 $285,177 Six Months Ended June 30, (Unaudited; in thousands) PITNEY BOWES INC. STATEMENTS OF CASH FLOWS #
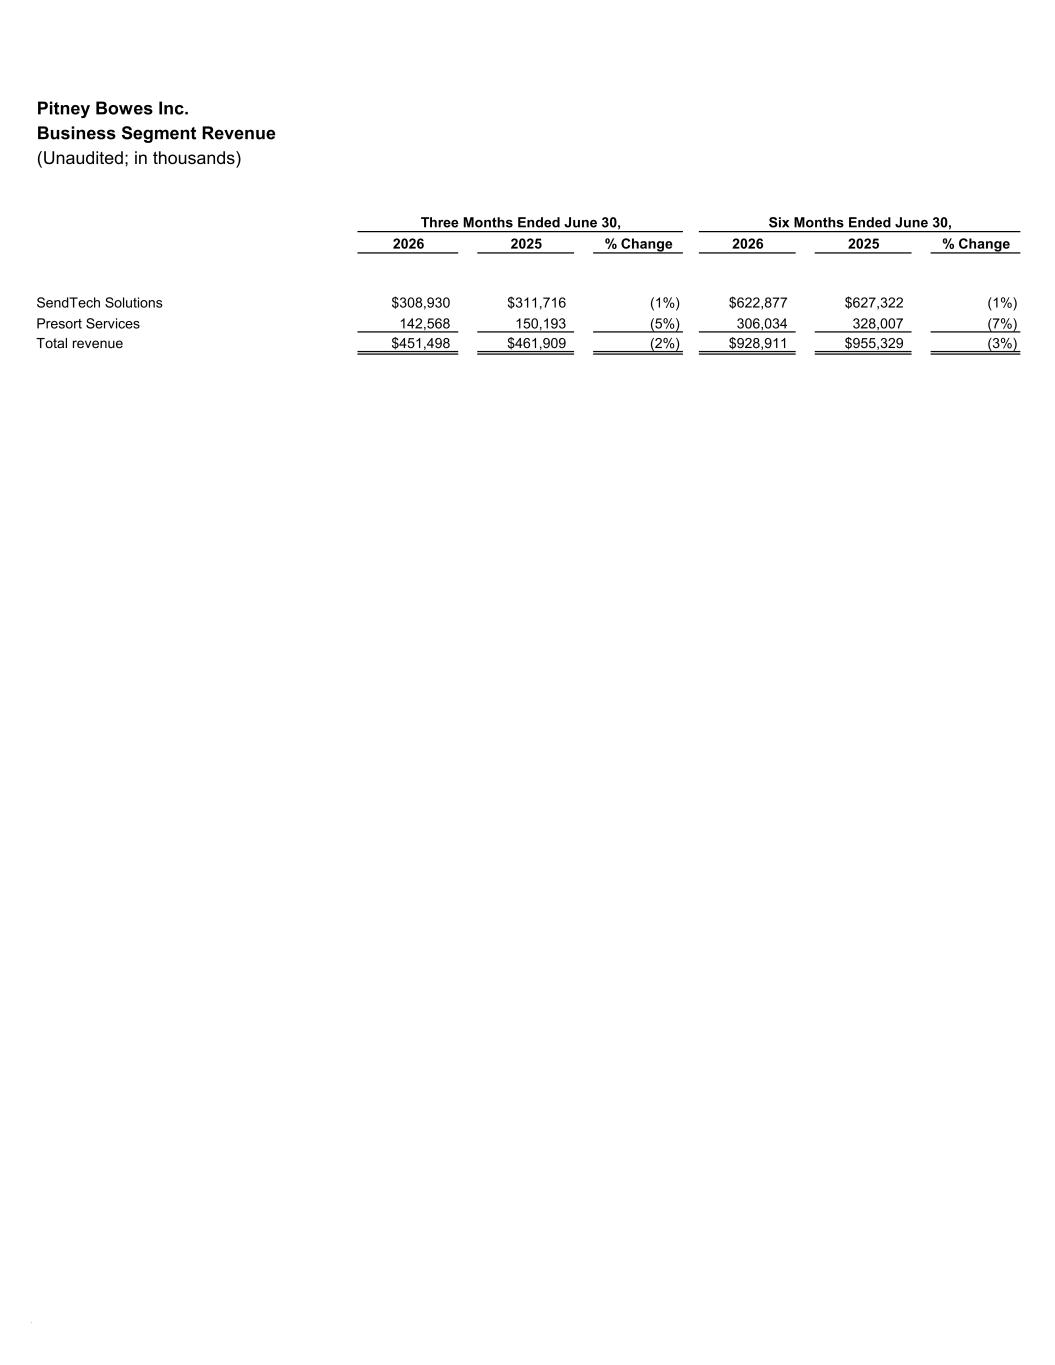
Pitney Bowes Inc. Business Segment Revenue (Unaudited; in thousands) 2026 2025 % Change 2026 2025 % Change SendTech Solutions $308,930 $311,716 (1%) $622,877 $627,322 (1%) Presort Services 142,568 150,193 (5%) 306,034 328,007 (7%) Total revenue $451,498 $461,909 (2%) $928,911 $955,329 (3%) Three Months Ended June 30, Six Months Ended June 30, #
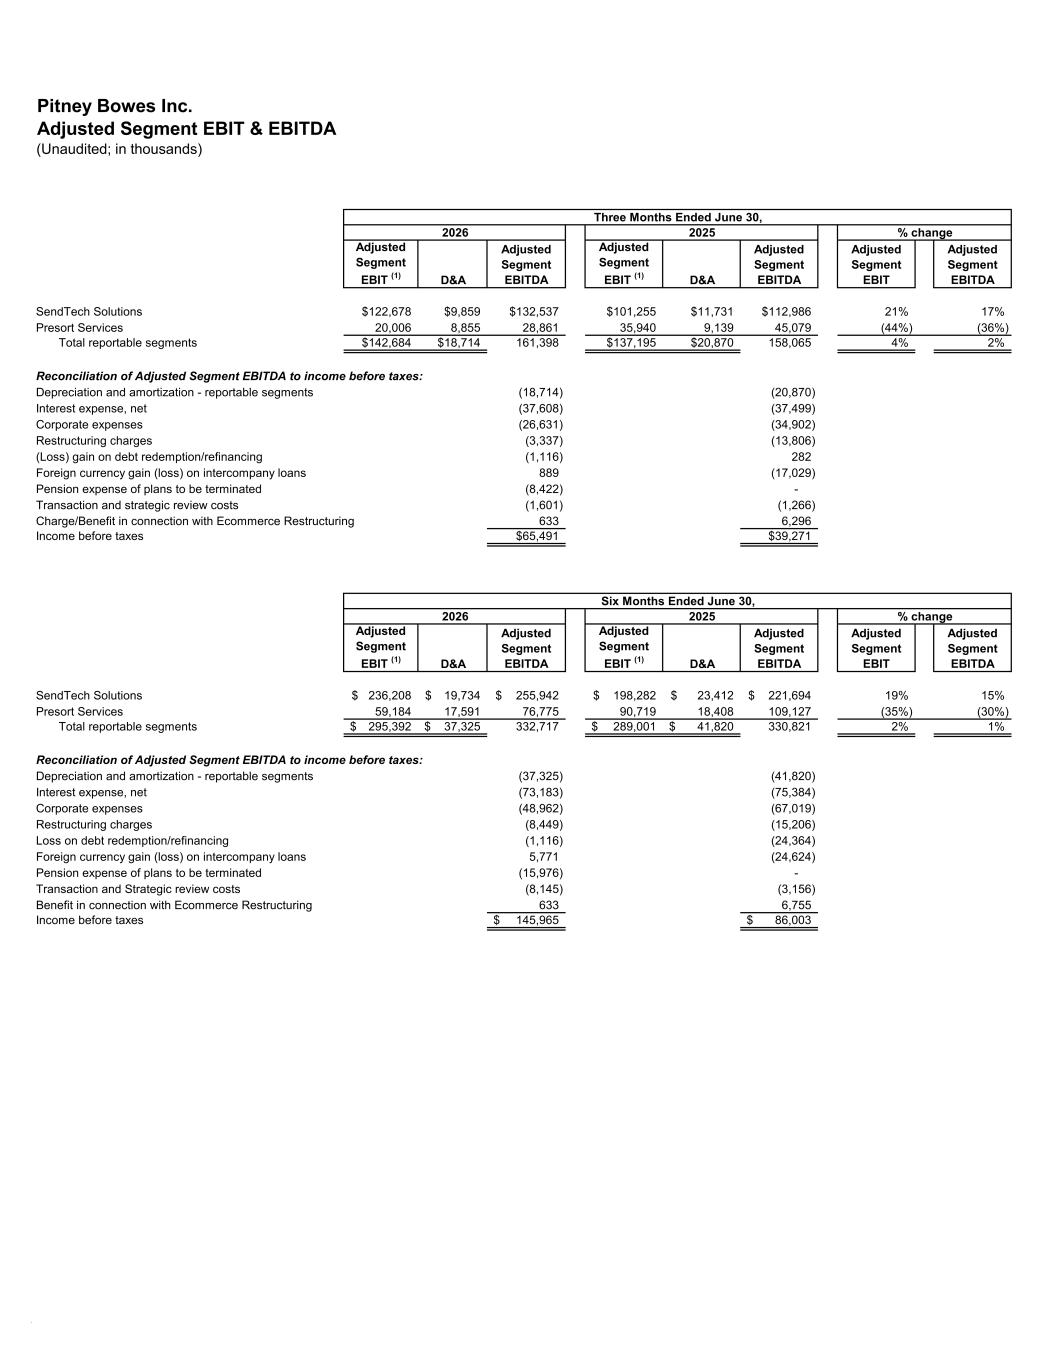
Pitney Bowes Inc. Adjusted Segment EBIT & EBITDA (Unaudited; in thousands) Adjusted Segment EBIT (1) D&A Adjusted Segment EBITDA Adjusted Segment EBIT (1) D&A Adjusted Segment EBITDA Adjusted Segment EBIT Adjusted Segment EBITDA SendTech Solutions $122,678 $9,859 $132,537 $101,255 $11,731 $112,986 21% 17% Presort Services 20,006 8,855 28,861 35,940 9,139 45,079 (44%) (36%) Total reportable segments $142,684 $18,714 161,398 $137,195 $20,870 158,065 4% 2% Reconciliation of Adjusted Segment EBITDA to income before taxes: Depreciation and amortization - reportable segments (18,714) (20,870) Interest expense, net (37,608) (37,499) Corporate expenses (26,631) (34,902) Restructuring charges (3,337) (13,806) (Loss) gain on debt redemption/refinancing (1,116) 282 Foreign currency gain (loss) on intercompany loans 889 (17,029) Pension expense of plans to be terminated (8,422) - Transaction and strategic review costs (1,601) (1,266) Charge/Benefit in connection with Ecommerce Restructuring 633 6,296 Income before taxes $65,491 $39,271 Adjusted Segment EBIT (1) D&A Adjusted Segment EBITDA Adjusted Segment EBIT (1) D&A Adjusted Segment EBITDA Adjusted Segment EBIT Adjusted Segment EBITDA SendTech Solutions 236,208$ 19,734$ 255,942$ 198,282$ 23,412$ 221,694$ 19% 15% Presort Services 59,184 17,591 76,775 90,719 18,408 109,127 (35%) (30%) Total reportable segments 295,392$ 37,325$ 332,717 289,001$ 41,820$ 330,821 2% 1% Reconciliation of Adjusted Segment EBITDA to income before taxes: Depreciation and amortization - reportable segments (37,325) (41,820) Interest expense, net (73,183) (75,384) Corporate expenses (48,962) (67,019) Restructuring charges (8,449) (15,206) Loss on debt redemption/refinancing (1,116) (24,364) Foreign currency gain (loss) on intercompany loans 5,771 (24,624) Pension expense of plans to be terminated (15,976) - Transaction and Strategic review costs (8,145) (3,156) Benefit in connection with Ecommerce Restructuring 633 6,755 Income before taxes 145,965$ 86,003$ Three Months Ended June 30, 2026 2025 Six Months Ended June 30, 2026 2025 % change % change #
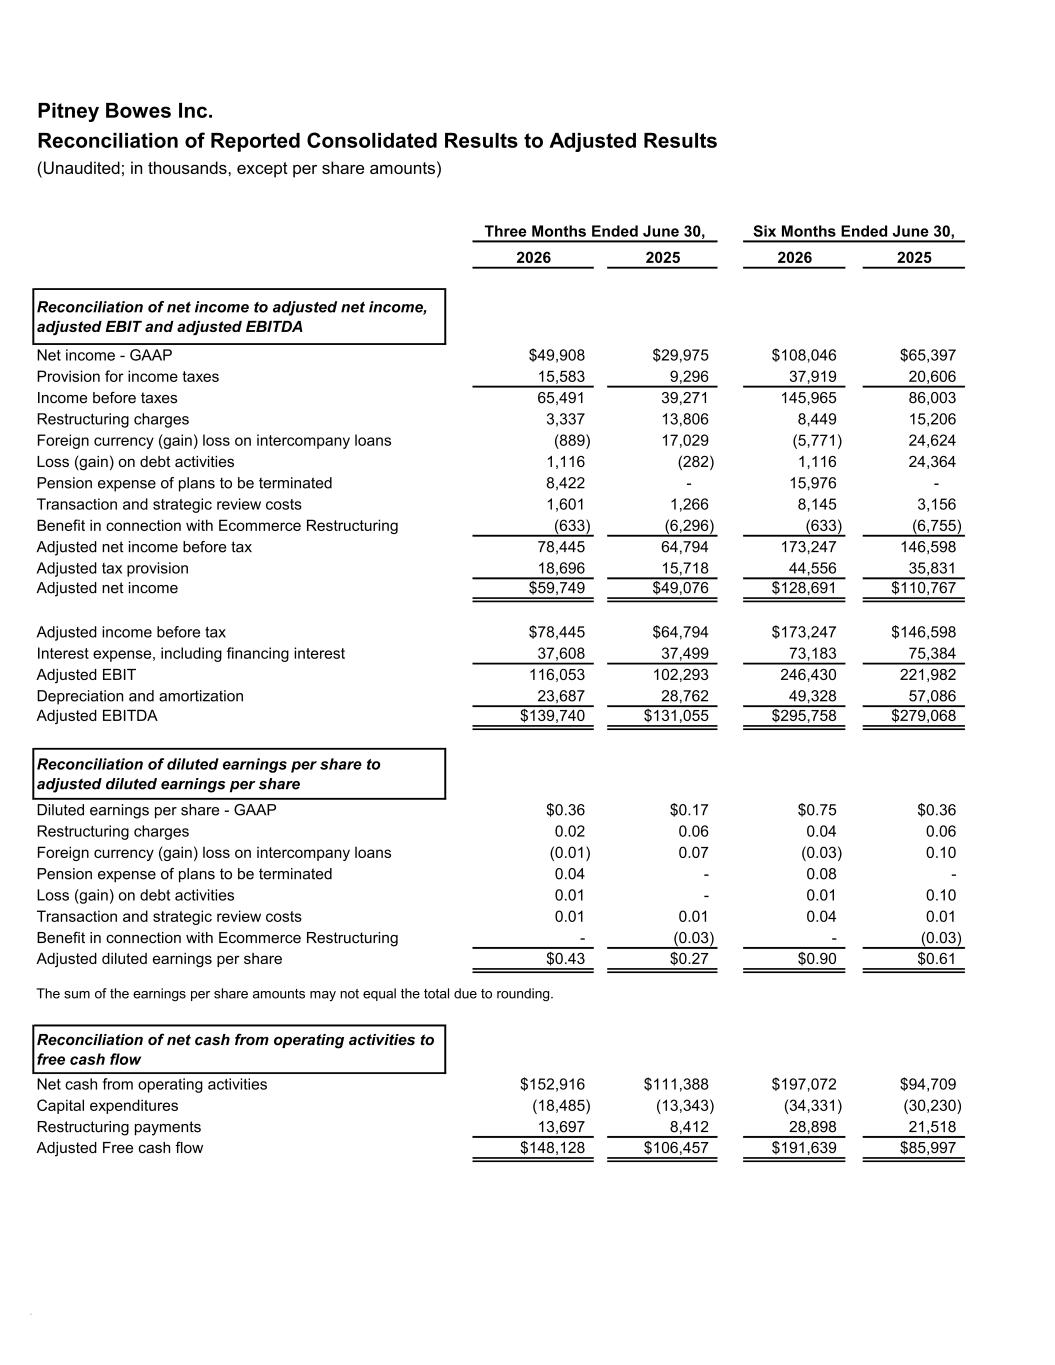
Pitney Bowes Inc. Reconciliation of Reported Consolidated Results to Adjusted Results (Unaudited; in thousands, except per share amounts) 2026 2025 2026 2025 Reconciliation of net income to adjusted net income, adjusted EBIT and adjusted EBITDA Net income - GAAP $49,908 $29,975 $108,046 $65,397 Provision for income taxes 15,583 9,296 37,919 20,606 Income before taxes 65,491 39,271 145,965 86,003 Restructuring charges 3,337 13,806 8,449 15,206 Foreign currency (gain) loss on intercompany loans (889) 17,029 (5,771) 24,624 Loss (gain) on debt activities 1,116 (282) 1,116 24,364 Pension expense of plans to be terminated 8,422 - 15,976 - Transaction and strategic review costs 1,601 1,266 8,145 3,156 Benefit in connection with Ecommerce Restructuring (633) (6,296) (633) (6,755) Adjusted net income before tax 78,445 64,794 173,247 146,598 Adjusted tax provision 18,696 15,718 44,556 35,831 Adjusted net income $59,749 $49,076 $128,691 $110,767 Adjusted income before tax $78,445 $64,794 $173,247 $146,598 Interest expense, including financing interest 37,608 37,499 73,183 75,384 Adjusted EBIT 116,053 102,293 246,430 221,982 Depreciation and amortization 23,687 28,762 49,328 57,086 Adjusted EBITDA $139,740 $131,055 $295,758 $279,068 Reconciliation of diluted earnings per share to adjusted diluted earnings per share Diluted earnings per share - GAAP $0.36 $0.17 $0.75 $0.36 Restructuring charges 0.02 0.06 0.04 0.06 Foreign currency (gain) loss on intercompany loans (0.01) 0.07 (0.03) 0.10 Pension expense of plans to be terminated 0.04 - 0.08 - Loss (gain) on debt activities 0.01 - 0.01 0.10 Transaction and strategic review costs 0.01 0.01 0.04 0.01 Benefit in connection with Ecommerce Restructuring - (0.03) - (0.03) Adjusted diluted earnings per share $0.43 $0.27 $0.90 $0.61 The sum of the earnings per share amounts may not equal the total due to rounding. Reconciliation of net cash from operating activities to free cash flow Net cash from operating activities $152,916 $111,388 $197,072 $94,709 Capital expenditures (18,485) (13,343) (34,331) (30,230) Restructuring payments 13,697 8,412 28,898 21,518 Adjusted Free cash flow $148,128 $106,457 $191,639 $85,997 Three Months Ended June 30, Six Months Ended June 30, #