PROG Internal PROG Holdings, Inc. Q2 2026 Earnings Supplement JULY 29, 2026 Exhibit 99.2
2 Statements, estimates and projections in this earnings supplement regarding our business that are not historical facts are "forward-looking statements" that involve risks and uncertainties which could cause actual results to differ materially from those contained in the forward-looking statements. Such forward-looking statements generally can be identified by the use of forward-looking terminology, such as "continued," “targeted,” and "outlook," and “similar forward-looking terminology. These risks and uncertainties include (i) continued volatility and challenges in the macroeconomic environment, including due to the war in Iran and related geopolitical disruptions and increases in fuel and other prices, and their impact on: (a) consumer confidence and customer demand for the merchandise that our retail partners and Purchasing Power sell, in particular consumer durables, such as home appliances, electronics and furniture; (b) our customers’ disposable income and their ability to make the lease and loan payments they owe the Company; and (c) our overall financial performance and outlook; (ii) the impact of the uncertain macroeconomic environment on our proprietary algorithms and decisioning tools that we use to approve customers such that they are no longer indicative of our customers’ ability to perform, which in turn may limit the ability of our businesses to manage risk, avoid lease and loan charge-offs and may result in insufficient reserves to cover actual losses; (iii) a large percentage of Progressive Leasing's revenue being concentrated with several key retail partners, and the loss of any of these retail partner relationships materially and adversely affecting several aspects of our performance; (iv) Progressive Leasing being unable to attract additional retail partners and retain and grow its relationships with its existing retail partners, and/or Purchasing Power being unable to attract additional employer-clients and retain and grow its relationships with its existing clients, resulting in several aspects of our performance being materially and adversely affected; (v) our businesses being unable to attract new consumers and retain and grow their relationships with their existing customers materially and adversely affecting several aspects of our performance; (vi) Four’s and Purchasing Power's business models differing significantly from Progressive Leasing’s lease-to-own business, which means these businesses have different risk profiles; (vii) our efforts to modernize and enhance certain enterprise-wide information management systems and technologies adversely impacting our businesses and operations; (viii) the inability of our businesses to successfully operate in highly and increasingly competitive industries materially and adversely affecting several aspects of our performance; (ix) our business, results of operations, financial condition, and prospects being materially and adversely affected due to our businesses failing to maintain a consistently high level of consumer satisfaction and trust in its brands; (x) our businesses being subject to extensive federal, state and local laws and regulations, including certain laws and regulations unique to the industries in which our businesses operate, that may subject them to government investigations and significant monetary penalties, remediation expenses and compliance-related burdens that may result in them changing the manner in which they operate, which may be materially adverse to several aspects of our performance; (xi) our performance being materially and adversely affected due to the transactions offered to consumers by our businesses being negatively characterized by federal, state and local government officials, consumer advocacy groups and the media; (xii) our inability to protect confidential, proprietary, or sensitive information, including the confidential information of our customers, being adversely affected by cyber-attacks or similar disruptions, which may result in significant costs, litigation and reputational damage or otherwise have a material adverse impact on several aspects of our performance; (xiii) any significant disruption in our vendors' information technology systems, or disruptions in the information our businesses rely on in their lease and loan decisioning, materially and adversely affecting several aspects of our performance; (xiv) our capital allocation strategy and financial policies; and (xv) the other risks and uncertainties discussed under "Risk Factors" in the Company’s Annual Report on Form 10-K for the fiscal year ended December 31, 2025, filed with the SEC on February 18, 2026. Statements, estimates and projections in this earnings supplement that are "forward-looking" include without limitation statements, estimates and projections about: (i) the strength of our balance sheet; (ii) our net leverage ratio; (iii) our revised full year 2026 outlook and the guidance we provide for the third quarter of 2026. You are cautioned not to place undue reliance on these forward-looking statements, which speak only as of the date of this earnings supplement. Except as required by law, the Company undertakes no obligation to update these forward-looking statements to reflect subsequent events or circumstances after the date of this earnings supplement. Use of Forward-Looking Statements
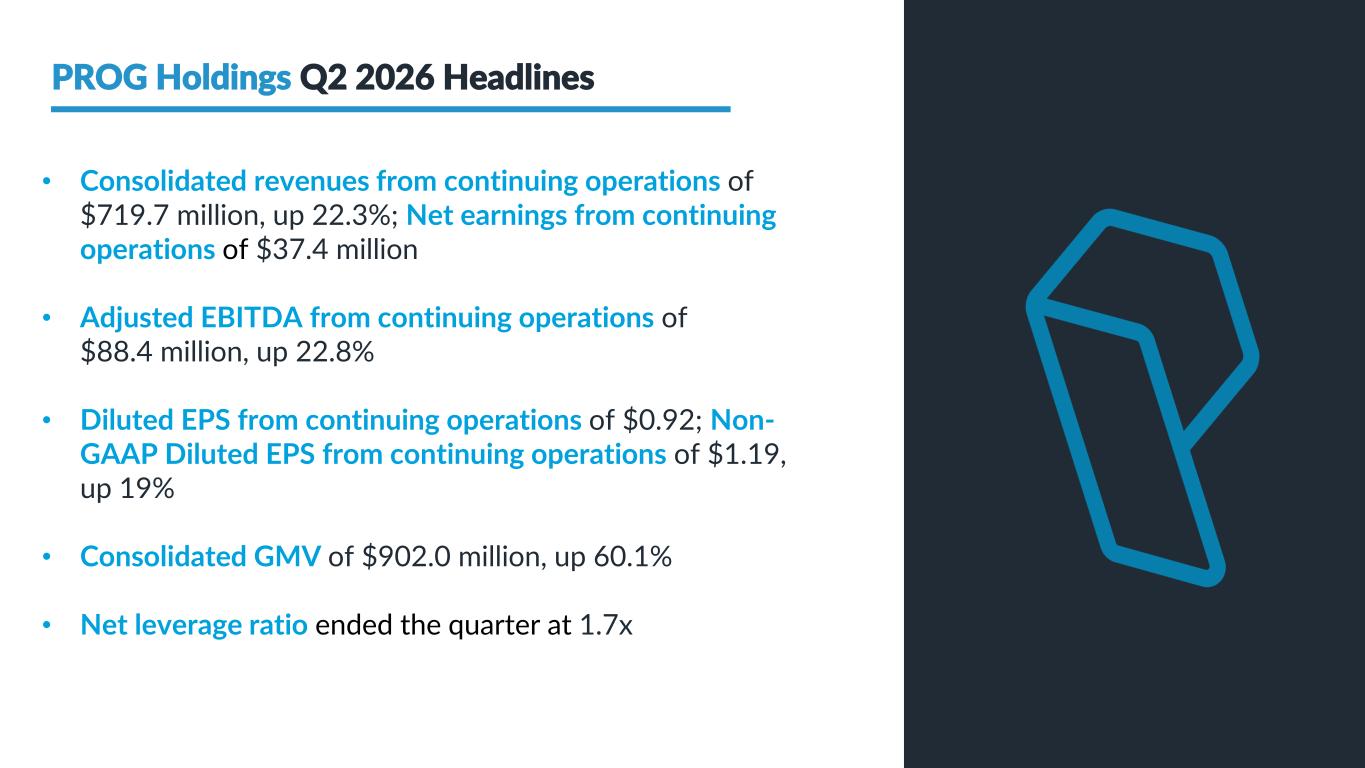
PROG Internal 3 PROG Holdings Q2 2026 Headlines • Consolidated revenues from continuing operations of $719.7 million, up 22.3%; Net earnings from continuing operations of $37.4 million • Adjusted EBITDA from continuing operations of $88.4 million, up 22.8% • Diluted EPS from continuing operations of $0.92; Non- GAAP Diluted EPS from continuing operations of $1.19, up 19% • Consolidated GMV of $902.0 million, up 60.1% • Net leverage ratio ended the quarter at 1.7x
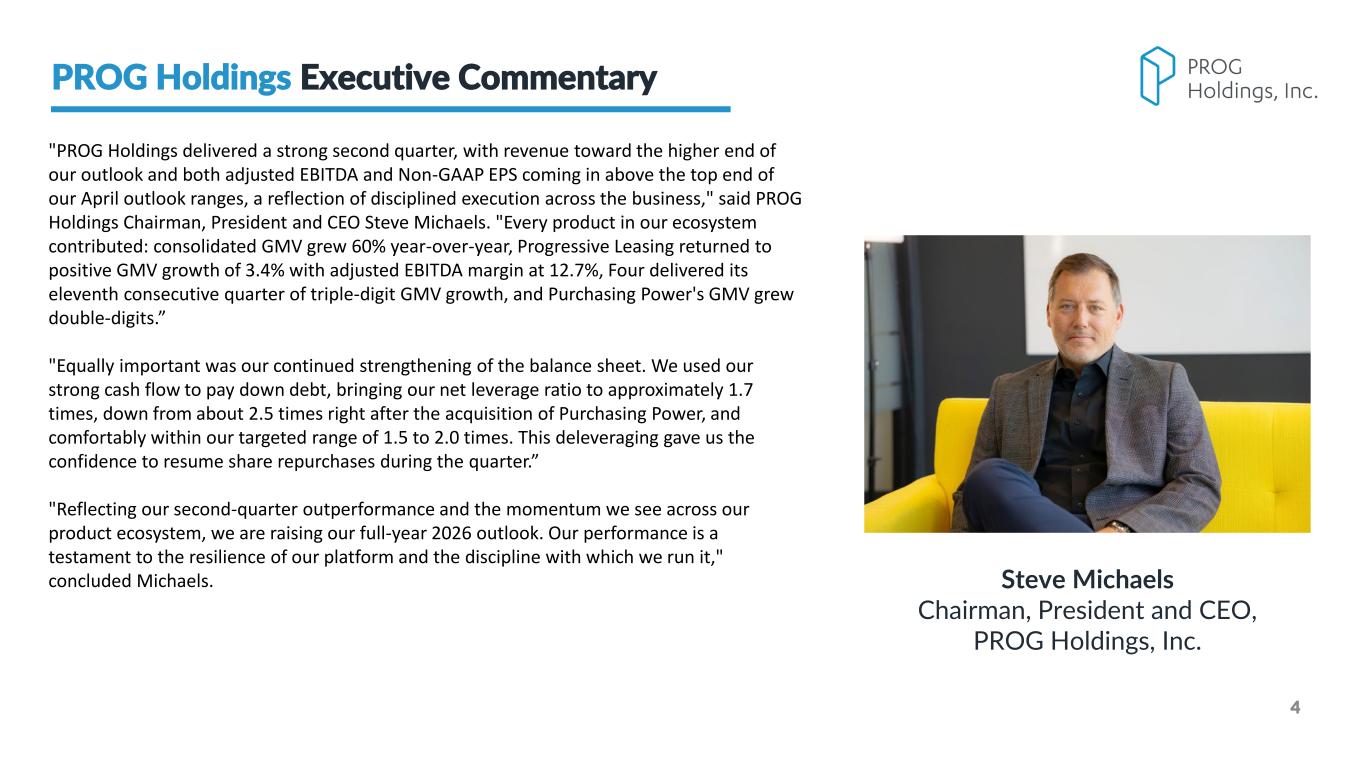
PROG Internal 4 "PROG Holdings delivered a strong second quarter, with revenue toward the higher end of our outlook and both adjusted EBITDA and Non-GAAP EPS coming in above the top end of our April outlook ranges, a reflection of disciplined execution across the business," said PROG Holdings Chairman, President and CEO Steve Michaels. "Every product in our ecosystem contributed: consolidated GMV grew 60% year-over-year, Progressive Leasing returned to positive GMV growth of 3.4% with adjusted EBITDA margin at 12.7%, Four delivered its eleventh consecutive quarter of triple-digit GMV growth, and Purchasing Power's GMV grew double-digits.” "Equally important was our continued strengthening of the balance sheet. We used our strong cash flow to pay down debt, bringing our net leverage ratio to approximately 1.7 times, down from about 2.5 times right after the acquisition of Purchasing Power, and comfortably within our targeted range of 1.5 to 2.0 times. This deleveraging gave us the confidence to resume share repurchases during the quarter.” "Reflecting our second-quarter outperformance and the momentum we see across our product ecosystem, we are raising our full-year 2026 outlook. Our performance is a testament to the resilience of our platform and the discipline with which we run it," concluded Michaels. Steve Michaels Chairman, President and CEO, PROG Holdings, Inc. PROG Holdings Executive Commentary
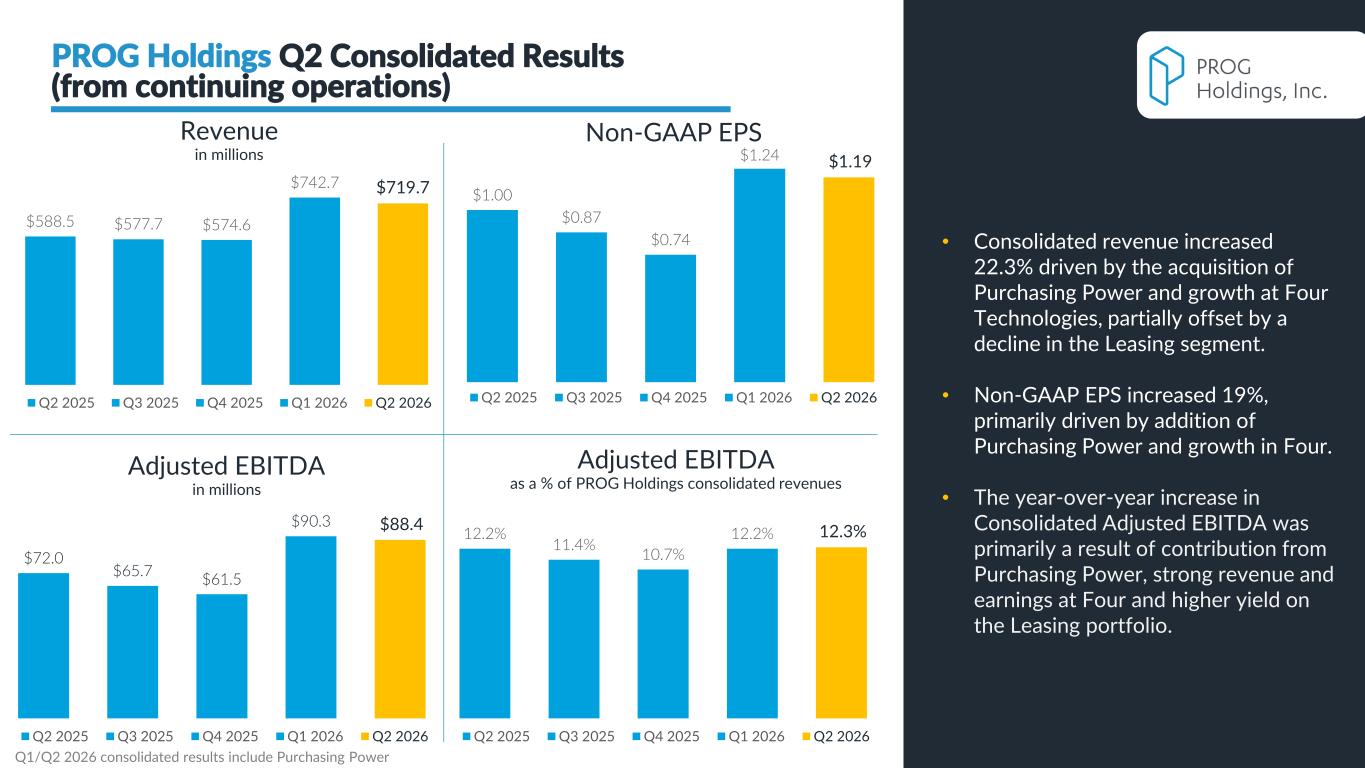
PROG Internal Adjusted EBITDA in millions 5 $588.5 $577.7 $574.6 $742.7 $719.7 Q2 2025 Q3 2025 Q4 2025 Q1 2026 Q2 2026 Non-GAAP EPSRevenue in millions 12.2% 11.4% 10.7% 12.2% 12.3% Q2 2025 Q3 2025 Q4 2025 Q1 2026 Q2 2026 Adjusted EBITDA as a % of PROG Holdings consolidated revenues PROG Holdings Q2 Consolidated Results (from continuing operations) $72.0 $65.7 $61.5 $90.3 $88.4 Q2 2025 Q3 2025 Q4 2025 Q1 2026 Q2 2026 $1.00 $0.87 $0.74 $1.24 $1.19 Q2 2025 Q3 2025 Q4 2025 Q1 2026 Q2 2026 • Consolidated revenue increased 22.3% driven by the acquisition of Purchasing Power and growth at Four Technologies, partially offset by a decline in the Leasing segment. • Non-GAAP EPS increased 19%, primarily driven by addition of Purchasing Power and growth in Four. • The year-over-year increase in Consolidated Adjusted EBITDA was primarily a result of contribution from Purchasing Power, strong revenue and earnings at Four and higher yield on the Leasing portfolio. Q1/Q2 2026 consolidated results include Purchasing Power

PROG Internal Results
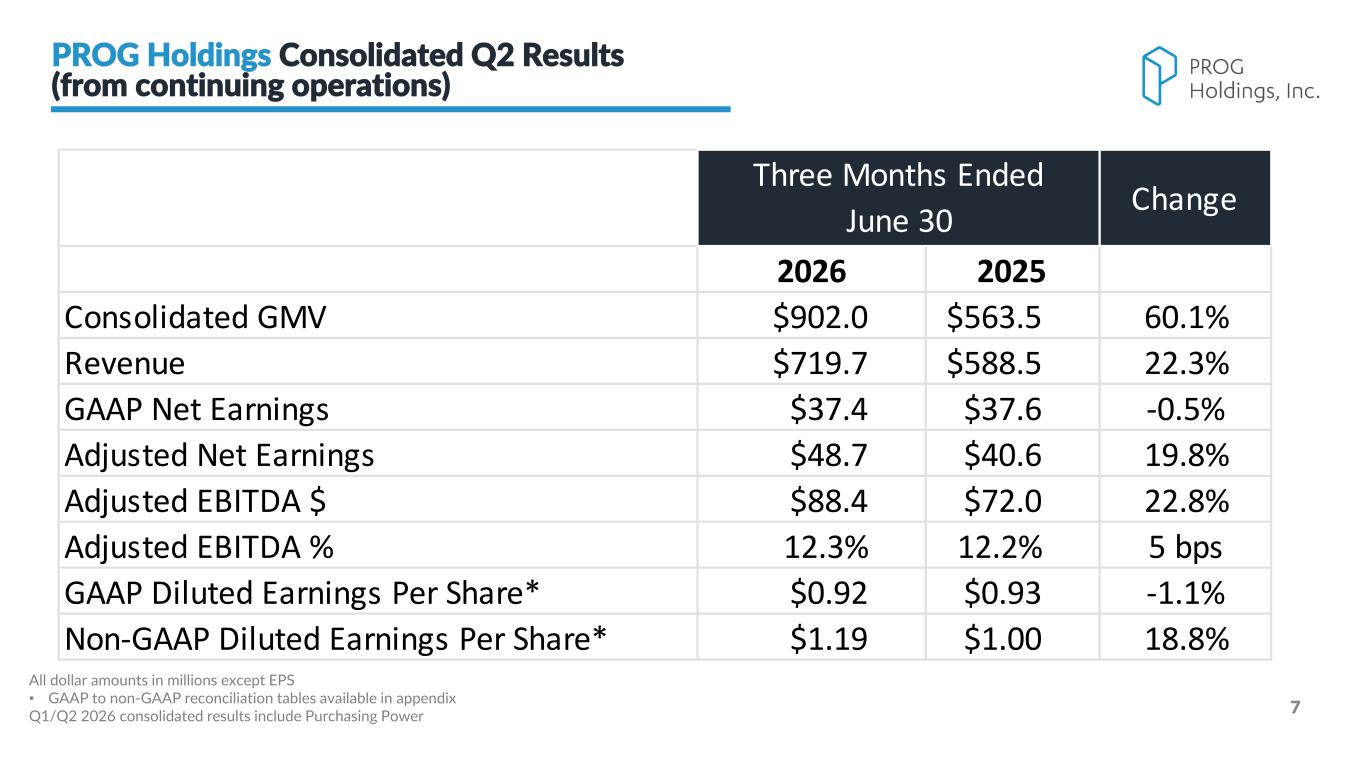
PROG Internal 7 2026 2025 Consolidated GMV $902.0 $563.5 60.1% Revenue $719.7 $588.5 22.3% GAAP Net Earnings $37.4 $37.6 -0.5% Adjusted Net Earnings $48.7 $40.6 19.8% Adjusted EBITDA $ $88.4 $72.0 22.8% Adjusted EBITDA % 12.3% 12.2% 5 bps GAAP Diluted Earnings Per Share* $0.92 $0.93 -1.1% Non-GAAP Diluted Earnings Per Share* $1.19 $1.00 18.8% Three Months Ended June 30 Change All dollar amounts in millions except EPS • GAAP to non-GAAP reconciliation tables available in appendix Q1/Q2 2026 consolidated results include Purchasing Power PROG Holdings Consolidated Q2 Results (from continuing operations)
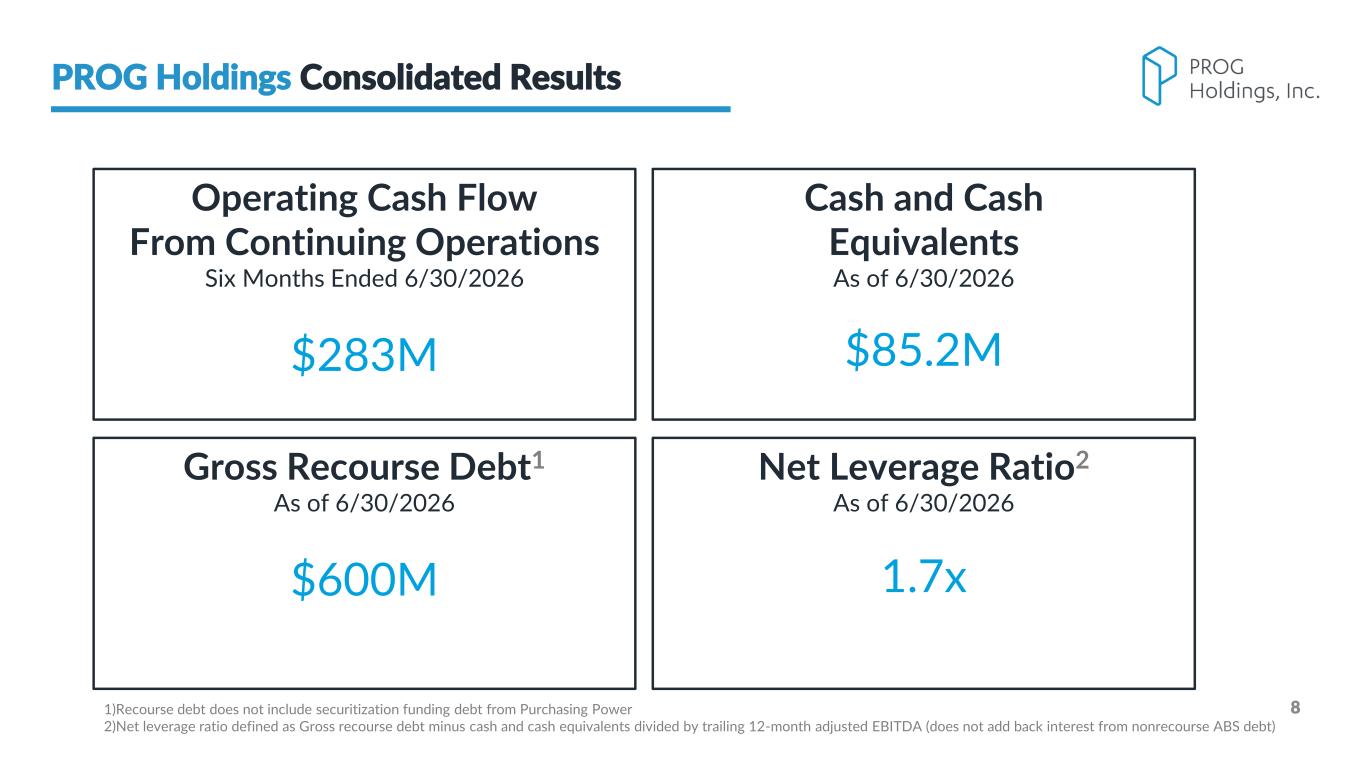
PROG Internal 8 PROG Holdings Consolidated Results Cash and Cash Equivalents As of 6/30/2026 $85.2M Gross Recourse Debt1 As of 6/30/2026 $600M Net Leverage Ratio2 As of 6/30/2026 1.7x Operating Cash Flow From Continuing Operations Six Months Ended 6/30/2026 $283M 1)Recourse debt does not include securitization funding debt from Purchasing Power 2)Net leverage ratio defined as Gross recourse debt minus cash and cash equivalents divided by trailing 12-month adjusted EBITDA (does not add back interest from nonrecourse ABS debt)
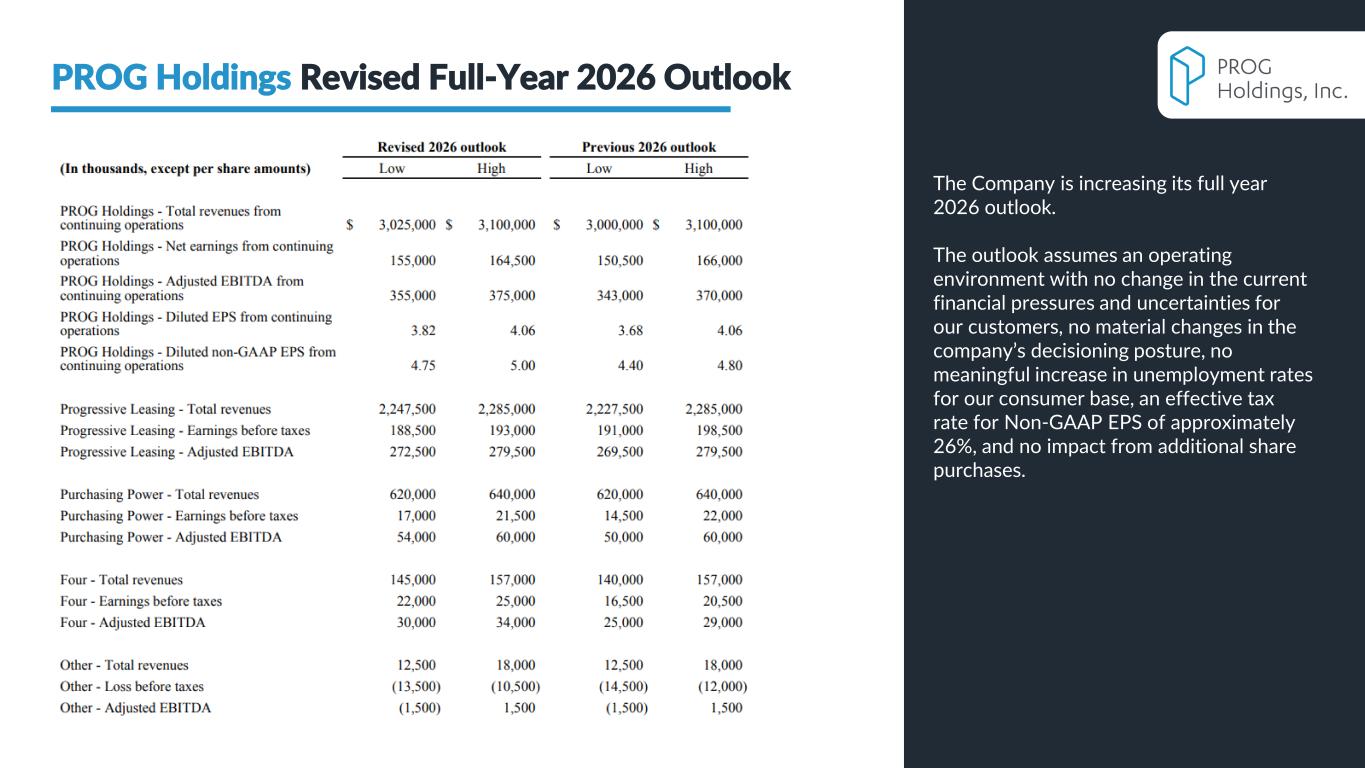
PROG Internal 9 PROG Holdings Revised Full-Year 2026 Outlook The Company is increasing its full year 2026 outlook. The outlook assumes an operating environment with no change in the current financial pressures and uncertainties for our customers, no material changes in the company’s decisioning posture, no meaningful increase in unemployment rates for our consumer base, an effective tax rate for Non-GAAP EPS of approximately 26%, and no impact from additional share purchases.
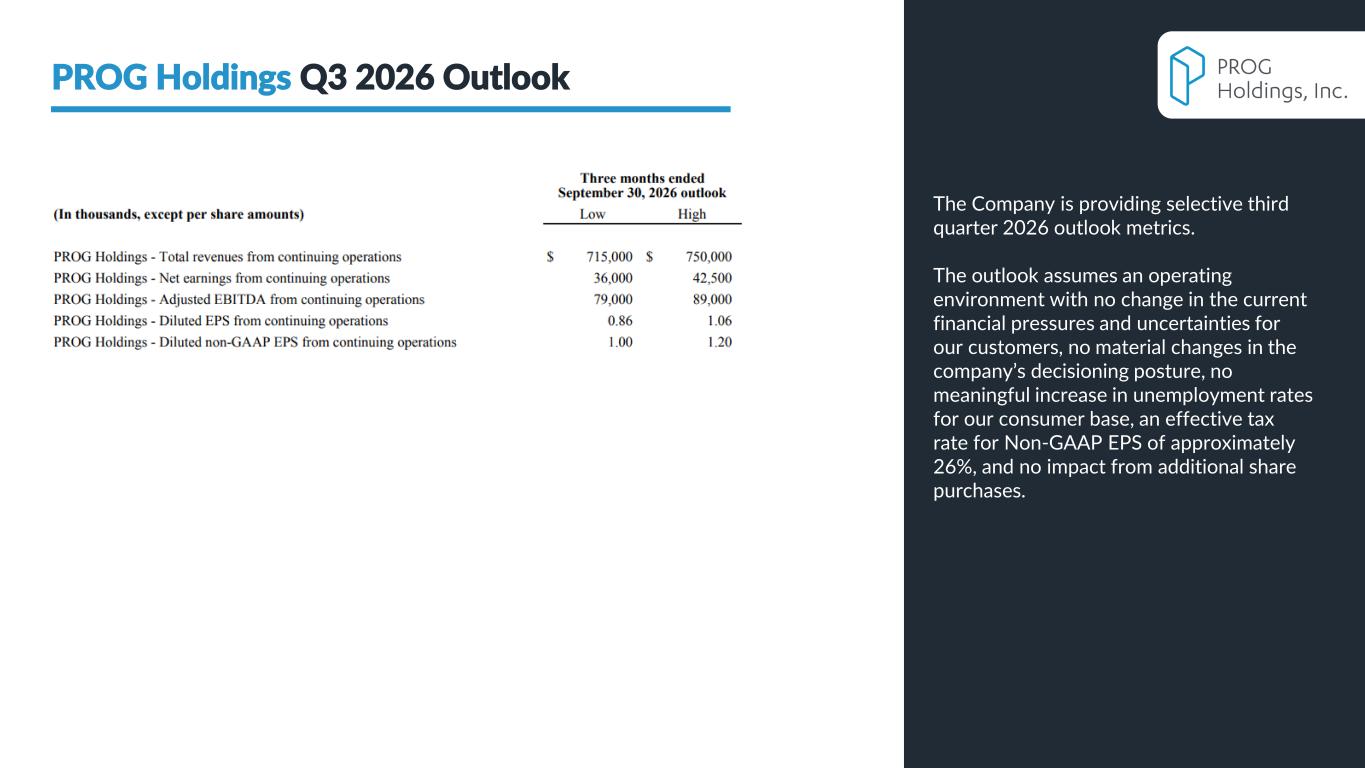
PROG Internal 10 PROG Holdings Q3 2026 Outlook The Company is providing selective third quarter 2026 outlook metrics. The outlook assumes an operating environment with no change in the current financial pressures and uncertainties for our customers, no material changes in the company’s decisioning posture, no meaningful increase in unemployment rates for our consumer base, an effective tax rate for Non-GAAP EPS of approximately 26%, and no impact from additional share purchases.

PROG Internal
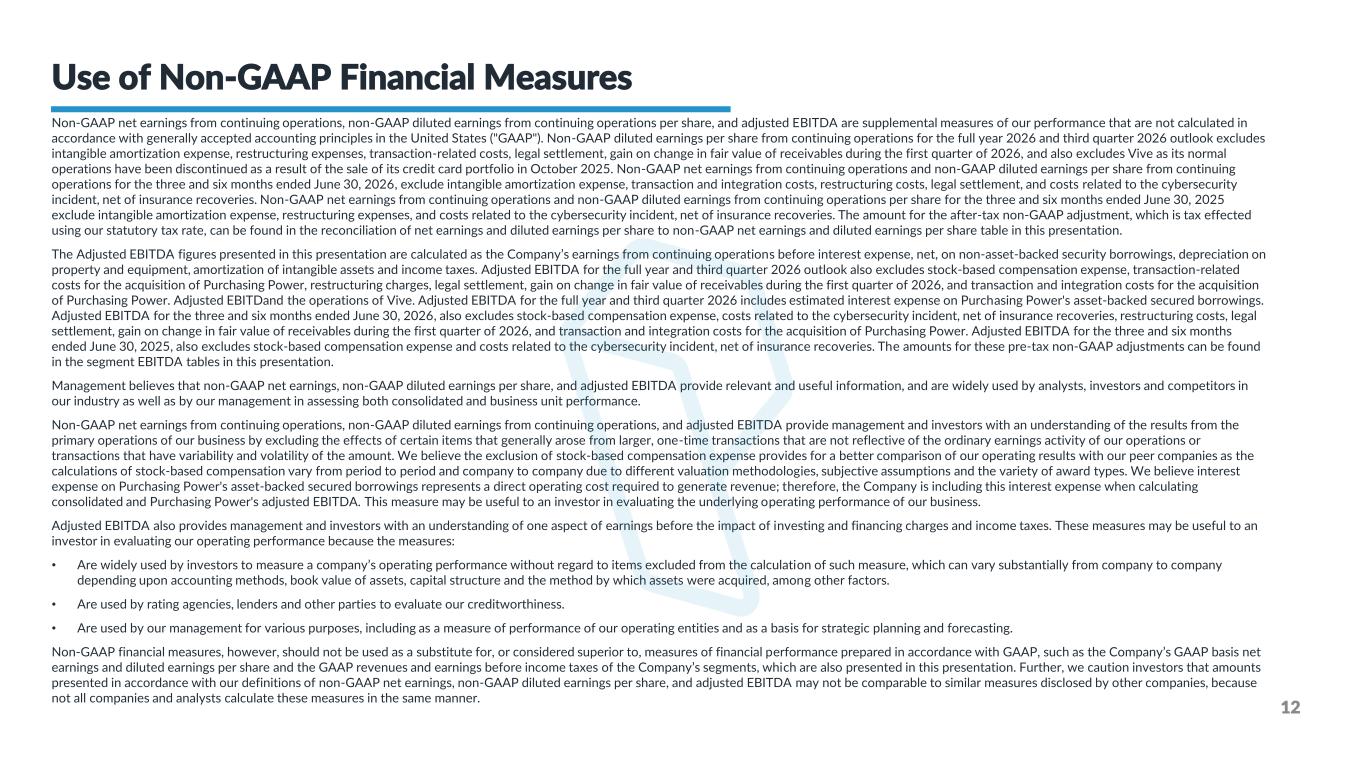
PROG Internal Non-GAAP net earnings from continuing operations, non-GAAP diluted earnings from continuing operations per share, and adjusted EBITDA are supplemental measures of our performance that are not calculated in accordance with generally accepted accounting principles in the United States ("GAAP"). Non-GAAP diluted earnings per share from continuing operations for the full year 2026 and third quarter 2026 outlook excludes intangible amortization expense, restructuring expenses, transaction-related costs, legal settlement, gain on change in fair value of receivables during the first quarter of 2026, and also excludes Vive as its normal operations have been discontinued as a result of the sale of its credit card portfolio in October 2025. Non-GAAP net earnings from continuing operations and non-GAAP diluted earnings per share from continuing operations for the three and six months ended June 30, 2026, exclude intangible amortization expense, transaction and integration costs, restructuring costs, legal settlement, and costs related to the cybersecurity incident, net of insurance recoveries. Non-GAAP net earnings from continuing operations and non-GAAP diluted earnings from continuing operations per share for the three and six months ended June 30, 2025 exclude intangible amortization expense, restructuring expenses, and costs related to the cybersecurity incident, net of insurance recoveries. The amount for the after-tax non-GAAP adjustment, which is tax effected using our statutory tax rate, can be found in the reconciliation of net earnings and diluted earnings per share to non-GAAP net earnings and diluted earnings per share table in this presentation. The Adjusted EBITDA figures presented in this presentation are calculated as the Company’s earnings from continuing operations before interest expense, net, on non-asset-backed security borrowings, depreciation on property and equipment, amortization of intangible assets and income taxes. Adjusted EBITDA for the full year and third quarter 2026 outlook also excludes stock-based compensation expense, transaction-related costs for the acquisition of Purchasing Power, restructuring charges, legal settlement, gain on change in fair value of receivables during the first quarter of 2026, and transaction and integration costs for the acquisition of Purchasing Power. Adjusted EBITDand the operations of Vive. Adjusted EBITDA for the full year and third quarter 2026 includes estimated interest expense on Purchasing Power's asset-backed secured borrowings. Adjusted EBITDA for the three and six months ended June 30, 2026, also excludes stock-based compensation expense, costs related to the cybersecurity incident, net of insurance recoveries, restructuring costs, legal settlement, gain on change in fair value of receivables during the first quarter of 2026, and transaction and integration costs for the acquisition of Purchasing Power. Adjusted EBITDA for the three and six months ended June 30, 2025, also excludes stock-based compensation expense and costs related to the cybersecurity incident, net of insurance recoveries. The amounts for these pre-tax non-GAAP adjustments can be found in the segment EBITDA tables in this presentation. Management believes that non-GAAP net earnings, non-GAAP diluted earnings per share, and adjusted EBITDA provide relevant and useful information, and are widely used by analysts, investors and competitors in our industry as well as by our management in assessing both consolidated and business unit performance. Non-GAAP net earnings from continuing operations, non-GAAP diluted earnings from continuing operations, and adjusted EBITDA provide management and investors with an understanding of the results from the primary operations of our business by excluding the effects of certain items that generally arose from larger, one-time transactions that are not reflective of the ordinary earnings activity of our operations or transactions that have variability and volatility of the amount. We believe the exclusion of stock-based compensation expense provides for a better comparison of our operating results with our peer companies as the calculations of stock-based compensation vary from period to period and company to company due to different valuation methodologies, subjective assumptions and the variety of award types. We believe interest expense on Purchasing Power's asset-backed secured borrowings represents a direct operating cost required to generate revenue; therefore, the Company is including this interest expense when calculating consolidated and Purchasing Power's adjusted EBITDA. This measure may be useful to an investor in evaluating the underlying operating performance of our business. Adjusted EBITDA also provides management and investors with an understanding of one aspect of earnings before the impact of investing and financing charges and income taxes. These measures may be useful to an investor in evaluating our operating performance because the measures: • Are widely used by investors to measure a company’s operating performance without regard to items excluded from the calculation of such measure, which can vary substantially from company to company depending upon accounting methods, book value of assets, capital structure and the method by which assets were acquired, among other factors. • Are used by rating agencies, lenders and other parties to evaluate our creditworthiness. • Are used by our management for various purposes, including as a measure of performance of our operating entities and as a basis for strategic planning and forecasting. Non-GAAP financial measures, however, should not be used as a substitute for, or considered superior to, measures of financial performance prepared in accordance with GAAP, such as the Company’s GAAP basis net earnings and diluted earnings per share and the GAAP revenues and earnings before income taxes of the Company’s segments, which are also presented in this presentation. Further, we caution investors that amounts presented in accordance with our definitions of non-GAAP net earnings, non-GAAP diluted earnings per share, and adjusted EBITDA may not be comparable to similar measures disclosed by other companies, because not all companies and analysts calculate these measures in the same manner. 12 Use of Non-GAAP Financial Measures
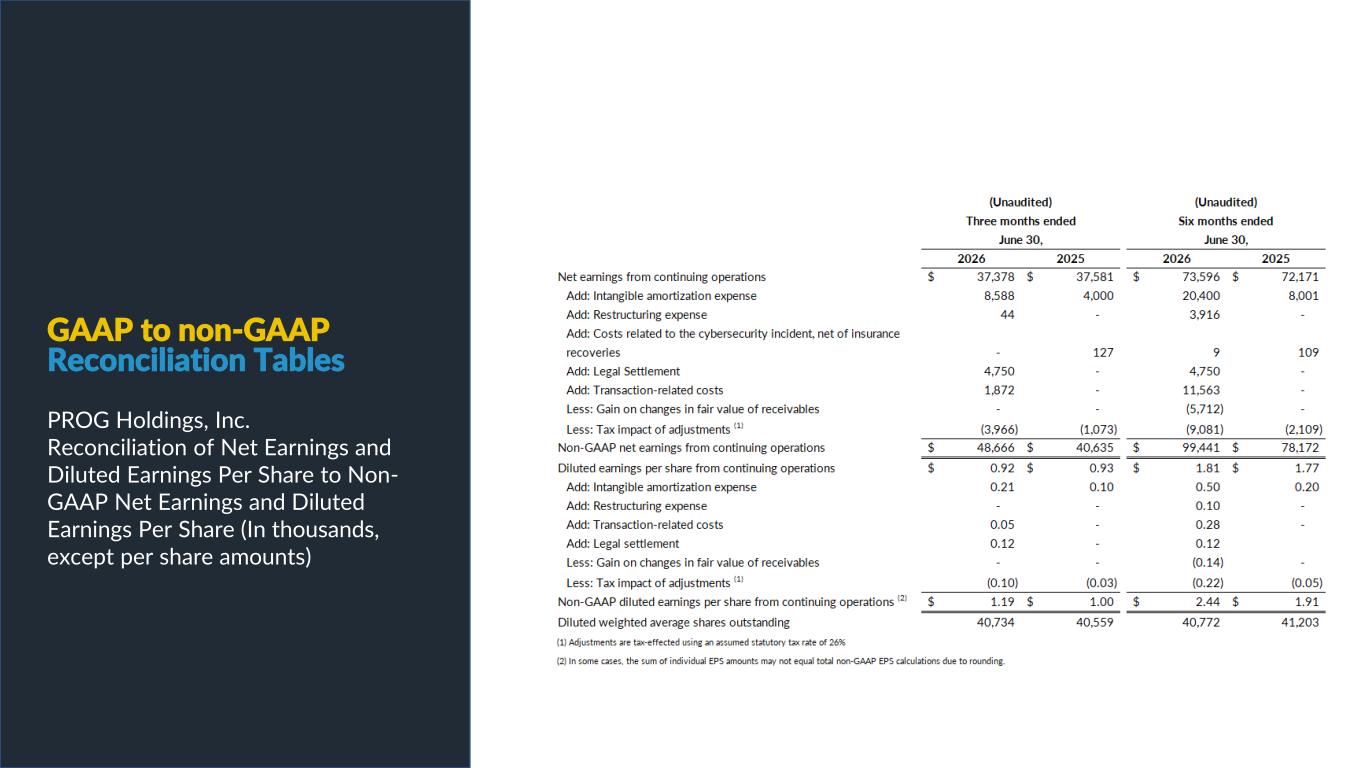
PROG Internal GAAP to non-GAAP Reconciliation Tables PROG Holdings, Inc. Reconciliation of Net Earnings and Diluted Earnings Per Share to Non- GAAP Net Earnings and Diluted Earnings Per Share (In thousands, except per share amounts)
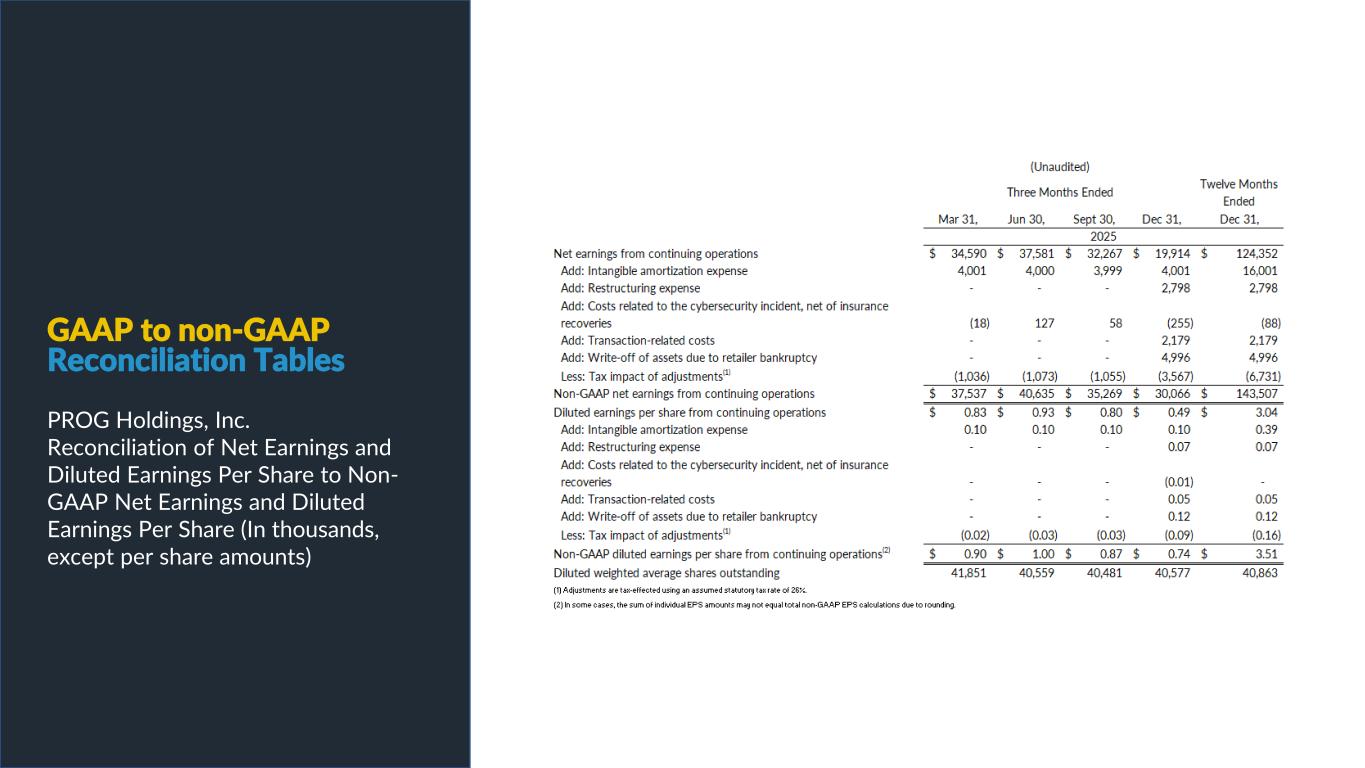
PROG Internal GAAP to non-GAAP Reconciliation Tables PROG Holdings, Inc. Reconciliation of Net Earnings and Diluted Earnings Per Share to Non- GAAP Net Earnings and Diluted Earnings Per Share (In thousands, except per share amounts)
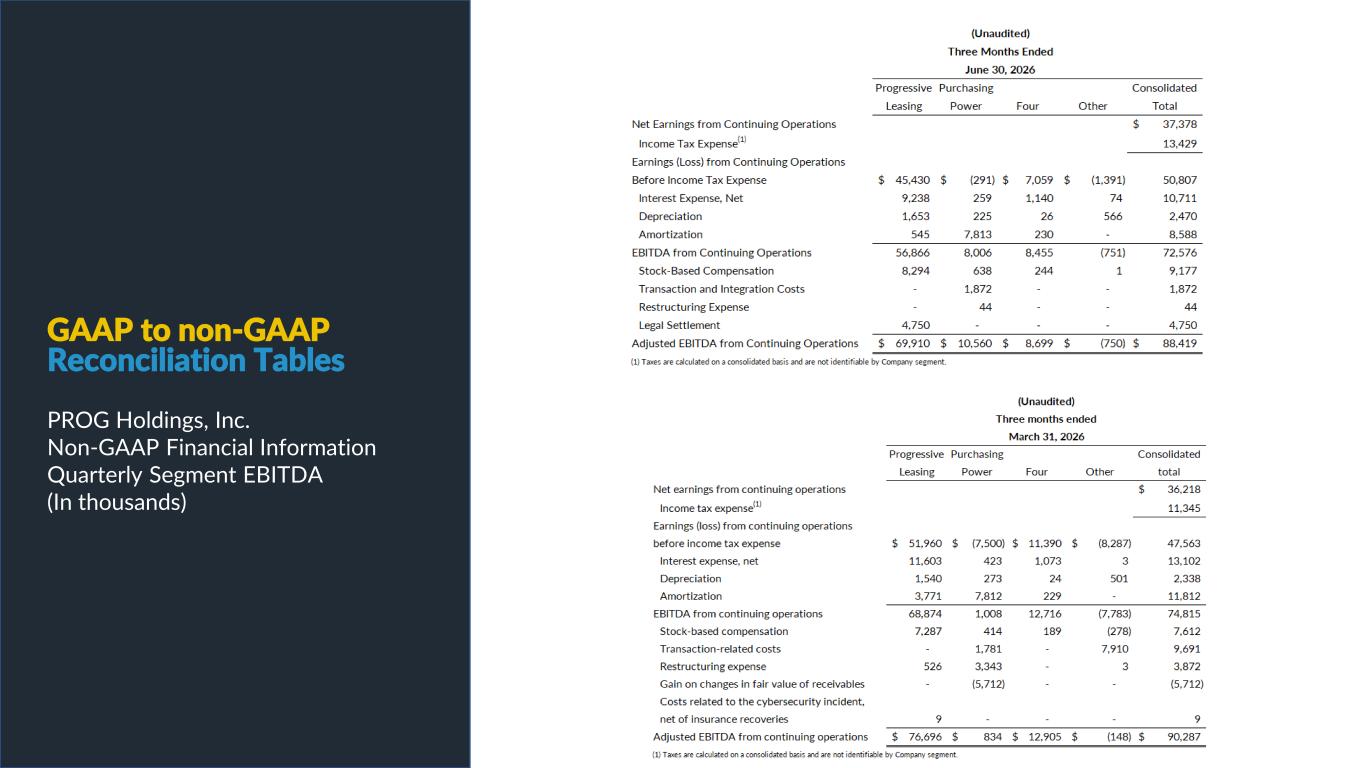
PROG Internal GAAP to non-GAAP Reconciliation Tables PROG Holdings, Inc. Non-GAAP Financial Information Quarterly Segment EBITDA (In thousands)
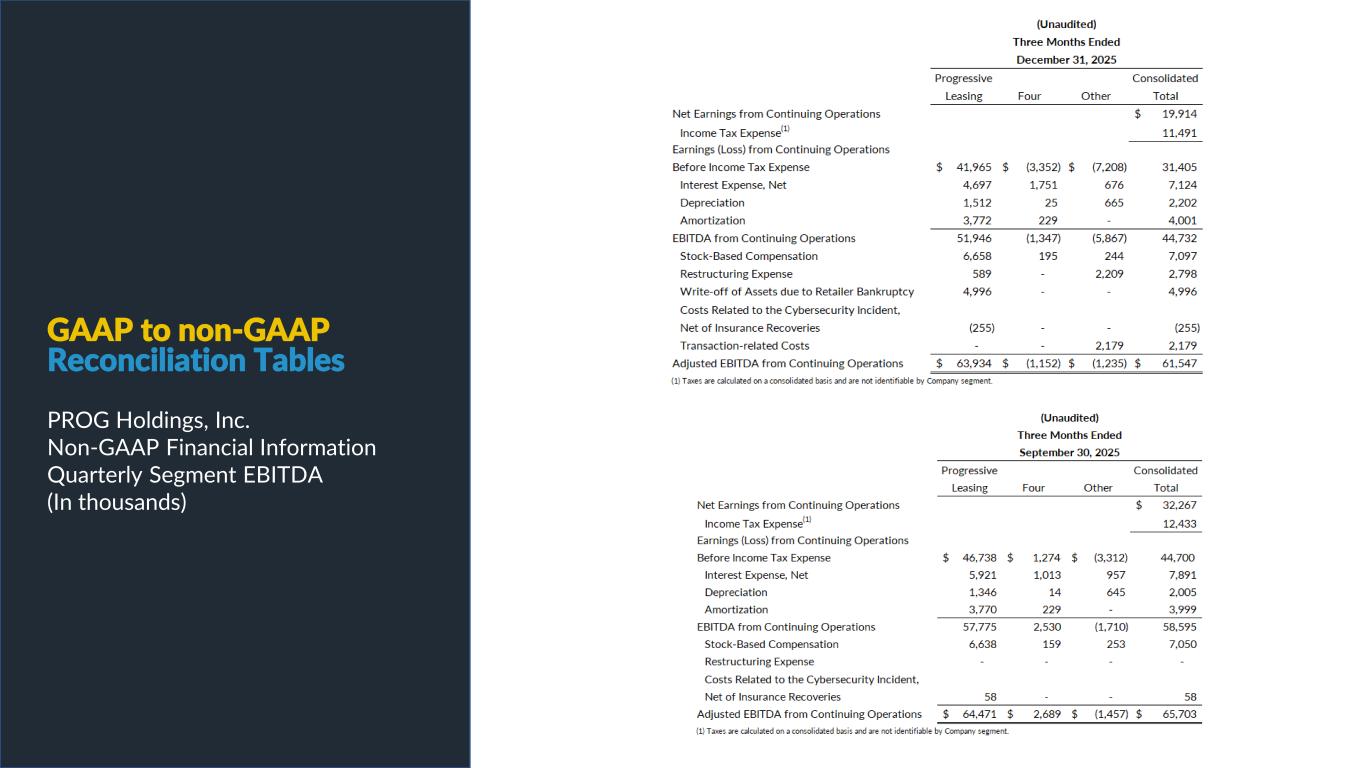
PROG Internal GAAP to non-GAAP Reconciliation Tables PROG Holdings, Inc. Non-GAAP Financial Information Quarterly Segment EBITDA (In thousands)
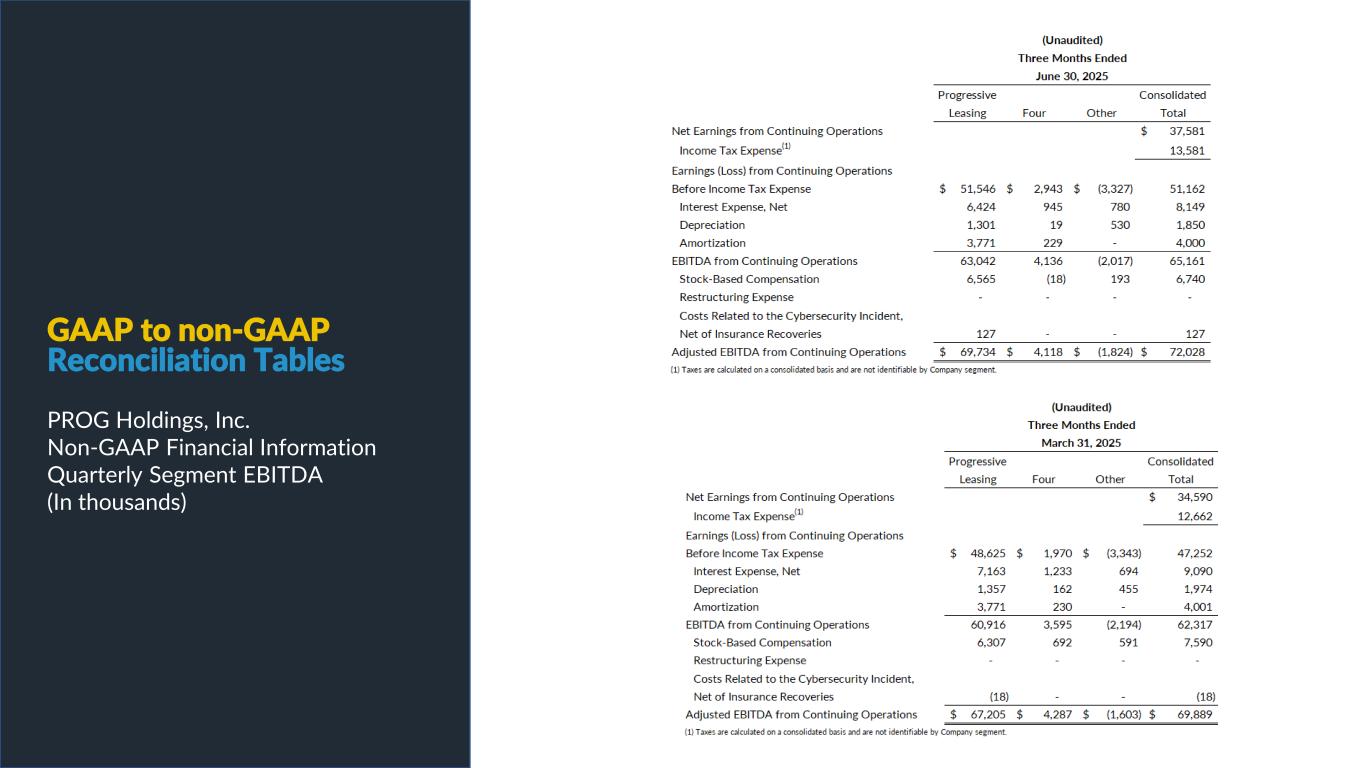
PROG Internal GAAP to non-GAAP Reconciliation Tables PROG Holdings, Inc. Non-GAAP Financial Information Quarterly Segment EBITDA (In thousands)
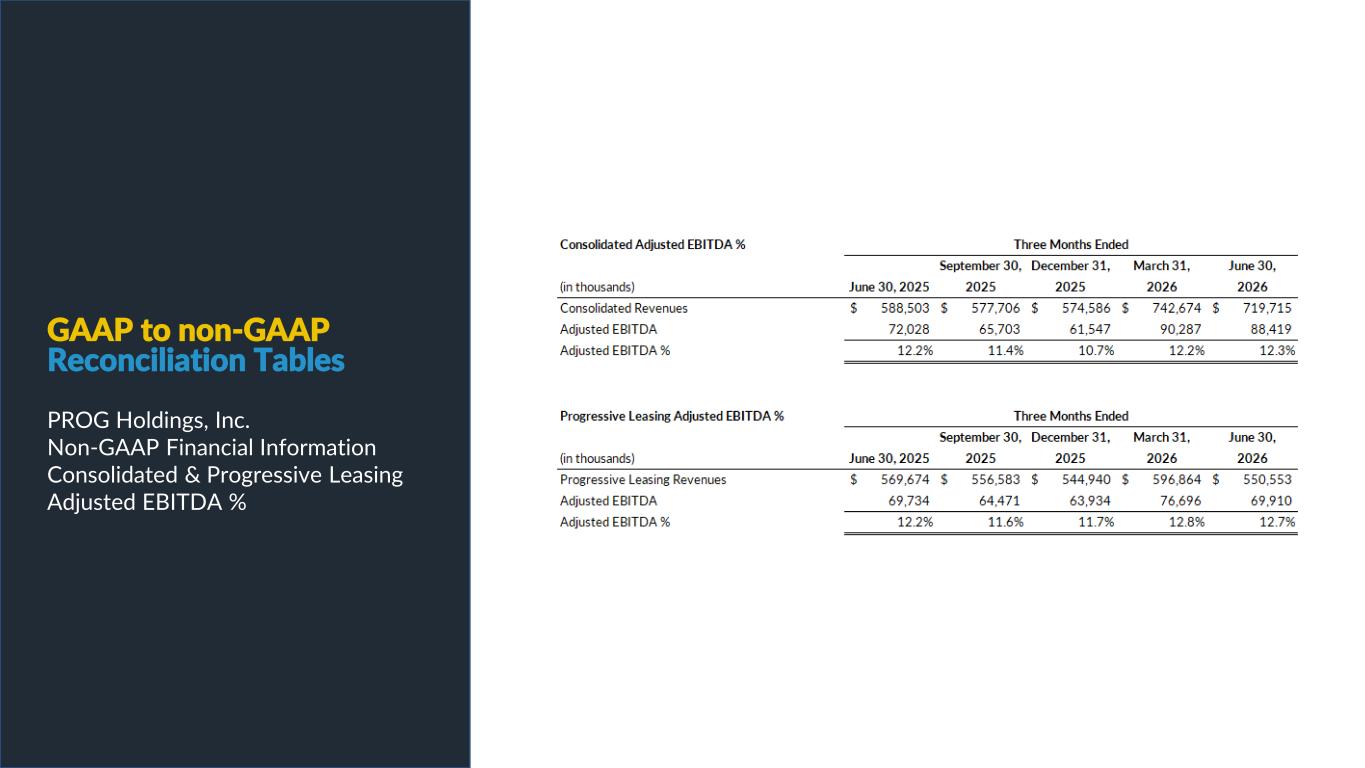
PROG Internal GAAP to non-GAAP Reconciliation Tables PROG Holdings, Inc. Non-GAAP Financial Information Consolidated & Progressive Leasing Adjusted EBITDA %
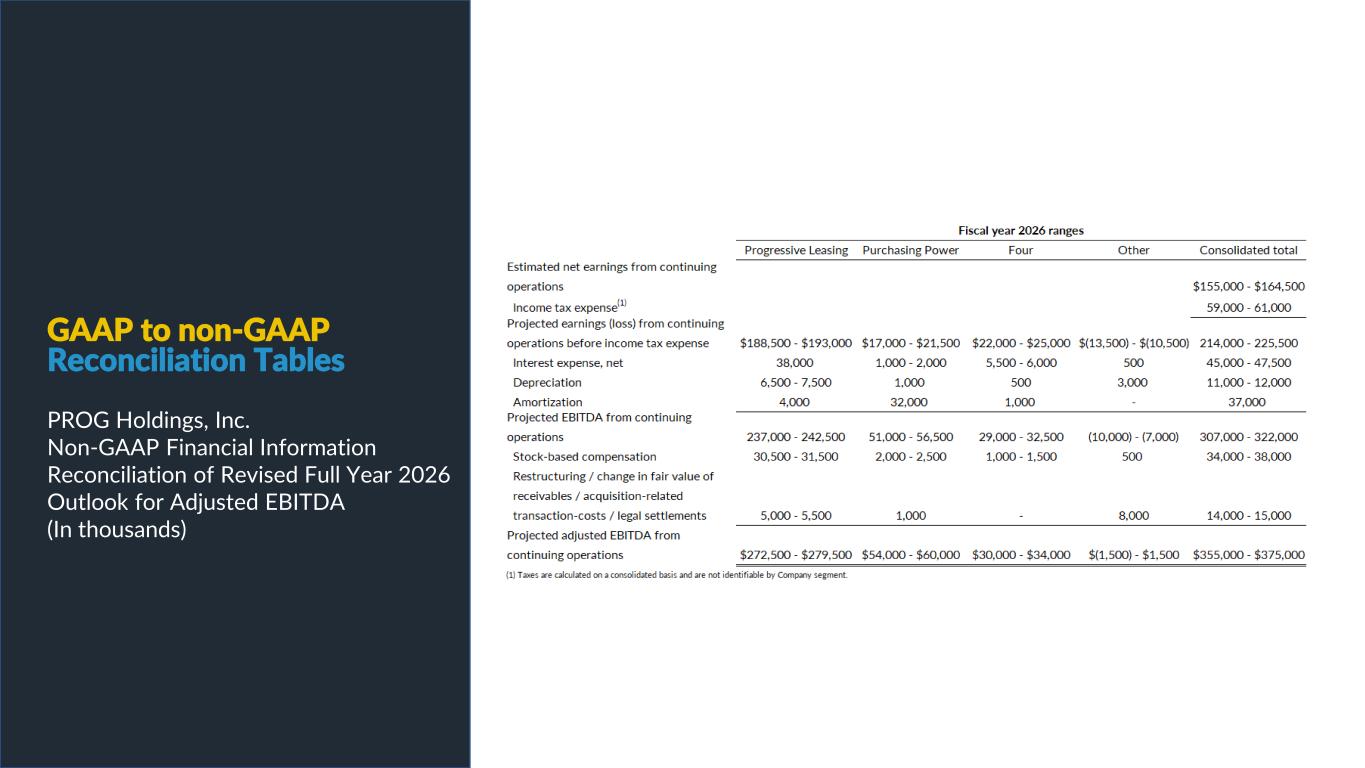
PROG Internal GAAP to non-GAAP Reconciliation Tables PROG Holdings, Inc. Non-GAAP Financial Information Reconciliation of Revised Full Year 2026 Outlook for Adjusted EBITDA (In thousands)
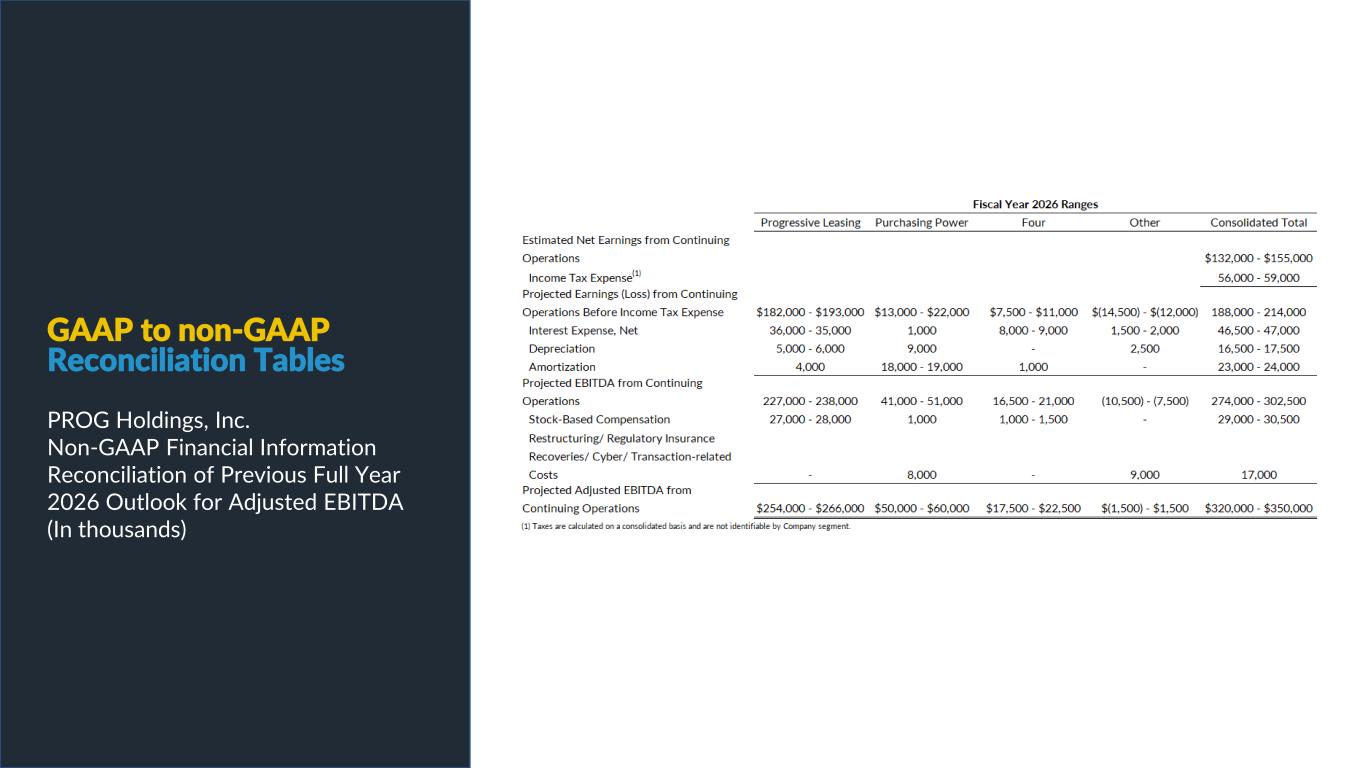
PROG Internal GAAP to non-GAAP Reconciliation Tables PROG Holdings, Inc. Non-GAAP Financial Information Reconciliation of Previous Full Year 2026 Outlook for Adjusted EBITDA (In thousands)
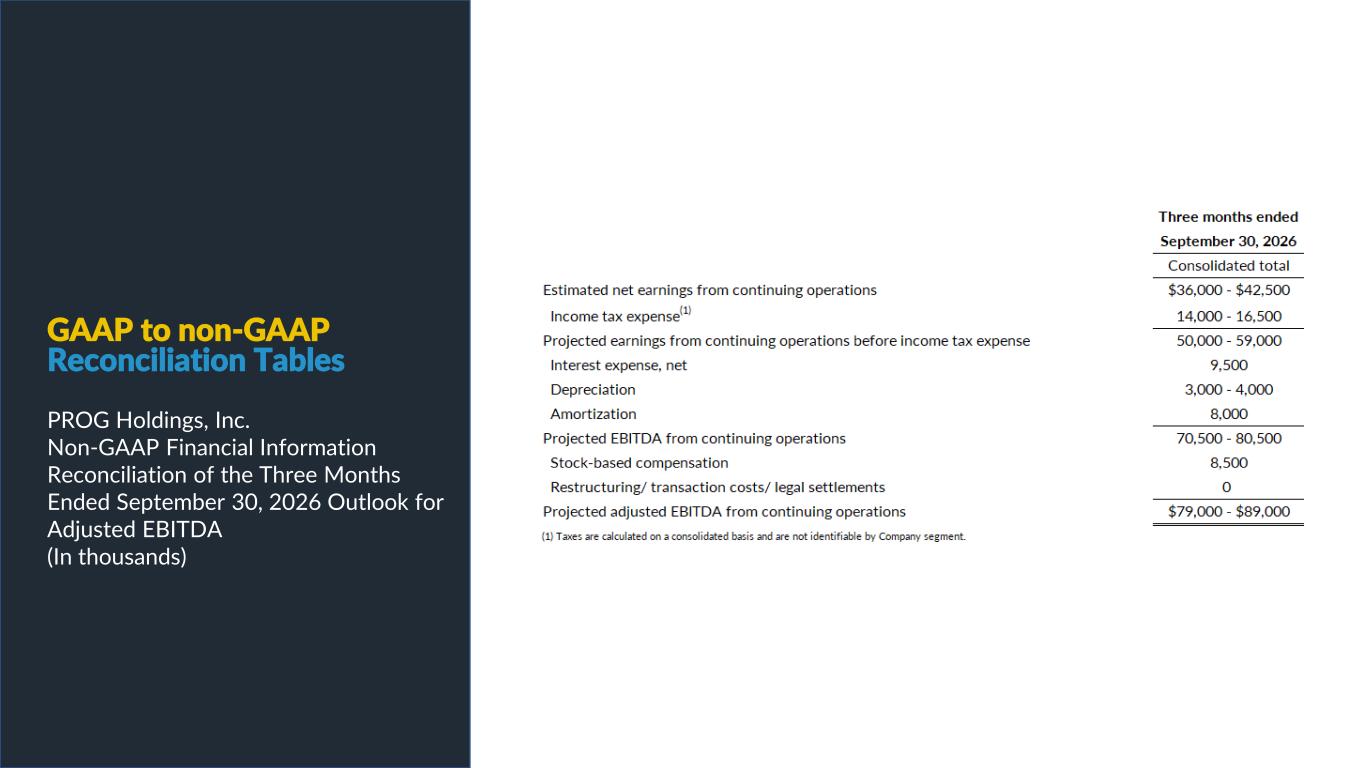
PROG Internal GAAP to non-GAAP Reconciliation Tables PROG Holdings, Inc. Non-GAAP Financial Information Reconciliation of the Three Months Ended September 30, 2026 Outlook for Adjusted EBITDA (In thousands)
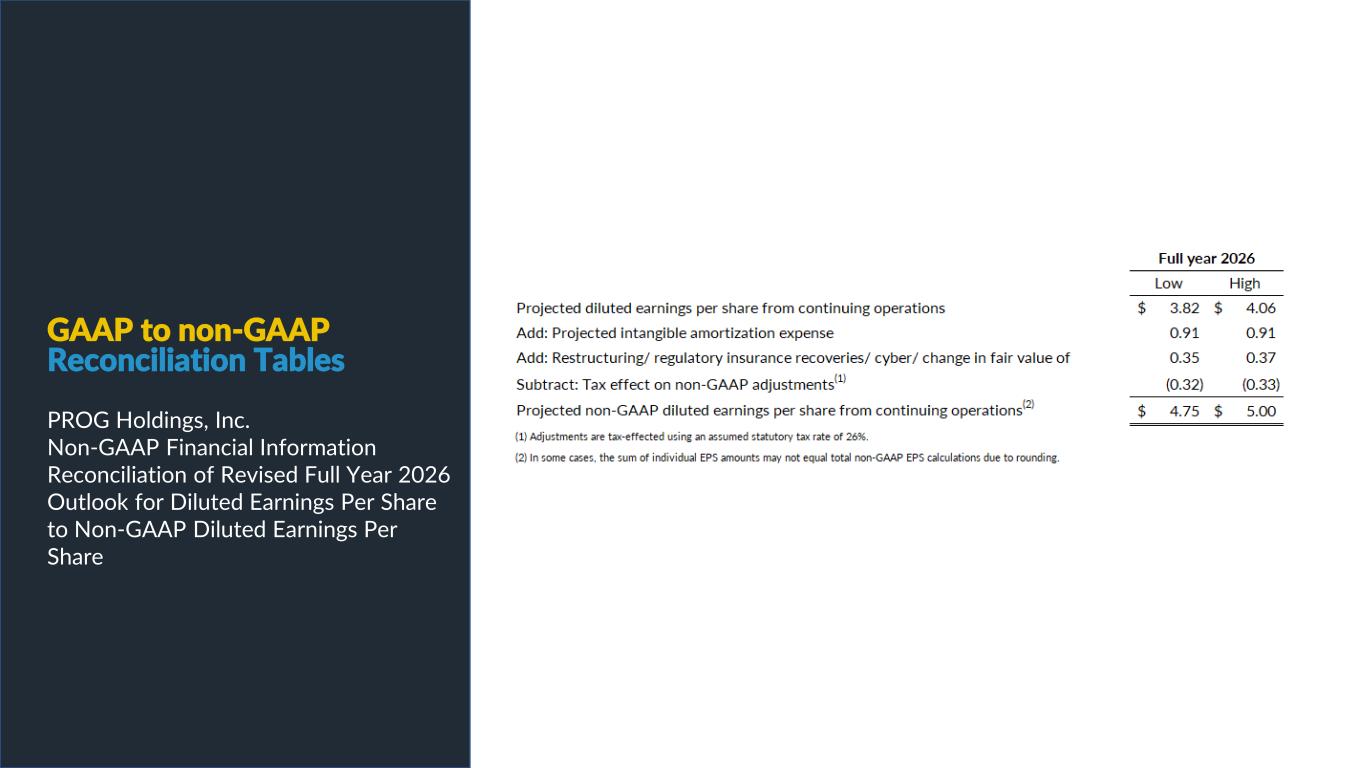
PROG Internal GAAP to non-GAAP Reconciliation Tables PROG Holdings, Inc. Non-GAAP Financial Information Reconciliation of Revised Full Year 2026 Outlook for Diluted Earnings Per Share to Non-GAAP Diluted Earnings Per Share
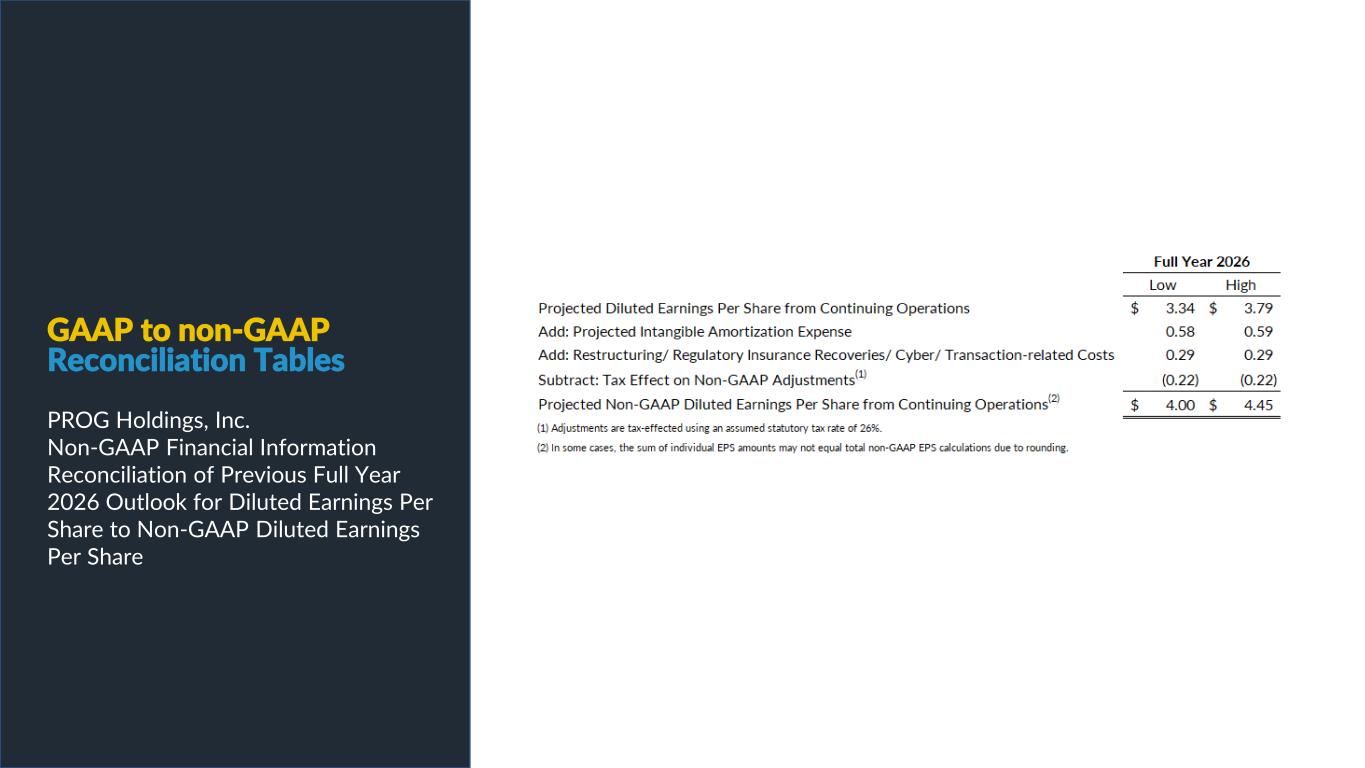
PROG Internal GAAP to non-GAAP Reconciliation Tables PROG Holdings, Inc. Non-GAAP Financial Information Reconciliation of Previous Full Year 2026 Outlook for Diluted Earnings Per Share to Non-GAAP Diluted Earnings Per Share
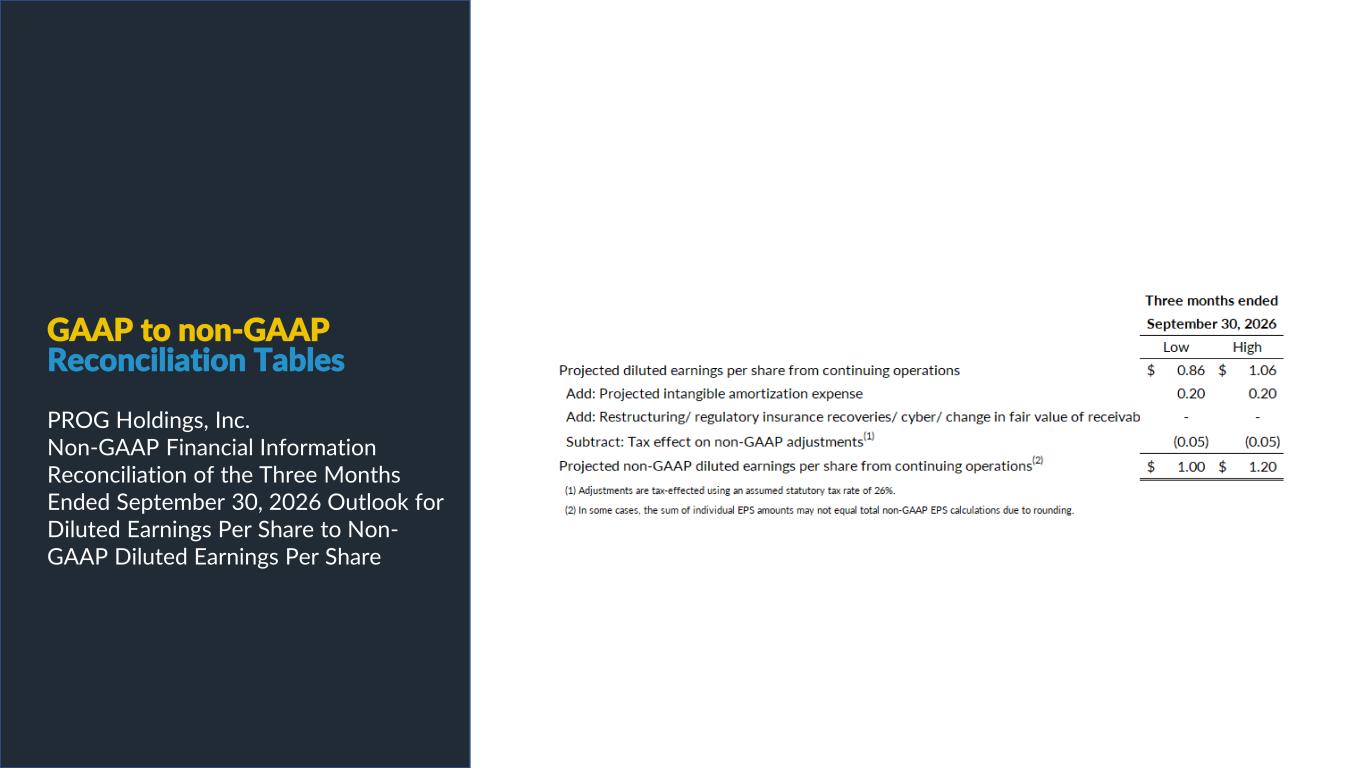
GAAP to non-GAAP Reconciliation Tables PROG Holdings, Inc. Non-GAAP Financial Information Reconciliation of the Three Months Ended September 30, 2026 Outlook for Diluted Earnings Per Share to Non- GAAP Diluted Earnings Per Share

PROG Internal