The following bar chart and table illustrate how the returns of the Fund vary over time and how they compare to relevant market benchmarks. This information may help illustrate the risks of investing in the Fund. The Fund has changed its comparative broad-based securities market index from MSCI EAFE Index (Hedged to U.S.$) to the MSCI EAFE Index (in U.S.$) in order to comply with new regulatory requirements regarding the presentation of comparative index performance. Updated performance information for the Fund is available at www.tweedyfunds.com or by calling 800-432-4789 (press 0). As with all mutual funds, past performance (before and after taxes) is not necessarily an indication of how the Fund will perform in the future.
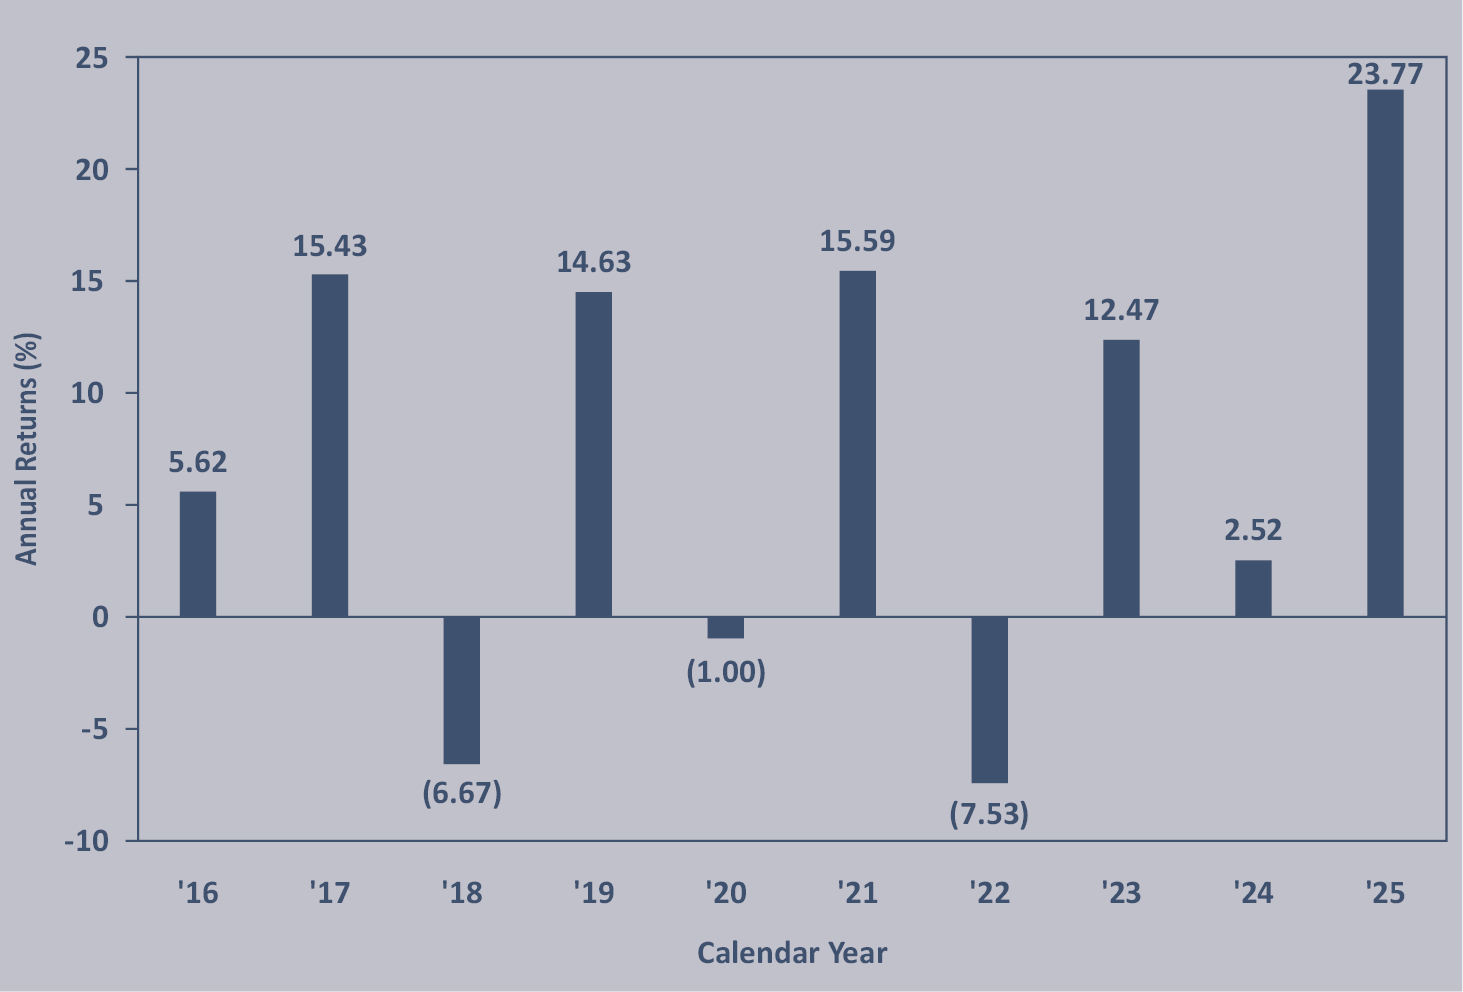
(1) The 2026 year-to-date return for the International Value Fund through June 30, 2026 was 10.65%.
| As of December 31, 2025 | ||
| Best Quarterly Return | 14.46% (4th Quarter, 2020) | |
| Worst Quarterly Return | (21.37)% (1st Quarter, 2020) |
| One Year | Five Years | Ten Years | |
| International Value Fund | |||
| Return before Taxes | 23.77% | 8.81% | 7.01% |
| Return after Taxes on Distributions | 20.84% | 7.04% | 5.85% |
| Return after Taxes on Distributions and Sale of Fund Shares | 16.61% | 6.89% | 5.59% |
| MSCI EAFE Index (in U.S.$) (reflects no deduction for fees, expenses or taxes) | 31.22% | 8.92% | 8.18% |
| MSCI EAFE Index (Hedged to U.S.$) (reflects no deduction for fees, expenses or taxes) | 23.10% | 13.94% | 10.72% |
After-tax returns are calculated using the historical highest individual federal marginal income tax rates and do not reflect the impact of state and local taxes. In some instances, the “Return after Taxes on Distributions and Sale of Fund Shares” may be greater than “Return before Taxes” because the investor is assumed to have a capital loss upon the sale of Fund shares to offset other taxable gains. Actual after-tax returns depend on the investor’s tax situation and may differ from those shown. After-tax returns shown are not relevant to investors who hold their Fund shares through tax-deferred arrangements, such as 401(k) plans or individual retirement accounts. The performance data shown above would have been lower had fees not been waived during certain periods.
The following bar chart and table illustrate how the returns of the Fund vary over time and how they compare to a relevant market benchmark. This information may help illustrate the risks of investing in the Fund. Absent any applicable agreements to waive and/or reimburse certain of the Fund’s operational expenses, the returns of the Fund would have been lower. Updated performance information for the Fund is available at www.tweedyfunds.com or by calling 800-432-4789 (press 0). As with all mutual funds, past performance (before and after taxes) is not necessarily an indication of how the Fund will perform in the future.
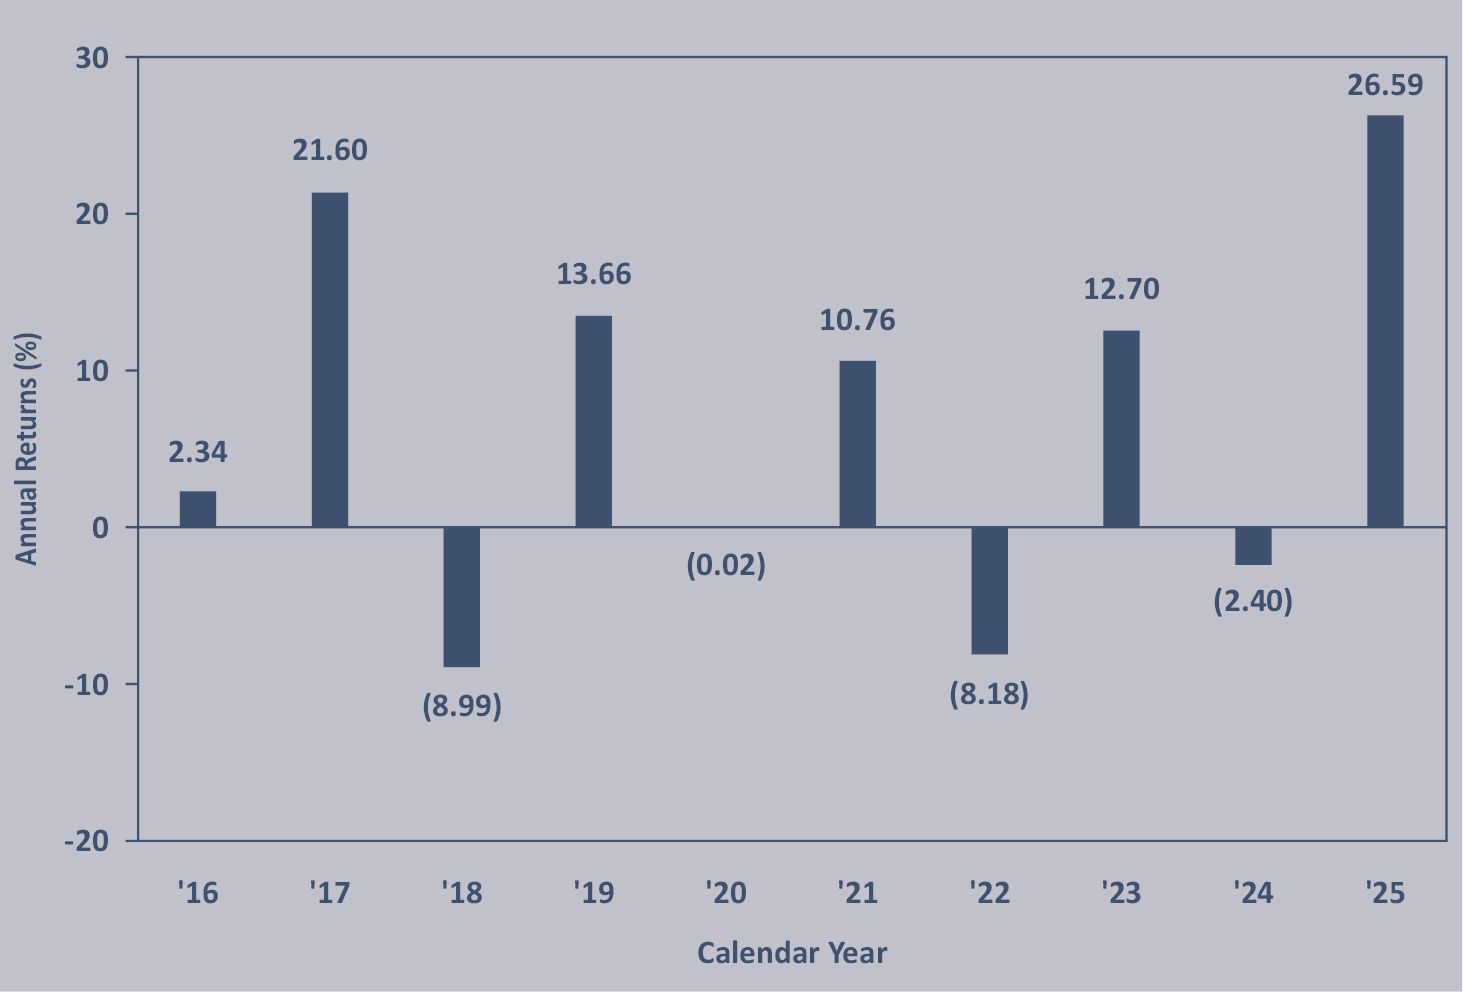
(1) The 2026 year-to-date return for the International Value Fund II – Currency Unhedged through June 30, 2026 was 8.84%.
| As of December 31, 2025 | ||
| Best Quarterly Return | 17.87% (4th Quarter, 2020) | |
| Worst Quarterly Return | (25.51)% (1st Quarter, 2020) |
| One Year | Five Years | Ten Years | |
| International Value Fund II – Currency Unhedged | |||
| Return before Taxes | 26.59% | 7.21% | 6.19% |
| Return after Taxes on Distributions | 24.75% | 6.03% | 5.48% |
| Return after Taxes on Distributions and Sale of Fund Shares | 17.80% | 5.74% | 5.03% |
| MSCI EAFE Index (in U.S.$) (reflects no deduction for fees, expenses or taxes) | 31.22% | 8.92% | 8.18% |
After-tax returns are calculated using the historical highest individual federal marginal income tax rates and do not reflect the impact of state and local taxes. In some instances, the “Return after Taxes on Distributions and Sale of Fund Shares” may be greater than “Return before Taxes” because the investor is assumed to have a capital loss upon the sale of Fund shares to offset other taxable gains. Actual after-tax returns depend on the investor’s tax situation and may differ from those shown. After-tax returns shown are not relevant to investors who hold their Fund shares through tax-deferred arrangements, such as 401(k) plans or individual retirement accounts. The performance data shown above would be lower had certain fees and expenses not been waived and/or reimbursed during certain periods.
The following bar chart and table illustrate how the returns of the Fund vary over time and how they compare to relevant market benchmarks. This information may help illustrate the risks of investing in the Fund. Effective July 2024, the Fund has changed its comparative broad-based securities market index from MSCI World Index (Hedged to U.S.$) to the MSCI World Index (in U.S.$) in order to comply with new regulatory requirements regarding the presentation of comparative index performance. The S&P 500/MSCI World Index (Hedged to U.S.$) is a combination of the S&P 500 Index and the MSCI World Index (Hedged to U.S.$), linked together by Tweedy, Browne, and represents the performance of the S&P 500 Index for periods from December 8, 1993 through December 31, 2006, and the performance of the MSCI World Index (Hedged to U.S.$) beginning January 1, 2007 and thereafter (beginning December 2006, the Fund was permitted to invest more significantly in non-US securities). Updated performance information for the Fund is available at www.tweedyfunds.com or by calling 800-432-4789 (press 0). As with all mutual funds, past performance (before and after taxes) is not necessarily an indication of how the Fund will perform in the future.
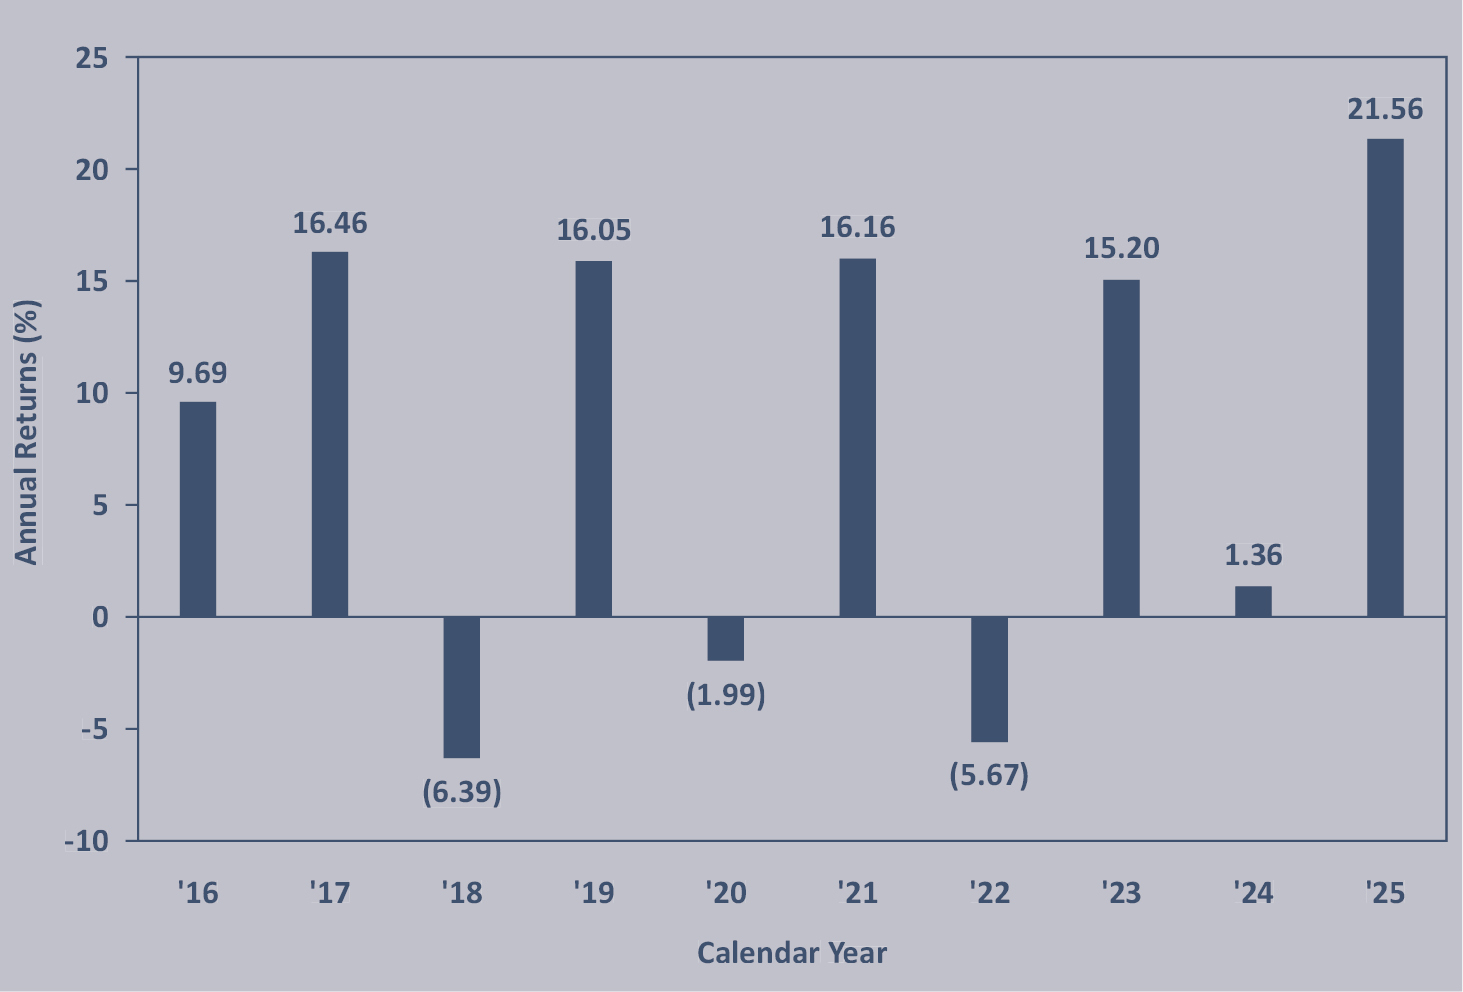
(1) The 2026 year-to-date return for the Value Fund through June 30, 2026 was 11.07%.
| As of December 31, 2025 | ||
| Best Quarterly Return | 13.38% (4th Quarter, 2020) | |
| Worst Quarterly Return | (22.13)% (1st Quarter, 2020) |
| One Year | Five Years | Ten Years | |
| Value Fund | |||
| Return before Taxes | 21.56% | 9.23% | 7.78% |
| Return after Taxes on Distributions | 20.64% | 7.35% | 6.01% |
| Return after Taxes on Distributions and Sale of Fund Shares | 13.67% | 7.09% | 5.94% |
| MSCI World Index (in U.S.$) (reflects no deduction for fees, expenses or taxes) | 21.09% | 12.15% | 12.17% |
| MSCI World Index (Hedged to U.S.$) (reflects no deduction for fees, expenses or taxes) | 19.03% | 13.67% | 12.99% |
| S&P 500/MSCI World Index (Hedged to U.S.$) (reflects no deduction for fees, expenses or taxes) | 19.03% | 13.67% | 12.99% |
After-tax returns are calculated using the historical highest individual federal marginal income tax rates and do not reflect the impact of state and local taxes. In some instances, the “Return after Taxes on Distributions and Sale of Fund Shares” may be greater than “Return before Taxes” because the investor is assumed to have a capital loss upon the sale of Fund shares to offset other taxable gains. Actual after-tax returns depend on the investor’s tax situation and may differ from those shown. After-tax returns shown are not relevant to investors who hold their Fund shares through tax-deferred arrangements, such as 401(k) plans or individual retirement accounts. The performance data shown above would be lower had certain fees and expenses not been waived and/or reimbursed during certain periods.
The following bar chart and table illustrate how the returns of the Fund vary over time and how they compare to relevant market benchmarks. This information may help illustrate the risks of investing in the Fund. Absent any applicable agreements to waive and/or reimburse certain of the Fund’s operational expenses, the returns of the Fund would have been lower. Updated performance information for the Fund is available at www.tweedyfunds.com or by calling 800-432-4789 (press 0). As with all mutual funds, past performance (before and after taxes) is not necessarily an indication of how the Fund will perform in the future. On May 27, 2026, the name of the Fund changed from the Tweedy, Browne Worldwide High Dividend Yield Value Fund to the Tweedy, Browne . Buybacks . Dividends + Value Fund to reflect a change to the Fund’s investment strategy. The performance reflected below illustrates the performance of the Fund pursuant to its principal investment strategy prior to May 27, 2026.
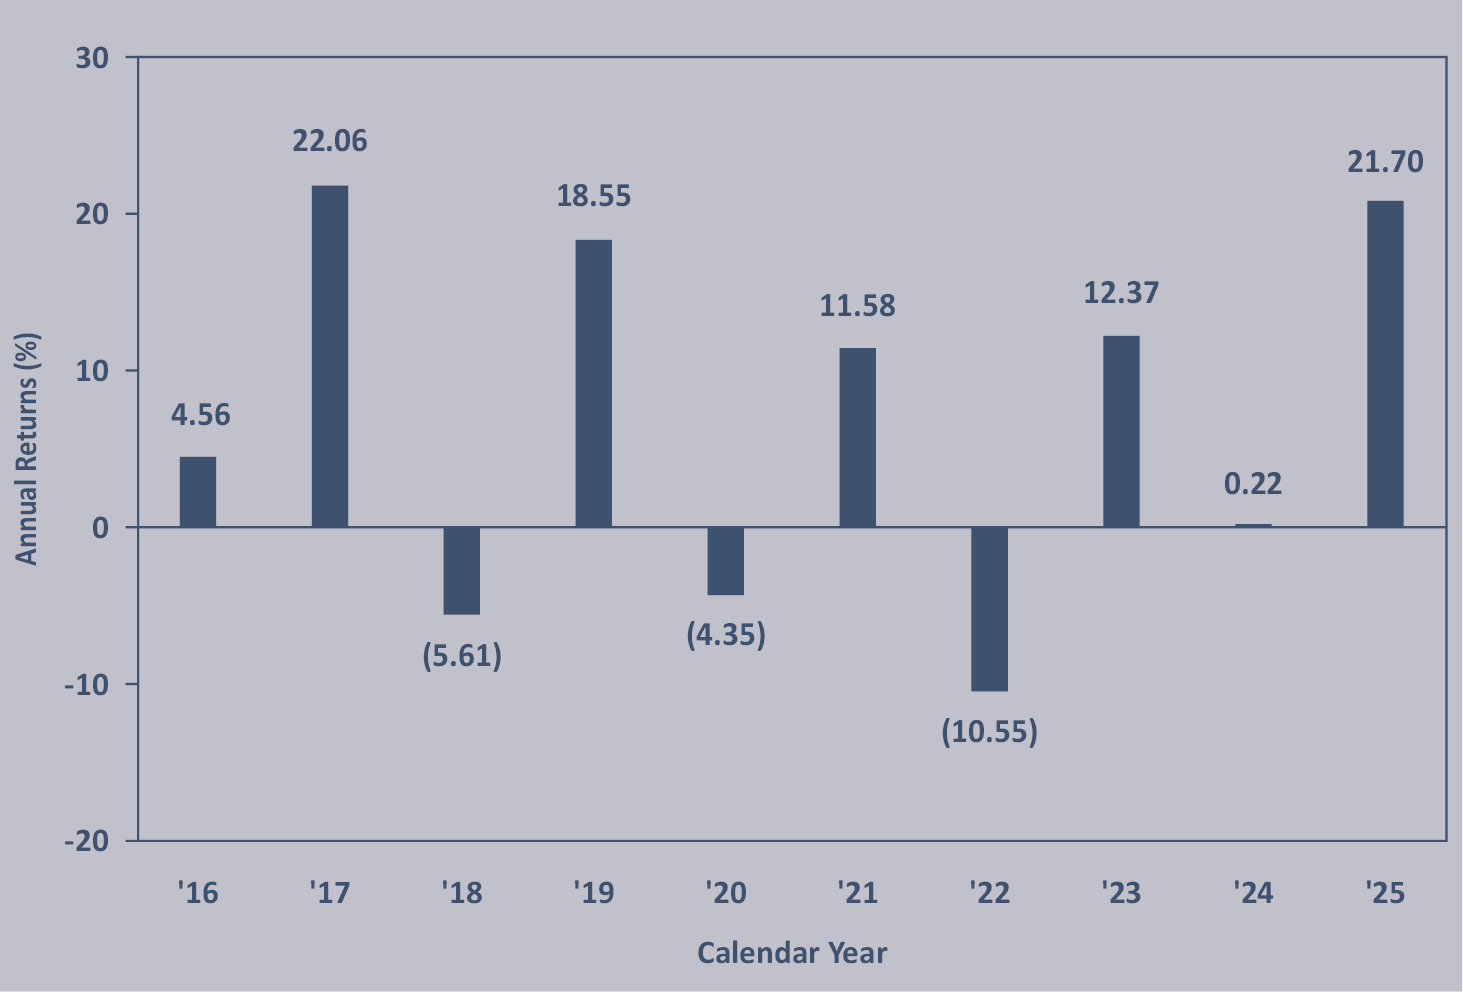
(1) The 2026 year-to-date return for the Buybacks . Dividends + Value Fund through June 30, 2026 was 4.51%.
| As of December 31, 2025 | ||
| Best Quarterly Return | 15.88% (4th Quarter, 2022) | |
| Worst Quarterly Return | (24.73)% (1st Quarter, 2020) |
| One Year | Five Years | Ten Years | |
| Buybacks . Dividends + Value Fund | |||
| Return before Taxes | 21.70% | 6.47% | 6.45% |
| Return after Taxes on Distributions | 19.63% | 4.21% | 4.19% |
| Return after Taxes on Distributions and Sale of Fund Shares | 14.65% | 4.90% | 4.86% |
| MSCI World Index (in U.S.$) (reflects no deduction for fees, expenses or taxes) | 21.09% | 12.15% | 12.17% |
| MSCI World High Dividend Yield Index (in U.S.$) (reflects no deduction for fees, expenses or taxes) | 18.64% | 9.05% | 8.52% |
After-tax returns are calculated using the historical highest individual federal marginal income tax rates and do not reflect the impact of state and local taxes. In some instances, the “Return after Taxes on Distributions and Sale of Fund Shares” may be greater than “Return before Taxes” because the investor is assumed to have a capital loss upon the sale of Fund shares to offset other taxable gains. Actual after-tax returns depend on the investor’s tax situation and may differ from those shown. After-tax returns shown are not relevant to investors who hold their Fund shares through tax-deferred arrangements, such as 401(k) plans or individual retirement accounts. The performance data shown above would be lower had certain fees and expenses not been waived and/or reimbursed during certain periods.