The investment objective of the Fund is to provide long-term total return, which includes capital appreciation and income.
These tables summarize the fees and expenses that you may pay if you buy, hold and sell shares of the Fund. You may pay other fees, such as brokerage commissions and other fees to financial intermediaries, which are not reflected in the tables and examples below.
| Adviser Class | Class I | Class Y-2 | Class Y-3 | |||||||||||||
| Redemption Fee on shares owned less than 30 days (as a % of total redemption proceeds) | 2.00 | % | 2.00 | % | 2.00 | % | 2.00 | % | ||||||||
| Adviser Class | Class I | Class Y-2 | Class Y-3 | |||||||||||||
| Management Fees(1),(2) | 0.53 | % | 0.53 | % | 0.53 | % | 0.53 | % | ||||||||
| Distribution (12b-1) Fees | 0.25 | % | None | None | None | |||||||||||
| Non-Distribution Shareholder Administrative Services Fees | 0.25 | % | 0.25 | % | 0.15 | % | None | |||||||||
| Other Expenses(3) | 0.08 | % | 0.08 | % | 0.08 | % | 0.08 | % | ||||||||
| Acquired Fund Fees and Expenses(4) | 0.07 | % | 0.07 | % | 0.07 | % | 0.07 | % | ||||||||
| Total Annual Fund Operating Expenses(2),(5) | 1.18 | % | 0.93 | % | 0.83 | % | 0.68 | % | ||||||||
| Less Fee Waivers(1) | -0.18 | % | -0.18 | % | -0.18 | % | -0.18 | % | ||||||||
| Net Annual Fund Operating Expenses(5) | 1.00 | % | 0.75 | % | 0.65 | % | 0.50 | % | ||||||||
| (1) | Mercer Investments LLC (the “Adviser”) has contractually agreed, until at least July 31, 2027, to waive any portion of its management fee that exceeds the aggregate amount of the subadvisory fees that the Adviser is required to pay to the Fund’s subadvisers. This contractual fee waiver agreement may only be changed or eliminated with the approval of the Fund’s Board of Trustees. The fees waived by the Adviser pursuant to this agreement are not subject to reimbursement by the Fund to the Adviser. The amount of the fee waiver has been estimated to reflect the subadvisory fees in effect as of the date of this prospectus. |
| (2) | The “Management Fees” and “Total Annual Fund Operating Expenses” have been adjusted to reflect the decrease in the management fee payable by the Portfolio from 0.76% to 0.53% effective as of July 1, 2026. |
| (3) | “Other Expenses” include administrative, custodial, legal, audit, transfer agent and Trustees’ fees and expenses. The “Other Expenses” shown for Adviser Class and Class Y-2 are based on estimated amounts for the Fund’s current fiscal year, as the Adviser Class and Class Y-2 shares of the Fund had not commenced operations prior to the most recent fiscal year end. |
| (4) | Acquired Fund Fees and Expenses (“AFFE”) are indirect fees and expenses that the Fund incurs from investing in the shares of other funds, including business development companies. AFFE are based on estimated amounts for the current fiscal year. |
| (5) | Total Annual Fund Operating Expenses and Net Annual Fund Operating Expenses do not correlate to the “total expenses (before reductions and reimbursements/waivers) to average daily net assets” and “net expenses to average daily net assets”, respectively, provided in the Financial Highlights. The information in the Financial Highlights does not include AFFE, which are included above. |
The example below is intended to help you compare the costs of investing in the Fund with the cost of investing in other mutual funds. The example assumes that you invest $10,000 in the Fund for the time periods shown, that your investment has a 5% return each year,
and that the Fund’s operating expenses remain the same as shown above (taking into account the contractual expense limitation being in effect for the one-year period ending July 31, 2027).
Although your actual costs may be higher or lower, based on these assumptions, your costs would be:
| 1 Year | 3 Years | 5 Years | 10 Years | |||||||||||||
| Adviser Class | $ | 102 | $ | 357 | $ | 632 | $ | 1,416 | ||||||||
| Class I | $ | 77 | $ | 278 | $ | 497 | $ | 1,127 | ||||||||
| Class Y-2 | $ | 66 | $ | 247 | $ | 443 | $ | 1,009 | ||||||||
| Class Y-3 | $ | 51 | $ | 199 | $ | 361 | $ | 830 | ||||||||
The Fund pays transaction costs, such as commissions, when it buys and sells securities (or “turns over” its portfolio). A higher portfolio turnover rate may increase transaction costs and may result in higher taxes when Fund shares are held in a taxable account. These costs, which are not reflected in Annual Fund Operating Expenses or in the example, affect the Fund’s performance. During the most recent fiscal year, the Fund’s portfolio turnover rate was 246% of the average value of its portfolio.
Under normal circumstances, the Fund will invest at least 80% of its net assets (plus borrowings for investment purposes, if any) in fixed income securities. If the Fund changes this investment policy, the Fund will notify shareholders at least 60 days in advance of the change. In seeking to achieve the Fund’s investment objective of total return, the Fund invests primarily in fixed income securities of U.S. and non-U.S. issuers, including those in emerging and frontier markets. The Fund invests in various strategic and tactical global bond market opportunities without limitations in geography (developed and emerging markets), issuer type (government/public sector and corporate/private sector), quality (investment grade, below investment grade or unrated), and currency denomination (U.S. Dollar and foreign currencies). Fixed income securities in which the Fund will invest include all varieties of fixed-rate and floating-rate securities (including but not limited to those issued by central and local governments, government agency and affiliated institutions, corporate bonds, mortgage- and other asset-backed securities, and convertible securities). The Fund may invest in bank loans and loan participations and senior and subordinated debt securities. The Fund may invest a significant portion of its assets in any combination of non-investment grade bonds (sometimes called “high yield” or “junk bonds”), bonds issued by issuers in emerging capital markets. A lesser portion of the Fund’s assets may be invested in securities in default or otherwise illiquid investments. The Fund may also invest in securities that are subject to resale restrictions such as those contained in Rule 144A promulgated under the Securities Act of 1933, as amended. The Fund may invest in derivatives such as futures (including, among others, currency futures and interest rate futures), swaps (currency, interest rate, credit default, and total return), forwards, options (including, among others, exchange-traded and over-the-counter currency options), and credit-linked notes. The Fund may engage in transactions in derivatives for a variety of purposes, including hedging, risk management, efficient portfolio management, enhancing total returns, or as a substitute for taking a position in the underlying asset. Investments in derivatives may be applied toward meeting a requirement to invest in a particular kind of investment if the derivatives have economic characteristics similar to that investment.
The following bar chart and table give some indication of the risks of investing in the Fund by showing changes in the performance of the Fund’s Class Y-3 shares from year to year and comparing the Fund’s average annual returns over time with a broad-based securities market index, Bloomberg U.S. Aggregate Bond Index. The Fund’s average annual returns over time are also compared to an additional blended benchmark consisting of 33.3% Bloomberg US Corporate High Yield Index (USD), 33.3% Morningstar LSTA US Leveraged Loan Index and 33.3% JP Morgan EMBI Global Diversified Index (USD).
The Fund offers four different classes of shares in this prospectus: Adviser Class shares, Class I shares, Class Y-2 shares and Class Y-3 shares. No information is shown for Adviser Class or Class Y-2 shares because there were no shares outstanding for these classes as of the last calendar year end. Performance information for these share classes will appear in a future version of the prospectus once there is a full calendar year of performance information to report. The returns of these share classes would have been substantially similar to the returns of Class Y-3 shares; however, because the Adviser Class, Class I and Class Y-2 shares are subject to a 12b-1 fee and/or a non-distribution shareholder administrative services fee, the returns of these share classes would have been lower than those shown for Class Y-3 shares.
The Fund’s past performance, before and after taxes, is not necessarily an indication of how the Fund will perform in the future. This may be particularly true given that other subadvisers were responsible for managing portions of the Fund’s portfolio during previous periods. Ninety One North America, Inc. assumed responsibility for managing a portion of the Fund’s portfolio on June 15, 2023. Ares Capital Management II LLC, Crescent Capital Group LP and Polen Capital Credit, LLC assumed responsibility for managing portions of the Fund’s portfolio on April 15, 2025. Pacific Investment Management Company LLC and Wellington Management Company LLP assumed responsibility for managing portions of the Fund’s portfolio on April 29, 2025.
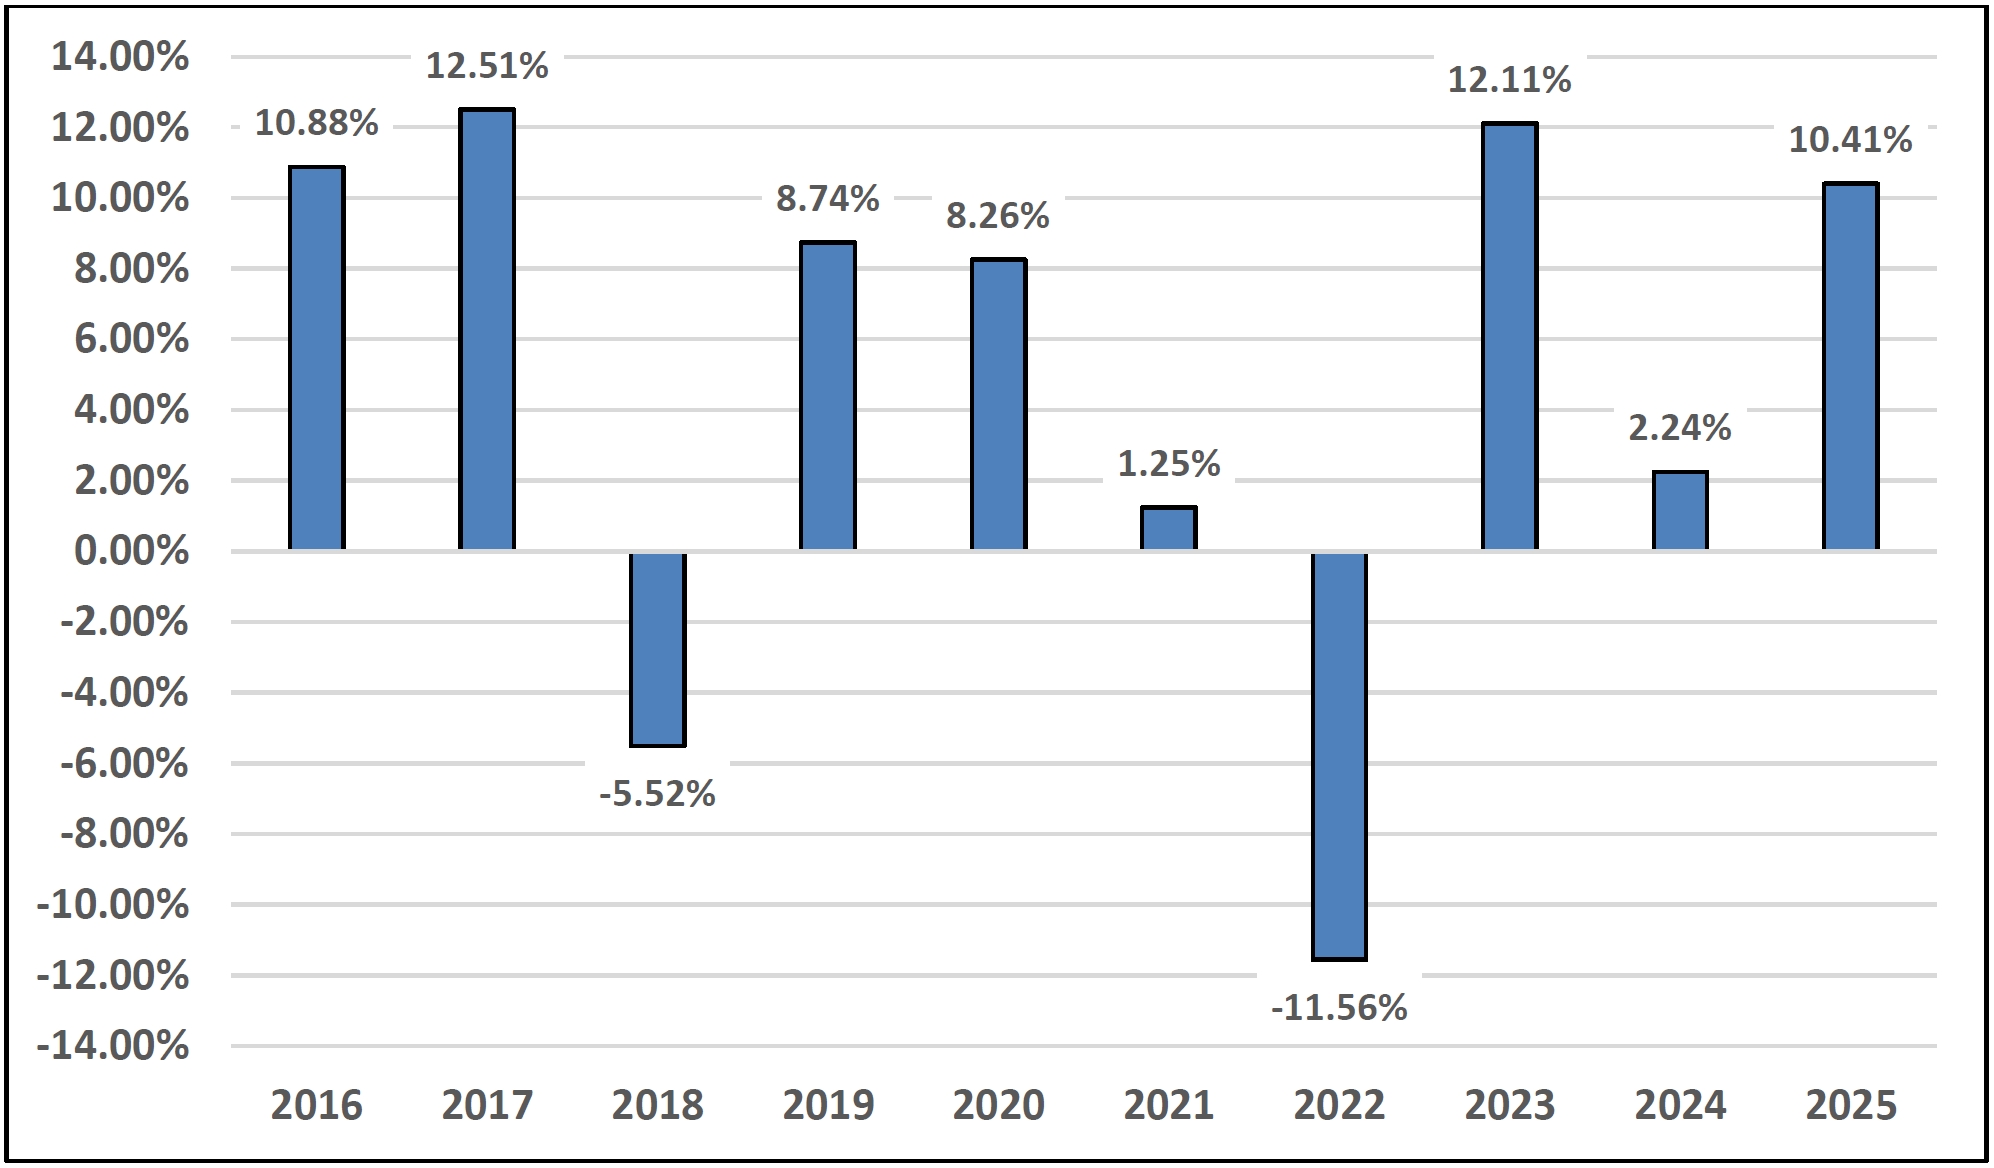
The Fund’s calendar year-to-date return as of June 30, 2026 was 2.27%.
The Fund’s highest return for a quarter during the period shown above was 9.57%, for the quarter ended June 30, 2020.
The Fund’s lowest return for a quarter during the period shown above was -10.10%, for the quarter ended March 31, 2020.
| 1 Year | 5 Years | 10 Years | ||||||||||
| Mercer Opportunistic Fixed Income Fund – Class Y-3 Shares | ||||||||||||
| Return Before Taxes | 10.41 | % | 2.02 | % | 4.37 | % | ||||||
| Return After Taxes on Distributions | 8.23 | % | -0.05 | % | 2.82 | % | ||||||
| Return After Taxes on Distributions and Sale of Fund Shares | 6.17 | % | 0.63 | % | 2.73 | % | ||||||
Mercer Opportunistic Fixed Income Fund – Class I Shares
| 1 Year | Life of Class (Inception June 1, 2023) | |||||||||||
| Return Before Taxes | 10.14 | % | 7.05 | % | ||||||||
| 1 Year | 5 Years | 10 Years | ||||||||||
| Bloomberg U.S. Aggregate Index(1) (reflects no deduction for fees, expenses, or taxes) | 7.30 | % | -0.36 | % | 2.01 | % | ||||||
| Secondary Index(2) (reflects no deduction for fees, expenses, or taxes) | 9.57 | % | 4.26 | % | 5.62 | % | ||||||
| (1) | The Bloomberg U.S. Aggregate Bond Index measures the performance of securities from the Bloomberg U.S. Government/Corporate Bond Index, Mortgage-Backed Securities Index, Asset-Backed Securities Index, and Commercial Mortgage-Backed Securities Index. The Bloomberg U.S. Aggregate Bond Index is a broad representation of the investment-grade fixed-income market in the United States and includes U.S. government and corporate debt securities, mortgage- and asset-backed securities, and international U.S. dollar-denominated bonds. All securities contained in the Bloomberg U.S. Aggregate Bond Index have a minimum term to maturity of one year. The index is unmanaged and cannot be invested in directly. |
| (2) | The Fund has selected a secondary index that is a blended benchmark consisting of 33.3% Bloomberg US Corporate High Yield Index (USD), 33.3% Morningstar LSTA US Leveraged Loan Index and 33.3% JP Morgan EMBI Global Diversified Index (USD). The index is unmanaged and cannot be invested in directly. |
After-tax returns are calculated using the historical highest individual federal marginal income tax rates in effect and do not reflect the impact of state and local taxes. Actual after-tax returns depend on an investor’s situation and may differ from those shown. In addition, the after-tax returns shown are not relevant to investors who hold Fund shares through tax-deferred arrangements, such as 401(k) plans or individual retirement accounts. In some cases, the after-tax returns may exceed the return before taxes due to an assumed benefit from any losses on a sale of shares at the end of the measurement period. After-tax returns are shown for Class Y-3 shares. After-tax returns for Class I shares may vary.