The investment objective of the Fund is to provide long-term total return, which includes capital appreciation and income.
These tables summarize the fees and expenses that you may pay if you buy, hold and sell shares of the Fund. You may pay other fees, such as brokerage commissions and other fees to financial intermediaries, which are not reflected in the tables and examples below.
| Adviser Class | Class I | Class Y-2 | Class Y-3 | |||||||||||||
| Redemption Fee on shares owned less than 30 days (as a % of total redemption proceeds) | 2.00 | % | 2.00 | % | 2.00 | % | 2.00 | % | ||||||||
| Adviser Class | Class I | Class Y-2 | Class Y-3 | |||||||||||||
| Management Fees(1),(2) | 0.56 | % | 0.56 | % | 0.56 | % | 0.56 | % | ||||||||
| Distribution (12b-1) Fees | 0.25 | % | None | None | None | |||||||||||
| Non-Distribution Shareholder Administrative Services Fees | 0.25 | % | 0.25 | % | 0.15 | % | None | |||||||||
| Other Expenses(3) | 0.09 | % | 0.09 | % | 0.09 | % | 0.09 | % | ||||||||
| Total Annual Fund Operating Expenses(2) | 1.15 | % | 0.90 | % | 0.80 | % | 0.65 | % | ||||||||
| Less Fee Waivers(1) | -0.30 | % | -0.30 | % | -0.30 | % | -0.30 | % | ||||||||
| Net Annual Fund Operating Expenses | 0.85 | % | 0.60 | % | 0.50 | % | 0.35 | % | ||||||||
| (1) | Mercer Investments LLC (the “Adviser”) has contractually agreed, until at least July 31, 2027, to waive any portion of its management fee that exceeds the aggregate amount of the subadvisory fees that the Adviser is required to pay to the Fund’s subadvisers. This contractual fee waiver agreement may only be changed or eliminated with the approval of the Fund’s Board of Trustees. The fees waived by the Adviser pursuant to this agreement are not subject to reimbursement by the Fund to the Adviser. The amount of the fee waiver has been estimated to reflect the subadvisory fees in effect as of the date of this prospectus. |
| (2) | The “Management Fees” and “Total Annual Fund Operating Expenses” have been adjusted to reflect the decrease in the management fee payable by the Portfolio from 0.79% to 0.56% effective as of July 1, 2026. |
| (3) | “Other Expenses” include administrative, custodial, legal, audit, transfer agent and Trustees’ fees and expenses. The “Other Expenses” shown for Adviser Class and Class Y-2 are based on estimated amounts for the Fund’s current fiscal year, as the Adviser Class and Class Y-2 shares of the Fund had not commenced operations prior to the most recent fiscal year end. |
The example below is intended to help you compare the costs of investing in the Fund with the cost of investing in other mutual funds. The example assumes that you invest $10,000 in the Fund for the time periods shown, that your investment has a 5% return each year, and that the Fund’s operating expenses remain the same as shown above (taking into account the contractual expense limitation being in effect for the one-year period ending July 31, 2027).
Although your actual costs may be higher or lower, based on these assumptions, your costs would be:
| 1 Year | 3 Years | 5 Years | 10 Years | |||||||||||||
| Adviser Class | $ | 87 | $ | 336 | $ | 604 | $ | 1,371 | ||||||||
| Class I | $ | 61 | $ | 257 | $ | 469 | $ | 1,080 | ||||||||
| Class Y-2 | $ | 51 | $ | 225 | $ | 415 | $ | 962 | ||||||||
| Class Y-3 | $ | 36 | $ | 178 | $ | 332 | $ | 782 | ||||||||
The Fund pays transaction costs, such as commissions, when it buys and sells securities (or “turns over” its portfolio). A higher portfolio turnover rate may increase transaction costs and may result in higher taxes when Fund shares are held in a taxable account. These costs, which are not reflected in Annual Fund Operating Expenses or in the example, affect the Fund’s performance. During the most recent fiscal year, the Fund’s portfolio turnover rate was 49% of the average value of its portfolio.
Under normal circumstances, the Fund invests at least 80% of its net assets, plus the amount of any borrowings, in equity securities (such as dividend-paying securities, common stock and preferred stock) of companies that are located in emerging markets, and other investments that are tied economically to emerging markets but that may be listed or traded outside the issuer’s domicile country, which may include American, European and Global Depositary Receipts and other depositary receipts (“Depositary Receipts”). (If the Fund changes this investment policy, the Fund will notify shareholders at least 60 days in advance of the change.) The Fund invests in large, medium and small capitalization companies. For purposes of the 80% test, equity securities include securities such as common stock, preferred stock, and other securities that are not debt securities, cash or cash equivalents. The Fund’s portfolio securities are denominated primarily in foreign currencies and are typically held outside the U.S.
Stock index futures and various types of swaps may be used to implement the country selection component of the Fund’s investment strategy. Currency forwards may be used to make stock-selection and country allocation decisions independently of the underlying currency. The Fund may invest in derivative instruments, such as exchange-listed equity futures contracts, swaps and currency forwards to gain market exposure on cash balances or to reduce market exposure in anticipation of liquidity needs. Investments in derivatives may be applied toward meeting a requirement to invest in a particular kind of investment if the derivatives have economic characteristics similar to that investment.
Certain subadvisers may employ a systematic and quantitative investment process in seeking to achieve the Fund’s investment objective, which may lead to higher than expected portfolio turnover for the Fund.
Emerging market countries include all countries represented by the MSCI Emerging Markets Index. In determining if a security is economically tied to an emerging market country the Fund generally looks to the country of incorporation of the issuer as listed on Bloomberg, a widely recognized provider of market information. The Fund’s subadvisers may determine a security is economically tied to an emerging market country based on other factors, such as an issuer’s country of domicile, where the majority of an issuer’s revenues are generated or where an issuer’s primary exchange is located. As a result, a security may be economically tied to more than one country. With respect to derivative instruments, the Fund generally considers such instruments to be economically tied to emerging market countries if the underlying assets of the derivatives are (i) foreign currencies (or baskets or indices of such currencies); (ii) instruments or securities that are issued by foreign governments or by an issuer economically tied to an emerging market country as described above; or (iii) for certain money market instruments, if either the issuer or the guarantor of such money market instrument is economically tied to an emerging market country as described above.
In addition, the Fund may invest its assets in equity securities of companies that are located in “frontier markets” countries and other investments that are tied economically to “frontier markets” countries. “Frontier markets” is often used to describe the markets of smaller, less accessible, but still investable, countries of the developing world. “Frontier market” countries include all countries represented by the MSCI Frontier Markets Index. The securities of frontier market companies tend to be smaller in total market capitalization.
The following bar chart and table give some indication of the risks of investing in the Fund by showing changes in the performance of the Fund’s Class Y-3 shares from year to year and comparing the Fund’s average annual returns over time with a broad-based securities market index, the MSCI Emerging Markets Index.
The Fund offers four different classes of shares in this prospectus: Adviser Class shares, Class I shares, Class Y-2 shares and Class Y-3 shares. No information is shown for Adviser Class or Class Y-2 shares because there were no shares outstanding for these classes as of the last calendar year end. Performance information for these share classes will appear in a future version of the prospectus once there is a full calendar year of performance information to report. The returns of these share classes would have been substantially similar to the returns of Class Y-3 shares; however, because the Adviser Class, Class I and Class Y-2 shares are subject to a 12b-1 fee and/or a non-distribution shareholder administrative services fee, the returns of these share classes would have been lower than those shown for Class Y-3 shares.
The Fund’s past performance, before and after taxes, is not necessarily an indication of how the Fund will perform in the future. This may be particularly true given that other subadvisers were responsible for managing portions of the Fund’s portfolio during previous periods. Parametric Portfolio Associates LLC assumed responsibility for managing a portion of the Fund’s portfolio on February 25, 2015. On July 1, 2024, BennBridge US LLC ceased operations and assigned all existing client agreements to Skerryvore Asset Management Ltd. (f/k/a BennBridge Ltd.). Baillie Gifford Overseas Limited, Pzena Investment Management, LLC and Robeco Institutional Asset Management US Inc. assumed responsibility for managing portions of the Fund’s portfolio on October 25, 2024.
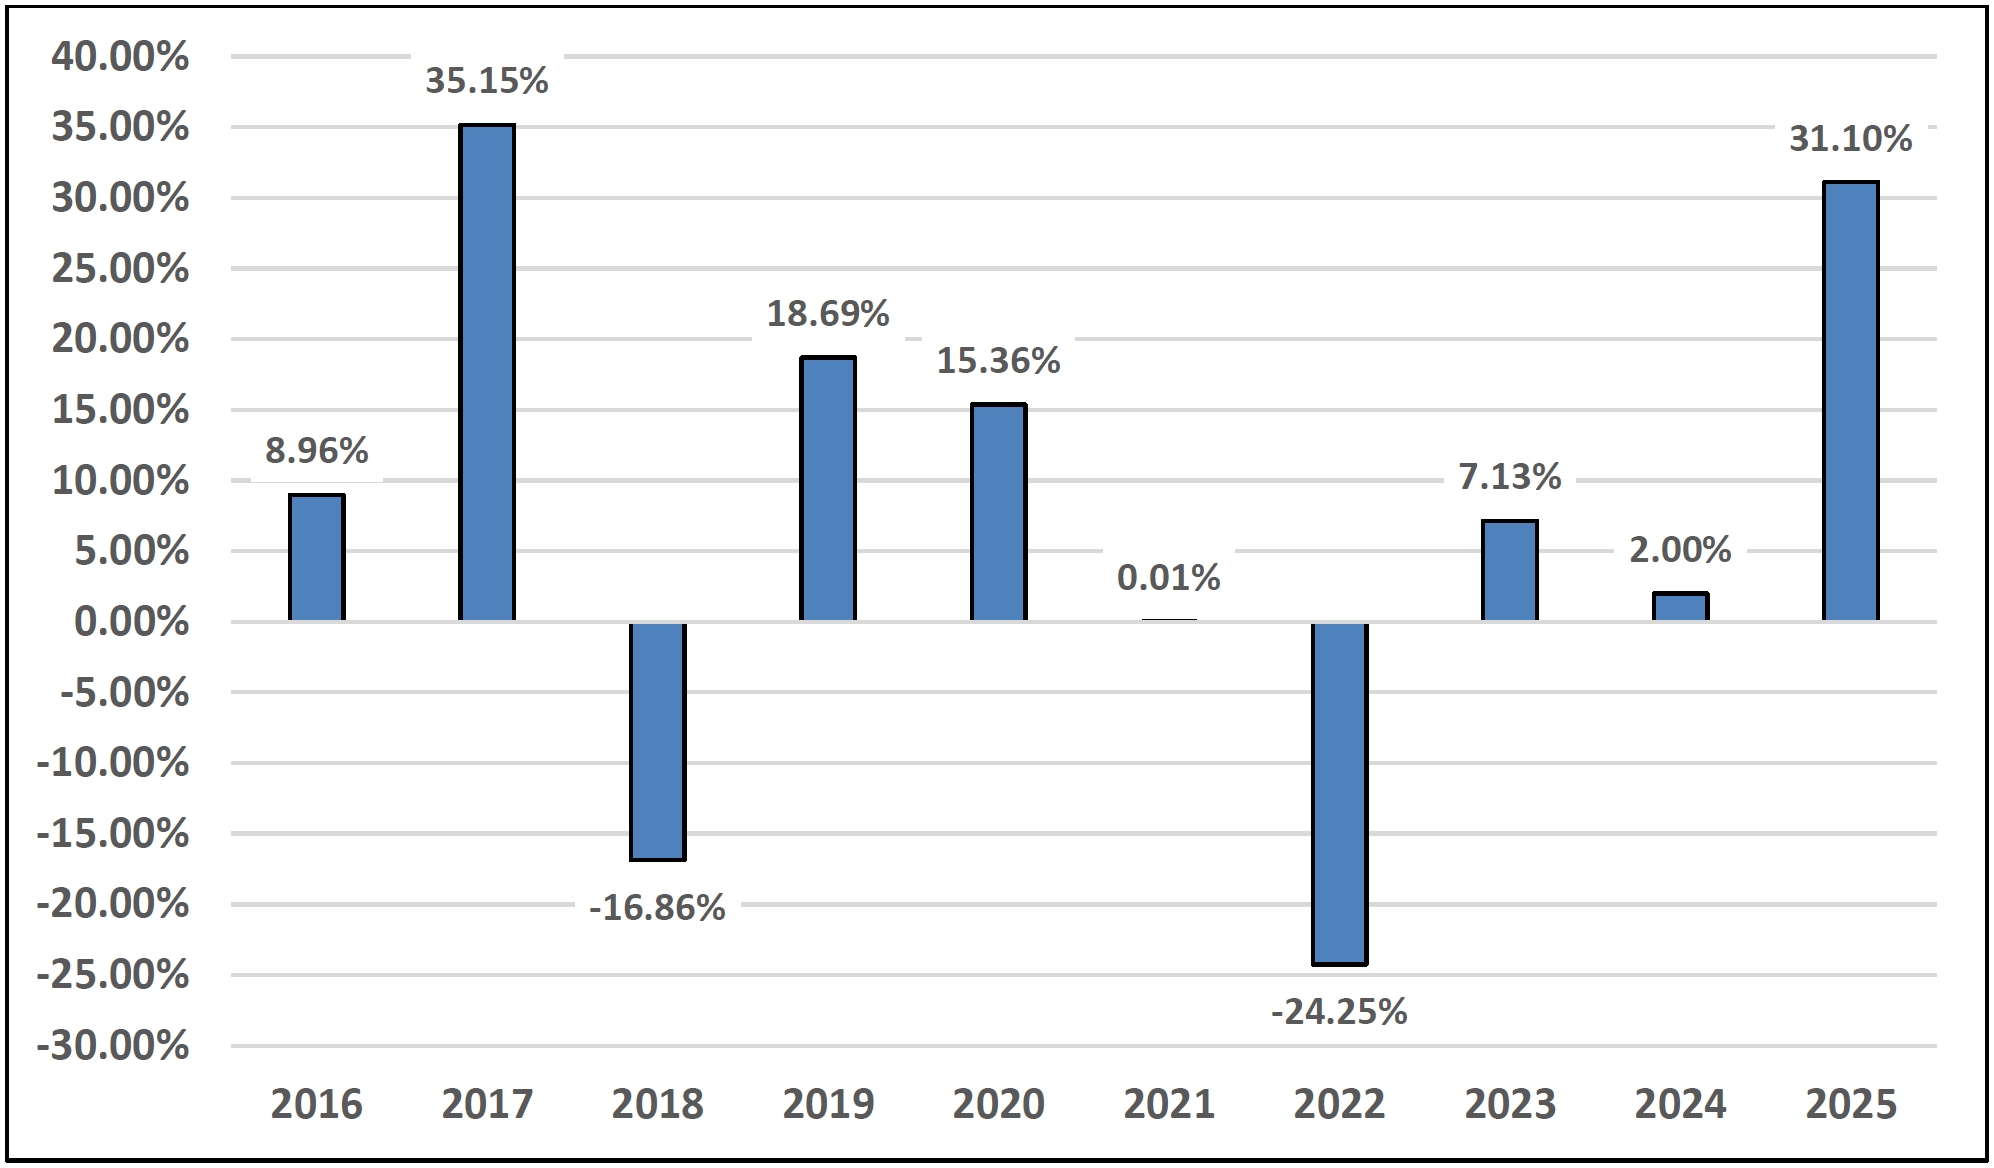
The Fund’s calendar year-to-date return as of June 30, 2026 was 24.30%
The Fund’s highest return for a quarter during the period shown above was 20.03%, for the quarter ended June 30, 2020.
The Fund’s lowest return for a quarter during the period shown above was -25.65%, for the quarter ended March 31, 2020.
| 1 Year | 5 Years | 10 Years | ||||||||||
| Mercer Emerging Markets Equity Fund – Class Y-3 Shares | ||||||||||||
| Return Before Taxes | 31.10 | % | 1.65 | % | 6.17 | % | ||||||
| Return After Taxes on Distributions | 30.38 | % | 0.80 | % | 5.17 | % | ||||||
| Return After Taxes on Distributions and Sale of Fund Shares | 19.19 | % | 1.32 | % | 4.85 | % | ||||||
Mercer Emerging Markets Equity Fund – Class I Shares
| 1 Year | Life of Class (Inception June 27, 2023) | |||||||||||
| Return Before Taxes | 30.76 | % | 12.51 | % | ||||||||
| 1 Year | 5 Years | 10 Years | ||||||||||
| MSCI Emerging Markets Index(1) (net dividends) (reflects no deduction for fees, expenses, or taxes (other than assumed dividend tax)) | 33.57 | % | 4.20 | % | 8.42 | % | ||||||
| (1) | The MSCI Emerging Markets Index measures the performance of equity securities in global emerging markets. The index is unmanaged and cannot be invested in directly. |
After-tax returns are calculated using the historical highest individual federal marginal income tax rates in effect and do not reflect the impact of state and local taxes. Actual after-tax returns depend on an investor’s situation and may differ from those shown. In addition, the after-tax returns shown are not relevant to investors who hold Fund shares through tax-deferred arrangements, such as 401(k) plans or individual retirement accounts. In some cases, the after-tax returns may exceed the return before taxes due to an assumed benefit from any losses on a sale of shares at the end of the measurement period. After-tax returns are shown for Class Y-3 shares. After-tax returns for Class I shares may vary.