The following chart and table provide an indication of the risks of investing in the Fund by showing changes in the Fund’s performance from year to year over the periods indicated and by showing how the Fund’s average annual total returns for the periods indicated, both before and after taxes, compared to those of a relevant securities market index. The Bloomberg US Aggregate Bond Index, the Fund’s primary comparative index, is a broad-based securities market index generally representative of the market for investment grade, U.S. dollar-denominated, fixed-rate taxable bonds. All Fund performance numbers are calculated after deducting fees and expenses, and all numbers assume reinvestment of dividends. Total returns shown include fee waivers and expense reimbursements, if any; total returns would have been lower had there been no waivers and/or reimbursements. The Fund’s past performance is not necessarily an indication of how the Fund will perform in the future both before and after taxes. Updated performance information is available at weitzinvestments.com or by calling us toll-free at 888-859-0698.
| Year | Return |
| 2016 | 4.07% |
| 2017 | 11.15% |
| 2018 | -1.78% |
| 2019 | 17.94% |
| 2020 | 8.14% |
| 2021 | 13.09% |
| 2022 | -9.94% |
| 2023 | 10.27% |
| 2024 | 6.84% |
| 2025 | 3.75% |
Calendar Year Returns
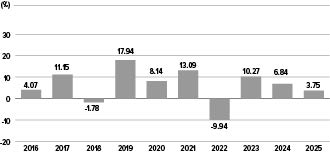
The year-to-date return for the Fund’s Investor Class for the six months ended June 30, 2026 was 0.15%.
After-tax returns are calculated using the highest historical individual federal marginal income tax rates and do not reflect the impact of state and local taxes. Actual after-tax returns depend on an investor’s tax situation and may differ from those shown. In some instances, the return after taxes may be greater than the return before taxes because you are assumed to be able to use the capital loss on the sale of Fund shares to offset other taxable gains. After-tax returns shown are not relevant to investors who hold their Fund shares through tax-deferred arrangements, such as a 401(k) account or individual retirement account (IRA).
The following chart and table provide an indication of the risks of investing in the Fund by showing the Fund’s performance over the periods indicated and by showing how the Fund’s average annual total returns for the periods indicated, both before and after taxes, compared to those of a relevant broad-based securities market index. The Bloomberg U.S. Aggregate Bond Index, the Fund’s primary comparative index, is generally representative of the market for investment grade, U.S. dollar-denominated, fixed-rate taxable bonds. All Fund performance numbers are calculated after deducting fees and expenses, and all numbers assume reinvestment of dividends. Total returns shown include fee waivers and expense reimbursements, if any; total returns would have been lower had there been no waivers and/or reimbursements. The Fund’s past performance is not necessarily an indication of how the Fund will perform in the future both before and after taxes. Updated performance information is available at weitzinvestments.com or by calling us toll-free at 888-859-0698.
Calendar Year Returns
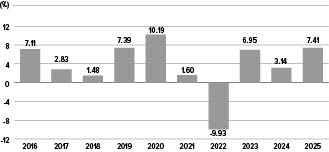
The year-to-date return for the Fund’s Investor Class for the six months ended June 30, 2026 was 1.23%.
The following chart and table provide an indication of the risks of investing in the Fund by showing changes in the Fund’s performance from year to year over the periods indicated and by showing how the Fund’s average annual total returns for the periods indicated, both before and after taxes, compared to those of a relevant broad-based securities market index. The Bloomberg 1000 Index, the Fund’s primary comparative index, reflects the performance of the 1,000 largest publicly traded companies in the U.S. All Fund performance numbers are calculated after deducting fees and expenses, and all numbers assume reinvestment of dividends. Total returns shown include fee waivers and expense reimbursements, if any; total returns would have been lower had there been no waivers and/or reimbursements. The Fund’s past performance is not necessarily an indication of how the Fund will perform in the future both before and after taxes. Updated performance information is available at weitzinvestments.com or by calling us toll-free at 888-859-0698.
Calendar Year Returns
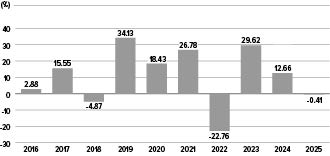
The year-to-date return for the Fund’s Investor Class for the six months ended June 30, 2026 was -5.93%.
The following chart and table provide an indication of the risks of investing in the Fund by showing changes in the Fund’s performance from year to year over the periods indicated and by showing how the Fund’s average annual total returns for the periods indicated, both before and after taxes, compared to those of a relevant broad-based securities market index. The Bloomberg 3000 Index, the Fund’s primary comparative index, reflects the performance of the broad U.S. stock market and consists of companies of all market capitalizations. All Fund performance numbers are calculated after deducting fees and expenses, and all numbers assume reinvestment of dividends. Total returns shown include fee waivers and expense reimbursements, if any; total returns would have been lower had there been no waivers and/or reimbursements. The Fund’s past performance is not necessarily an indication of how the Fund will perform in the future both before and after taxes. Updated performance information is available at weitzinvestments.com or by calling us toll-free at 888-859-0698.
Calendar Year Returns
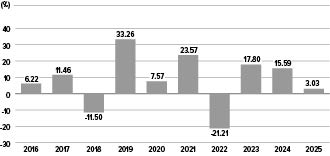
The year-to-date return for the Fund’s Investor Class for the six months ended June 30, 2026 was -1.12%.
The following chart and table provide an indication of the risks of investing in the Fund by showing changes in the Fund’s performance from year to year over the periods indicated and by showing how the Fund’s average annual total returns for the periods indicated, both before and after taxes, compared to those of a relevant broad-based securities market index. The Bloomberg 3000 Index, the Fund’s primary comparative index, reflects the performance of the broad U.S. stock market and consists of companies of all market capitalizations. All Fund performance numbers are calculated after deducting fees and expenses, and all numbers assume reinvestment of dividends. Total returns shown include fee waivers and expense reimbursements, if any; total returns would have been lower had there been no waivers and/or reimbursements. The Fund’s past performance is not necessarily an indication of how the Fund will perform in the future both before and after taxes. Updated performance information is available at weitzinvestments.com or by calling us toll-free at 888-859-0698.
Calendar Year Returns
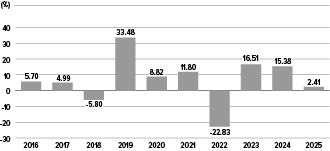
The year-to-date return for the Fund’s Investor Class for the six months ended June 30, 2026 was -0.95%.
The following chart and table provide an indication of the risks of investing in the Fund by showing changes in the Fund’s performance from year to year over the periods indicated and by showing how the Fund’s average annual total returns for the periods indicated, both before and after taxes, compared to those of two relevant securities market indexes. The Bloomberg US Aggregate Bond Index, the Fund’s primary comparative index, is a broad-based securities market index generally representative of the market for investment grade, U.S. dollar-denominated, fixed-rate taxable bonds. All Fund performance numbers are calculated after deducting fees and expenses, and all numbers assume reinvestment of dividends. Total returns shown include fee waivers and expense reimbursements, if any; total returns would have been lower had there been no waivers and/or reimbursements. The Fund’s past performance is not necessarily an indication of how the Fund will perform in the future both before and after taxes. Effective December 16, 2016, the Fund revised its principal investment strategies. The Fund’s past performance in the bar chart and table for periods prior to December 16, 2016 reflect the Fund’s prior principal investment strategies and may not be indicative of future performance results. Updated performance information is available at weitzinvestments.com or by calling us toll-free at 888-859-0698.
Calendar Year Returns
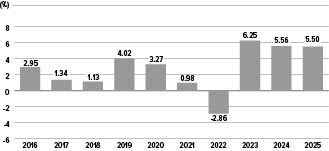
The year-to-date return for the Fund’s Investor Class for the six months ended June 30, 2026 was 1.41%.
The year-to-date return for the Fund’s Institutional Class for the six months ended June 30, 2026 was 1.56%.