The following tables show historical performance of the Balanced Fund and provide some indication of the risks of investing in the Fund. Table I shows the Fund’s Investor Shares total returns before taxes for each of the periods set forth in the Table. Table II shows the Fund’s Investor Shares average annual total returns for 1, 5, and 10 years both before and after taxes. Table II also shows the Fund’s Institutional Shares returns before taxes for 1, 5, and 10 years (reflecting the performance of the Investor Shares for periods prior to inception of Institutional Shares and adjusted for Institutional Shares fees and expenses), and compares those returns to the performance of the Fund’s benchmark index, the Bloomberg Aggregate Bond Index, and four different supplementary securities market indices, the Standard & Poor’s 500 Composite Index (S&P 500® Index), the Bloomberg Intermediate Government/Credit Bond Index, MSCI’s Europe, Australasia, and Far East (EAFE) Index, and a Blended Benchmark, which is a composite comprised of 55% S&P 500 Index, 35% Bloomberg Intermediate Government/Credit Bond Index, and 10% MSCI EAFE Index. The Bloomberg Aggregate Bond Index represents a broad spectrum of dollar-denominated, fixed-rate debt, including government, corporate, and securitized bonds. The S&P 500® Index reflects the market sectors for U.S.-based equities in which the Fund primarily invests. The Bloomberg Intermediate Government/Credit Bond Index is a broad-based index of government and investment-grade corporate fixed-rate debt securities with maturities between 1 and 10 years and represents the bond markets in which the Fund primarily invests. The MSCI EAFE Index reflects the performance of major developed international equity markets, other than the United States and Canada, in which the Fund invests. The included Blended Benchmark represents a broad measure of the stock and bond markets, including market sectors and geography, in which the Fund may invest. The performance data quoted represents past performance and current returns may be
lower or higher. Past performance (before and after taxes) does not guarantee future results. Recent performance information for the Fund is available on the Fund’s website at www.plumbfunds.com or by calling (toll free) 1-866-987-7888.
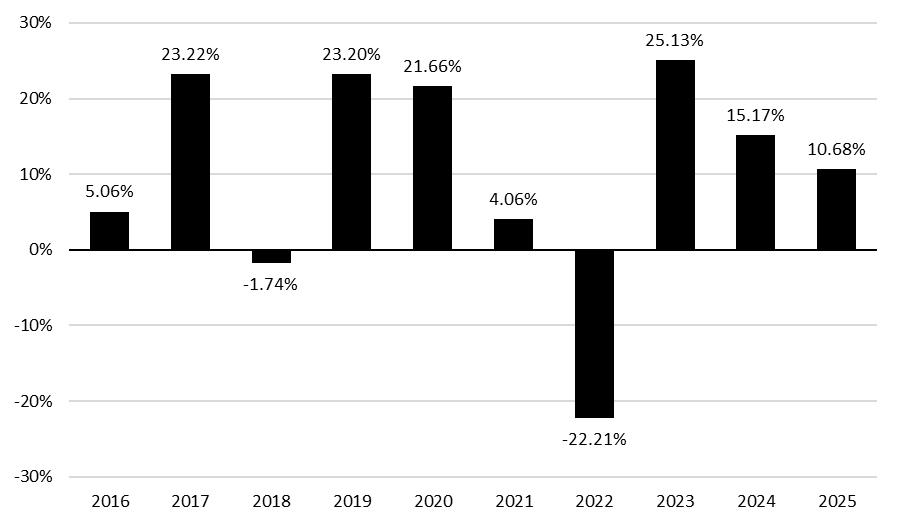
| (1) | The returns shown in the bar chart are for Investor Shares of the Fund. Institutional Shares would have substantially similar annual returns because the shares are invested in the same portfolio of securities and the annual returns would differ only to the extent that the classes do not have the same expenses. |
The Fund’s highest and lowest quarterly returns during the period presented in Table I:
| Highest Quarterly Return | Lowest Quarterly Return | |
| 19.41% | -17.18% |
The performance information above is calculated based on a calendar year. The Fund’s total return (not annualized) for the six-month period ended June 30, 2026 was 10.39%.
| TABLE II | ||||||||||||
| Balanced Fund Average Annual Total Returns (for the periods ended December 31, 2025) |
||||||||||||
| Investor Shares | 1 Year | 5 Years | 10 Years | |||||||||
| Return Before Taxes | 10.68 | % | 5.24 | % | 9.43 | % | ||||||
| Return After Taxes on Distributions | 8.40 | % | 3.58 | % | 8.40 | % | ||||||
| Return After Taxes on Distributions and Sale of Fund Shares | 7.93 | % | 3.82 | % | 7.55 | % | ||||||
| Institutional Shares(1) | ||||||||||||
| Return Before Taxes | 10.98 | % | 5.49 | % | 7.54 | % | ||||||
| S&P 500® Index (reflects no deduction for fees, expenses or taxes) |
17.88 | % | 14.42 | % | 14.82 | % | ||||||
| Bloomberg Intermediate Government/Credit Bond Index (reflects no deduction for fees, expenses or taxes) |
6.97 | % | (1.44 | )% | 2.08 | % | ||||||
| Bloomberg Aggregate Bond Index (reflects no deduction for fees, expenses or taxes) |
7.30 | % | (1.54 | )% | 2.65 | % | ||||||
| MSCI EAFE Index (reflects no deduction for fees, expenses, or taxes) |
27.89 | % | 8.78 | % | (1.88 | )% | ||||||
| Blended Benchmark (reflects no deduction for fees, expenses, or taxes) |
15.06 | % | 15.51 | % | 7.16 | % | ||||||
| (1) | Performance shown for the Institutional Shares prior to its commencement of operations on August 3, 2020 reflects the performance of the Investor Shares adjusted for Institutional Shares fees and expenses. |
After-tax returns are calculated using the highest individual federal marginal income tax rates in effect during such years and do not reflect the impact of state or other local taxes. Actual after-tax returns depend on an investor’s tax situation and may differ from those shown, and after-tax returns shown are not relevant to investors who hold their Fund shares through tax-deferred arrangements, such as 401(k) plans or individual retirement accounts. After tax returns are shown for only Investor Shares and after-tax returns for Institutional Shares will vary.
The following tables show historical performance of the Equity Fund and provide some indication of the risks of investing in the Fund. Table I shows the Fund’s Investor Shares total returns before taxes for each of the periods set forth in the Table. Table II shows the Fund’s Investor Shares average annual total returns for 1, 5, and 10 years both before and after taxes. Table II also shows the Fund’s Institutional Shares returns before taxes for 1, 5, and 10 years (reflecting the performance of the Investor Shares for periods prior to inception of Institutional Shares and adjusted for Institutional Shares fees and expenses) and compares those returns to the performance of two different securities market indices, the S&P 500® Index and the MSCI EAFE Index, as well as to the Fund’s Benchmark, which is a composite comprised of 90% S&P 500® Index and 10% MSCI EAFE Index. The S&P 500® Index reflects the market sectors for U.S.-based equities in which the Fund primarily invests. The MSCI EAFE Index reflects the performance of major developed international equity markets, other than the United States and Canada, in which the Fund invests. The performance data quoted represents past performance and current returns may be lower or higher. Past performance (before and after taxes) does not guarantee future results. Recent performance information for the Fund is available on the Fund’s website at www.plumbfunds.com or by calling (toll free) 1-866-987-7888.
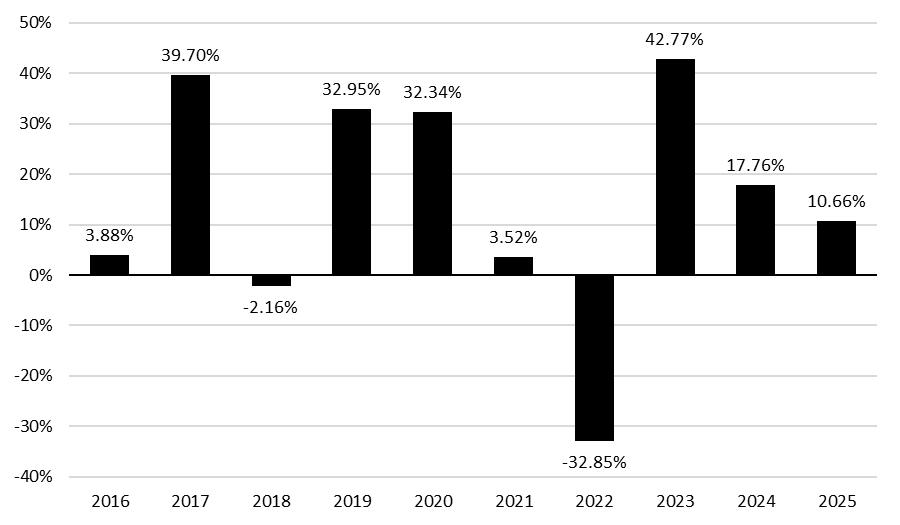
| (1) | The returns shown in the bar chart are for Investor Shares of the Fund. Institutional Shares would have substantially similar annual returns because the shares are invested in the same portfolio of securities and the annual returns would differ only to the extent that the classes do not have the same expenses. |
The Fund’s highest and lowest quarterly returns during the period presented in Table I:
| Highest Quarterly Return: | Lowest Quarterly Return: | |
| 28.79% | -24.18% |
The performance information above is calculated based on a calendar year. The Fund’s total return (not annualized) for the six-month period ended June 30, 2026 was 13.15%.
| TABLE II | ||||||||||||
| Equity Fund Average Annual Total Returns (for the periods ended December 31, 2025) |
||||||||||||
| Investor Shares | 1 Year | 5 Years | 10 Years | |||||||||
| Return Before Taxes | 10.66 | % | 5.28 | % | 12.44 | % | ||||||
| Return After Taxes on Distributions | 9.41 | % | 3.34 | % | 10.34 | % | ||||||
| Return After Taxes on Distributions and Sale of Fund Shares | 7.19 | % | 3.64 | % | 9.70 | % | ||||||
| Institutional Shares(1) | ||||||||||||
| Return Before Taxes | 10.94 | % | 5.52 | % | 8.98 | % | ||||||
| S&P 500® Index (reflects no deduction for fees, expenses or taxes) |
17.88 | % | 14.42 | % | 14.82 | % | ||||||
| MSCI EAFE Index (reflects no deduction for fees, expenses, or taxes) |
27.89 | % | 8.78 | % | (1.88 | )% | ||||||
| Blended Benchmark (reflects no deduction for fees, expenses, or taxes) |
18.90 | % | 26.60 | % | 10.53 | % | ||||||
| (1) | Performance shown for the Institutional Shares prior to its commencement of operations on August 3, 2020 reflects the performance of the Investor Shares adjusted for Institutional Shares fees and expenses. |
After-tax returns are calculated using the highest individual federal marginal income tax rates in effect during such years and do not reflect the impact of state or other local taxes. Actual after-tax returns depend on an investor’s tax situation and may differ from those shown, and after-tax returns shown are not relevant to investors who hold their Fund shares through tax-deferred arrangements, such as 401(k) plans or individual retirement accounts. After tax returns are shown for only Investor Shares and after-tax returns for Institutional Shares will vary.