Performance Management - (American Beacon Funds) |
Mar. 31, 2026 |
|||||||||||||||||||||||||||||||||||||||||||||||||||||||||||||||||||||||||||
|---|---|---|---|---|---|---|---|---|---|---|---|---|---|---|---|---|---|---|---|---|---|---|---|---|---|---|---|---|---|---|---|---|---|---|---|---|---|---|---|---|---|---|---|---|---|---|---|---|---|---|---|---|---|---|---|---|---|---|---|---|---|---|---|---|---|---|---|---|---|---|---|---|---|---|---|---|
| American Beacon DoubleLine Floating Rate Fund | ||||||||||||||||||||||||||||||||||||||||||||||||||||||||||||||||||||||||||||
| Prospectus [Line Items] | ||||||||||||||||||||||||||||||||||||||||||||||||||||||||||||||||||||||||||||
| Bar Chart and Performance Table [Heading] | Fund Performance | |||||||||||||||||||||||||||||||||||||||||||||||||||||||||||||||||||||||||||
| Performance Narrative [Text Block] | The bar chart and table below provide an indication of risk by showing changes in the Fund’s performance over time. The bar chart shows how the Fund’s performance has varied from year to year. The table shows how the Fund’s average annual total returns compare to a broad-based securities market index, as well as an additional market index with characteristics that are similar to those of the Fund, for the periods indicated. The Fund acquired the DoubleLine Floating Rate Fund, a series of DoubleLine Funds Trust (“Predecessor Fund”), in a reorganization that closed on February 20, 2026. In connection with that reorganization, the Y Class shares of the Fund have adopted the performance history and financial statements of the Class I shares of the Predecessor Fund, and the Investor Class shares of the Fund have adopted the performance history and financial statements of the Class N shares of the Predecessor Fund. The bar chart and table below show the performance of the Fund’s Y Class shares for all periods. In the bar chart and table below, the performance of the Fund’s Y Class shares reflects the returns of the Predecessor Fund’s Class I shares for periods prior to February 23, 2026. The table below also shows the performance of the Fund’s Investor Class shares for all periods. In the table below, the performance of the Fund’s Investor Class shares reflects the returns of the Predecessor Fund’s Class N shares. Performance information for the A Class, C Class and R5 Class shares of the Fund is not provided because those share classes have not been in operation for a full calendar year and have not adopted the performance history and financial statements of a corresponding share class of the Predecessor Fund. You may obtain updated performance information on the Fund’s website at www.americanbeaconfunds.com. Past performance (before and after taxes) is not necessarily an indication of how the Fund will perform in the future.
|
|||||||||||||||||||||||||||||||||||||||||||||||||||||||||||||||||||||||||||
| Performance Past Does Not Indicate Future [Text] | Past performance (before and after taxes) is not necessarily an indication of how the Fund will perform in the future. | |||||||||||||||||||||||||||||||||||||||||||||||||||||||||||||||||||||||||||
| Performance Information Illustrates Variability of Returns [Text] | The bar chart and table below provide an indication of risk by showing changes in the Fund’s performance over time. The bar chart shows how the Fund’s performance has varied from year to year. The table shows how the Fund’s average annual total returns compare to a broad-based securities market index, as well as an additional market index with characteristics that are similar to those of the Fund, for the periods indicated. | |||||||||||||||||||||||||||||||||||||||||||||||||||||||||||||||||||||||||||
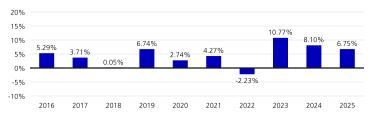
| Bar Chart [Heading] | Calendar year total returns for Y Class Shares. Year Ended 12/31 | |||||||||||||||||||||||||||||||||||||||||||||||||||||||||||||||||||||||||||
| Bar Chart [Table] | ![]() |
|||||||||||||||||||||||||||||||||||||||||||||||||||||||||||||||||||||||||||
| Bar Chart Closing [Text Block] | Highest Quarterly Return: 7.88% 2nd Quarter 2020 1/1/2016 through 12/31/2025 Lowest Quarterly Return: -10.91% 1st Quarter 2020 1/1/2016 through 12/31/2025 The calendar year-to-date total return as of June 30, 2026 was 1.65%.
|
|||||||||||||||||||||||||||||||||||||||||||||||||||||||||||||||||||||||||||
| Performance Table Heading | Average annual total returns for periods ended December 31, 2025 | |||||||||||||||||||||||||||||||||||||||||||||||||||||||||||||||||||||||||||
| Performance Table Uses Highest Federal Rate | After-tax returns are calculated using the historical highest individual federal marginal income tax rates and do not reflect the impact of state and local income taxes. | |||||||||||||||||||||||||||||||||||||||||||||||||||||||||||||||||||||||||||
| Performance Table Not Relevant to Tax Deferred | If you are a tax-exempt entity or hold your Fund shares through a tax-deferred arrangement, such as an individual retirement account (“IRA”) or a 401(k) plan, the after-tax returns do not apply to your situation. | |||||||||||||||||||||||||||||||||||||||||||||||||||||||||||||||||||||||||||
| Performance Table Explanation after Tax Higher | The return after taxes on distributions and sale of Fund shares may exceed the return before taxes due to an assumed tax benefit from any losses on a sale of Fund shares at the end of the measurement period. | |||||||||||||||||||||||||||||||||||||||||||||||||||||||||||||||||||||||||||
| Performance [Table] |
|
|||||||||||||||||||||||||||||||||||||||||||||||||||||||||||||||||||||||||||
| Performance Table One Class of after Tax Shown [Text] | After-tax returns are shown only for Y Class shares of the Fund; after-tax returns for other share classes will vary. | |||||||||||||||||||||||||||||||||||||||||||||||||||||||||||||||||||||||||||
| Performance Table Closing [Text Block] | After-tax returns are calculated using the historical highest individual federal marginal income tax rates and do not reflect the impact of state and local income taxes. Actual after-tax returns depend on an investor’s tax situation and may differ from those shown. The return after taxes on distributions and sale of Fund shares may exceed the return before taxes due to an assumed tax benefit from any losses on a sale of Fund shares at the end of the measurement period. If you are a tax-exempt entity or hold your Fund shares through a tax-deferred arrangement, such as an individual retirement account (“IRA”) or a 401(k) plan, the after-tax returns do not apply to your situation. After-tax returns are shown only for Y Class shares of the Fund; after-tax returns for other share classes will vary.
|
|||||||||||||||||||||||||||||||||||||||||||||||||||||||||||||||||||||||||||
| Performance Availability Website Address [Text] | www.americanbeaconfunds.com | |||||||||||||||||||||||||||||||||||||||||||||||||||||||||||||||||||||||||||
| American Beacon DoubleLine Floating Rate Fund | Y Class | ||||||||||||||||||||||||||||||||||||||||||||||||||||||||||||||||||||||||||||
| Prospectus [Line Items] | ||||||||||||||||||||||||||||||||||||||||||||||||||||||||||||||||||||||||||||
| Year to Date Return, Label [Optional Text] | The calendar year-to-date total return as of June 30, 2026 was 1.65%. | |||||||||||||||||||||||||||||||||||||||||||||||||||||||||||||||||||||||||||
| Bar Chart, Year to Date Return | 1.65% | |||||||||||||||||||||||||||||||||||||||||||||||||||||||||||||||||||||||||||
| Bar Chart, Year to Date Return, Date | Jun. 30, 2026 | |||||||||||||||||||||||||||||||||||||||||||||||||||||||||||||||||||||||||||
| Highest Quarterly Return, Label [Optional Text] | Highest Quarterly Return:7.88% 2nd Quarter 20201/1/2016 through 12/31/2025 | |||||||||||||||||||||||||||||||||||||||||||||||||||||||||||||||||||||||||||
| Highest Quarterly Return | 7.88% | |||||||||||||||||||||||||||||||||||||||||||||||||||||||||||||||||||||||||||
| Highest Quarterly Return, Date | Jun. 30, 2020 | |||||||||||||||||||||||||||||||||||||||||||||||||||||||||||||||||||||||||||
| Lowest Quarterly Return, Label [Optional Text] | Lowest Quarterly Return:-10.91% 1st Quarter 20201/1/2016 through 12/31/2025 | |||||||||||||||||||||||||||||||||||||||||||||||||||||||||||||||||||||||||||
| Lowest Quarterly Return | (10.91%) | |||||||||||||||||||||||||||||||||||||||||||||||||||||||||||||||||||||||||||
| Lowest Quarterly Return, Date | Mar. 31, 2020 | |||||||||||||||||||||||||||||||||||||||||||||||||||||||||||||||||||||||||||
| American Beacon DoubleLine Select Income Fund | ||||||||||||||||||||||||||||||||||||||||||||||||||||||||||||||||||||||||||||
| Prospectus [Line Items] | ||||||||||||||||||||||||||||||||||||||||||||||||||||||||||||||||||||||||||||
| Bar Chart and Performance Table [Heading] | Fund Performance | |||||||||||||||||||||||||||||||||||||||||||||||||||||||||||||||||||||||||||
| Performance Narrative [Text Block] | The bar chart and table below provide an indication of risk by showing changes in the Fund’s performance over time. The bar chart shows how the Fund’s performance has varied from year to year. The table shows how the Fund’s average annual total returns compare to a broad-based securities market index for the periods indicated. The Fund acquired the DoubleLine Select Income Fund, formerly known as the DoubleLine Infrastructure Income Fund, a series of DoubleLine Funds Trust (“Predecessor Fund”), in a reorganization that closed on February 20, 2026. In connection with that reorganization, the Y Class shares of the Fund have adopted the performance history and financial statements of the Class I shares of the Predecessor Fund, and the Investor Class shares of the Fund have adopted the performance history and financial statements of the Class N shares of the Predecessor Fund. The bar chart and table below show the performance of the Fund’s Y Class shares for all periods. In the bar chart and table below, the performance of the Fund’s Y Class shares reflects the returns of the Predecessor Fund’s Class I shares for periods prior to February 23, 2026. The table below also shows the performance of the Fund’s Investor Class shares for all periods. In the table below, the performance of the Fund’s Investor Class shares reflects the returns of the Predecessor Fund’s Class N shares. Performance information for R6 Class shares of the Fund is not provided because that share class of the Fund has not been in operation for a full calendar year and has not adopted the performance history and financial statements of any class of the Predecessor Fund. You may obtain updated performance information on the Fund’s website at www.americanbeaconfunds.com. Past performance (before and after taxes) is not necessarily an indication of how the Fund will perform in the future.
|
|||||||||||||||||||||||||||||||||||||||||||||||||||||||||||||||||||||||||||
| Performance Past Does Not Indicate Future [Text] | Past performance (before and after taxes) is not necessarily an indication of how the Fund will perform in the future. | |||||||||||||||||||||||||||||||||||||||||||||||||||||||||||||||||||||||||||
| Performance Information Illustrates Variability of Returns [Text] | The bar chart and table below provide an indication of risk by showing changes in the Fund’s performance over time. The bar chart shows how the Fund’s performance has varied from year to year. The table shows how the Fund’s average annual total returns compare to a broad-based securities market index for the periods indicated. | |||||||||||||||||||||||||||||||||||||||||||||||||||||||||||||||||||||||||||
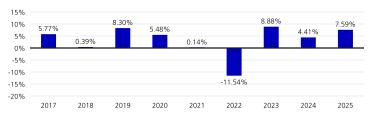
| Bar Chart [Heading] | Calendar year total returns for Y Class shares. Year Ended 12/31 | |||||||||||||||||||||||||||||||||||||||||||||||||||||||||||||||||||||||||||
| Bar Chart [Table] | ![]() |
|||||||||||||||||||||||||||||||||||||||||||||||||||||||||||||||||||||||||||
| Bar Chart Closing [Text Block] | Highest Quarterly Return: 8.70% 2nd Quarter 2020 01/01/2017 through 12/31/2025 Lowest Quarterly Return: -7.21% 1st Quarter 2020 01/01/2017 through 12/31/2025 The calendar year-to-date total return as of June 30, 2026 was 1.18%.
|
|||||||||||||||||||||||||||||||||||||||||||||||||||||||||||||||||||||||||||
| Performance Table Heading | Average annual total returns for periods ended December 31, 2025 | |||||||||||||||||||||||||||||||||||||||||||||||||||||||||||||||||||||||||||
| Performance Table Uses Highest Federal Rate | After-tax returns are calculated using the historical highest individual federal marginal income tax rates and do not reflect the impact of state and local income taxes. | |||||||||||||||||||||||||||||||||||||||||||||||||||||||||||||||||||||||||||
| Performance Table Not Relevant to Tax Deferred | If you are a tax-exempt entity or hold your Fund shares through a tax-deferred arrangement, such as an individual retirement account (“IRA”) or a 401(k) plan, the after-tax returns do not apply to your situation. | |||||||||||||||||||||||||||||||||||||||||||||||||||||||||||||||||||||||||||
| Performance Table Explanation after Tax Higher | The return after taxes on distributions and sale of Fund shares may exceed the return before taxes due to an assumed tax benefit from any losses on a sale of Fund shares at the end of the measurement period. | |||||||||||||||||||||||||||||||||||||||||||||||||||||||||||||||||||||||||||
| Performance [Table] |
|
|||||||||||||||||||||||||||||||||||||||||||||||||||||||||||||||||||||||||||
| Performance Table One Class of after Tax Shown [Text] | After-tax returns are shown only for Y Class shares of the Fund; after-tax returns for other share classes will vary. | |||||||||||||||||||||||||||||||||||||||||||||||||||||||||||||||||||||||||||
| Performance Table Closing [Text Block] | After-tax returns are calculated using the historical highest individual federal marginal income tax rates and do not reflect the impact of state and local income taxes. Actual after-tax returns depend on an investor’s tax situation and may differ from those shown. The return after taxes on distributions and sale of Fund shares may exceed the return before taxes due to an assumed tax benefit from any losses on a sale of Fund shares at the end of the measurement period. If you are a tax-exempt entity or hold your Fund shares through a tax-deferred arrangement, such as an individual retirement account (“IRA”) or a 401(k) plan, the after-tax returns do not apply to your situation. After-tax returns are shown only for Y Class shares of the Fund; after-tax returns for other share classes will vary.
|
|||||||||||||||||||||||||||||||||||||||||||||||||||||||||||||||||||||||||||
| Performance Availability Website Address [Text] | www.americanbeaconfunds.com | |||||||||||||||||||||||||||||||||||||||||||||||||||||||||||||||||||||||||||
| American Beacon DoubleLine Select Income Fund | Y Class | ||||||||||||||||||||||||||||||||||||||||||||||||||||||||||||||||||||||||||||
| Prospectus [Line Items] | ||||||||||||||||||||||||||||||||||||||||||||||||||||||||||||||||||||||||||||
| Year to Date Return, Label [Optional Text] | The calendar year-to-date total return as of June 30, 2026 was 1.18%. | |||||||||||||||||||||||||||||||||||||||||||||||||||||||||||||||||||||||||||
| Bar Chart, Year to Date Return | 0.18% | |||||||||||||||||||||||||||||||||||||||||||||||||||||||||||||||||||||||||||
| Bar Chart, Year to Date Return, Date | Jun. 30, 2026 | |||||||||||||||||||||||||||||||||||||||||||||||||||||||||||||||||||||||||||
| Highest Quarterly Return, Label [Optional Text] | Highest Quarterly Return:8.70% 2nd Quarter 202001/01/2017 through 12/31/2025 | |||||||||||||||||||||||||||||||||||||||||||||||||||||||||||||||||||||||||||
| Highest Quarterly Return | 8.70% | |||||||||||||||||||||||||||||||||||||||||||||||||||||||||||||||||||||||||||
| Highest Quarterly Return, Date | Jun. 30, 2020 | |||||||||||||||||||||||||||||||||||||||||||||||||||||||||||||||||||||||||||
| Lowest Quarterly Return, Label [Optional Text] | Lowest Quarterly Return:-7.21% 1st Quarter 202001/01/2017 through 12/31/2025 | |||||||||||||||||||||||||||||||||||||||||||||||||||||||||||||||||||||||||||
| Lowest Quarterly Return | (7.21%) | |||||||||||||||||||||||||||||||||||||||||||||||||||||||||||||||||||||||||||
| Lowest Quarterly Return, Date | Mar. 31, 2020 |