Exhibit 99.2
| 0 Supplemental Financial Presentation July 2026 Offering everyone a piece of the American spirit—one handshake at a time. |

| 1 Important Information Forward-Looking Statements This presentation contains forward-looking statements that are subject to risks and uncertainties. All statements other than statements of historical fact included in this presentation are forward-looking statements. Forward-looking statements refer to Boot Barn Holdings, Inc.’s (the “Company,” “Boot Barn,” “BOOT,” “we,” “us,” and “our”) current expectations and projections relating to, by way of example and without limitation, the Company’s financial condition, liquidity, profitability, results of operations, margins, plans, objectives, strategies, future performance, business, and industry. You can identify forward-looking statements by the fact that they generally do not relate strictly to historical or current facts. These statements may include words such as “anticipate”, “estimate”, “expect”, “project”, “plan“, “intend”, “believe”, “may”, “might”, “will”, “could”, “should”, “can have”, “likely”, “outlook”, and other words and terms of similar meaning in connection with any discussion of the timing or nature of future operating or financial performance or other events, but not all forward-looking statements contain these identifying words. These forward-looking statements are based on assumptions that the Company’s management has made in light of their industry experience and on their perceptions of historical trends, current conditions, expected future developments and other factors that they believe are appropriate under the circumstances. As you consider this presentation, you should understand that these statements are not guarantees of performance or results. They involve risks, uncertainties (some of which are beyond the Company’s control), and assumptions. These risks, uncertainties, and assumptions include, but are not limited to, the following: decreases in consumer spending due to declines in consumer confidence, local economic conditions, or changes in consumer preferences; the impact that import tariffs and other trade restrictions imposed by the U.S., or other countries have had, and may continue to have, on our product costs and changes to U.S. or other countries’ trade policies and tariff and import/export regulations; the Company’s ability to effectively execute on its growth strategy; and the Company’s failure to maintain and enhance its strong brand image, to compete effectively, to maintain good relationships with its key suppliers, and to improve and expand its exclusive product offerings. The Company discusses the foregoing risks and other risks in greater detail under the heading “Risk factors” in the periodic reports filed by the Company with the Securities and Exchange Commission. Although the Company believes that these forward-looking statements are based on reasonable assumptions, you should be aware that many factors could affect the Company’s actual financial results and cause them to differ materially from those anticipated in the forward-looking statements. Because of these factors, the Company cautions that you should not place undue reliance on any of these forward-looking statements. New risks and uncertainties arise from time to time, and it is impossible for the Company to predict those events or how they may affect the Company. Further, any forward-looking statement speaks only as of the date on which it is made. Except as required by law, the Company does not intend to update or revise the forward-looking statements in this presentation after the date of this presentation. Industry and Market Information Statements in this presentation concerning our industry and the markets in which we operate, including our general expectations and competitive position, business opportunity and market size, growth and share, are based on information from independent industry organizations and other third-party sources, data from our internal research, and management estimates. Management estimates are derived from publicly available information and the information and data referred to above and are based on assumptions and calculations made by us based upon our interpretation of such information and data. The information and data referred to above are imprecise and may prove to be inaccurate because the information cannot always be verified with complete certainty due to the limitations on the availability and reliability of raw data, the voluntary nature of the data gathering process, and other limitations and uncertainties. As a result, please be aware that the data and statistical information in this presentation may differ from information provided by our competitors or from information found in current or future studies conducted by market research institutes, consultancy firms, or independent sources. Recent Developments Our business and opportunities for growth depend on consumer discretionary spending, and as such, our results are particularly sensitive to economic conditions and consumer confidence. Inflation, changes to U.S. or other countries’ trade policies and tariff and import/export regulations, and other challenges affecting the global economy could impact our operations and will depend on future developments, which are uncertain. These and other effects make it more challenging for us to estimate the future performance of our business, particularly over the near-to-medium term. For further discussion of the uncertainties and business risks affecting the Company, see the sections captioned “Risk factors” in our periodic reports filed with the Securities and Exchange Commission. |
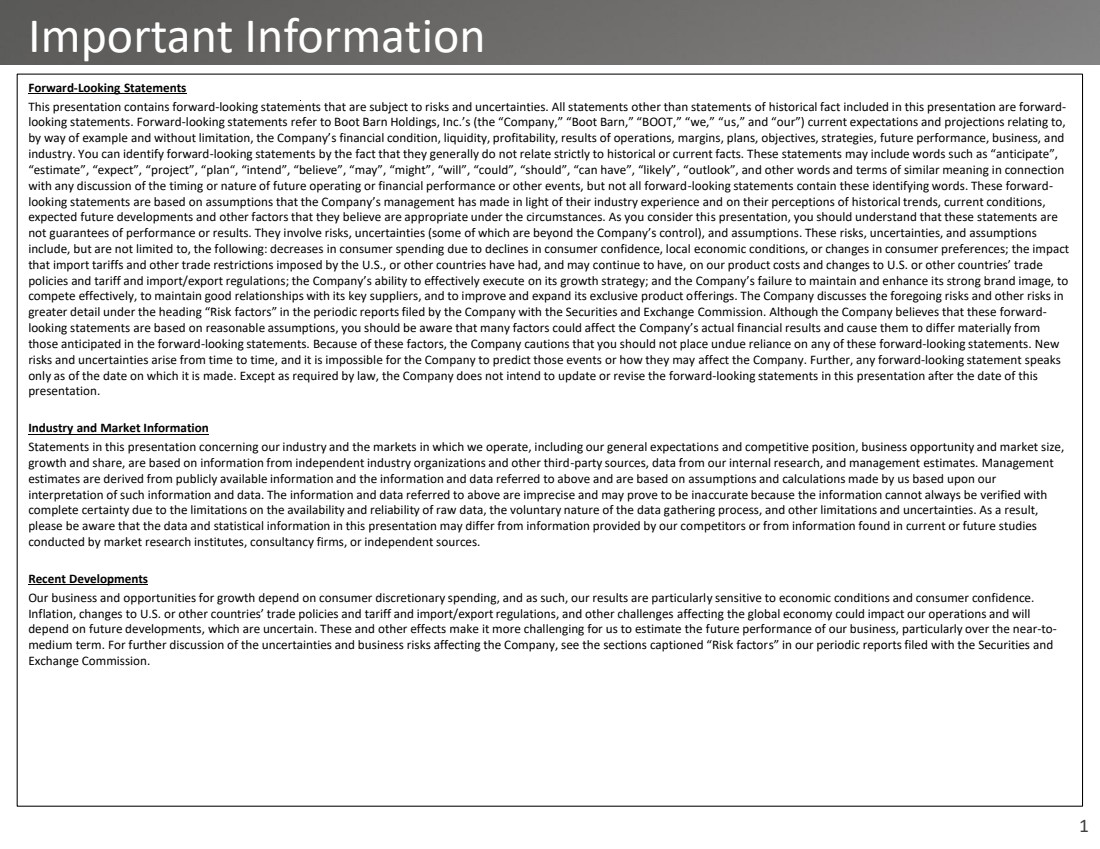
| 2 $1.35 $1.29 $1.13 $1.26 $1.74 $2.29 FY22 FY23 FY24 FY25 FY26 FY27 Q1 Fiscal 2027 Results 1 Included in merchandise margin is an estimated 250 basis point benefit due to tariff refunds, worth $14.7M. 2 Included in net income per diluted share is an estimated $0.38 benefit due to tariff refunds. 2 $306 $366 $384 $423 $504 $594 FY22 FY23 FY24 FY25 FY26 FY27 Q1 Total Sales ($M) 18% Total Sales Growth vs. LY 78.9% 10.0% -2.9% 1.4% 9.4% 4.7% FY22 FY23 FY24 FY25 FY26 FY27 Q1 Consolidated SSS% 14% Two-year Stack +420bps +40bps +90bps +100bps +180bps +220bps FY22 FY23 FY24 FY25 FY26 FY27 Q1 Merchandise Margin % +630bps over five years 1 1 Q1 EPS 32% Growth vs. LY2 +100bps Product Margin +70bps Freight +250bps Tariff Refunds +60bps Product Margin (90)bps Freight |
| 3 Strategic Initiatives Update 1 2 3 4 New Stores Same Store Sales Omni-Channel Merchandise Margin & Exclusive Brands |
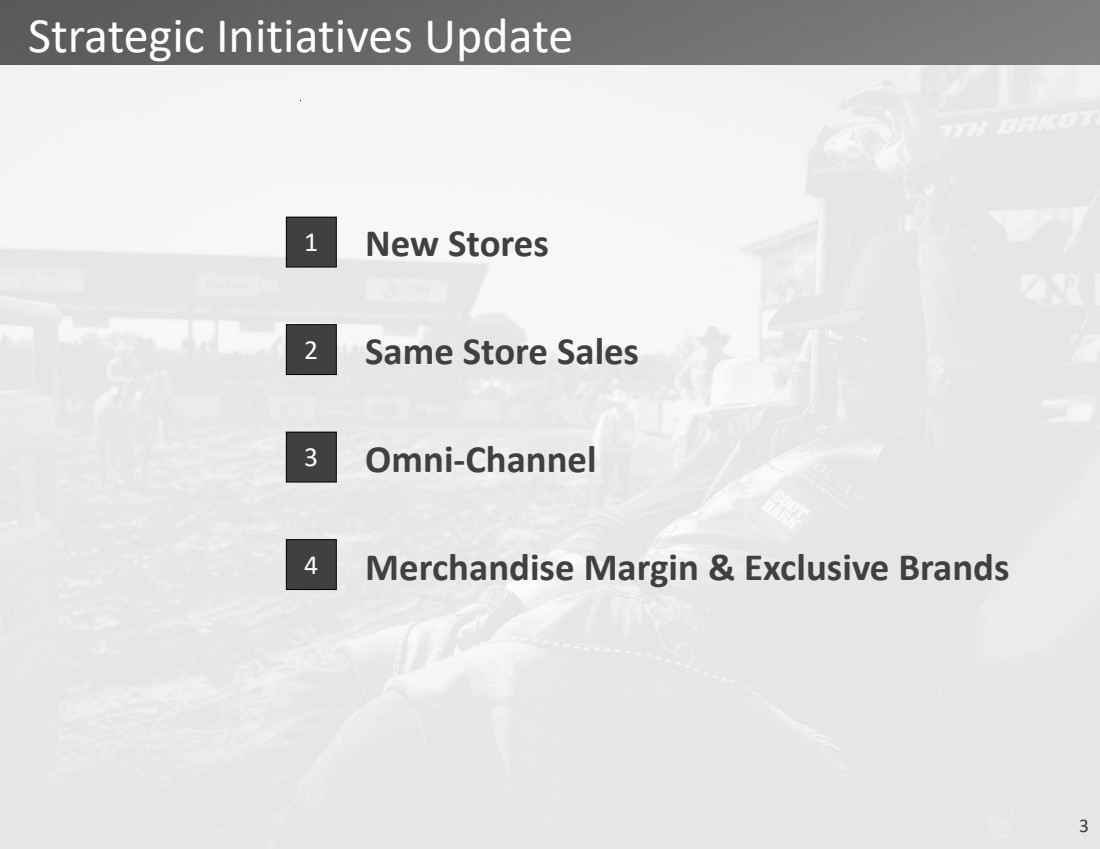
| 4 1 New Store Economics 1Represents the Company’s guidance to open a total of 70 new stores in Fiscal 2027, as provided on its first quarter earnings call held on July 29, 2026. 2Represents the Company’s estimated U.S. store count potential of 1,200 stores, based on internal analysis and a third-party study, as provided on its second quarter Fiscal 2026 earnings call held on October 29, 2025. 86 117 152 169 208 219 226 240 259 273 300 345 400 459 539 609 1,200 FY12 FY13 FY14 FY15 FY16 FY17 FY18 FY19 FY20 FY21 FY22 FY23 FY24 FY25 FY26 FY27 E U.S. Target Annual Store Count 1 Metrics Target Selling Square Feet ~12,000 Year 1 Net Sales ~$3.2M Net Capital Investment ~$0.9M Net Inventory Investment ~$0.8M Total Net Investment ~$1.7M Year 1 Cash on Cash Return ~53% Payback Period ~1.8 years 2 |
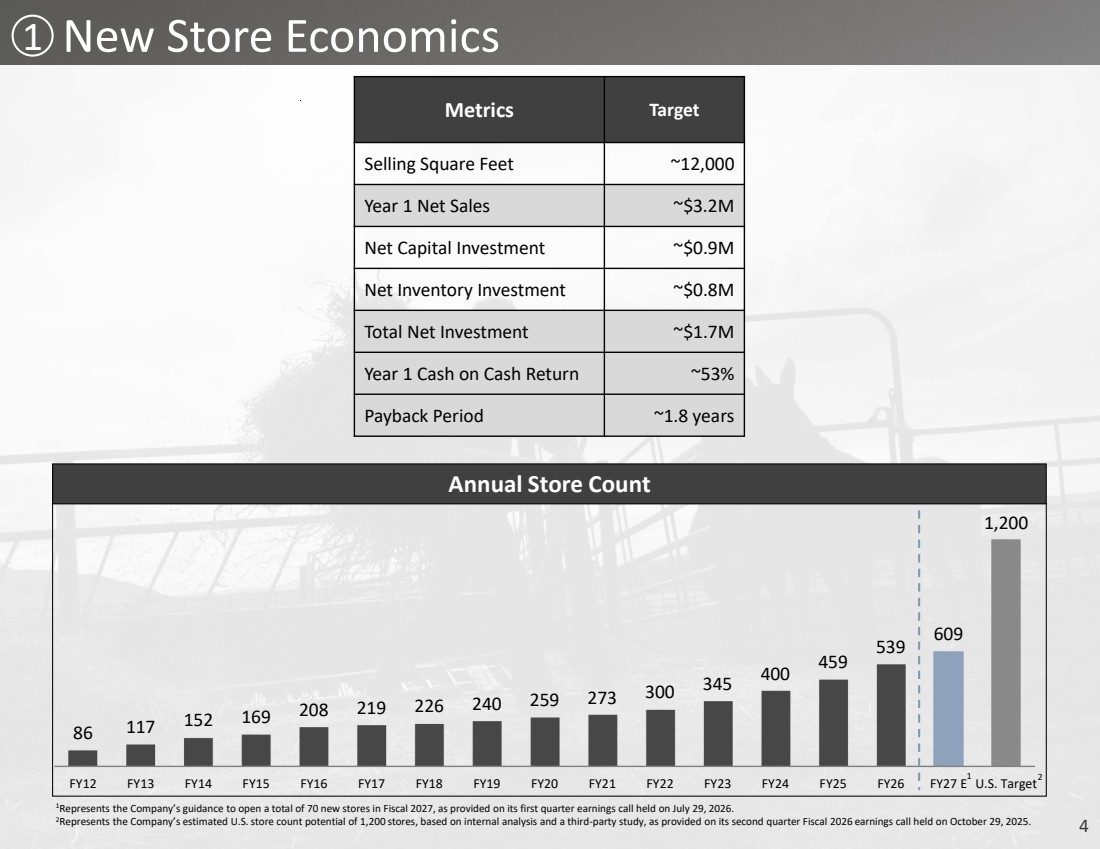
| 5 2 11.9% 6.7% 7.3% -0.1% 0.3% 5.2% 10.0% 5.0% 3.1% 53.7% -0.1% -6.2% 5.5% 7.2% 4.0% FY13 FY14 FY15 FY16 FY17 FY18 FY19 FY20 FY21 FY22 FY23 FY24 FY25 FY26 FY27 E Consolidated SSS% 1 1Reflects the high end of the Company’s guidance range provided on its first quarter earnings call held on July 29, 2026. Annual Same Store Sales Growth |
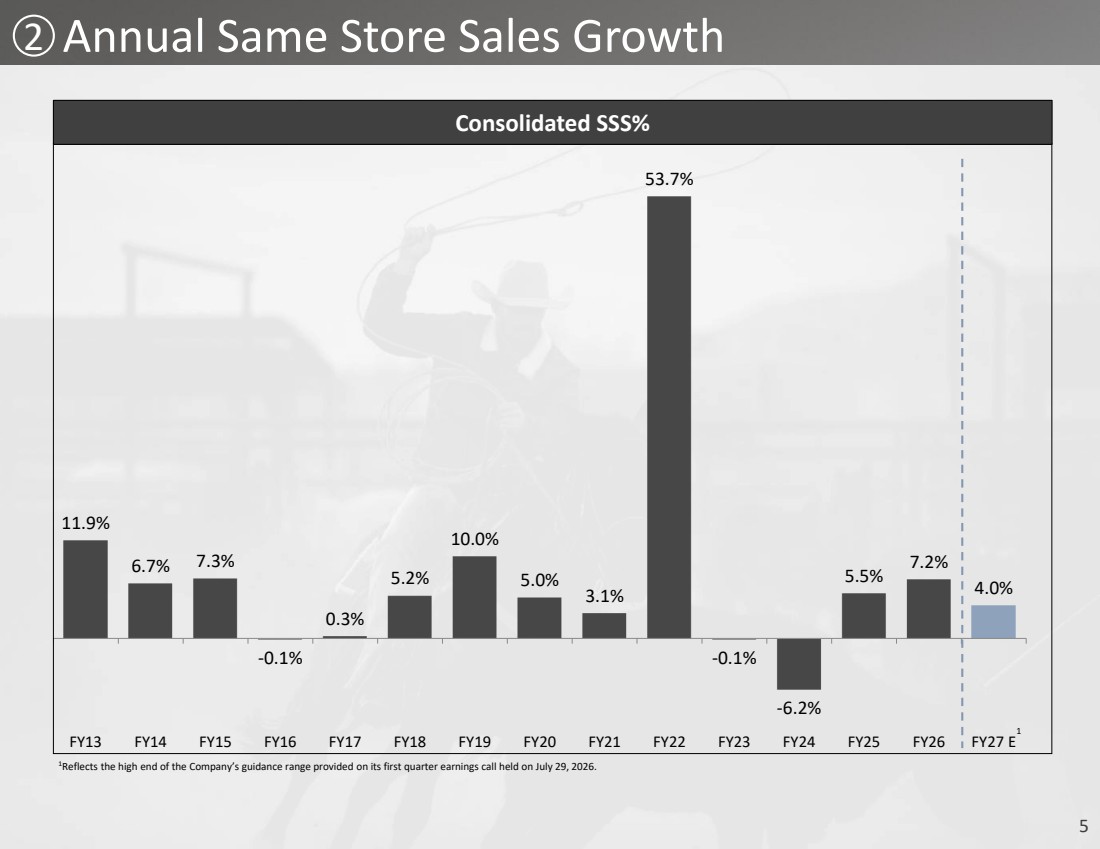
| 6 2 1Represents preliminary consolidated same store sales for the four weeks of July Fiscal 2027. 2Thanksgiving and Black Friday shifted from November Fiscal 2024 into December Fiscal 2025. 8.7% 11.5% 8.4% 11.3% 8.7% 6.1% 8.8% 6.1% 4.2% 6.7% 7.7% 4.5% Apr May Jun July Aug Sep Oct Nov Dec Jan Feb Mar FY26 (Black Friday in Fiscal December) -0.8% 2.4% 2.5% -0.3% 6.0% 8.0% 5.5% -1.9% 15.6% 8.1% 1.8% 7.7% Apr May Jun Jul Aug Sep Oct Nov Dec Jan Feb Mar FY25 (Black Friday in Fiscal December) FY24 (Black Friday in Fiscal November) -6.9% -3.3% 1.0% -0.5% -4.8% -7.7% -9.7% -11.9% -8.5% -7.7% -7.8% -3.2% Apr May Jun Jul Aug Sep Oct Nov Dec Jan Feb Mar 2 2 2 2 5.0% 3.4% 5.4% 0.0% Apr May Jun Jul FY27 (Black Friday in Fiscal December) 1 Consolidated SSS% by Month |
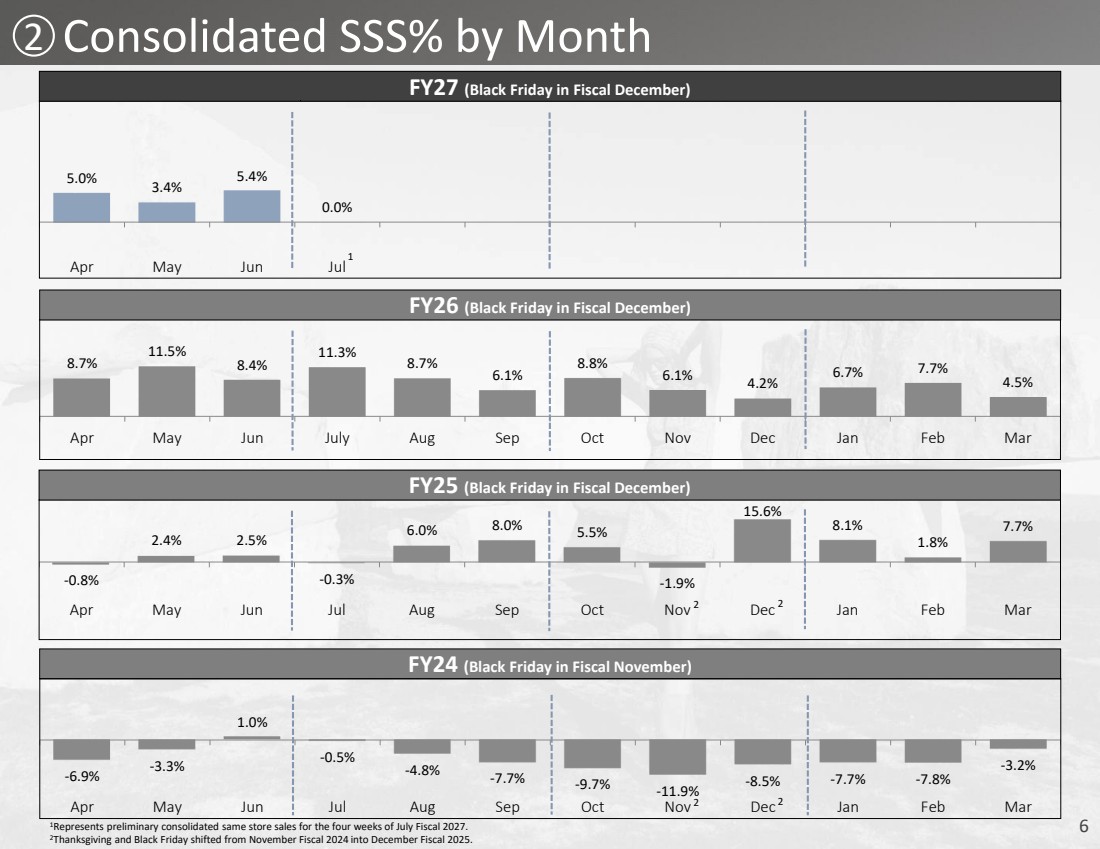
| 7 2 1Represents preliminary retail store same store sales for the four weeks of July Fiscal 2027. 2Thanksgiving and Black Friday shifted from November Fiscal 2024 into December Fiscal 2025. 9.8% 11.0% 8.0% 11.2% 7.9% 5.1% 7.1% 4.0% 1.9% 5.9% 6.9% 3.5% Apr May Jun July Aug Sep Oct Nov Dec Jan Feb Mar FY26 (Black Friday in Fiscal December) -1.5% 1.9% 1.8% -0.9% 5.3% 7.5% 4.6% -2.4% 16.0% 7.0% 0.9% 8.0% Apr May Jun Jul Aug Sep Oct Nov Dec Jan Feb Mar FY25 (Black Friday in Fiscal December) FY24 (Black Friday in Fiscal November) -5.0% -2.6% 1.5% 1.1% -3.7% -7.3% -8.8% -11.5% -8.5% -7.2% -8.1% -2.8% Apr May Jun Jul Aug Sep Oct Nov Dec Jan Feb Mar 2 2 2 2 3.8% 3.1% 4.4% -1.2% Apr May Jun Jul FY27 (Black Friday in Fiscal December) 1 Store SSS% by Month |
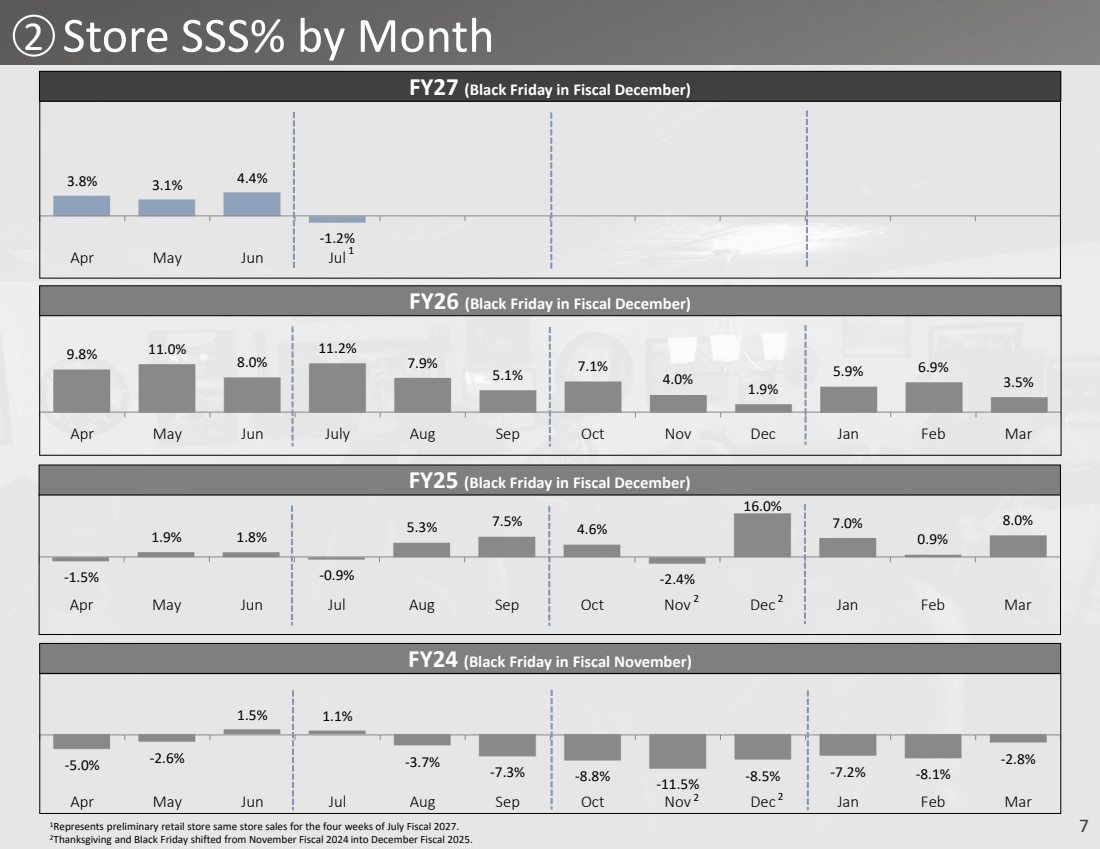
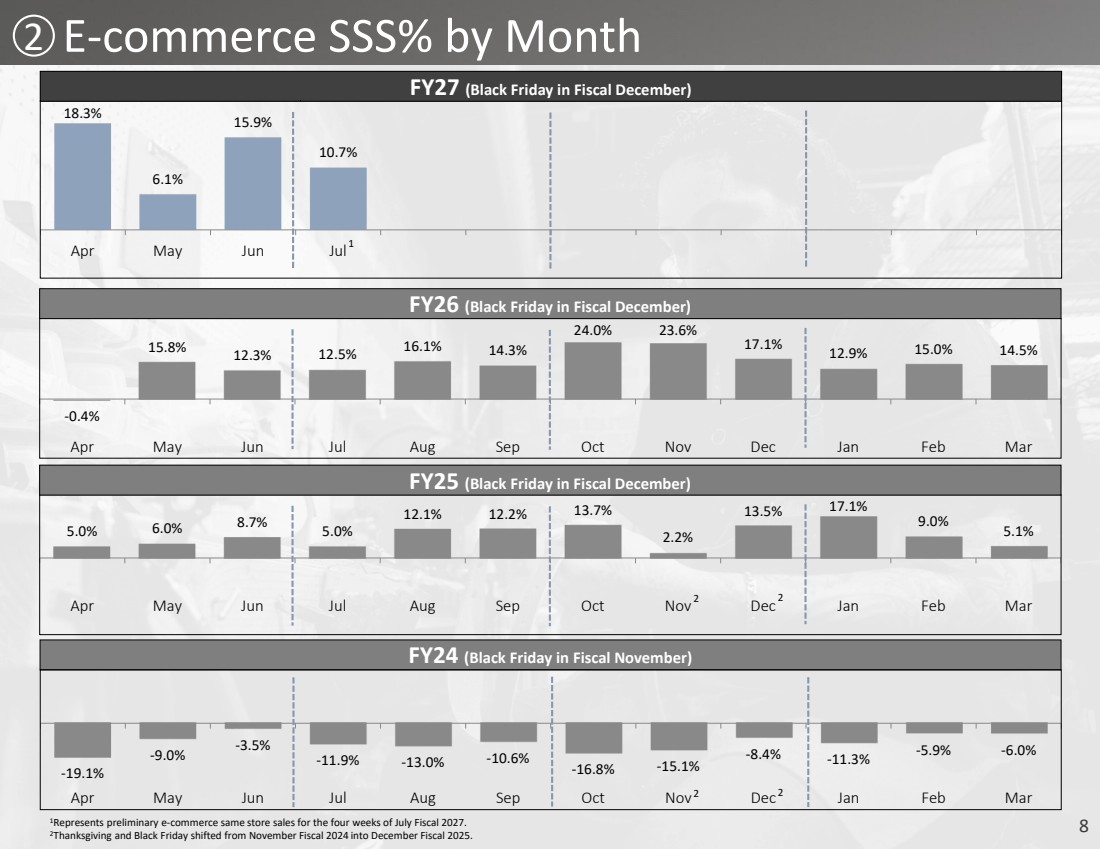
| 8 2 -0.4% 15.8% 12.3% 12.5% 16.1% 14.3% 24.0% 23.6% 17.1% 12.9% 15.0% 14.5% Apr May Jun Jul Aug Sep Oct Nov Dec Jan Feb Mar FY26 (Black Friday in Fiscal December) 5.0% 6.0% 8.7% 5.0% 12.1% 12.2% 13.7% 2.2% 13.5% 17.1% 9.0% 5.1% Apr May Jun Jul Aug Sep Oct Nov Dec Jan Feb Mar FY25 (Black Friday in Fiscal December) FY24 (Black Friday in Fiscal November) -19.1% -9.0% -3.5% -11.9% -13.0% -10.6% -16.8% -15.1% -8.4% -11.3% -5.9% -6.0% Apr May Jun Jul Aug Sep Oct Nov Dec Jan Feb Mar 1Represents preliminary e-commerce same store sales for the four weeks of July Fiscal 2027. 2Thanksgiving and Black Friday shifted from November Fiscal 2024 into December Fiscal 2025. 2 2 2 2 18.3% 6.1% 15.9% 10.7% Apr May Jun Jul FY27 (Black Friday in Fiscal December) 1 E-commerce SSS% by Month |
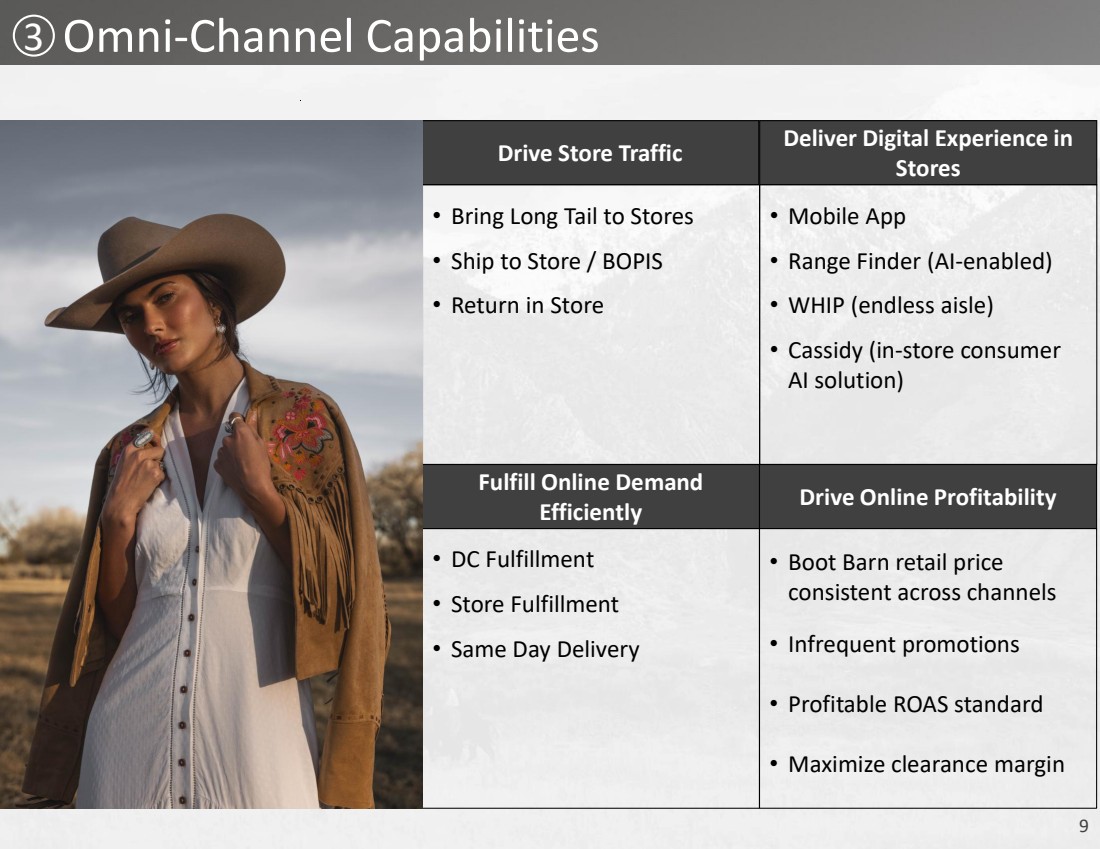
| 9 3 Drive Store Traffic • Bring Long Tail to Stores • Ship to Store / BOPIS • Return in Store Deliver Digital Experience in Stores • Mobile App • Range Finder (AI-enabled) • WHIP (endless aisle) • Cassidy (in-store consumer AI solution) Fulfill Online Demand Efficiently • DC Fulfillment • Store Fulfillment • Same Day Delivery Drive Online Profitability • Boot Barn retail price consistent across channels • Infrequent promotions • Profitable ROAS standard • Maximize clearance margin Omni-Channel Capabilities |
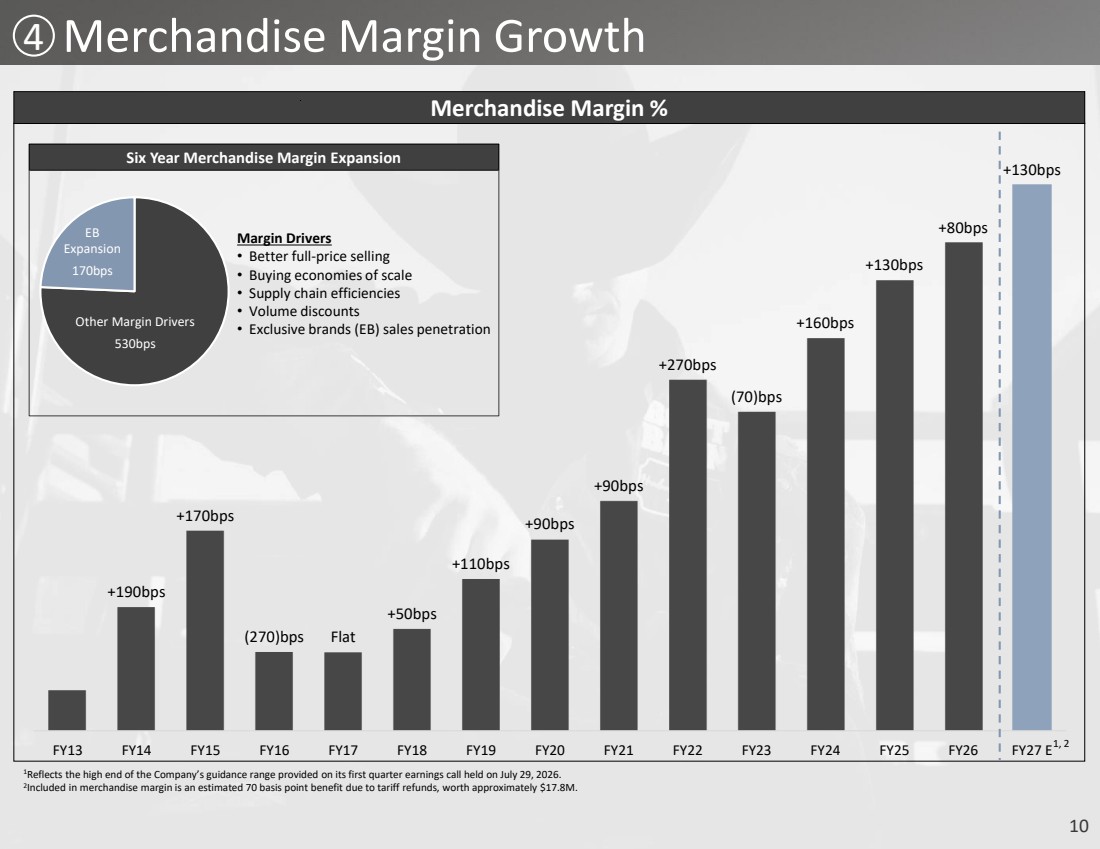
| 10 4 Merchandise Margin Growth 1Reflects the high end of the Company’s guidance range provided on its first quarter earnings call held on July 29, 2026. 2 Included in merchandise margin is an estimated 70 basis point benefit due to tariff refunds, worth approximately $17.8M. +190bps +170bps (270)bps Flat +50bps +110bps +90bps +90bps +270bps (70)bps +160bps +130bps +80bps +130bps FY13 FY14 FY15 FY16 FY17 FY18 FY19 FY20 FY21 FY22 FY23 FY24 FY25 FY26 FY27 E Merchandise Margin % 1, 2 Six Year Merchandise Margin Expansion Margin Drivers • Better full-price selling • Buying economies of scale • Supply chain efficiencies • Volume discounts • Exclusive brands (EB) sales penetration EB Expansion 170bps Other Margin Drivers 530bps |
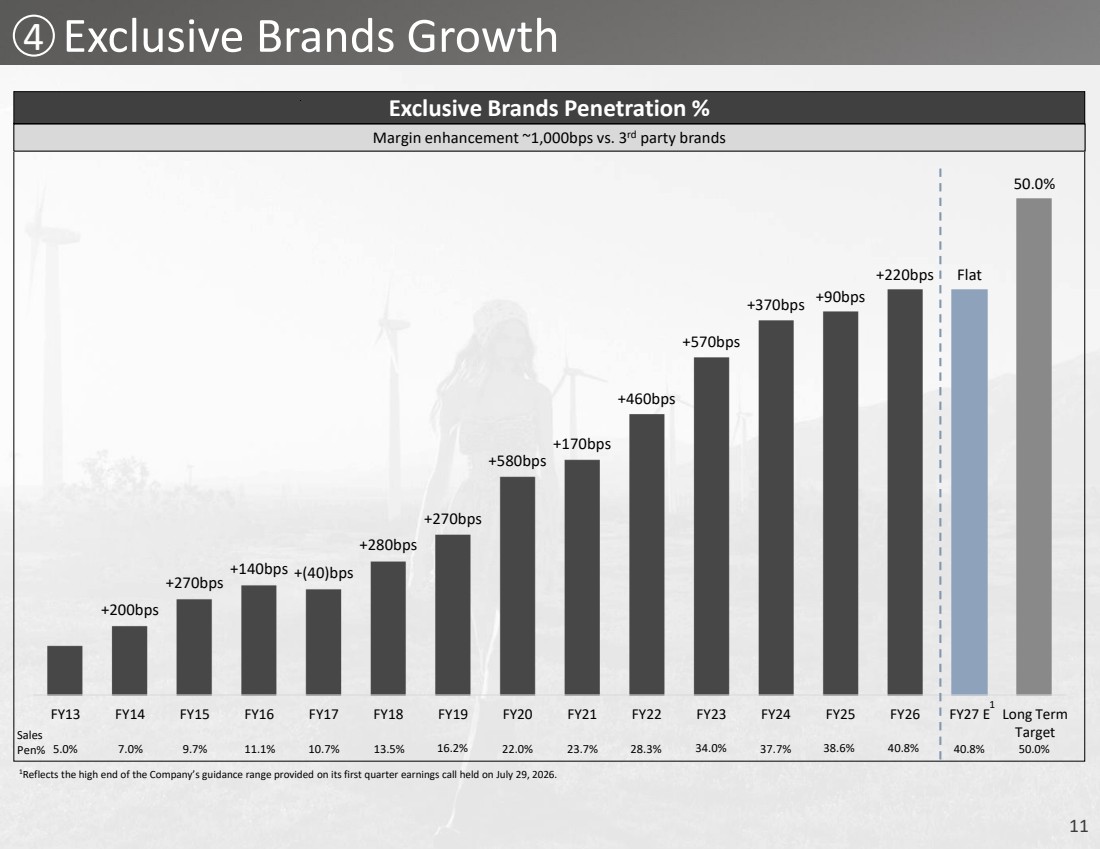
| 11 4 Exclusive Brands Growth 1Reflects the high end of the Company’s guidance range provided on its first quarter earnings call held on July 29, 2026. +200bps +270bps +140bps +(40)bps +280bps +270bps +580bps +170bps +460bps +570bps +370bps +90bps +220bps Flat FY13 FY14 FY15 FY16 FY17 FY18 FY19 FY20 FY21 FY22 FY23 FY24 FY25 FY26 FY27 E Exclusive Brands Penetration % Sales Pen% 5.0% 7.0% 9.7% 11.1% 10.7% 13.5% 16.2% 22.0% 23.7% 28.3% 34.0% 37.7% 38.6% 40.8% 40.8% Long Term Target Margin enhancement ~1,000bps vs. 3rd party brands 1 50.0% 50.0% |
| 12 FY27 Guidance |

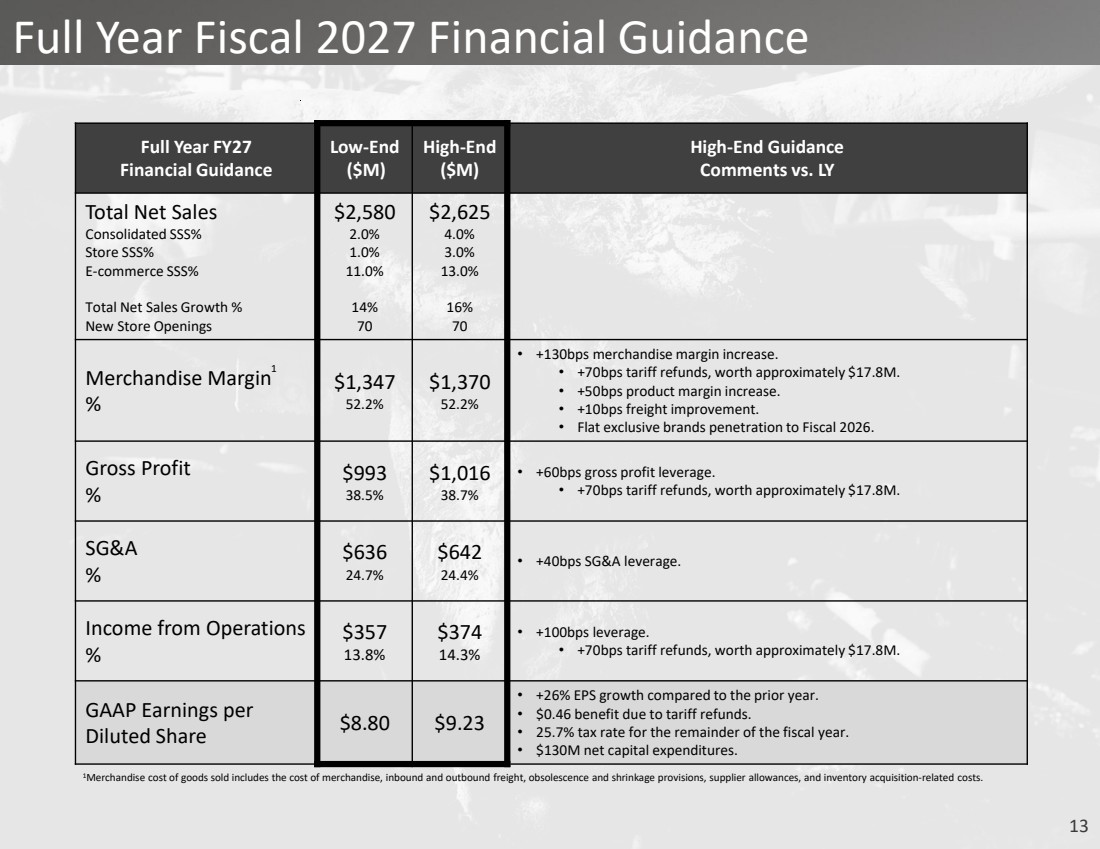
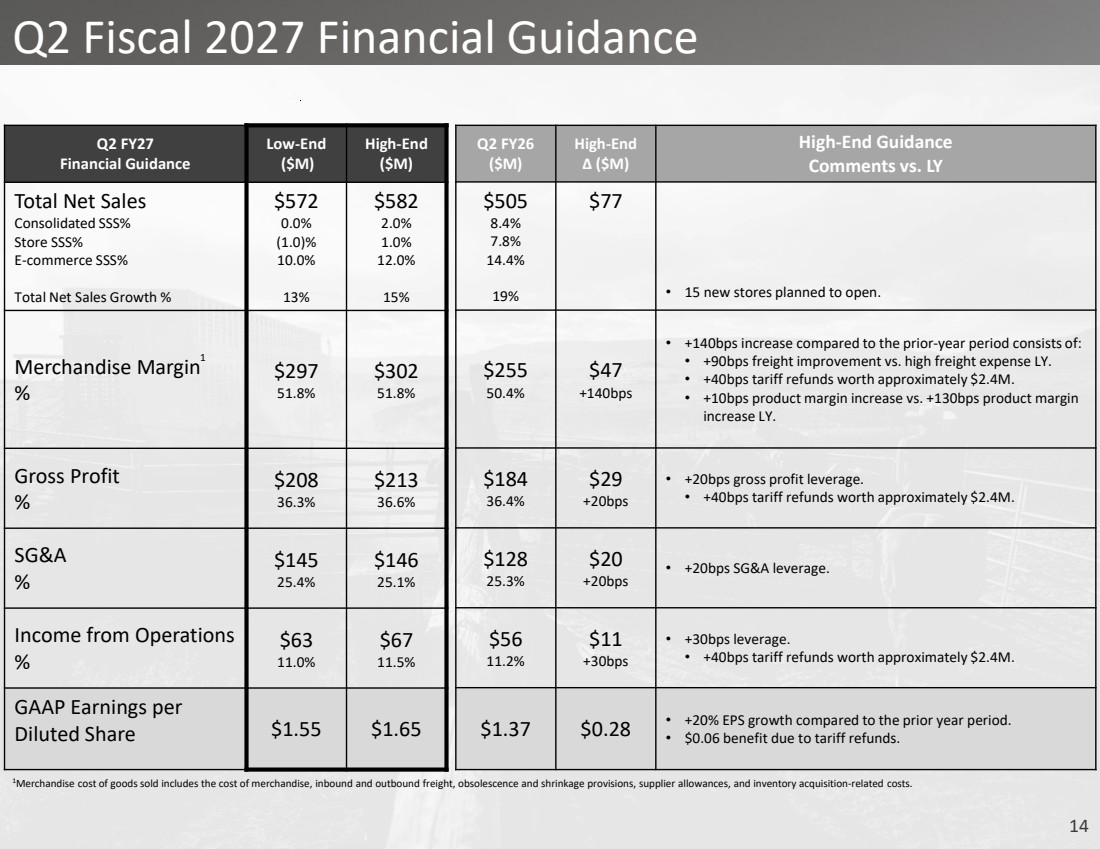
| 13 Full Year Fiscal 2027 Financial Guidance Full Year FY27 Financial Guidance Low-End ($M) High-End ($M) High-End Guidance Comments vs. LY Total Net Sales Consolidated SSS% Store SSS% E-commerce SSS% Total Net Sales Growth % New Store Openings $2,580 2.0% 1.0% 11.0% 14% 70 $2,625 4.0% 3.0% 13.0% 16% 70 Merchandise Margin % $1,347 52.2% $1,370 52.2% • +130bps merchandise margin increase. • +70bps tariff refunds, worth approximately $17.8M. • +50bps product margin increase. • +10bps freight improvement. • Flat exclusive brands penetration to Fiscal 2026. Gross Profit % $993 38.5% $1,016 38.7% • +60bps gross profit leverage. • +70bps tariff refunds, worth approximately $17.8M. SG&A % $636 24.7% $642 24.4% • +40bps SG&A leverage. Income from Operations % $357 13.8% $374 14.3% • +100bps leverage. • +70bps tariff refunds, worth approximately $17.8M. GAAP Earnings per Diluted Share $8.80 $9.23 • +26% EPS growth compared to the prior year. • $0.46 benefit due to tariff refunds. • 25.7% tax rate for the remainder of the fiscal year. • $130M net capital expenditures. 1 1Merchandise cost of goods sold includes the cost of merchandise, inbound and outbound freight, obsolescence and shrinkage provisions, supplier allowances, and inventory acquisition-related costs. |
| 14 Q2 Fiscal 2027 Financial Guidance Q2 FY27 Financial Guidance Low-End ($M) High-End ($M) Total Net Sales Consolidated SSS% Store SSS% E-commerce SSS% Total Net Sales Growth % $572 0.0% (1.0)% 10.0% 13% $582 2.0% 1.0% 12.0% 15% Merchandise Margin % $297 51.8% $302 51.8% Gross Profit % $208 36.3% $213 36.6% SG&A % $145 25.4% $146 25.1% Income from Operations % $63 11.0% $67 11.5% GAAP Earnings per Diluted Share $1.55 $1.65 1 1Merchandise cost of goods sold includes the cost of merchandise, inbound and outbound freight, obsolescence and shrinkage provisions, supplier allowances, and inventory acquisition-related costs. Q2 FY26 ($M) High-End Δ ($M) High-End Guidance Comments vs. LY $505 8.4% 7.8% 14.4% 19% $77 • 15 new stores planned to open. $255 50.4% $47 +140bps • +140bps increase compared to the prior-year period consists of: • +90bps freight improvement vs. high freight expense LY. • +40bps tariff refunds worth approximately $2.4M. • +10bps product margin increase vs. +130bps product margin increase LY. $184 36.4% $29 +20bps • +20bps gross profit leverage. • +40bps tariff refunds worth approximately $2.4M. $128 25.3% $20 +20bps • +20bps SG&A leverage. $56 11.2% $11 +30bps • +30bps leverage. • +40bps tariff refunds worth approximately $2.4M. $1.37 $0.28 • +20% EPS growth compared to the prior year period. • $0.06 benefit due to tariff refunds. |
| 15 investor.bootbarn.com |