Performance Management
|
Jul. 29, 2026 |
| Nomura Global Listed Infrastructure ETF |
|
| Prospectus [Line Items] |
|
| Bar Chart and Performance Table [Heading] |
How has Nomura Global Listed Infrastructure ETF performed?
|
| Performance Narrative [Text Block] |
The bar chart and table below provide some indication of the risks
of investing in the Fund by showing the Fund’s performance for the 2024 and 2025 calendar years and by showing how
the Fund’s average annual total returns for the 1-year and lifetime periods compare with those of a broad measure of market performance.
The Fund’s past performance (before and after taxes) is not necessarily an indication of how it will perform in the future. You
may obtain the Fund’s most recently available month-end performance by calling 844-469-9911 or by visiting the Fund’s website
at global.nomuraassetmanagement.com/investments/etf.The bar chart and table below provide some indication of the risks of investing in the Fund by showing the Fund’s performance for
the 2024 and 2025 calendar years and by showing how the Fund’s average annual total returns for the 1-year and lifetime periods
compare with those of a broad measure of market performance.
global.nomuraassetmanagement.com/investments/etf
|
| Performance Past Does Not Indicate Future [Text] |
The Fund’s past performance (before and after taxes) is not necessarily an indication of how it will perform in the future.
|
| Performance One Year or Less [Text] |
The performance
information shown above is based on a calendar year. The Fund’s performance from January 1, 2026 to June 30, 2026
was 8.79%.
|
| Performance Additional Market Index [Text] |
The bar chart and table below provide some indication of the risks of investing in the Fund by showing the Fund’s performance for
the 2024 and 2025 calendar years and by showing how the Fund’s average annual total returns for the 1-year and lifetime periods
compare with those of a broad measure of market performance.
|
| Bar Chart [Heading] |
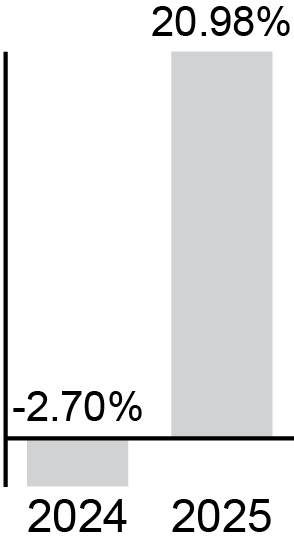
Calendar year-by-year total return
|
| Bar Chart [Table] |
| Year |
Percentage |
| 2024 |
-2.70% |
| 2025 |
20.98% |
|
| Bar Chart Closing [Text Block] |
During the period illustrated in this bar chart, the Fund’s highest
quarterly return was 14.80% for the quarter ended September 30, 2024, and its lowest quarterly return was -11.20% for the quarter ended
December 31, 2024.
|
| Highest Quarterly Return, Label [Optional Text] |
highest
quarterly return
|
| Highest Quarterly Return |
14.80%
|
| Highest Quarterly Return, Date |
Sep. 30, 2024
|
| Lowest Quarterly Return, Label [Optional Text] |
lowest quarterly return
|
| Lowest Quarterly Return |
(11.20%)
|
| Lowest Quarterly Return, Date |
Dec. 31, 2024
|
| Performance Table Heading |
Average annual total returns for periods ended December 31, 2025
|
| Performance Table Narrative |
Actual after-tax returns depend on the investor’s individual tax
situation and may differ from the returns shown. After-tax returns are not relevant for shares held in tax-advantaged investment vehicles
such as employer-sponsored 401(k) plans and individual retirement accounts (IRAs). The after-tax returns shown are calculated using the
highest individual federal marginal income tax rates in effect during the periods presented and do not reflect the impact of state and
local taxes.
|
| Performance Table Uses Highest Federal Rate |
The after-tax returns shown are calculated using the
highest individual federal marginal income tax rates in effect during the periods presented and do not reflect the impact of state and
local taxes.
|
| Performance Table Not Relevant to Tax Deferred |
After-tax returns are not relevant for shares held in tax-advantaged investment vehicles
such as employer-sponsored 401(k) plans and individual retirement accounts (IRAs).
|
| Performance [Table] |
| |
1 year |
Lifetime |
| Returns
before taxes (lifetime: 11/28/23-12/31/25) |
20.98% |
10.31% |
| Returns
after taxes on distributions (lifetime: 11/28/23-12/31/25) |
19.41% |
8.79% |
| Returns
after taxes on distributions and sale of Fund shares (lifetime: 11/28/23-12/31/25) |
12.36% |
7.44% |
| MSCI
World Index (Net) (lifetime: 11/28/23-12/31/25) |
21.09% |
21.90% |
| S&P
Global Infrastructure Index (Net) (lifetime: 11/28/23-12/31/25) |
21.54% |
19.40% |
|
| Performance Table One Class of after Tax Shown [Text] |
Actual after-tax returns depend on the investor’s individual tax
situation and may differ from the returns shown.
|
| Performance Availability Website Address [Text] |
global.nomuraassetmanagement.com/investments/etf
|
| Performance Availability Phone [Text] |
844-469-9911
|
| Nomura Energy Transition ETF |
|
| Prospectus [Line Items] |
|
| Bar Chart and Performance Table [Heading] |
How has Nomura Energy Transition ETF performed?
|
| Performance Narrative [Text Block] |
The bar chart and table below provide some indication of the risks
of investing in the Fund by showing the Fund’s performance for the 2024 and 2025 calendar years and by showing how
the Fund’s average annual total returns for the 1-year and lifetime periods compare with those of a broad measure of market performance.
The Fund’s past performance (before and after taxes) is not necessarily an indication of how it will perform in the future. You
may obtain the Fund’s most recently available month-end performance by calling 844-469-9911 or by visiting the Fund’s website
at global.nomuraassetmanagement.com/investments/etf.The bar chart and table below provide some indication of the risks of investing in the Fund by showing the Fund’s performance for
the 2024 and 2025 calendar years and by showing how the Fund’s average annual total returns for the 1-year and lifetime periods
compare with those of a broad measure of market performance.
global.nomuraassetmanagement.com/investments/etf
|
| Performance Past Does Not Indicate Future [Text] |
The Fund’s past performance (before and after taxes) is not necessarily an indication of how it will perform in the future.
|
| Performance One Year or Less [Text] |
The performance information shown above is based on a calendar year.
The Fund’s performance from January 1, 2026 to June 30, 2026 was 17.21%.
|
| Performance Additional Market Index [Text] |
The bar chart and table below provide some indication of the risks of investing in the Fund by showing the Fund’s performance for
the 2024 and 2025 calendar years and by showing how the Fund’s average annual total returns for the 1-year and lifetime periods
compare with those of a broad measure of market performance.
|
| Bar Chart [Heading] |
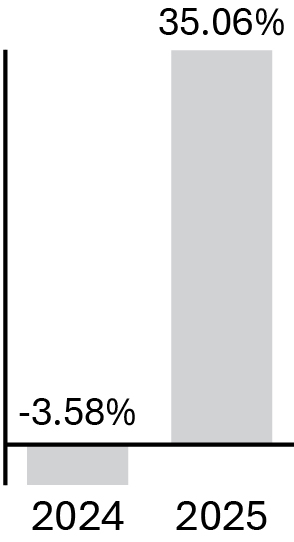
Calendar year-by-year total return
|
| Bar Chart [Table] |
| Year |
Percentage |
| 2024 |
-3.58% |
| 2025 |
35.06% |
|
| Bar Chart Closing [Text Block] |
During the period illustrated in this bar chart, the Fund’s highest
quarterly return was 14.76% for the quarter ended September 30, 2025, and its lowest quarterly return was -8.67% for the
quarter ended December 31, 2024.September 30, 2025
|
| Highest Quarterly Return, Label [Optional Text] |
highest
quarterly return
|
| Highest Quarterly Return |
14.76%
|
| Highest Quarterly Return, Date |
Sep. 30, 2025
|
| Lowest Quarterly Return, Label [Optional Text] |
lowest quarterly return
|
| Lowest Quarterly Return |
(8.67%)
|
| Lowest Quarterly Return, Date |
Dec. 31, 2024
|
| Performance Table Heading |
Average annual total returns for periods ended December 31, 2025
|
| Performance Table Narrative |
Actual after-tax returns depend on the investor’s individual tax
situation and may differ from the returns shown. After-tax returns are not relevant for shares held in tax-advantaged investment vehicles
such as employer-sponsored 401(k) plans and individual retirement accounts (IRAs). The after-tax returns shown are calculated using the
highest individual federal marginal income tax rates in effect during the periods presented and do not reflect the impact of state and
local taxes.
|
| Performance Table Uses Highest Federal Rate |
The after-tax returns shown are calculated using the
highest individual federal marginal income tax rates in effect during the periods presented and do not reflect the impact of state and
local taxes.
|
| Performance Table Not Relevant to Tax Deferred |
After-tax returns are not relevant for shares held in tax-advantaged investment vehicles
such as employer-sponsored 401(k) plans and individual retirement accounts (IRAs).
|
| Performance [Table] |
| |
1 year |
Lifetime |
| Returns
before taxes (lifetime: 11/28/23-12/31/25) |
35.06% |
18.69% |
| Returns
after taxes on distributions (lifetime: 11/28/23-12/31/25) |
34.22% |
18.19% |
| Returns
after taxes on distributions and sale of Fund shares (lifetime: 11/28/23-12/31/25) |
20.71% |
14.34% |
| MSCI
ACWI Index (Net) (lifetime: 11/28/23-12/31/25) |
22.34% |
21.84% |
| S&P
1500 Energy Sector Index (lifetime: 11/28/23-12/31/25) |
7.69% |
6.45% |
|
| Performance Table One Class of after Tax Shown [Text] |
Actual after-tax returns depend on the investor’s individual tax
situation and may differ from the returns shown.
|
| Performance Availability Website Address [Text] |
global.nomuraassetmanagement.com/investments/etf
|
| Performance Availability Phone [Text] |
844-469-9911
|
| Nomura Focused Large Growth ETF |
|
| Prospectus [Line Items] |
|
| Bar Chart and Performance Table [Heading] |
How has Nomura Focused Large Growth ETF performed?
|
| Performance Narrative [Text Block] |
The bar
chart and table below provide some indication of the risks of investing in the Fund by showing the Fund’s performance for
the 2025 calendar year and by showing how the Fund’s average annual total returns for the 1-year and lifetime periods compare with
those of a broad measure of market performance. The Fund’s past performance (before and after taxes) is not necessarily
an indication of how it will perform in the future. You may obtain the Fund’s most recently available month-end
performance by calling 844-469-9911
or by visiting the Fund’s website at global.nomuraassetmanagement.com/investments/etf.
The bar chart and table below provide some indication of the risks of investing in the Fund by showing the Fund’s performance for
the 2025 calendar year and by showing how the Fund’s average annual total returns for the 1-year and lifetime periods compare with
those of a broad measure of market performance. The Fund’s past performance (before and after taxes) is not necessarily an indication
of how it will perform in the future.
|
| Performance Past Does Not Indicate Future [Text] |
The Fund’s past performance (before and after taxes) is not necessarily an indication
of how it will perform in the future.
|
| Performance One Year or Less [Text] |
The performance information shown above is based on a calendar year.
The Fund’s performance from January 1, 2026 to June 30, 2026 was -7.03%.
|
| Performance Additional Market Index [Text] |
The bar chart and table below provide some indication of the risks of investing in the Fund by showing the Fund’s performance for
the 2025 calendar year and by showing how the Fund’s average annual total returns for the 1-year and lifetime periods compare with
those of a broad measure of market performance.
|
| Bar Chart [Heading] |
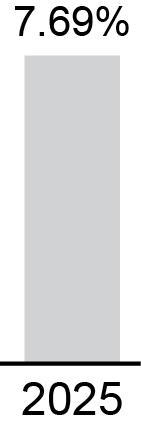
Calendar year-by-year total return
|
| Bar Chart [Table] |
| Year |
Percentage |
| 2025 |
7.69% |
|
| Bar Chart Closing [Text Block] |
During the period illustrated in this bar chart, the Fund’s
highest quarterly return was 9.64% for the quarter ended June 30, 2025, and its lowest quarterly return was -5.02% for the quarter ended
March 31, 2025.
|
| Highest Quarterly Return, Label [Optional Text] |
highest quarterly return
|
| Highest Quarterly Return |
9.64%
|
| Highest Quarterly Return, Date |
Jun. 30, 2025
|
| Lowest Quarterly Return, Label [Optional Text] |
lowest quarterly return
|
| Lowest Quarterly Return |
(5.02%)
|
| Lowest Quarterly Return, Date |
Mar. 31, 2025
|
| Performance Table Heading |
Average annual total returns for periods ended December 31, 2025
|
| Performance Table Narrative |
Actual after-tax returns depend on the investor’s individual
tax situation and may differ from the returns shown. After-tax returns are not relevant for shares held in tax-advantaged investment
vehicles such as employer-sponsored 401(k) plans and individual retirement accounts (IRAs). The after-tax returns shown are calculated
using the highest individual federal marginal income tax rates in effect during the periods presented and do not reflect the impact of
state and local taxes.
|
| Performance Table Uses Highest Federal Rate |
The after-tax returns shown are calculated
using the highest individual federal marginal income tax rates in effect during the periods presented and do not reflect the impact of
state and local taxes.
|
| Performance Table Not Relevant to Tax Deferred |
After-tax returns are not relevant for shares held in tax-advantaged investment
vehicles such as employer-sponsored 401(k) plans and individual retirement accounts (IRAs).
|
| Performance [Table] |
| |
1
year |
Lifetime |
| Returns
before taxes (lifetime: 5/14/24-12/31/25) |
7.69% |
11.04% |
| Returns
after taxes on distributions (lifetime: 5/14/24-12/31/25) |
7.62% |
10.98% |
| Returns
after taxes on distributions and sale of Fund shares (lifetime: 5/14/24-12/31/25) |
4.55% |
8.46% |
| Russell
1000® Growth Index (lifetime: 5/14/24-12/31/25) |
18.56% |
23.51% |
| Russell
1000® Index (lifetime: 5/14/24-12/31/25) |
17.37% |
18.91% |
|
| Performance Table One Class of after Tax Shown [Text] |
Actual after-tax returns depend on the investor’s individual
tax situation and may differ from the returns shown.
|
| Performance Availability Website Address [Text] |
global.nomuraassetmanagement.com/investments/etf
|
| Performance Availability Phone [Text] |
844-469-9911
|
| Nomura Focused SMID Cap Core ETF |
|
| Prospectus [Line Items] |
|
| Bar Chart and Performance Table [Heading] |
How has Nomura Focused SMID Cap Core ETF performed?
|
| Performance Narrative [Text Block] |
Because the Fund is new, it has no performance history. Once the Fund
has commenced operations, you can obtain updated performance information at global.nomuraassetmanagement.com/investments/etf
or by calling 844-469-9911. The Fund’s past performance (before and after taxes) is not necessarily an indication of how the Fund
will perform in the future.
global.nomuraassetmanagement.com/investments/etf
|
| Performance Past Does Not Indicate Future [Text] |
The Fund’s past performance (before and after taxes) is not necessarily an indication of how the Fund
will perform in the future.
|
| Performance One Year or Less [Text] |
Fund is new, it has no performance history.
|
| Performance Availability Website Address [Text] |
global.nomuraassetmanagement.com/investments/etf
|
| Performance Availability Phone [Text] |
844-469-9911
|
| Nomura Focused International Core ETF |
|
| Prospectus [Line Items] |
|
| Bar Chart and Performance Table [Heading] |
How has Nomura Focused International Core ETF performed?
|
| Performance Narrative [Text Block] |
The Fund does not have performance history for a full calendar year.
Once the Fund has completed a full calendar year of operations, a bar chart and table will be included that will provide some indication
of the risks of investing in the Fund by showing the variability of the Fund’s returns and comparing the Fund’s performance
to a broad measure of market
performance. Of course, the Fund’s past performance (before and after taxes) does not necessarily
indicate how the Fund will perform in the future.
Current performance information is available on the Fund’s website
at global.nomuraassetmanagement.com/investments/etf or by calling 844-469-9911.
global.nomuraassetmanagement.com/investments/etf
|
| Performance Past Does Not Indicate Future [Text] |
the Fund’s past performance (before and after taxes) does not necessarily
indicate how the Fund will perform in the future
|
| Performance One Year or Less [Text] |
The Fund does not have performance history for a full calendar year.
|
| Performance Availability Website Address [Text] |
global.nomuraassetmanagement.com/investments/etf
|
| Performance Availability Phone [Text] |
844-469-9911
|
| Nomura Focused Emerging Markets Equity ETF |
|
| Prospectus [Line Items] |
|
| Bar Chart and Performance Table [Heading] |
How has Nomura Focused Emerging Markets Equity ETF performed?
|
| Performance Narrative [Text Block] |
The bar chart and table below provide some indication of the
risks of investing in the Fund by showing the Fund’s performance for the 2025 calendar year and by showing how the Fund’s
average annual total returns for the 1-year and lifetime periods compare with those of a broad measure of market performance. The
Fund’s past performance (before and after taxes) is not necessarily an indication of how it will perform in
the future. You may obtain the Fund’s most recently available month-end performance by calling 844-469-9911 or by visiting
the Fund’s website at global.nomuraassetmanagement.com/investments/etf.The
bar chart and table below provide some indication of the risks of investing in the Fund by showing the Fund’s performance for
the 2025 calendar year and by showing how the Fund’s average annual total returns for the 1-year and lifetime periods compare with
those of a broad measure of market performance.
global.nomuraassetmanagement.com/investments/etf
The Fund’s past performance (before and after taxes) is not necessarily an indication of how it will perform in the future.
|
| Performance Past Does Not Indicate Future [Text] |
The Fund’s past performance (before and after taxes) is not necessarily an indication of how it will perform in the future.
|
| Performance One Year or Less [Text] |
The performance information shown above is based on a calendar year.
The Fund’s performance from January 1, 2026 to June 30, 2026 was 77.49%.
|
| Performance Additional Market Index [Text] |
The
bar chart and table below provide some indication of the risks of investing in the Fund by showing the Fund’s performance for
the 2025 calendar year and by showing how the Fund’s average annual total returns for the 1-year and lifetime periods compare with
those of a broad measure of market performance.
|
| Bar Chart [Heading] |
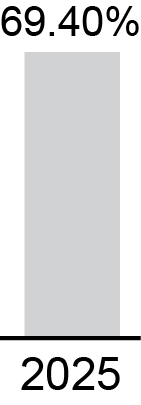
Calendar year-by-year total return
|
| Bar Chart [Table] |
| Year |
Percentage |
| 2025 |
69.40% |
|
| Bar Chart Closing [Text Block] |
During the period illustrated in this bar chart, the Fund’s
highest quarterly return was 21.58% for the quarter ended June 30, 2025, and its lowest quarterly return was 4.01% for the quarter ended
March 31, 2025.
|
| Highest Quarterly Return, Label [Optional Text] |
highest quarterly return
|
| Highest Quarterly Return |
21.58%
|
| Highest Quarterly Return, Date |
Jun. 30, 2025
|
| Lowest Quarterly Return, Label [Optional Text] |
lowest quarterly return
|
| Lowest Quarterly Return |
4.01%
|
| Lowest Quarterly Return, Date |
Mar. 31, 2025
|
| Performance Table Heading |
Average annual total returns for periods ended December 31, 2025
|
| Performance Table Narrative |
Actual after-tax returns depend on the investor’s individual
tax situation and may differ from the returns shown. After-tax returns are not relevant for shares held in tax-advantaged investment
vehicles such as employer-sponsored 401(k) plans and individual retirement accounts (IRAs). The after-tax returns shown are calculated
using the highest individual federal marginal income tax rates in effect during the periods presented and do not reflect the impact of
state and local taxes.
|
| Performance Table Uses Highest Federal Rate |
The after-tax returns shown are calculated
using the highest individual federal marginal income tax rates in effect during the periods presented and do not reflect the impact of
state and local taxes.
|
| Performance Table Not Relevant to Tax Deferred |
After-tax returns are not relevant for shares held in tax-advantaged investment
vehicles such as employer-sponsored 401(k) plans and individual retirement accounts (IRAs).
|
| Performance [Table] |
| |
1
year |
Lifetime |
| Returns
before taxes (lifetime: 9/4/24-12/31/25) |
69.40% |
47.41% |
| Returns
after taxes on distributions (lifetime: 9/4/24-12/31/25) |
67.49% |
45.87% |
| Returns
after taxes on distributions and sale of Fund shares (lifetime: 9/4/24-12/31/25) |
41.05% |
35.94% |
| MSCI
Emerging Markets Index (Net) (lifetime: 9/4/24-12/31/25) |
33.57% |
24.94% |
|
| Performance Table One Class of after Tax Shown [Text] |
Actual after-tax returns depend on the investor’s individual
tax situation and may differ from the returns shown.
|
| Performance Availability Website Address [Text] |
global.nomuraassetmanagement.com/investments/etf
|
| Performance Availability Phone [Text] |
844-469-9911
|
| Nomura National High-Yield Municipal Bond ETF |
|
| Prospectus [Line Items] |
|
| Bar Chart and Performance Table [Heading] |
How has Nomura National High-Yield Municipal Bond ETF performed?
|
| Performance Narrative [Text Block] |
The Fund does not have performance history for a full calendar year.
Once the Fund has completed a full calendar year of operations, a bar chart and table will be included that will provide some indication
of the risks of investing in the Fund by showing the variability of the Fund’s returns and comparing the Fund’s performance
to a broad measure of market performance. Of course, the Fund’s past performance (before and after taxes) does not necessarily
indicate how the Fund will perform in the future.
global.nomuraassetmanagement.com/investments/etf
Current performance information is available on the Fund’s website at
global.nomuraassetmanagement.com/investments/etf or by calling 844-469-9911.
|
| Performance Past Does Not Indicate Future [Text] |
the Fund’s past performance (before and after taxes) does not necessarily
indicate how the Fund will perform in the future.
|
| Performance Information Illustrates Variability of Returns [Text] |
Once the Fund has completed a full calendar year of operations, a bar chart and table will be included that will provide some indication
of the risks of investing in the Fund by showing the variability of the Fund’s returns and comparing the Fund’s performance
to a broad measure of market performance.
|
| Performance One Year or Less [Text] |
The Fund does not have performance history for a full calendar year.
|
| Performance Availability Website Address [Text] |
global.nomuraassetmanagement.com/investments/etf
|
| Performance Availability Phone [Text] |
844-469-9911
|
| Nomura Tax-Free USA Short Term ETF |
|
| Prospectus [Line Items] |
|
| Bar Chart and Performance Table [Heading] |
How has Nomura Tax-Free USA Short Term ETF performed?
|
| Performance Narrative [Text Block] |
The bar chart and table below provide some indication of the risks
of investing in the Fund by showing the Fund’s performance for the 2024 and 2025 calendar years and by showing how
the Fund’s average annual total returns for the 1-year and lifetime periods compare with those of a broad measure of market performance.
The Fund’s past performance (before and after taxes) is not necessarily an indication of how it will perform in the future. You
may obtain the Fund’s most recently available month-end performance by calling 844-469-9911 or by visiting the Fund’s website
at global.nomuraassetmanagement.com/investments/etf.
The bar chart and table below provide some indication of the risks of investing in the Fund by showing the Fund’s performance for
the 2024 and 2025 calendar years and by showing how the Fund’s average annual total returns for the 1-year and lifetime periods
compare with those of a broad measure of market performance.
global.nomuraassetmanagement.com/investments/etf
|
| Performance Past Does Not Indicate Future [Text] |
The Fund’s past performance (before and after taxes) is not necessarily an indication of how it will perform in the future.
|
| Performance One Year or Less [Text] |
The performance information shown above is based on a calendar year.
The Fund’s performance from January 1, 2026 to June 30, 2026 was 1.62%.
|
| Performance Additional Market Index [Text] |
The bar chart and table below provide some indication of the risks of investing in the Fund by showing the Fund’s performance for
the 2024 and 2025 calendar years and by showing how the Fund’s average annual total returns for the 1-year and lifetime periods
compare with those of a broad measure of market performance.
|
| Bar Chart [Heading] |
Calendar year-by-year total return
|
| Bar Chart [Table] |
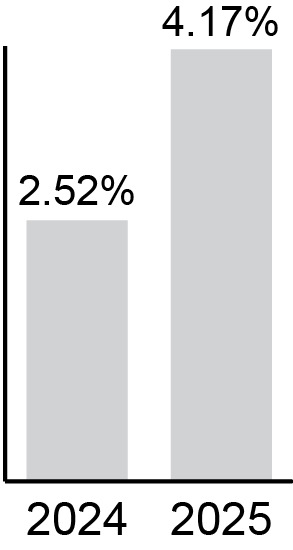
| Years |
Return |
| 2024 |
2.52% |
| 2025 |
4.17% |
|
| Bar Chart Closing [Text Block] |
During the period illustrated in this bar chart, the Fund’s highest
quarterly return was 2.31% for the quarter ended September 30, 2024, and its lowest quarterly return was -0.08% for the quarter ended
March 31, 2024.
|
| Highest Quarterly Return, Label [Optional Text] |
highest
quarterly return
|
| Highest Quarterly Return |
2.31%
|
| Highest Quarterly Return, Date |
Sep. 30, 2024
|
| Lowest Quarterly Return, Label [Optional Text] |
lowest quarterly return
|
| Lowest Quarterly Return |
(0.08%)
|
| Lowest Quarterly Return, Date |
Mar. 31, 2024
|
| Performance Table Heading |
Average annual total returns for periods ended December 31, 2025
|
| Performance Table Narrative |
Actual after-tax returns depend on the investor’s individual tax
situation and may differ from the returns shown. After-tax returns are not relevant for shares held in tax-advantaged investment vehicles
such as employer-sponsored 401(k) plans and individual retirement accounts (IRAs). The after-tax returns shown are calculated using the
highest individual federal marginal income tax rates in effect during the periods presented and do not reflect the impact of state and
local taxes.
|
| Performance Table Uses Highest Federal Rate |
The after-tax returns shown are calculated using the
highest individual federal marginal income tax rates in effect during the periods presented and do not reflect the impact of state and
local taxes.
|
| Performance Table Not Relevant to Tax Deferred |
After-tax returns are not relevant for shares held in tax-advantaged investment vehicles
such as employer-sponsored 401(k) plans and individual retirement accounts (IRAs).
|
| Performance [Table] |
| |
1 year |
Lifetime |
| Returns
before taxes (lifetime: 11/28/23-12/31/25) |
4.17% |
4.00% |
| Returns
after taxes on distributions (lifetime: 11/28/23-12/31/25) |
2.83% |
3.36% |
| Returns
after taxes on distributions and sale of Fund shares (lifetime: 11/28/23-12/31/25) |
2.46% |
3.18% |
| Bloomberg
Municipal Bond Index (lifetime: 11/28/23-12/31/25) |
4.25% |
4.13% |
| Bloomberg
1-5 Year (Short) Municipal Bond Index (lifetime: 11/28/23-12/31/25) |
4.11% |
3.60% |
|
| Performance Table One Class of after Tax Shown [Text] |
Actual after-tax returns depend on the investor’s individual tax
situation and may differ from the returns shown.
|
| Performance Availability Website Address [Text] |
global.nomuraassetmanagement.com/investments/etf
|
| Performance Availability Phone [Text] |
844-469-9911
|
| Nomura Tax-Free USA Intermediate ETF |
|
| Prospectus [Line Items] |
|
| Bar Chart and Performance Table [Heading] |
How has Nomura Tax-Free USA Intermediate ETF performed?
|
| Performance Narrative [Text Block] |
Because
the Fund
is new, it has no performance history. Once the Fund has commenced operations, you can obtain updated performance information
at global.nomuraassetmanagement.com/investments/etf
or by calling 844-469-9911. The
Fund’s past performance (before and after taxes) is not necessarily an indication of how the Fund will perform in the future. global.nomuraassetmanagement.com/investments/etf
|
| Performance Past Does Not Indicate Future [Text] |
The
Fund’s past performance (before and after taxes) is not necessarily an indication of how the Fund will perform in the future.
|
| Performance One Year or Less [Text] |
Fund
is new, it has no performance history.
|
| Performance Availability Website Address [Text] |
global.nomuraassetmanagement.com/investments/etf
|
| Performance Availability Phone [Text] |
844-469-9911
|
| Nomura Tax-Free USA ETF |
|
| Prospectus [Line Items] |
|
| Bar Chart and Performance Table [Heading] |
How has Nomura Tax-Free USA ETF performed?
|
| Performance Narrative [Text Block] |
The Fund does not have performance history for a full calendar year.
Once the Fund has completed a full calendar year of operations, a bar chart and table will be included that will provide some indication
of the risks of investing in the Fund by showing the variability of the Fund’s returns and comparing the Fund’s performance
to a broad measure of market performance. Of course, the Fund’s past performance (before and after taxes) does not necessarily
indicate how the Fund will perform in the future.
Current performance information is available on the Fund’s
website at global.nomuraassetmanagement.com/investments/etf or by calling 844-469-9911.
|
| Performance Past Does Not Indicate Future [Text] |
the Fund’s past performance (before and after taxes) does not necessarily
indicate how the Fund will perform in the future.
|
| Performance Information Illustrates Variability of Returns [Text] |
Once the Fund has completed a full calendar year of operations, a bar chart and table will be included that will provide some indication
of the risks of investing in the Fund by showing the variability of the Fund’s returns and comparing the Fund’s performance
to a broad measure of market performance.
|
| Performance One Year or Less [Text] |
The Fund does not have performance history for a full calendar year.
|
| Performance Availability Website Address [Text] |
global.nomuraassetmanagement.com/investments/etf
|
| Performance Availability Phone [Text] |
844-469-9911
|
| Nomura Transformational Technologies ETF |
|
| Prospectus [Line Items] |
|
| Bar Chart and Performance Table [Heading] |
How has the Nomura Transformational Technologies ETF performed?
|
| Performance Narrative [Text Block] |
The following information provides some indication of the risks
of investing in the Fund.
The Fund commenced investment operations on January 12, 2026, after
the conversion of a separately managed account (the “Predecessor Account”) into shares of the Fund. The Predecessor Account
commenced operations on 11/30/2018. The Manager was the investment adviser for the Predecessor Account for the entire performance period
shown. The Predecessor Account will transfer all its portfolio securities to the Fund.
The bar chart and the performance table below are for the Predecessor
Account prior to the commencement of the Fund’s operations. The Fund’s objectives, policies, guidelines and restrictions
are, in all material respects, equivalent to those of the Predecessor Account. The Predecessor Account has been managed in substantially
the same way as the Manager will manage the Fund. The returns for the Predecessor Account reflect its performance prior to the conversion
into the Fund. In addition, the Predecessor Account’s performance shown below has been recalculated using the management fee that
applies to the Fund, which has the effect of reducing the Predecessor Account’s performance. The Predecessor Account was not registered
under the Investment Company Act of 1940, as amended (the “1940 Act”) and therefore was not subject to certain restrictions
imposed by the 1940 Act on registered investment companies and by the Internal Revenue Code of 1986, as amended (the “Code”)
on regulated investment companies (“RICs”). If the Predecessor Account had been registered under the 1940 Act, the Predecessor
Account’s performance may have been adversely affected. Past performance before and after taxes does not necessarily indicate how
the Fund will perform in the future.
The performance of the Predecessor Account was calculated using
standardized SEC calculation methodologies.
This bar chart shows the performance of the Predecessor Account
for calendar years ended December 31. The table shows how the Predecessor Account’s average annual returns for 1-year, 5-year and
since inception periods compare with those of a broad measure of market performance. Updated performance information will be available
by calling 844-469-9911 or by visiting the Fund’s website at global.nomuraassetmanagement.com/investments/etf.
|
| Performance Past Does Not Indicate Future [Text] |
Past performance before and after taxes does not necessarily indicate how
the Fund will perform in the future.
|
| Performance One Year or Less [Text] |
The Fund’s
performance from January 12, 2026 (commencement of Fund operations) to June 30, 2026 was 34.80%.
|
| Performance Additional Market Index [Text] |
The table shows how the Predecessor Account’s average annual returns for 1-year, 5-year and
since inception periods compare with those of a broad measure of market performance.
|
| Bar Chart [Heading] |
Calendar year-by-year total return
|
| Bar Chart [Table] |
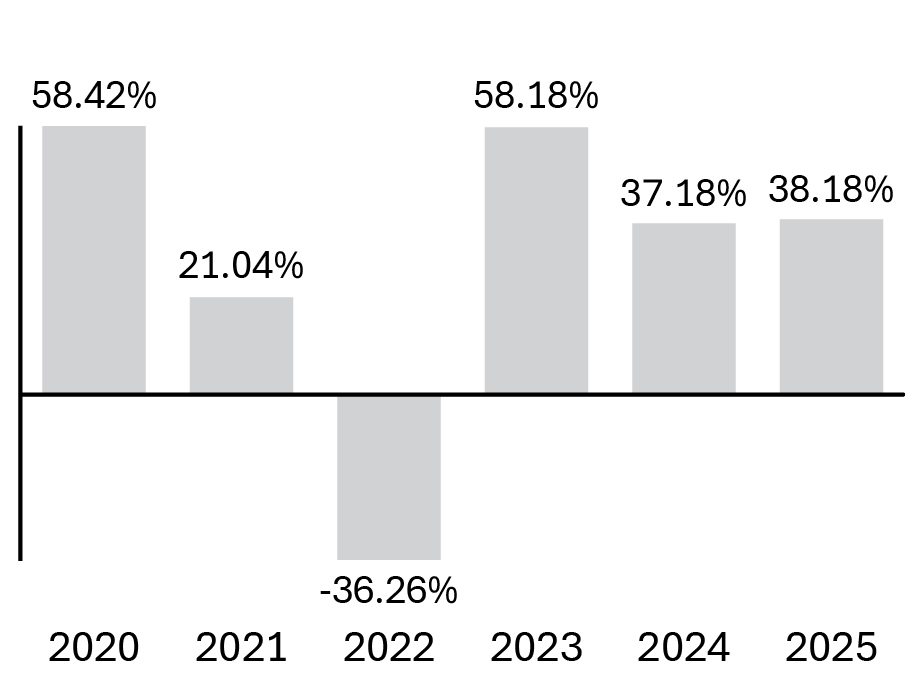
| Year |
Return |
| 2020 |
58.42% |
| 2021 |
21.04% |
| 2022 |
-36.26% |
| 2023 |
58.18% |
| 2024 |
37.18% |
| 2025 |
38.18% |
|
| Bar Chart Closing [Text Block] |
During the period illustrated in this bar chart, the Predecessor
Account’s highest quarterly return was 34.66% for the quarter ended 6/30/20, and its lowest quarterly return was (26.19)%
for the quarter ended 6/30/22.
|
| Highest Quarterly Return, Label [Optional Text] |
highest quarterly return
|
| Highest Quarterly Return |
34.66%
|
| Highest Quarterly Return, Date |
Jun. 30, 2020
|
| Lowest Quarterly Return, Label [Optional Text] |
lowest quarterly return
|
| Lowest Quarterly Return |
(26.19%)
|
| Lowest Quarterly Return, Date |
Jun. 30, 2022
|
| Performance Table Heading |
Average annual total returns for periods ended December 31, 2025
|
| Performance Table Narrative |
This table shows the Predecessor Account’s average annual
total returns for the periods ending December 31, 2025. The table also shows how the Predecessor Account’s performance compares
with the returns on an index comprised of companies similar to those held by the Predecessor Account and by the Fund. The Fund will use
the same benchmark for measuring its performance.
|
| Performance [Table] |
| |
1
year |
5
years |
Lifetime
(11/30/2018–12/31/2025) |
| Returns
before taxes |
38.18% |
18.26% |
25.35% |
| Returns
after taxes on distributions |
-N/A |
-N/A |
-N/A |
| Returns
after taxes on distributions and sale of Fund shares |
-N/A |
-N/A |
-N/A |
MSCI
ACWI (All Country World Index) (net)
(reflects no deduction for fees, expenses or taxes) |
22.34% |
11.19% |
12.64% |
MSCI
World Information Technology Index (net)
(reflects no deduction for fees, expenses or taxes) |
23.50% |
17.71% |
23.27% |
|
| Index No Deduction for Fees, Expenses, or Taxes [Text] |
reflects no deduction for fees, expenses or taxes
|
| Performance Table Closing [Text Block] |
After-tax returns cannot be calculated for periods before the Fund’s
registration as an exchange-traded fund and they are, therefore, unavailable.
|
| Performance Availability Website Address [Text] |
global.nomuraassetmanagement.com/investments/etf
|
| Performance Availability Phone [Text] |
844-469-9911
|
| Nomura Focused Mid Cap Growth ETF |
|
| Prospectus [Line Items] |
|
| Bar Chart and Performance Table [Heading] |
How has Nomura Focused Mid Cap Growth ETF performed?
|
| Performance Narrative [Text Block] |
Because the Fund is new, it has no performance history. Once the
Fund has commenced operations, you can obtain updated performance information at global.nomuraassetmanagement.com/investments/etf or
by calling 844-469-9911. The Fund’s past performance (before and after taxes) is not necessarily an indication of how the Fund
will perform in the future.
|
| Performance Past Does Not Indicate Future [Text] |
The Fund’s past performance (before and after taxes) is not necessarily an indication of how the Fund
will perform in the future.
|
| Performance One Year or Less [Text] |
Fund is new, it has no performance history.
|
| Performance Availability Website Address [Text] |
global.nomuraassetmanagement.com/investments/etf
|
| Performance Availability Phone [Text] |
844-469-9911
|