Long-term capital appreciation.
The following table describes the fees and expenses that you will incur if you buy, hold and sell shares of the Fund. You may pay other fees, such as brokerage commissions and other fees to financial intermediaries, which are not reflected in the fee table or example below.
|
Management Fees1 |
0.80 |
% |
|||||
|
Distribution and/or Service (12b-1) Fees |
None |
||||||
|
Other Expenses1,2 |
0.00 |
% |
|||||
|
Total Annual Fund Operating Expenses |
0.80 |
% |
|||||
1 The investment advisory agreement between SEI Exchange Traded Funds (the Trust) and SEI Investments Management Corporation (SIMC), the Fund's adviser (the Investment Advisory Agreement) provides that SIMC will pay all operating expenses of the Fund, except the management fees, interest expenses, dividend and other expenses on securities sold short, taxes, expenses incurred with respect to the acquisition and disposition of portfolio securities and the execution of portfolio transactions (including brokerage commissions), acquired fund fees and expenses, fees and expenses of the Board of Trustees, litigation expenses and any extraordinary expenses.
2 Effective March 31, 2026, the Fund's fiscal year end changed from September 30 to March 31. Therefore, "Other Expenses" shown are annualized for the period from October 1, 2025 through March 31, 2026 and have been rounded to 0.00%.
This Example is intended to help you compare the cost of owning shares of the Fund with the cost of investing in other funds. The Example assumes that you invest $10,000 in the Fund for the time periods indicated and then sell or hold all of your shares at the end of those periods. The Example also assumes that your investment has a 5% return each year and that the Fund's operating expenses remain the same.
| 1 Year |
$ |
82 |
|||||
| 3 Years |
$ |
255 |
|||||
| 5 Years |
$ |
444 |
|||||
| 10 Years |
$ |
990 |
|||||
| 1 Year |
$ |
82 |
|||||
| 3 Years |
$ |
255 |
|||||
| 5 Years |
$ |
444 |
|||||
| 10 Years |
$ |
990 |
|||||
The Fund may pay transaction costs, such as commissions, when it buys and sells securities (or "turns over" its portfolio). A higher portfolio turnover rate may indicate higher transaction costs and may result in higher taxes when Fund shares are held in a taxable account. These costs, which are not reflected in the Annual Fund Operating Expenses or in the Example, affect the Fund's performance.
During the fiscal period from October 1, 2025 through March 31, 2026, the unannualized portfolio turnover rate of the Fund was 0% of the average value of its portfolio.
Under normal circumstances, the Fund will take long and short positions in investments that provide broad exposure to the global equity, fixed income and currency markets. The Fund will invest primarily in exchange-traded derivative instruments, including futures, options, and swaps, but to a lesser extent may invest in derivative instruments that are traded over-the-counter, such as forwards. The Fund primarily will hold cash and/or invest in money market instruments to collateralize its derivative positions. Additionally, the Fund will invest from time-to-time in shares of exchange-traded funds (ETFs), such as U.S. or non-U.S. corporate bond ETFs.
The Fund seeks to achieve returns similar to the total return (before taking into account the Fund's fees and expenses) of a model portfolio of alternative investment strategies, which primarily consists of hedge funds (the "Composite") calculated by the investment sub-adviser (the "Sub-Adviser"), at the direction of SEI Investments Management Corporation ("SIMC" or the "Adviser").
The Composite consists of two components (each a "sleeve"): a multi-strategy sleeve and a managed futures sleeve, each discussed below.
Multi-Strategy Sleeve. The multi-strategy sleeve consists of the average total return of the 50 largest hedge funds (excluding managed futures funds), equally weighted. The list of hedge funds is determined by the monthly reporting of assets under management to the Eurekahedge database, which is reconstituted annually. This sleeve will include exposure to a cross-section of alternative investment strategies, including, but not limited to, equity long/short, global macro, event driven, and relative value strategies. SIMC, in connection with its management of the overall strategy to achieve returns similar to the total return of the Composite and thus the return of the overall hedge fund market, may instruct the Sub-Adviser at any time to discontinue the use of any of these strategies or add one or more new strategies.
Managed Futures Sleeve. The managed futures sleeve is designed to reflect the total return of a selected pool of the largest commodity trading advisor fund managers, which are managers that use futures or forward contracts to achieve their investment objectives.
The Sub-Adviser generally expects to maintain an approximate 60/40 weighting between the multi-strategy sleeve and the managed futures sleeve, respectively, within the Composite, but the Adviser and/or Sub-Adviser may change the two sleeves' weighting in the Composite and therefore the Fund.
The Fund seeks to achieve returns similar to the total return of the Composite through a dynamic allocation of long and short investments among the global equity, fixed income and currency markets. The Sub-Adviser will use a quantitative model to estimate the market exposures that drive the aggregate returns of the Composite and will primarily invest in derivative instruments that it estimates will provide, in the aggregate, market exposure similar to that of the Composite. The Sub-Adviser may use various approaches to estimate market exposure, including an analysis of historical return information for the hedge funds within the Composite.
The Fund's investments will include futures, forwards, options, ETFs and securities index swaps that provide exposure to the returns of (i) the equity markets, including common stocks, preferred stocks, warrants, rights, depositary receipts, and real estate investment trusts (REITs), which may be from U.S. and non-U.S. issuers (including emerging market issuers) of various capitalizations and industries; (ii) the currency markets, through U.S. and non-U.S. issuers (including emerging markets issuers) or through exposure to currency futures; and
(iii) the fixed income markets, through U.S. and non-U.S. issuers (including emerging markets issuers) or through exposure to corporate and government fixed income securities, asset-backed securities, mortgage-backed securities (including commercial mortgage-backed securities and "to-be-announced" transactions), corporate bonds and debentures, commercial paper, money market instruments, money market funds, mortgage dollar rolls, obligations of supranational entities, zero coupon obligations and obligations to restructure outstanding debt of such issuers, which may be investment grade and non-investment grade debt (junk bonds), of any duration or maturity.
The Fund will not make any direct investments in hedge funds.
The amount of the Fund's assets that may be allocated to various strategies and among investments is expected to vary over time and may be adjusted over short periods of time.
There are no limitations on the minimum or maximum amount of the Fund's assets that may be allocated to investments representing exposure to any one of the global equity, fixed income and currency markets.
The Sub-Adviser may also consider other factors when allocating the Fund's assets, such as: (i) the Fund's obligations under its various derivative positions; (ii) portfolio rebalancing; (iii) redemption requests; (iv) yield management; (v) credit management; and (vi) volatility management.
The Fund uses a multi-manager approach, relying primarily on one or more Sub-Advisers under the general supervision of SIMC, the Fund's adviser.
The bar chart and the performance table below provide some indication of the risks of investing in the Fund by showing the Fund's performance from year to year and by showing how the Fund's average annual returns for 1 year and since the Fund's inception compare with those of a broad measure of market performance. The Fund's past performance (before and after taxes) is not necessarily an indication of how the Fund will perform in the future. For current performance information, please call 1-800-DIAL-SEI.
Prior to commencing operations, the Fund acquired the assets and liabilities of the Predecessor Fund (the "Reorganization") on August 25, 2025. As a result of the Reorganization, the Fund assumed the performance and accounting history of the Predecessor Fund prior to the date of the Reorganization. Accordingly, the performance shown for periods prior to the Reorganization represents the performance of the Predecessor Fund's Class F Shares. The Predecessor Fund's returns in the bar chart and table have not been adjusted to reflect the Fund's expenses. In anticipation of the reorganization, the Predecessor Fund Class F shares implemented a contractual fee waiver on August 3, 2025 that limited Class F's total annual fund operating expenses to an amount equal to the Fund's expected total annual fund operating expenses. The Fund's returns would have only differed from the returns of the Predecessor Fund's Class F Shares to the extent that, prior to the implementation of the contractual fee waiver, the total annual fund operating expenses of the Class F Shares were higher than the Fund's current total annual fund operating expenses.
|
|
Best Quarter: 6.47% (03/31/2024) Worst Quarter: -3.55% (03/31/2025) The Fund's total return (pre-tax) from January 1, 2026 to June 30, 2026 was 7.19%. |
||||||
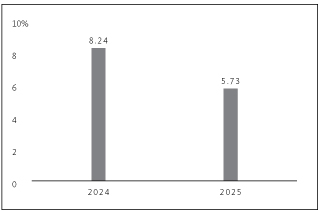
Best Quarter: 6.47% (03/31/2024)
Worst Quarter: -3.55% (03/31/2025)
The Fund's total return (pre-tax) from January 1, 2026 to June 30, 2026 was 7.19%.
This table compares the Fund's average annual total returns for the period ended December 31, 2025 to those of a broad-based securities market index and an additional index with characteristics relevant to the Fund's investment strategy.
After-tax returns are calculated using the historical highest individual federal marginal income tax rates and do not reflect the impact of state and local taxes. Your actual after-tax returns will depend on your tax situation and may differ from those shown. After-tax returns shown are not relevant to investors who hold their Fund shares through tax-deferred arrangements, such as 401(k) plans or individual retirement accounts.
|
SEI DBi Multi-Strategy Alternative ETF* |
1 Year |
Since Inception (6/30/2023) |
|||||||||
|
Return Before Taxes |
5.73 |
% |
6.20 |
% |
|||||||
|
Return After Taxes on Distributions |
3.84 |
% |
4.19 |
% |
|||||||
|
Return After Taxes on Distributions and Sale of Fund Shares |
3.64 |
% |
4.03 |
% |
|||||||
|
Bloomberg U.S. Aggregate Bond Index Return (reflects no deduction for fees, expenses or taxes) |
7.30 |
% |
4.74 |
% |
|||||||
|
ICE BofA U.S. 3-Month Treasury Bill Index (reflects no deduction for fees, expenses or taxes) |
4.18 |
% |
4.85 |
% |
|||||||
* The performance shown for periods prior to the Reorganization represents the performance of the Predecessor Fund's Class F Shares. In anticipation of the reorganization, the Predecessor Fund Class F shares implemented a contractual fee waiver on August 3, 2025 that limited Class F's total annual fund operating expenses to an amount equal to the Fund's expected total annual fund operating expenses. The Fund's returns would have only differed from the returns of the Predecessor Fund's Class F Shares to the extent that, prior to the implementation of the contractual fee waiver, the total annual fund operating expenses of the Class F Shares were higher than the Fund's current total annual fund operating expenses.
Although performance is benchmarked against the return of the ICE BofA U.S. 3-Month Treasury Bill Index, an investment in the Fund is substantially different from an investment in U.S. Treasury bills. Among other things, Treasury bills are backed by the full faith and credit of the U.S. Government and have a fixed rate of return. Investors in Treasury bills do not risk losing their investment, whereas loss of money is a risk of investing in the Fund. Further, an investment in the Fund is expected to be substantially more volatile than an investment in Treasury bills because of the breadth and types of securities and other instruments in which the Fund may invest.