Performance Management
|
Jul. 29, 2026 |
| KraneShares 90% KWEB Defined Outcome January 2027 ETF |
|
| Prospectus [Line Items] |
|
| Bar Chart and Performance Table [Heading] |
Performance Information
|
| Performance Narrative [Text Block] |
The following bar chart and table illustrate the variability of the Fund’s returns and indicate the risks of investing in the Fund by showing how the Fund’s average annual total returns compare with those of a broad measure of market performance and an additional index with characteristics relevant to the Fund. All returns include the reinvestment of dividends and distributions. As always, please note that the Fund’s past performance (before and after taxes) is not necessarily an indication of how it will perform in the future. Updated performance information is available at no cost by visiting www.kraneshares.com.
|
| Performance Past Does Not Indicate Future [Text] |
As always, please note that the Fund’s past performance (before and after taxes) is not necessarily an indication of how it will perform in the future.
|
| Performance Information Illustrates Variability of Returns [Text] |
The following bar chart and table illustrate the variability of the Fund’s returns and indicate the risks of investing in the Fund by showing how the Fund’s average annual total returns compare with those of a broad measure of market performance and an additional index with characteristics relevant to the Fund.
|
| Bar Chart [Heading] |
Total Annual Returns For Calendar Years Ended December 31
|
| Bar Chart [Table] |
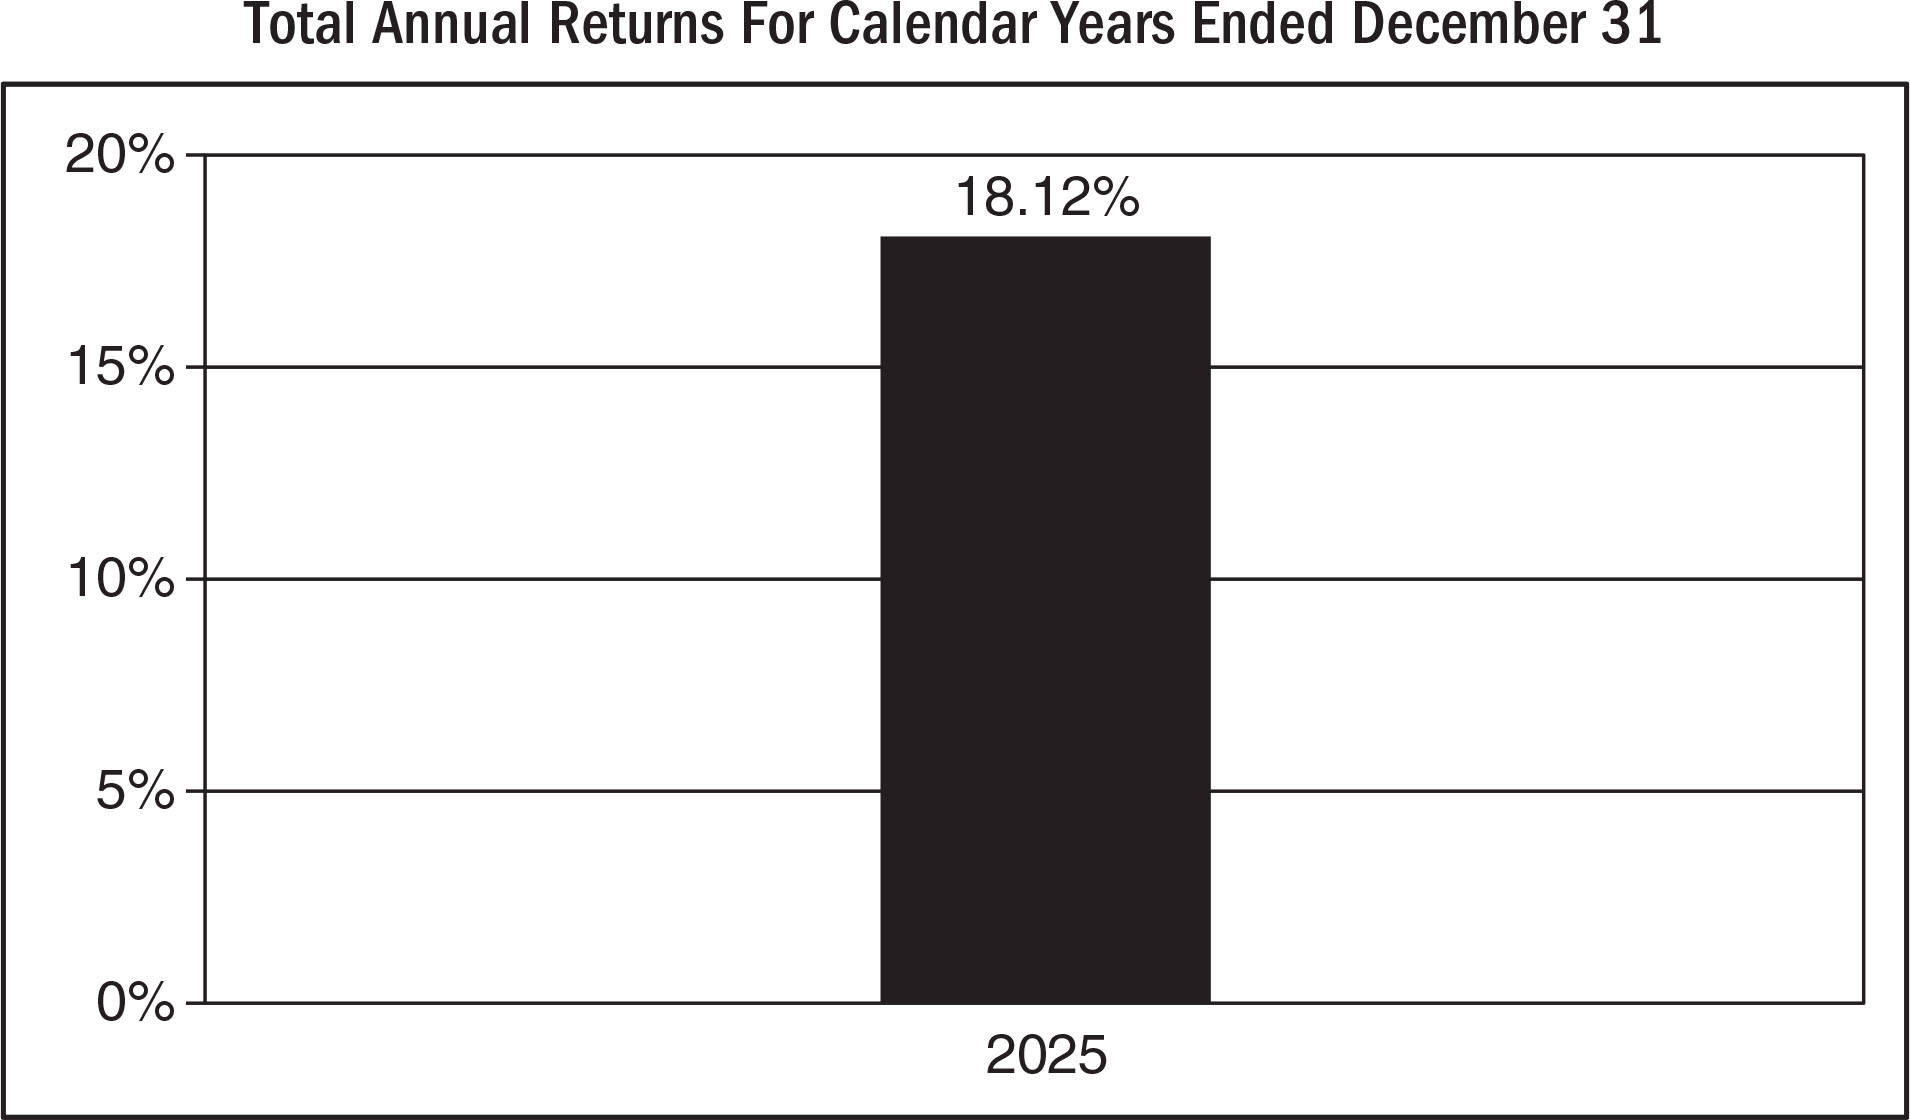
| Years |
Returns |
| 2025 |
18.12% |
|
| Bar Chart Closing [Text Block] |
As of June 30, 2026, the Fund’s calendar year-to-date total return was -14.95%.
Best and Worst Quarter Returns (for the period reflected in the bar chart above)
| |
Return |
Quarter Ended/Year |
| Highest Return |
12.10% |
09/30/2025 |
| Lowest Return |
-5.12% |
12/31/2025 |
|
| Year to Date Return, Label [Optional Text] |
year-to-date total return
|
| Bar Chart, Year to Date Return |
(14.95%)
|
| Bar Chart, Year to Date Return, Date |
Jun. 30, 2026
|
| Highest Quarterly Return, Label [Optional Text] |
Highest Return
|
| Highest Quarterly Return |
12.10%
|
| Highest Quarterly Return, Date |
Sep. 30, 2025
|
| Lowest Quarterly Return, Label [Optional Text] |
Lowest Return
|
| Lowest Quarterly Return |
(5.12%)
|
| Lowest Quarterly Return, Date |
Dec. 31, 2025
|
| Performance Table Heading |
Average Annual Total Returns for the periods ended December 31, 2025
|
| Performance Table Uses Highest Federal Rate |
After-tax returns for the Fund are calculated using the historical highest individual federal marginal income tax rates and do not reflect the impact of state and local taxes.
|
| Performance Table Not Relevant to Tax Deferred |
Actual after-tax returns depend on an investor’s tax situation and may differ from those shown. After-tax returns shown are not relevant to investors who hold shares through tax-deferred arrangements, such as 401(k) plans or individual retirement plans.
|
| Performance [Table] |
| KraneShares 90% KWEB Defined Outcome January 2027 ETF |
1 year |
Since Inception
(2-7-2024) |
| Return Before Taxes |
18.12% |
17.50% |
| Return After Taxes on Distributions |
14.75% |
14.87% |
| Return After Taxes on Distributions and Sale of Fund Shares |
10.73% |
12.39% |
MSCI China All Shares Index
(Reflects no deduction for fees, expenses or taxes) |
28.94% |
27.67% |
CSI Overseas China Internet Index
(Reflects no deduction for fees, expenses or taxes) |
23.29% |
24.47% |
MSCI China All Shares Index (Reflects no
deduction for fees, expenses or taxes)
CSI Overseas China Internet Index (Reflects no
deduction for fees, expenses or taxes)
|
| Performance Table Closing [Text Block] |
Average annual total returns are shown on a before- and after-tax basis for the Fund. After-tax returns for the Fund are calculated using the historical highest individual federal marginal income tax rates and do not reflect the impact of state and local taxes. Actual after-tax returns depend on an investor’s tax situation and may differ from those shown. After-tax returns shown are not relevant to investors who hold shares through tax-deferred arrangements, such as 401(k) plans or individual retirement plans.
|
| Performance Availability Website Address [Text] |
www.kraneshares.com
|
| KraneShares 100% KWEB Defined Outcome January 2027 ETF |
|
| Prospectus [Line Items] |
|
| Bar Chart and Performance Table [Heading] |
Performance Information
|
| Performance Narrative [Text Block] |
The following bar chart and table illustrate the variability of the Fund’s returns and indicate the risks of investing in the Fund by showing how the Fund’s average annual total returns compare with those of a broad measure of market performance and an additional index with characteristics relevant to the Fund. All returns include the reinvestment of dividends and distributions. As always, please note that the Fund’s past performance (before and after taxes) is not necessarily an indication of how it will perform in the future. Updated performance information is available at no cost by visiting www.kraneshares.com.
|
| Performance Past Does Not Indicate Future [Text] |
As always, please note that the Fund’s past performance (before and after taxes) is not necessarily an indication of how it will perform in the future.
|
| Performance Information Illustrates Variability of Returns [Text] |
The following bar chart and table illustrate the variability of the Fund’s returns and indicate the risks of investing in the Fund by showing how the Fund’s average annual total returns compare with those of a broad measure of market performance and an additional index with characteristics relevant to the Fund.
|
| Bar Chart [Heading] |
Total Annual Returns For Calendar Years Ended December 31
|
| Bar Chart [Table] |
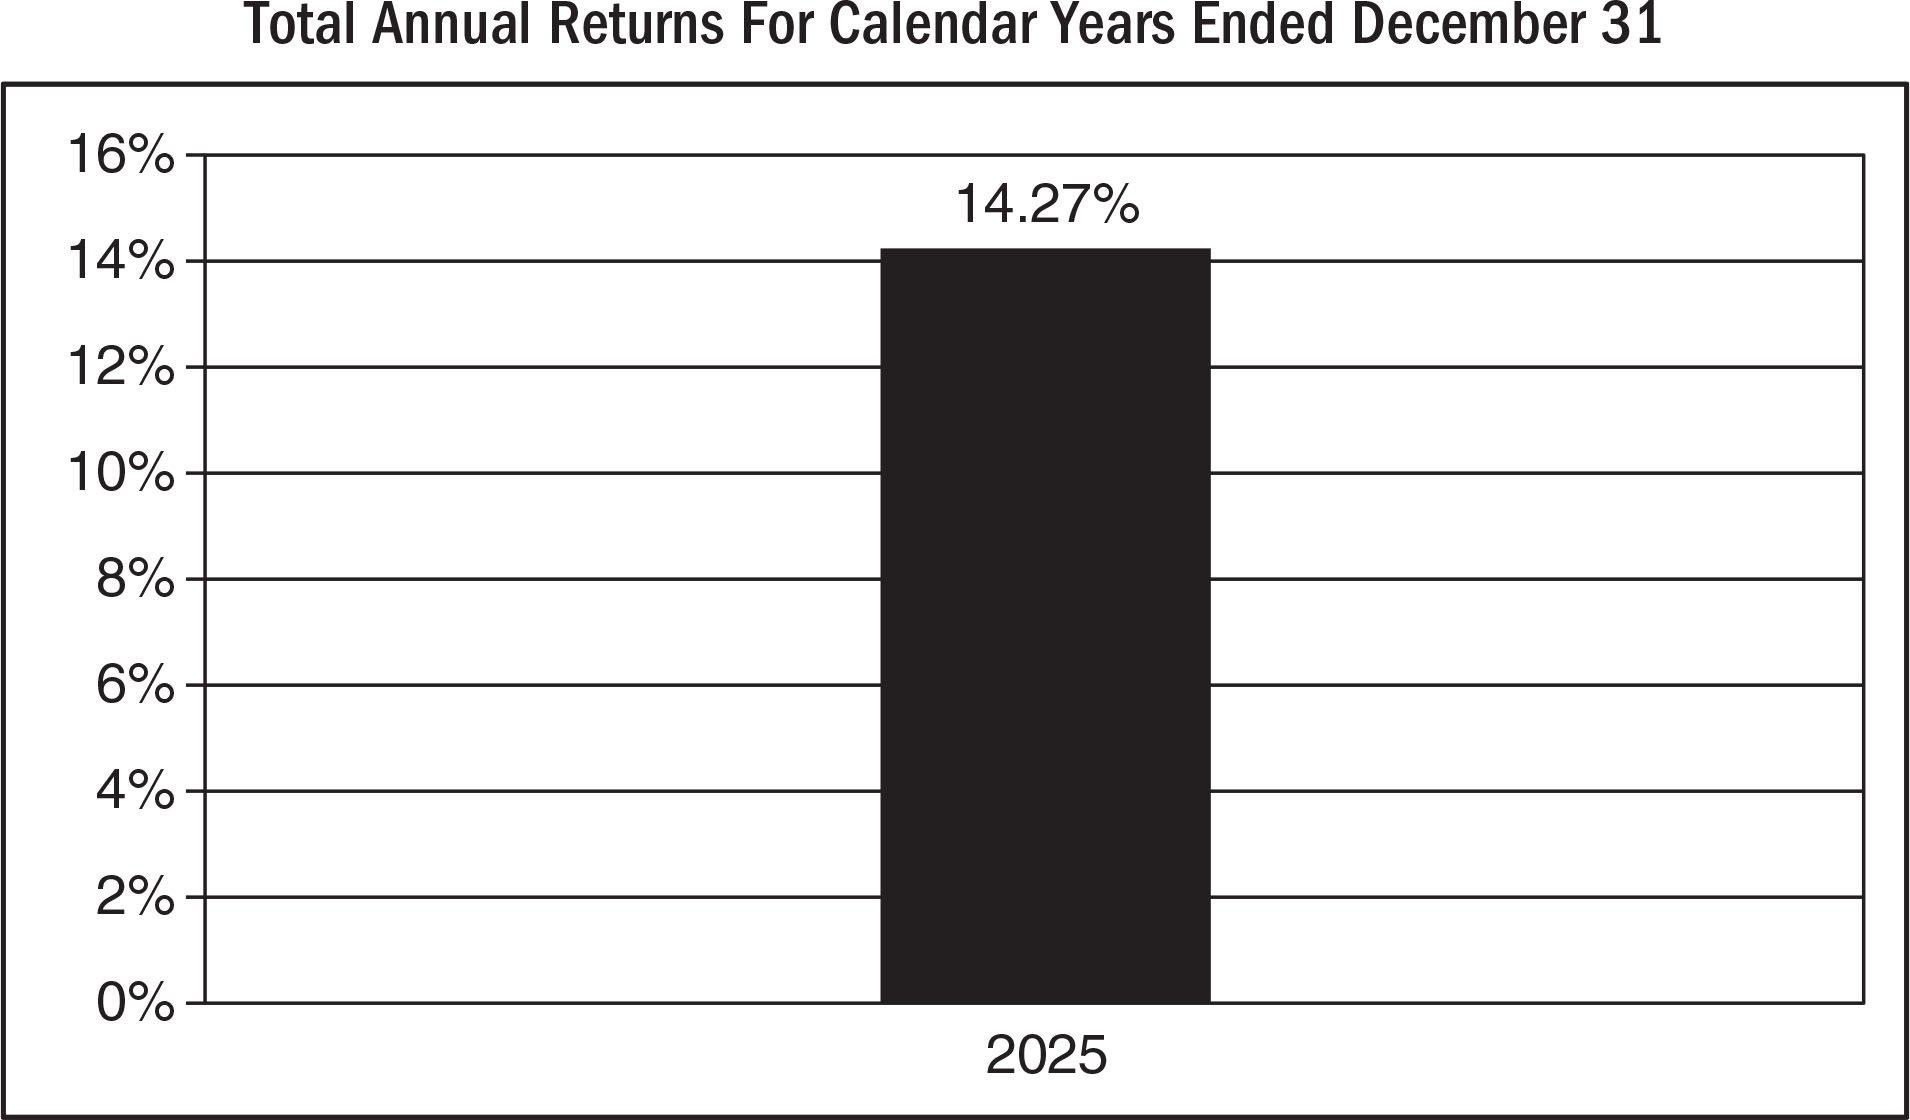
| Years |
Returns |
| 2025 |
14.27% |
|
| Bar Chart Closing [Text Block] |
As of June 30, 2026, the Fund’s calendar year-to-date total return was -5.69%.
Best and Worst Quarter Returns (for the period reflected in the bar chart above)
| |
Return |
Quarter Ended/Year |
| Highest Return |
8.60% |
09/30/2025 |
| Lowest Return |
-1.33% |
12/31/2025 |
|
| Year to Date Return, Label [Optional Text] |
year-to-date total return
|
| Bar Chart, Year to Date Return |
(5.69%)
|
| Bar Chart, Year to Date Return, Date |
Jun. 30, 2026
|
| Highest Quarterly Return, Label [Optional Text] |
Highest Return
|
| Highest Quarterly Return |
8.60%
|
| Highest Quarterly Return, Date |
Sep. 30, 2025
|
| Lowest Quarterly Return, Label [Optional Text] |
Lowest Return
|
| Lowest Quarterly Return |
(1.33%)
|
| Lowest Quarterly Return, Date |
Dec. 31, 2025
|
| Performance Table Heading |
Average Annual Total Returns for the periods ended December 31, 2025
|
| Performance Table Uses Highest Federal Rate |
After-tax returns for the Fund are calculated using the historical highest individual federal marginal income tax rates and do not reflect the impact of state and local taxes.
|
| Performance Table Not Relevant to Tax Deferred |
Actual after-tax returns depend on an investor’s tax situation and may differ from those shown. After-tax returns shown are not relevant to investors who hold shares through tax-deferred arrangements, such as 401(k) plans or individual retirement plans.
|
| Performance [Table] |
| KraneShares 100% KWEB Defined Outcome January 2027 ETF |
1 year |
Since Inception
(2-7-2024) |
| Return Before Taxes |
14.27% |
13.51% |
| Return After Taxes on Distributions |
10.39% |
10.60% |
| Return After Taxes on Distributions and Sale of Fund Shares |
8.45% |
9.16% |
MSCI China All Shares Index
(Reflects no deduction for fees, expenses or taxes) |
28.94% |
27.67% |
CSI Overseas China Internet Index
(Reflects no deduction for fees, expenses or taxes) |
23.29% |
24.47% |
MSCI China All Shares Index (Reflects
no deduction for fees, expenses or taxes)
CSI Overseas China Internet Index (Reflects
no deduction for fees, expenses or taxes)
|
| Performance Table Closing [Text Block] |
Average annual total returns are shown on a before- and after-tax basis for the Fund. After-tax returns for the Fund are calculated using the historical highest individual federal marginal income tax rates and do not reflect the impact of state and local taxes. Actual after-tax returns depend on an investor’s tax situation and may differ from those shown. After-tax returns shown are not relevant to investors who hold shares through tax-deferred arrangements, such as 401(k) plans or individual retirement plans.
|
| Performance Availability Website Address [Text] |
www.kraneshares.com
|
| KraneShares Asia Pacific High Income USD Bond ETF |
|
| Prospectus [Line Items] |
|
| Bar Chart and Performance Table [Heading] |
Performance Information
|
| Performance Narrative [Text Block] |
The following bar chart and table illustrate the variability of the Fund’s returns and indicate the risks of investing in the Fund by showing how the Fund’s average annual total returns compare with those of a broad measure of market performance and an additional index with characteristics relevant to the Fund. All returns include the reinvestment of dividends and distributions. As always, please note that the Fund’s past performance (before and after taxes) is not necessarily an indication of how it will perform in the future. Updated performance information is available at no cost by visiting www.kraneshares.com. In addition, prior to August 1, 2021, CCB Securities Ltd. was responsible for day-to-day portfolio management of the Fund and the Fund previously sought to track the performance of the Solactive USD China Corporate High Yield Bond Index, before fees and expenses. Its performance prior to that date would have been different if the current goal and principal investment strategies had been in effect.
|
| Performance Past Does Not Indicate Future [Text] |
As always, please note that the Fund’s past performance (before and after taxes) is not necessarily an indication of how it will perform in the future.
|
| Performance Information Illustrates Variability of Returns [Text] |
The following bar chart and table illustrate the variability of the Fund’s returns and indicate the risks of investing in the Fund by showing how the Fund’s average annual total returns compare with those of a broad measure of market performance and an additional index with characteristics relevant to the Fund.
|
| Bar Chart [Heading] |
Total Annual Returns For Calendar Years Ended December 31
|
| Bar Chart [Table] |
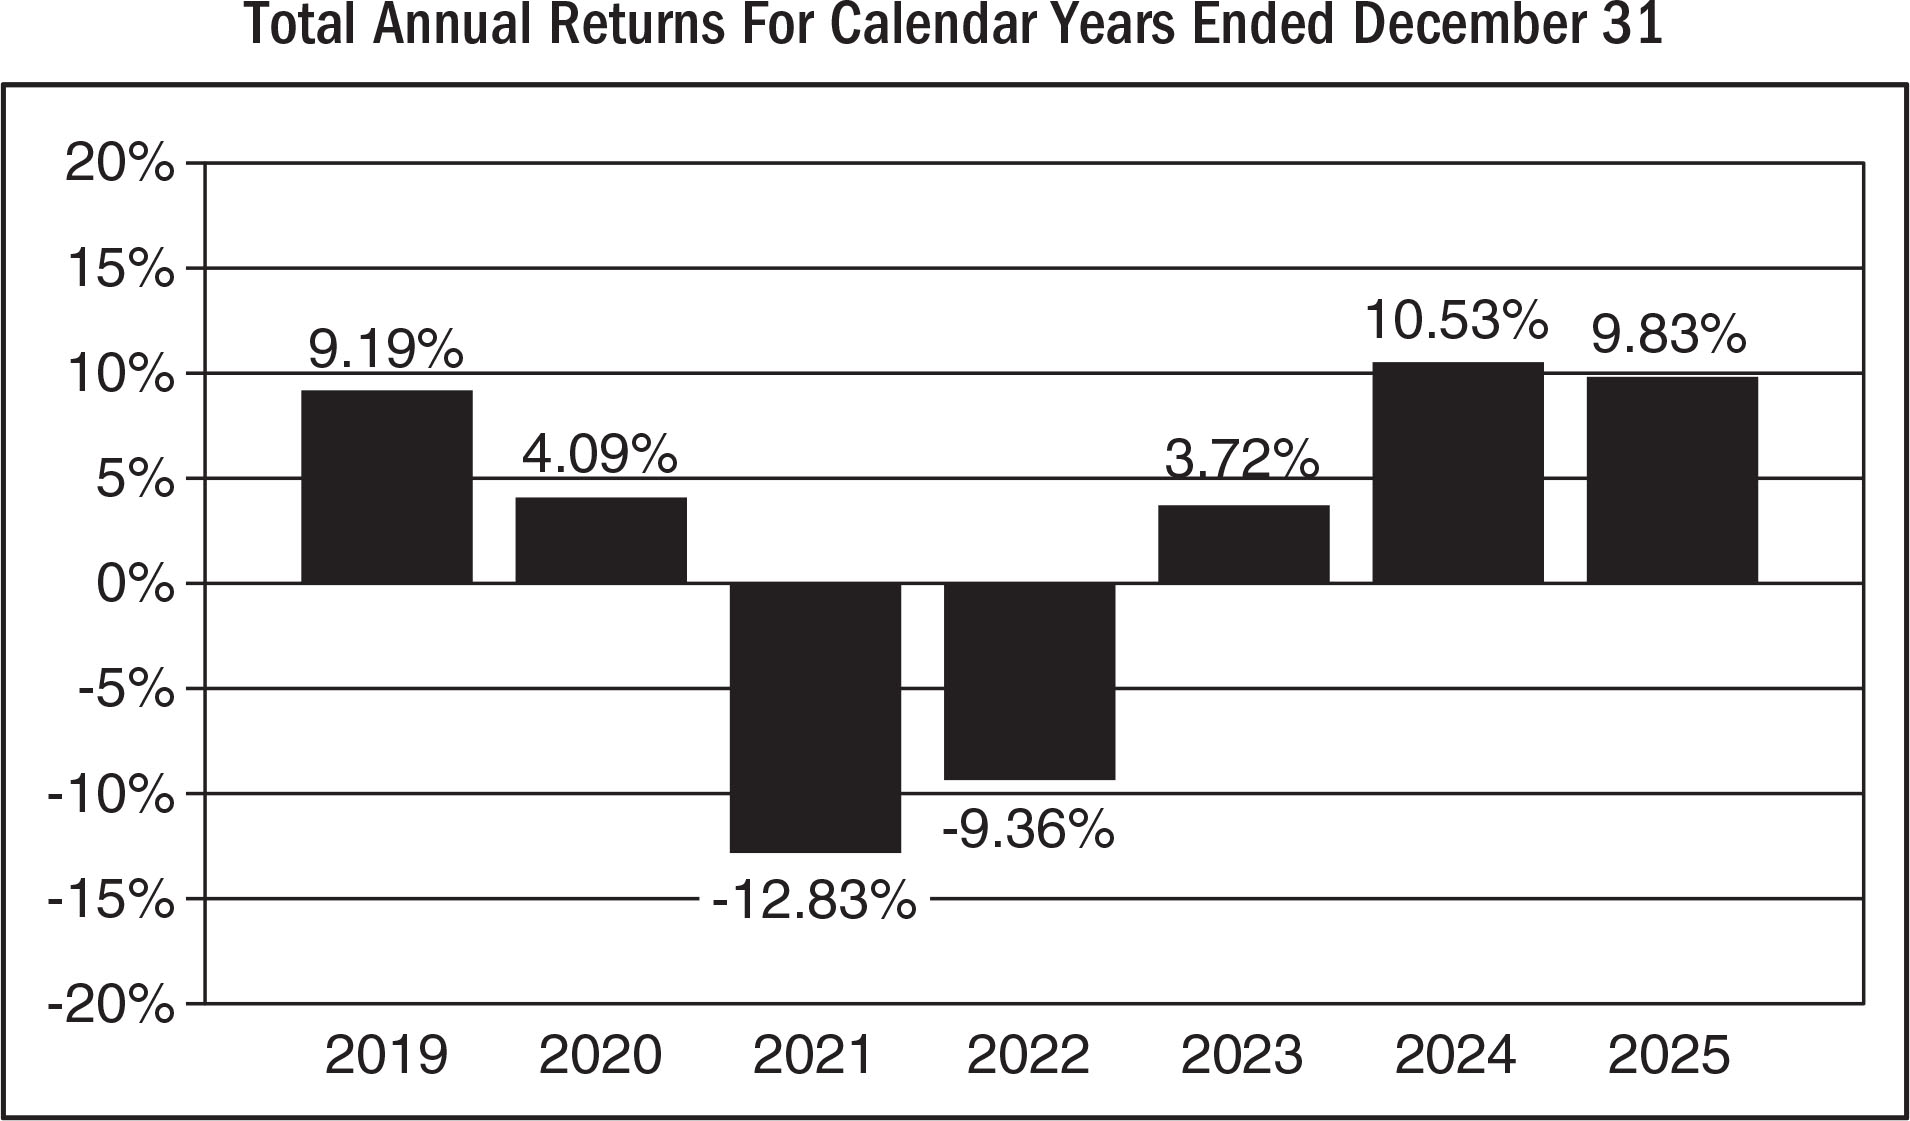
| Years |
Returns |
| 2019 |
9.19% |
| 2020 |
4.09% |
| 2021 |
-12.83% |
| 2022 |
-9.36% |
| 2023 |
3.72% |
| 2024 |
10.53% |
| 2025 |
9.83% |
|
| Bar Chart Closing [Text Block] |
As of June 30, 2026, the Fund’s calendar year-to-date total return was 2.77%.
Best and Worst Quarter Returns (for the period reflected in the bar chart above)
| |
Return |
Quarter Ended/Year |
| Highest Return |
8.71% |
12/31/2022 |
| Lowest Return |
-9.59% |
12/31/2021 |
|
| Year to Date Return, Label [Optional Text] |
year-to-date total return
|
| Bar Chart, Year to Date Return |
2.77%
|
| Bar Chart, Year to Date Return, Date |
Jun. 30, 2026
|
| Highest Quarterly Return, Label [Optional Text] |
Highest Return
|
| Highest Quarterly Return |
8.71%
|
| Highest Quarterly Return, Date |
Dec. 31, 2022
|
| Lowest Quarterly Return, Label [Optional Text] |
Lowest Return
|
| Lowest Quarterly Return |
(9.59%)
|
| Lowest Quarterly Return, Date |
Dec. 31, 2021
|
| Performance Table Heading |
Average Annual Total Returns for the periods ended December 31, 2025
|
| Performance Table Uses Highest Federal Rate |
After-tax returns for the Fund are calculated using the historical highest individual federal marginal income tax rates and do not reflect the impact of state and local taxes.
|
| Performance Table Not Relevant to Tax Deferred |
Actual after-tax returns depend on an investor’s tax situation and may differ from those shown. After-tax returns shown are not relevant to investors who hold shares through tax-deferred arrangements, such as 401(k) plans or individual retirement plans.
|
| Performance [Table] |
| KraneShares Asia Pacific High Income USD Bond ETF |
1 year |
5 years |
Since Inception
(6-26-2018) |
| Return Before Taxes |
9.83% |
-0.10% |
1.70% |
| Return After Taxes on Distributions |
6.45% |
-3.81% |
-1.57% |
| Return After Taxes on Distributions and Sale of Fund Shares |
5.72% |
-1.73% |
-0.13% |
JP Morgan Asia Credit Index (JACI) Diversified
(Reflects no deduction for fees, expenses or taxes) |
8.22% |
1.23% |
3.33% |
JP Morgan Asia Credit Index (JACI) Non-Investment Grade Corporate Index
(Reflects no deduction for fees, expenses or taxes) |
9.43% |
-1.33% |
1.66% |
JP Morgan Asia Credit Index (JACI) Diversified (Reflects no deduction for fees, expenses or taxes)
JP Morgan Asia Credit Index (JACI) Non-Investment Grade Corporate Index (Reflects no deduction for fees, expenses or taxes)
|
| Performance Table Closing [Text Block] |
Average annual total returns are shown on a before- and after-tax basis for the Fund. After-tax returns for the Fund are calculated using the historical highest individual federal marginal income tax rates and do not reflect the impact of state and local taxes. Actual after-tax returns depend on an investor’s tax situation and may differ from those shown. After-tax returns shown are not relevant to investors who hold shares through tax-deferred arrangements, such as 401(k) plans or individual retirement plans.
|
| Performance Availability Website Address [Text] |
www.kraneshares.com
|
| KraneShares Bosera MSCI China A 50 Connect Index ETF |
|
| Prospectus [Line Items] |
|
| Bar Chart and Performance Table [Heading] |
Performance Information
|
| Performance Narrative [Text Block] |
The following bar chart and table illustrate the variability of the Fund’s returns and indicate the risks of investing in the Fund by showing how the Fund’s average annual total returns compare with those of a broad measure of market performance and an additional index with characteristics relevant to the Fund. All returns include the reinvestment of dividends and distributions. As always, please note that the Fund’s past performance (before and after taxes) is not necessarily an indication of how it will perform in the future. In addition, the Fund previously changed the indexes whose performance it sought to track, before fees and expenses, as detailed in the footnote to the Average Annual Total Returns table. Updated performance information is available at no cost by visiting www.kraneshares.com.
|
| Performance Past Does Not Indicate Future [Text] |
As always, please note that the Fund’s past performance (before and after taxes) is not necessarily an indication of how it will perform in the future.
|
| Performance Information Illustrates Variability of Returns [Text] |
The following bar chart and table illustrate the variability of the Fund’s returns and indicate the risks of investing in the Fund by showing how the Fund’s average annual total returns compare with those of a broad measure of market performance and an additional index with characteristics relevant to the Fund.
|
| Bar Chart [Heading] |
Total Annual Returns For Calendar Years Ended December 31
|
| Bar Chart [Table] |
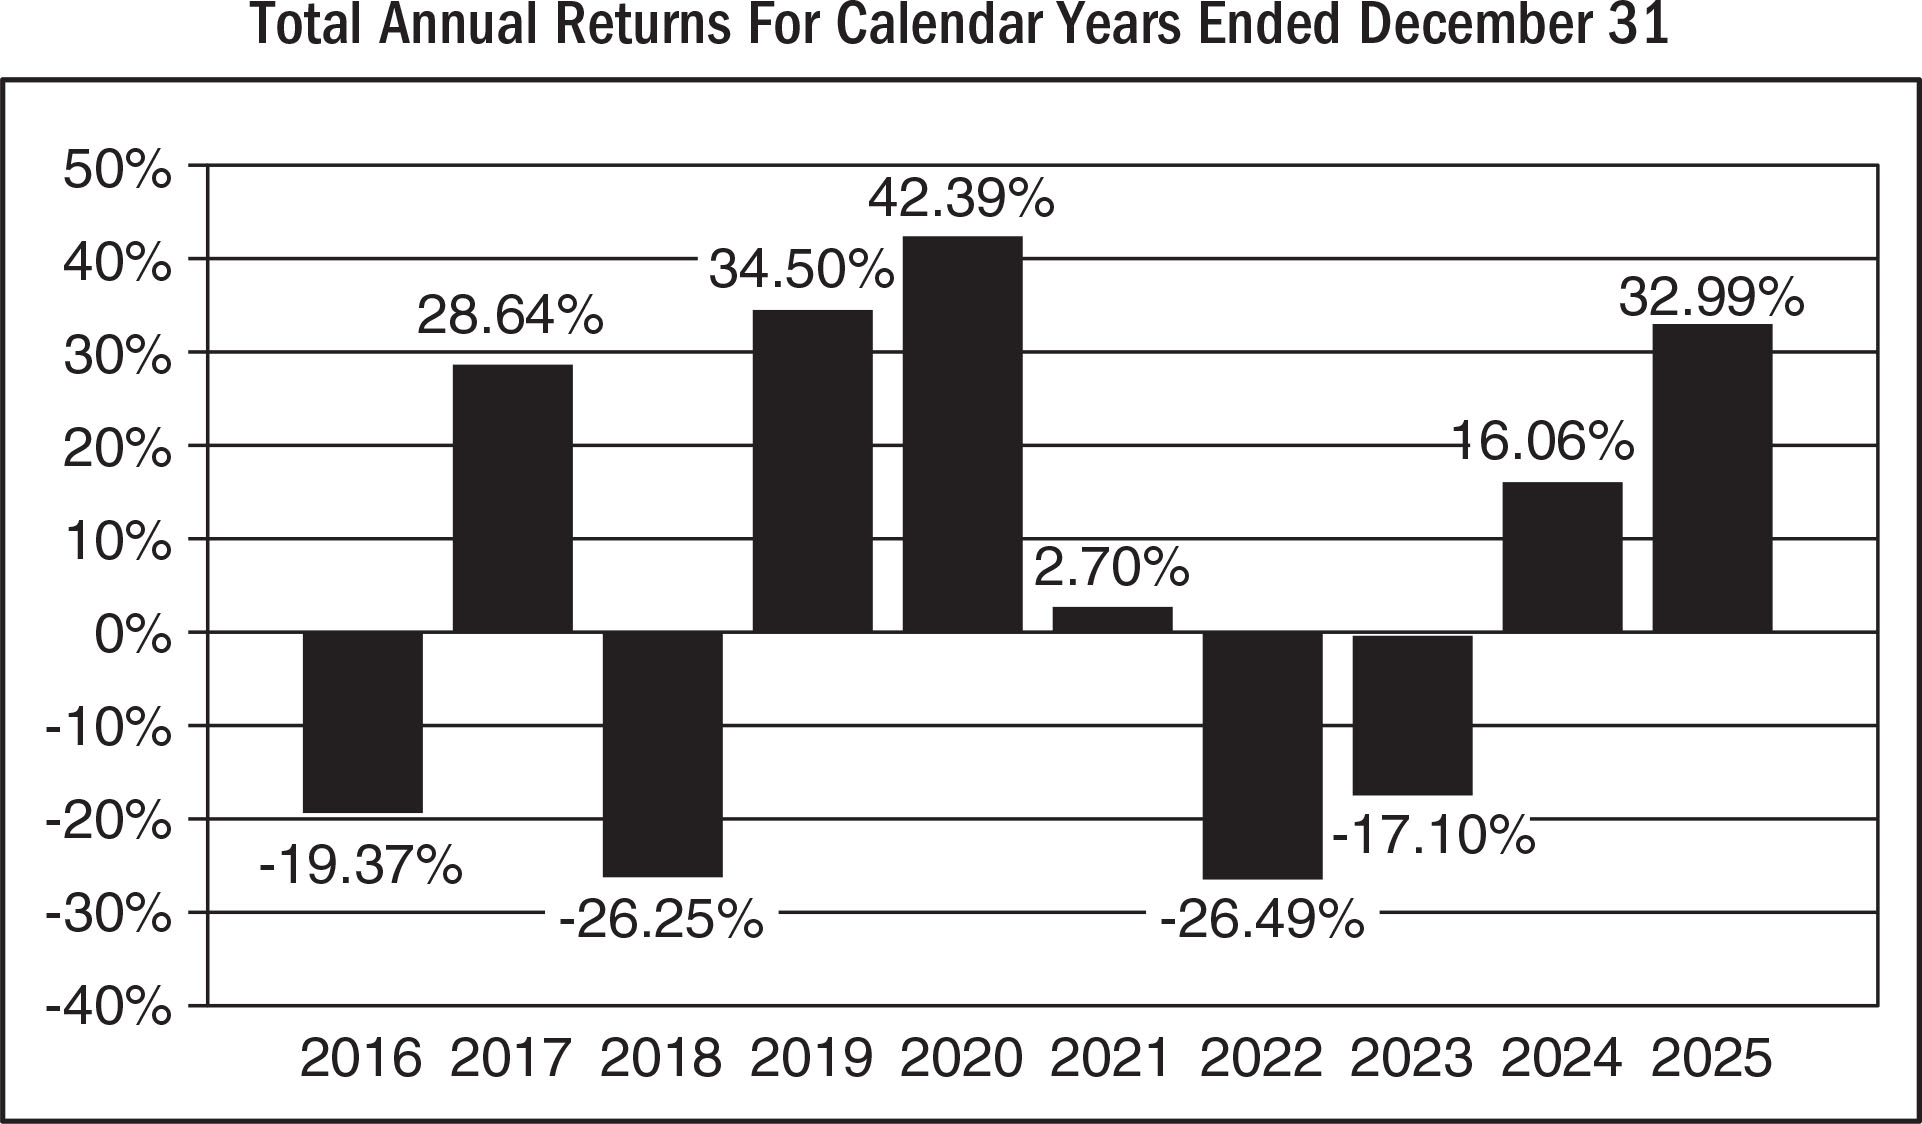
| Years |
Returns |
| 2016 |
-19.37% |
| 2017 |
28.64% |
| 2018 |
-26.25% |
| 2019 |
34.50% |
| 2020 |
42.39% |
| 2021 |
2.70% |
| 2022 |
-26.49% |
| 2023 |
-17.10% |
| 2024 |
16.06% |
| 2025 |
32.99% |
|
| Bar Chart Closing [Text Block] |
As of June 30, 2026, the Fund’s calendar year-to-date total return was 11.37%.
Best and Worst Quarter Returns (for the period reflected in the bar chart above)
| |
Return |
Quarter Ended/Year |
| Highest Return |
29.70% |
3/31/2019 |
| Lowest Return |
-20.28% |
9/30/2022 |
|
| Year to Date Return, Label [Optional Text] |
year-to-date total return
|
| Bar Chart, Year to Date Return |
11.37%
|
| Bar Chart, Year to Date Return, Date |
Jun. 30, 2026
|
| Highest Quarterly Return, Label [Optional Text] |
Highest Return
|
| Highest Quarterly Return |
29.70%
|
| Highest Quarterly Return, Date |
Mar. 31, 2019
|
| Lowest Quarterly Return, Label [Optional Text] |
Lowest Return
|
| Lowest Quarterly Return |
(20.28%)
|
| Lowest Quarterly Return, Date |
Sep. 30, 2022
|
| Performance Table Heading |
Average Annual Total Returns for the periods ended December 31, 2025
|
| Performance Table Uses Highest Federal Rate |
After-tax returns for the Fund are calculated using the historical highest individual federal marginal income tax rates and do not reflect the impact of state and local taxes.
|
| Performance Table Not Relevant to Tax Deferred |
Actual after-tax returns depend on an investor’s tax situation and may differ from those shown. After-tax returns shown are not relevant to investors who hold shares through tax-deferred arrangements, such as 401(k) plans or individual retirement plans.
|
| Performance [Table] |
| KraneShares Bosera MSCI China A 50 Connect Index ETF |
1 year |
5 years |
10 years |
| Return Before Taxes |
32.99% |
-0.69% |
3.54% |
| Return After Taxes on Distributions |
32.77% |
-2.05% |
2.59% |
| Return After Taxes on Distributions and Sale of Fund Shares |
20.14% |
-0.47% |
2.76% |
MSCI China All Shares Index
(Reflects no deduction for fees, expenses or taxes) |
28.94% |
-2.45% |
4.14% |
Custom Blended KBA Index (Net)
(Reflects reinvested dividends net of withholding taxes, but reflects no deduction for fees, expenses or other taxes)* |
35.10% |
0.23% |
3.82% |
MSCI China All Shares Index (Reflects no deduction for fees, expenses or taxes)
Custom Blended KBA Index (Net) (Reflects reinvested dividends net of withholding taxes, but reflects no deduction for fees, expenses or other taxes)
|
* |
The Custom Blended KBA Index consists of the MSCI China A Index from the inception of the Fund through October 23, 2014, the MSCI China A International Index from October 23, 2014 through December 26, 2017, the MSCI China A Inclusion Index from December 26, 2017 through May 29, 2019, the MSCI China A Index from May 29, 2019 through January 5, 2022, and the MSCI China A 50 Connect Index after January 4, 2022. As described in the prior sentence, the Fund sought investment results that, before fees and expenses, corresponded to the price and yield performance of the various indices for the various time periods noted. |
|
| Performance Table Closing [Text Block] |
Average annual total returns are shown on a before- and after-tax basis for the Fund. After-tax returns for the Fund are calculated using the historical highest individual federal marginal income tax rates and do not reflect the impact of state and local taxes. Actual after-tax returns depend on an investor’s tax situation and may differ from those shown. After-tax returns shown are not relevant to investors who hold shares through tax-deferred arrangements, such as 401(k) plans or individual retirement plans.
|
| Performance Availability Website Address [Text] |
www.kraneshares.com
|
| KraneShares California Carbon Allowance Strategy ETF |
|
| Prospectus [Line Items] |
|
| Bar Chart and Performance Table [Heading] |
Performance Information
|
| Performance Narrative [Text Block] |
The following bar chart and table illustrate the variability of the Fund’s returns and indicate the risks of investing in the Fund by showing how the Fund’s average annual total returns compare with those of a broad measure of market performance and an additional index with characteristics relevant to the Fund. All returns include the reinvestment of dividends and distributions. As always, please note that the Fund’s past performance (before and after taxes) is not necessarily an indication of how it will perform in the future. Updated performance information is available at no cost by visiting www.kraneshares.com. In addition, prior to November 3, 2025, the Fund previously sought to track the performance of the S&P Carbon Credit CCA Total Return Index, before fees and expenses.
|
| Performance Past Does Not Indicate Future [Text] |
As always, please note that the Fund’s past performance (before and after taxes) is not necessarily an indication of how it will perform in the future.
|
| Performance Information Illustrates Variability of Returns [Text] |
The following bar chart and table illustrate the variability of the Fund’s returns and indicate the risks of investing in the Fund by showing how the Fund’s average annual total returns compare with those of a broad measure of market performance and an additional index with characteristics relevant to the Fund.
|
| Bar Chart [Heading] |
Total Annual Returns For Calender Years Ended December 31
|
| Bar Chart [Table] |
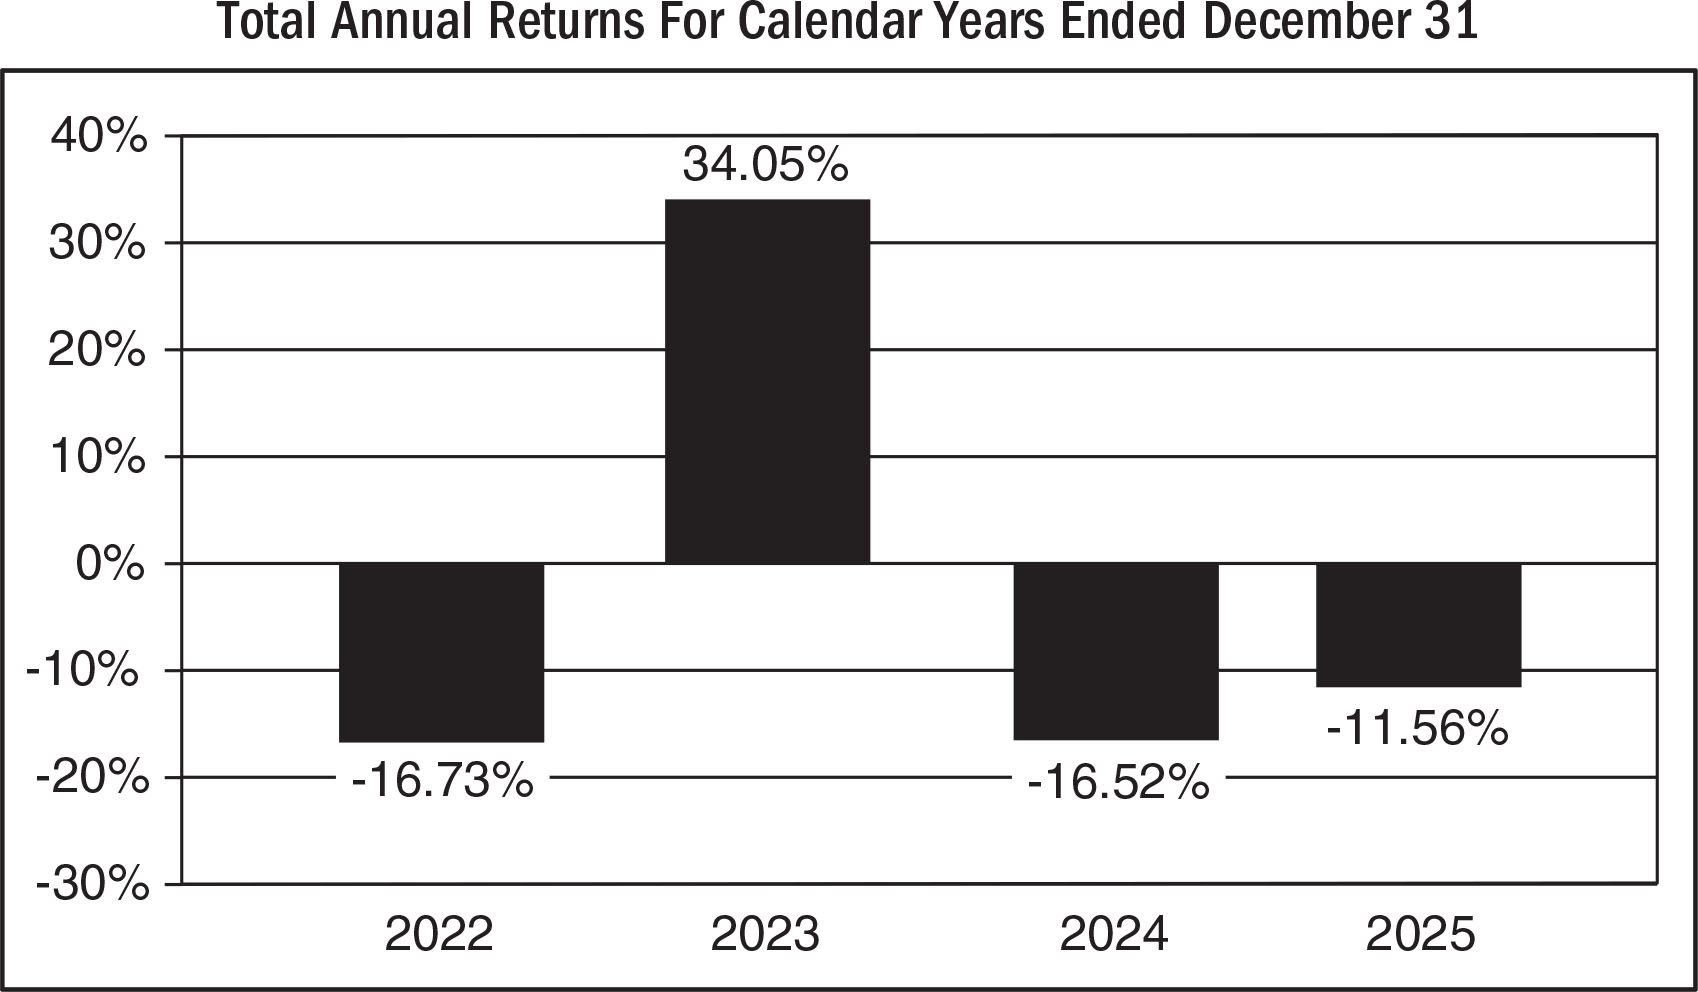
| Years |
Returns |
| 2022 |
-16.73% |
| 2023 |
34.05% |
| 2024 |
16.52% |
| 2025 |
-11.56% |
|
| Bar Chart Closing [Text Block] |
As of June 30, 2026, the Fund’s calendar year-to-date total return was 1.31%.
Best and Worst Quarter Returns (for the period reflected in the bar chart above)
| |
Return |
Quarter Ended/Year |
| Highest Return |
12.22% |
9/30/2023 |
| Lowest Return |
-14.53% |
9/30/2022 |
|
| Year to Date Return, Label [Optional Text] |
year-to-date total return
|
| Bar Chart, Year to Date Return |
1.31%
|
| Bar Chart, Year to Date Return, Date |
Jun. 30, 2026
|
| Highest Quarterly Return, Label [Optional Text] |
Highest Return
|
| Highest Quarterly Return |
12.22%
|
| Highest Quarterly Return, Date |
Sep. 30, 2023
|
| Lowest Quarterly Return, Label [Optional Text] |
Lowest Return
|
| Lowest Quarterly Return |
(14.53%)
|
| Lowest Quarterly Return, Date |
Sep. 30, 2022
|
| Performance Table Heading |
Average Annual Total Returns for the periods ended December 31, 2025
|
| Performance Table Uses Highest Federal Rate |
After-tax returns for the Fund are calculated using the historical highest individual federal marginal income tax rates and do not reflect the impact of state and local taxes.
|
| Performance Table Not Relevant to Tax Deferred |
Actual after-tax returns depend on an investor’s tax situation and may differ from those shown. After-tax returns shown are not relevant to investors who hold shares through tax-deferred arrangements, such as 401(k) plans or individual retirement plans.
|
| Performance [Table] |
| KraneShares California Carbon Allowance Strategy ETF |
1 year |
Since Inception
(10-4-2021) |
| Return Before Taxes |
-11.56% |
-1.93% |
| Return After Taxes on Distributions |
-12.58% |
-4.73% |
| Return After Taxes on Distributions and Sale of Fund Shares |
-6.85% |
-2.39% |
S&P 500 Index
(Reflects no deduction for fees, expenses or taxes) |
17.88% |
13.24% |
S&P Carbon Credit CCA Index
(Reflects no deduction for fees, expenses or taxes) |
-10.75% |
-0.62% |
S&P 500 Index (Reflects no deduction for fees, expenses or taxes)
S&P Carbon Credit CCA Index (Reflects no deduction for fees, expenses or taxes)
|
| Performance Table Closing [Text Block] |
Average annual total returns are shown on a before- and after-tax basis for the Fund. After-tax returns for the Fund are calculated using the historical highest individual federal marginal income tax rates and do not reflect the impact of state and local taxes. Actual after-tax returns depend on an investor’s tax situation and may differ from those shown. After-tax returns shown are not relevant to investors who hold shares through tax-deferred arrangements, such as 401(k) plans or individual retirement plans.
|
| Performance Availability Website Address [Text] |
www.kraneshares.com
|
| KraneShares China Alpha Index ETF |
|
| Prospectus [Line Items] |
|
| Bar Chart and Performance Table [Heading] |
Performance Information
|
| Performance Narrative [Text Block] |
The following bar chart and table illustrate the variability of the Fund’s returns and indicate the risks of investing in the Fund by showing how the Fund’s average annual total returns compare with those of a broad measure of market performance and an additional index with characteristics relevant to the Fund. All returns include the reinvestment of dividends and distributions. As always, please note that the Fund’s past performance (before and after taxes) is not necessarily an indication of how it will perform in the future. Updated performance information is available at no cost by visiting www.kraneshares.com.
|
| Performance Past Does Not Indicate Future [Text] |
As always, please note that the Fund’s past performance (before and after taxes) is not necessarily an indication of how it will perform in the future.
|
| Performance Information Illustrates Variability of Returns [Text] |
The following bar chart and table illustrate the variability of the Fund’s returns and indicate the risks of investing in the Fund by showing how the Fund’s average annual total returns compare with those of a broad measure of market performance and an additional index with characteristics relevant to the Fund.
|
| Bar Chart [Heading] |
Total Annual Returns For Calender Years Ended December 31
|
| Bar Chart [Table] |
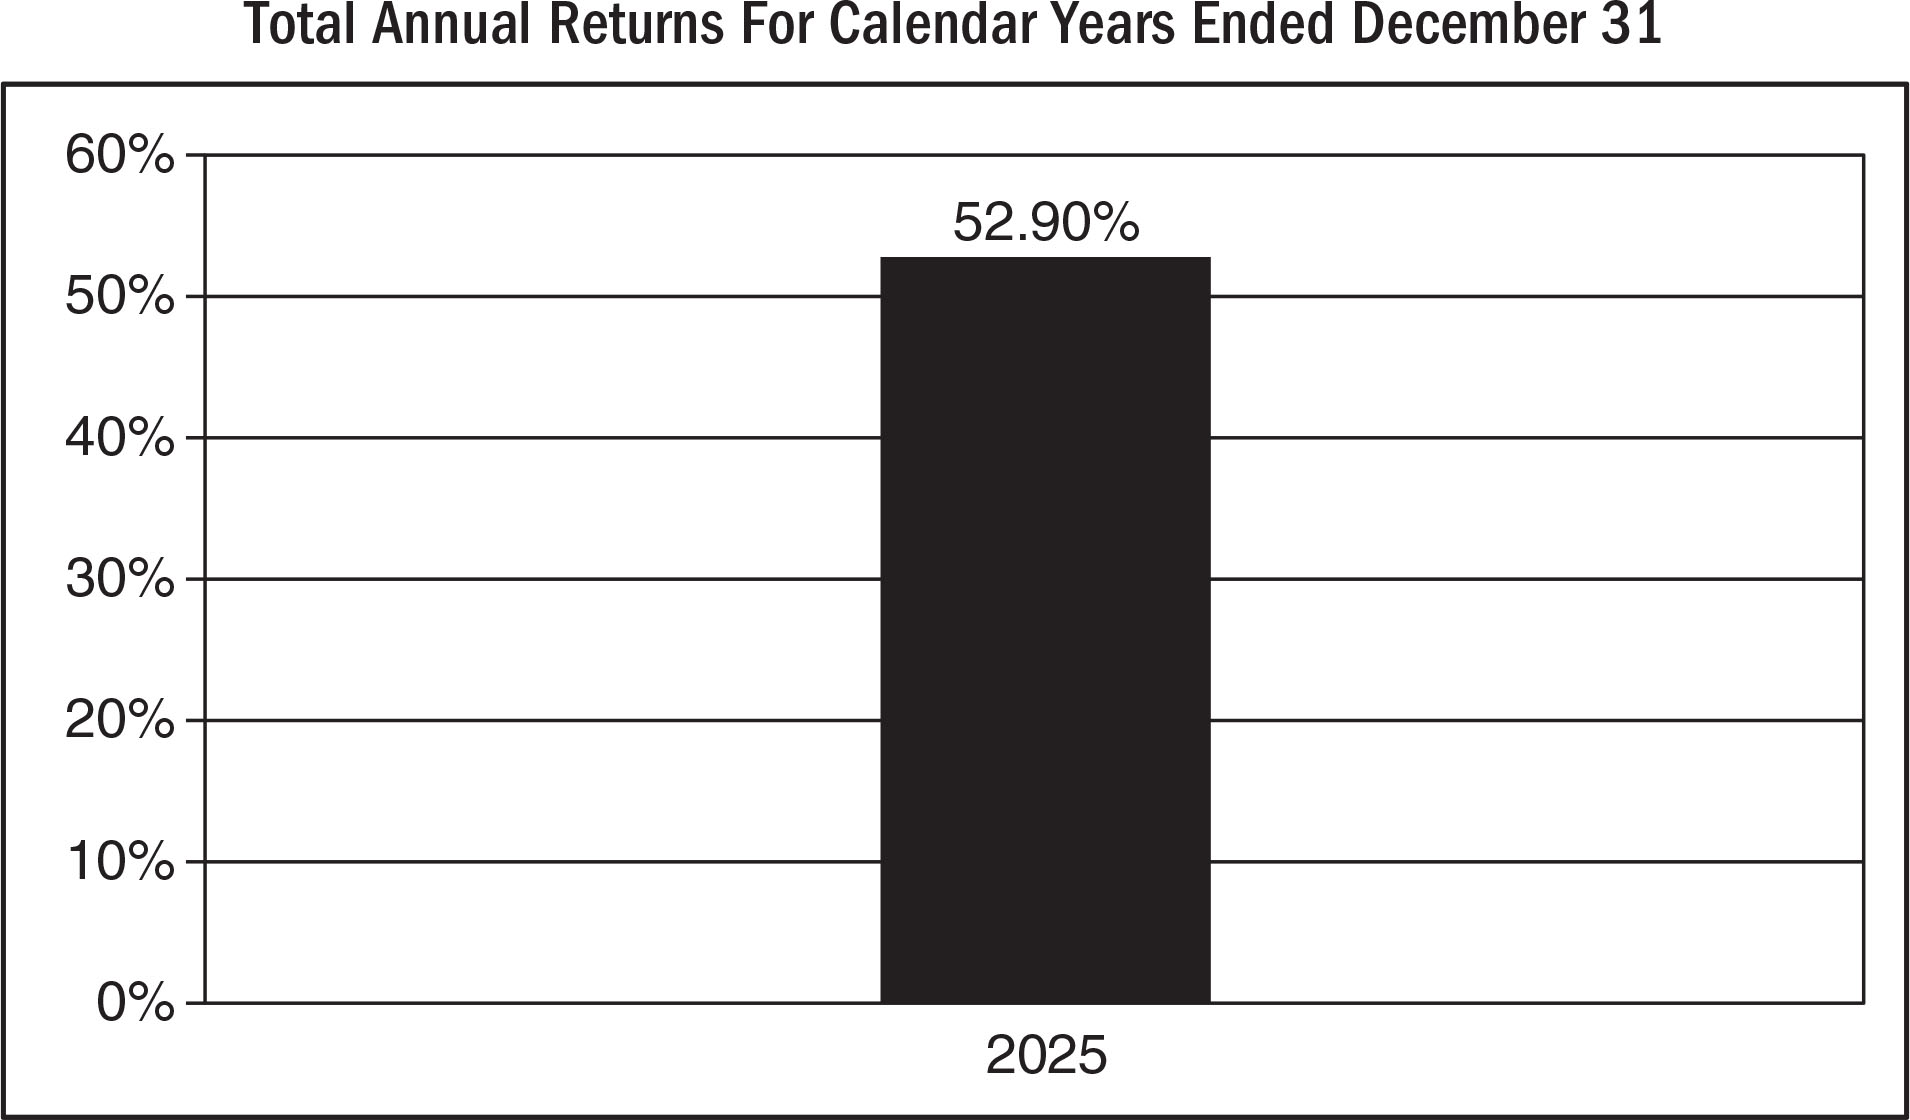
| Years |
Returns |
| 2025 |
52.90% |
|
| Bar Chart Closing [Text Block] |
As of June 30, 2026, the Fund’s calendar year-to-date total return was 4.27%.
Best and Worst Quarter Returns (for the period reflected in the bar chart above)
| |
Return |
Quarter Ended/Year |
| Highest Return |
24.19% |
9/30/2025 |
| Lowest Return |
0.41% |
3/31/2025 |
|
| Year to Date Return, Label [Optional Text] |
year-to-date total return
|
| Bar Chart, Year to Date Return |
4.27%
|
| Bar Chart, Year to Date Return, Date |
Jun. 30, 2026
|
| Highest Quarterly Return, Label [Optional Text] |
Highest Return
|
| Highest Quarterly Return |
24.19%
|
| Highest Quarterly Return, Date |
Sep. 30, 2025
|
| Lowest Quarterly Return, Label [Optional Text] |
Lowest Return
|
| Lowest Quarterly Return |
0.41%
|
| Lowest Quarterly Return, Date |
Mar. 31, 2025
|
| Performance Table Heading |
Average Annual Total Returns for the periods ended December 31, 2025
|
| Performance Table Uses Highest Federal Rate |
After-tax returns for the Fund are calculated using the historical highest individual federal marginal income tax rates and do not reflect the impact of state and local taxes.
|
| Performance Table Not Relevant to Tax Deferred |
Actual after-tax returns depend on an investor’s tax situation and may differ from those shown. After-tax returns shown are not relevant to investors who hold shares through tax-deferred arrangements, such as 401(k) plans or individual retirement plans.
|
| Performance [Table] |
| KraneShares China Alpha Index ETF |
1 year |
Since Inception
(08-27-2024) |
| Return Before Taxes |
52.90% |
47.74% |
| Return After Taxes on Distributions |
39.04% |
36.84% |
| Return After Taxes on Distributions and Sale of Fund Shares |
33.83% |
33.28% |
MSCI China All Shares Index
(Reflects no deduction for fees, expenses or taxes) |
28.94% |
34.55% |
Qi China Alpha Index
(Reflects no deduction for fees, expenses or taxes) |
55.10% |
50.04% |
MSCI China All Shares Index (Reflects no deduction for fees, expenses or taxes)
Qi China Alpha Index (Reflects no deduction for fees, expenses or taxes)
|
| Performance Table Closing [Text Block] |
Average annual total returns are shown on a before- and after-tax basis for the Fund. After-tax returns for the Fund are calculated using the historical highest individual federal marginal income tax rates and do not reflect the impact of state and local taxes. Actual after-tax returns depend on an investor’s tax situation and may differ from those shown. After-tax returns shown are not relevant to investors who hold shares through tax-deferred arrangements, such as 401(k) plans or individual retirement plans.
|
| Performance Availability Website Address [Text] |
www.kraneshares.com
|
| KraneShares China Technology & Semiconductor STAR 50 Index ETF |
|
| Prospectus [Line Items] |
|
| Bar Chart and Performance Table [Heading] |
Performance Information
|
| Performance Narrative [Text Block] |
The following bar chart and table illustrate the variability of the Fund’s returns and indicate the risks of investing in the Fund by showing how the Fund’s average annual total returns compare with those of a broad measure of market performance and an additional index with characteristics relevant to the Fund. All returns include the reinvestment of dividends and distributions. As always, please note that the Fund’s past performance (before and after taxes) is not necessarily an indication of how it will perform in the future. Updated performance information is available at no cost by visiting www.kraneshares.com.
|
| Performance Past Does Not Indicate Future [Text] |
As always, please note that the Fund’s past performance (before and after taxes) is not necessarily an indication of how it will perform in the future.
|
| Performance Information Illustrates Variability of Returns [Text] |
The following bar chart and table illustrate the variability of the Fund’s returns and indicate the risks of investing in the Fund by showing how the Fund’s average annual total returns compare with those of a broad measure of market performance and an additional index with characteristics relevant to the Fund.
|
| Bar Chart [Heading] |
Total Annual Returns For Calendar Years Ended December 31
|
| Bar Chart [Table] |
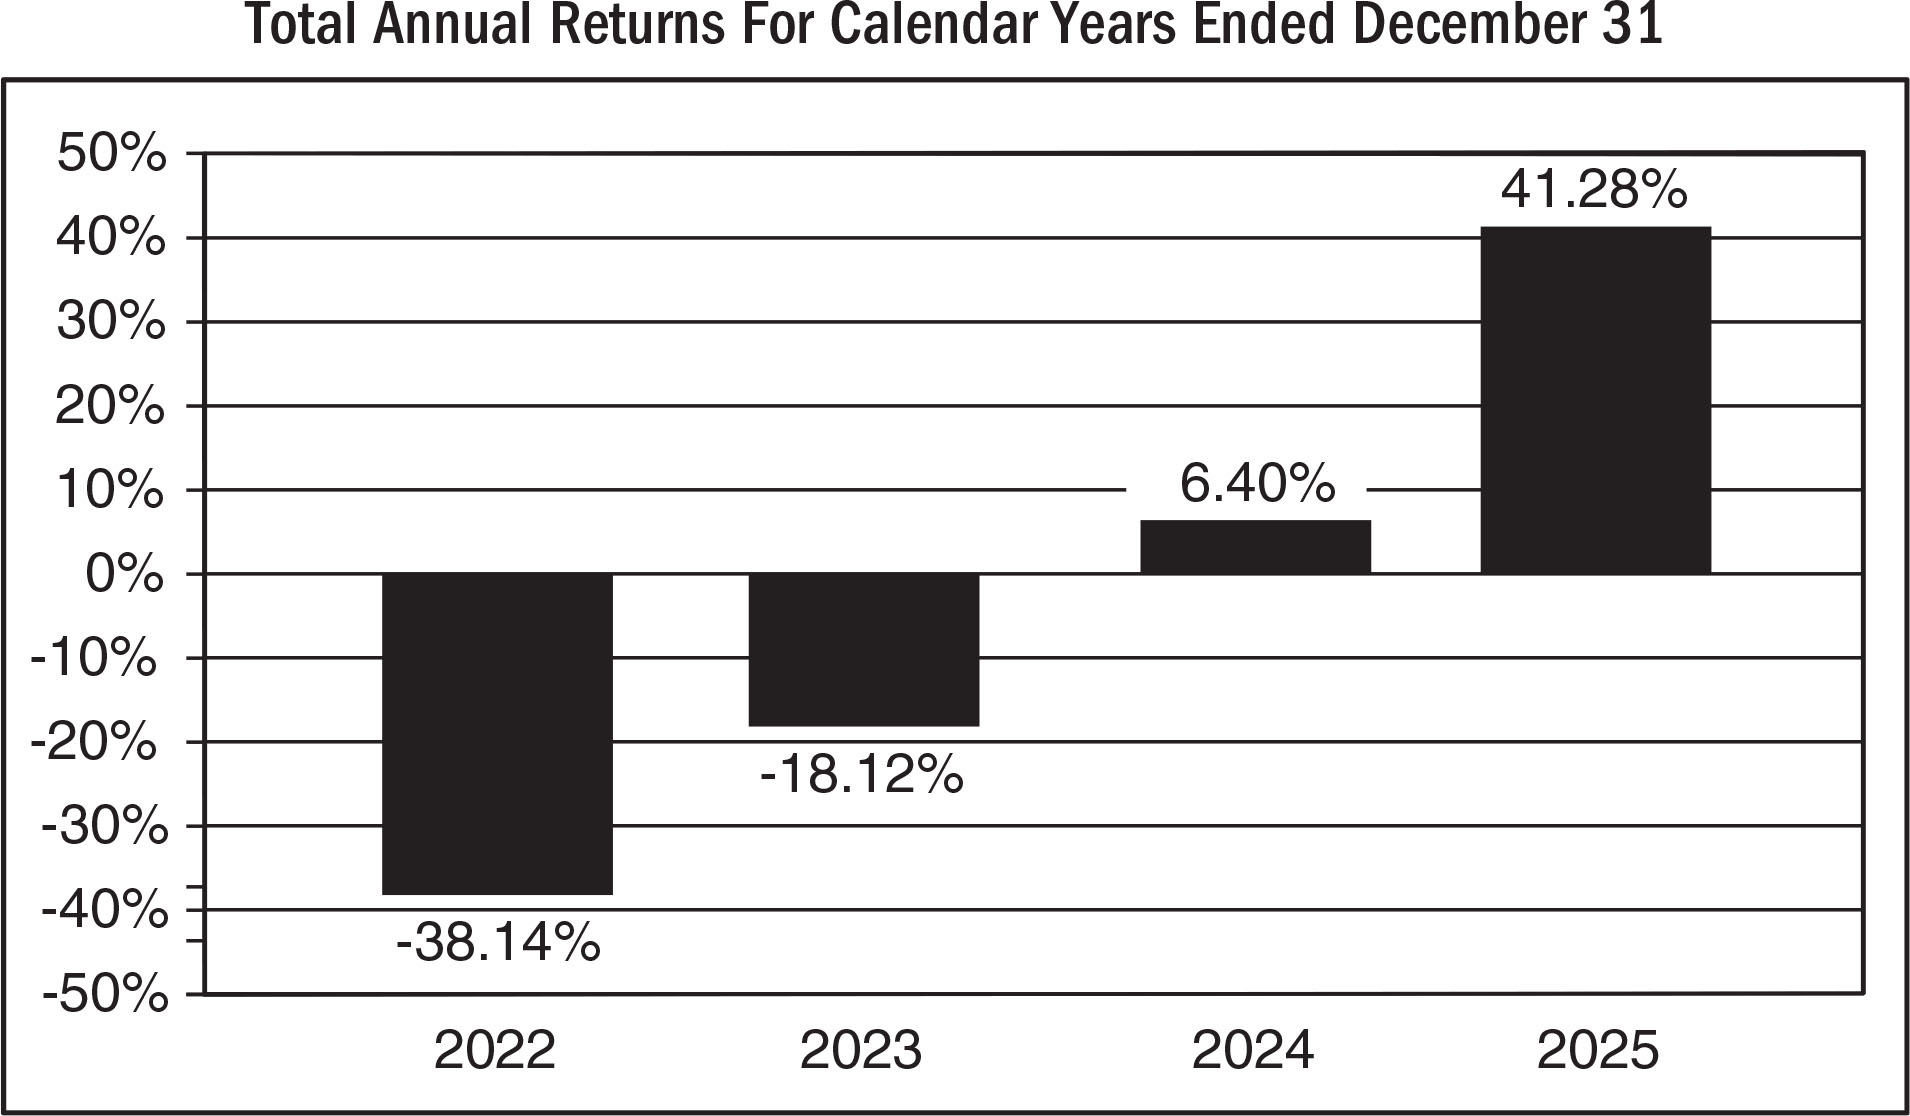
| Years |
Returns |
| 2022 |
-38.14% |
| 2023 |
-18.12% |
| 2024 |
6.40% |
| 2025 |
41.28% |
|
| Bar Chart Closing [Text Block] |
As of June 30, 2026, the Fund’s calendar year-to-date total return was 71.70%.
Best and Worst Quarter Returns (for the period reflected in the bar chart above)
| |
Return |
Quarter Ended/Year |
| Highest Return |
44.91% |
9/30/2025 |
| Lowest Return |
-22.99% |
3/31/2022 |
|
| Year to Date Return, Label [Optional Text] |
year-to-date total return
|
| Bar Chart, Year to Date Return |
71.70%
|
| Bar Chart, Year to Date Return, Date |
Jun. 30, 2026
|
| Highest Quarterly Return, Label [Optional Text] |
Highest Return
|
| Highest Quarterly Return |
44.91%
|
| Highest Quarterly Return, Date |
Sep. 30, 2025
|
| Lowest Quarterly Return, Label [Optional Text] |
Lowest Return
|
| Lowest Quarterly Return |
(22.99%)
|
| Lowest Quarterly Return, Date |
Mar. 31, 2022
|
| Performance Table Heading |
Average Annual Total Returns for the periods ended December 31, 2025
|
| Performance Table Uses Highest Federal Rate |
After-tax returns for the Fund are calculated using the historical highest individual federal marginal income tax rates and do not reflect the impact of state and local taxes.
|
| Performance Table Not Relevant to Tax Deferred |
Actual after-tax returns depend on an investor’s tax situation and may differ from those shown. After-tax returns shown are not relevant to investors who hold shares through tax-deferred arrangements, such as 401(k) plans or individual retirement plans.
|
| Performance [Table] |
| KraneShares China Technology STAR 50 Index ETF |
1 year |
Since Inception
(01-26-2021) |
| Return Before Taxes |
41.28% |
-5.87% |
| Return After Taxes on Distributions |
41.28% |
-5.87% |
| Return After Taxes on Distributions and Sale of Fund Shares |
24.44% |
-4.34% |
MSCI China All Shares Index
(Reflects no deduction for fees, expenses or taxes) |
28.94% |
-4.48% |
SSE Science & Technology Innovation Board 50 Index
(Reflects no deduction for fees, expenses or taxes) |
42.58% |
-2.93% |
MSCI China All Shares Index (Reflects no deduction for fees, expenses or taxes)
SSE Science & Technology
Innovation Board 50 Index (Reflects no deduction for fees, expenses or taxes)
|
| Performance Table Closing [Text Block] |
Average annual total returns are shown on a before- and after-tax basis for the Fund. After-tax returns for the Fund are calculated using the historical highest individual federal marginal income tax rates and do not reflect the impact of state and local taxes. Actual after-tax returns depend on an investor’s tax situation and may differ from those shown. After-tax returns shown are not relevant to investors who hold shares through tax-deferred arrangements, such as 401(k) plans or individual retirement plans.
|
| Performance Availability Website Address [Text] |
www.kraneshares.com
|
| KraneShares CSI China Internet ETF |
|
| Prospectus [Line Items] |
|
| Bar Chart and Performance Table [Heading] |
Performance Information
|
| Performance Narrative [Text Block] |
The following bar chart and table illustrate the variability of the Fund’s returns and indicate the risks of investing in the Fund by showing how the Fund’s average annual total returns compare with those of a broad measure of market performance and an additional index with characteristics relevant to the Fund. All returns include the reinvestment of dividends and distributions. As always, please note that the Fund’s past performance (before and after taxes) is not necessarily an indication of how it will perform in the future. In addition, prior to December 1, 2015, a sub-adviser was responsible for day-to-day portfolio management of the Fund’s assets. Updated performance information is available at no cost by visiting www.kraneshares.com.
|
| Performance Past Does Not Indicate Future [Text] |
As always, please note that the Fund’s past performance (before and after taxes) is not necessarily an indication of how it will perform in the future.
|
| Performance Information Illustrates Variability of Returns [Text] |
The following bar chart and table illustrate the variability of the Fund’s returns and indicate the risks of investing in the Fund by showing how the Fund’s average annual total returns compare with those of a broad measure of market performance and an additional index with characteristics relevant to the Fund.
|
| Bar Chart [Heading] |
Total Annual Returns For Calendar Years Ended December 31
|
| Bar Chart [Table] |
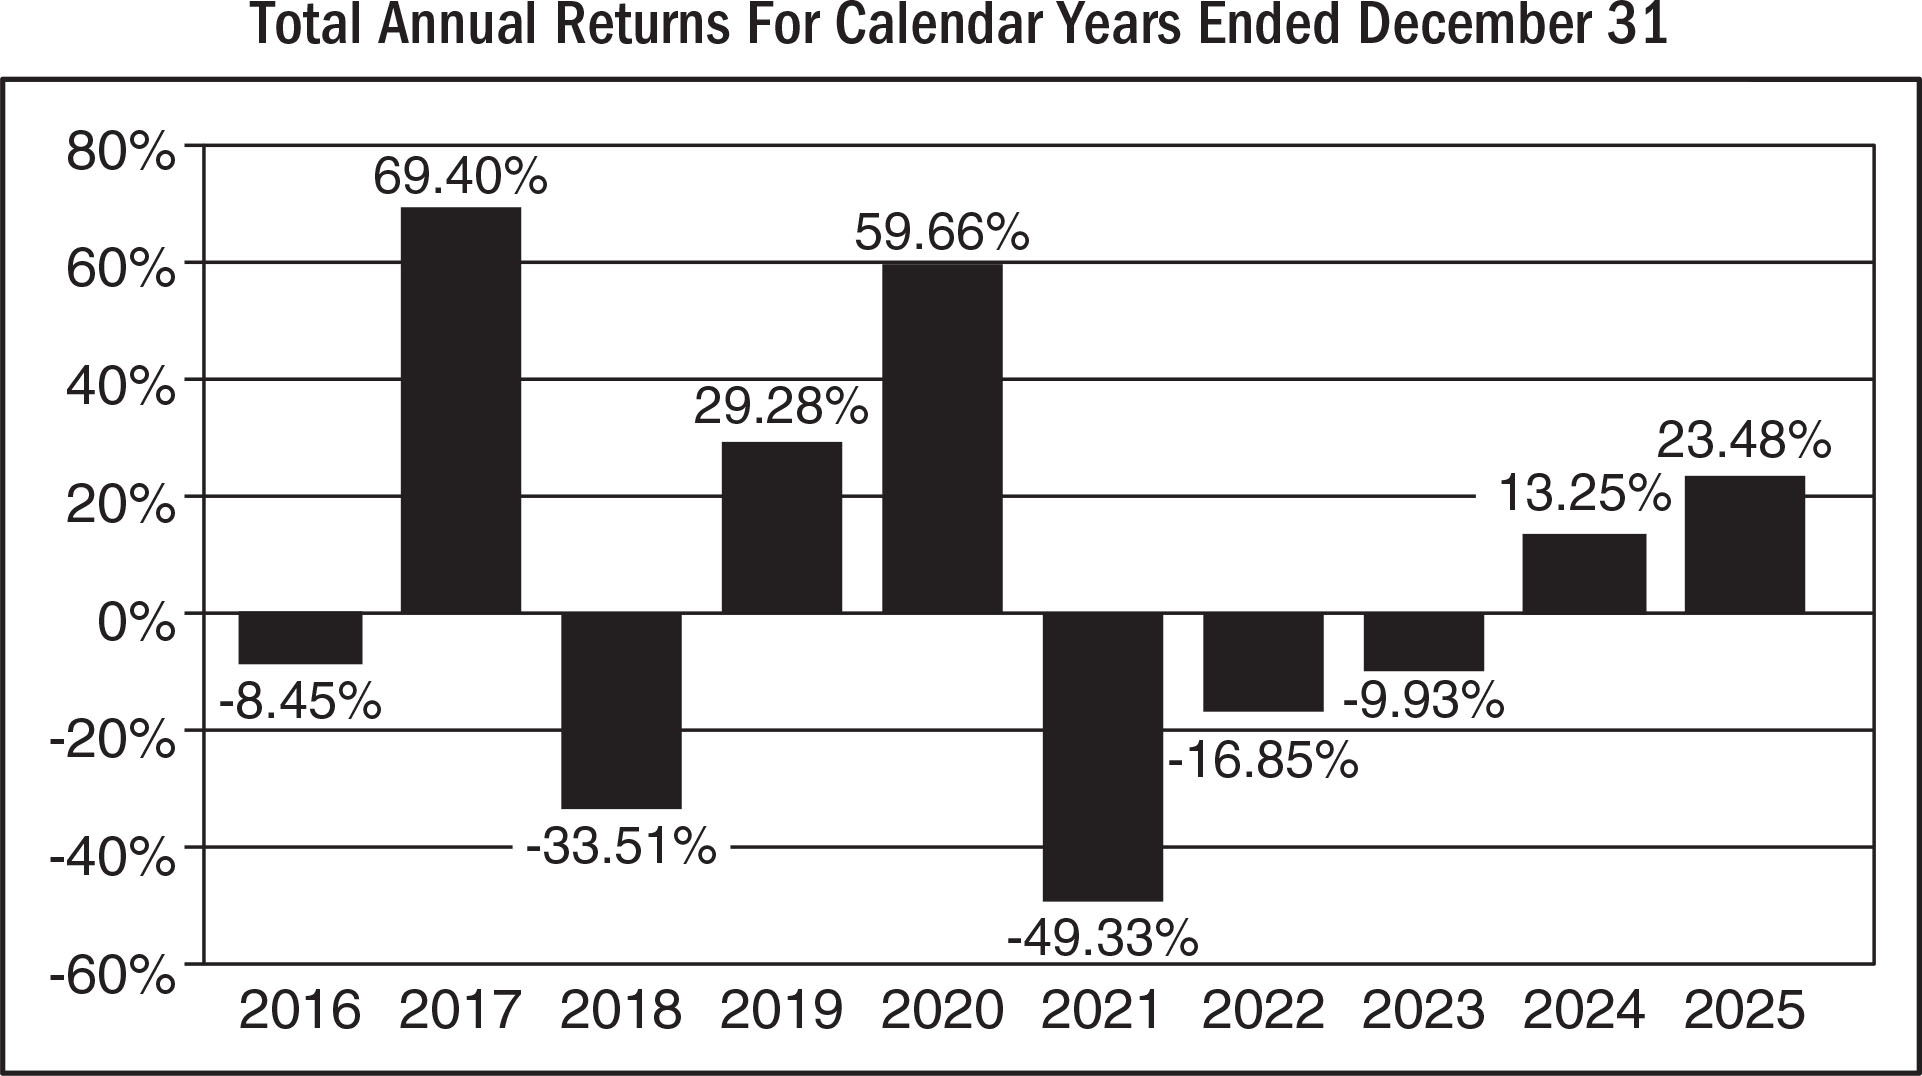
| Years |
Returns |
| 2016 |
-8.45% |
| 2017 |
69.40% |
| 2018 |
-33.51% |
| 2019 |
29.28% |
| 2020 |
59.66% |
| 2021 |
-49.33% |
| 2022 |
-16.85% |
| 2023 |
-9.93% |
| 2024 |
13.25% |
| 2025 |
23.48% |
|
| Bar Chart Closing [Text Block] |
As of June 30, 2026, the Fund’s calendar year-to-date total return was -28.96%.
Best and Worst Quarter Returns (for the period reflected in the bar chart above)
| |
Return |
Quarter Ended/Year |
| Highest Return |
37.44% |
6/30/2020 |
| Lowest Return |
-32.36% |
9/30/2021 |
|
| Year to Date Return, Label [Optional Text] |
year-to-date total return
|
| Bar Chart, Year to Date Return |
28.96%
|
| Bar Chart, Year to Date Return, Date |
Jun. 30, 2026
|
| Highest Quarterly Return, Label [Optional Text] |
Highest Return
|
| Highest Quarterly Return |
37.44%
|
| Highest Quarterly Return, Date |
Jun. 30, 2020
|
| Lowest Quarterly Return, Label [Optional Text] |
Lowest Return
|
| Lowest Quarterly Return |
(32.36%)
|
| Lowest Quarterly Return, Date |
Sep. 30, 2021
|
| Performance Table Heading |
Average Annual Total Returns for the periods ended December 31, 2025
|
| Performance Table Uses Highest Federal Rate |
After-tax returns for the Fund are calculated using the historical highest individual federal marginal income tax rates and do not reflect the impact of state and local taxes.
|
| Performance Table Not Relevant to Tax Deferred |
Actual after-tax returns depend on an investor’s tax situation and may differ from those shown. After-tax returns shown are not relevant to investors who hold shares through tax-deferred arrangements, such as 401(k) plans or individual retirement plans.
|
| Performance [Table] |
| KraneShares CSI China Internet ETF |
1 year |
5 years |
10 years |
| Return Before Taxes |
23.48% |
-11.90% |
1.23% |
| Return After Taxes on Distributions |
20.63% |
-12.96% |
0.46% |
| Return After Taxes on Distributions and Sale of Fund Shares |
13.94% |
-8.78% |
0.71% |
MSCI China All Shares Index
(Reflects no deduction for fees, expenses or taxes) |
28.94% |
-2.45% |
4.14% |
CSI Overseas China Internet Index
(Reflects no deduction for fees, expenses or taxes) |
23.29% |
-11.93% |
1.28% |
MSCI China All Shares Index (Reflects no deduction for fees, expenses or taxes)
CSI Overseas China Internet Index (Reflects no deduction for fees, expenses or taxes)
|
| Performance Table Closing [Text Block] |
Average annual total returns are shown on a before- and after-tax basis for the Fund. After-tax returns for the Fund are calculated using the historical highest individual federal marginal income tax rates and do not reflect the impact of state and local taxes. Actual after-tax returns depend on an investor’s tax situation and may differ from those shown. After-tax returns shown are not relevant to investors who hold shares through tax-deferred arrangements, such as 401(k) plans or individual retirement plans.
|
| Performance Availability Website Address [Text] |
www.kraneshares.com
|
| KraneShares Dragon Capital Growth of Vietnam Index ETF |
|
| Prospectus [Line Items] |
|
| Bar Chart and Performance Table [Heading] |
Performance Information
|
| Performance Narrative [Text Block] |
Once the Fund has completed a full calendar year of operations, a bar chart and table will be included in this Prospectus that will provide some indication of the risks of investing in the Fund by showing the variability of the Fund’s return based on net assets and comparing the variability of the Fund’s return to a broad measure of market performance. Once available, the Fund’s current performance information will be available at www.kraneshares.com. Past performance does not necessarily indicate how the Fund will perform in the future.
|
| Performance Past Does Not Indicate Future [Text] |
Past performance does not necessarily indicate how the Fund will perform in the future.
|
| Performance Information Illustrates Variability of Returns [Text] |
Once the Fund has completed a full calendar year of operations, a bar chart and table will be included in this Prospectus that will provide some indication of the risks of investing in the Fund by showing the variability of the Fund’s return based on net assets and comparing the variability of the Fund’s return to a broad measure of market performance.
|
| Performance Availability Website Address [Text] |
www.kraneshares.com
|
| KraneShares Electric Vehicles and Future Mobility Index ETF |
|
| Prospectus [Line Items] |
|
| Bar Chart and Performance Table [Heading] |
Performance Information
|
| Performance Narrative [Text Block] |
The following bar chart and table illustrate the variability of the Fund’s returns and indicate the risks of investing in the Fund by showing how the Fund’s average annual total returns compare with those of a broad measure of market performance and an additional index with characteristics relevant to the Fund. All returns include the reinvestment of dividends and distributions. As always, please note that the Fund’s past performance (before and after taxes) is not necessarily an indication of how it will perform in the future. Updated performance information is available at no cost by visiting www.kraneshares.com. In addition, prior to June 16, 2021, the Fund previously sought to track the performance of the Solactive Electric Vehicles and Future Mobility Index, before fees and expenses.
|
| Performance Past Does Not Indicate Future [Text] |
As always, please note that the Fund’s past performance (before and after taxes) is not necessarily an indication of how it will perform in the future.
|
| Performance Information Illustrates Variability of Returns [Text] |
The following bar chart and table illustrate the variability of the Fund’s returns and indicate the risks of investing in the Fund by showing how the Fund’s average annual total returns compare with those of a broad measure of market performance and an additional index with characteristics relevant to the Fund.
|
| Bar Chart [Heading] |
Total Annual Returns For Calendar Years Ended December 31
|
| Bar Chart [Table] |
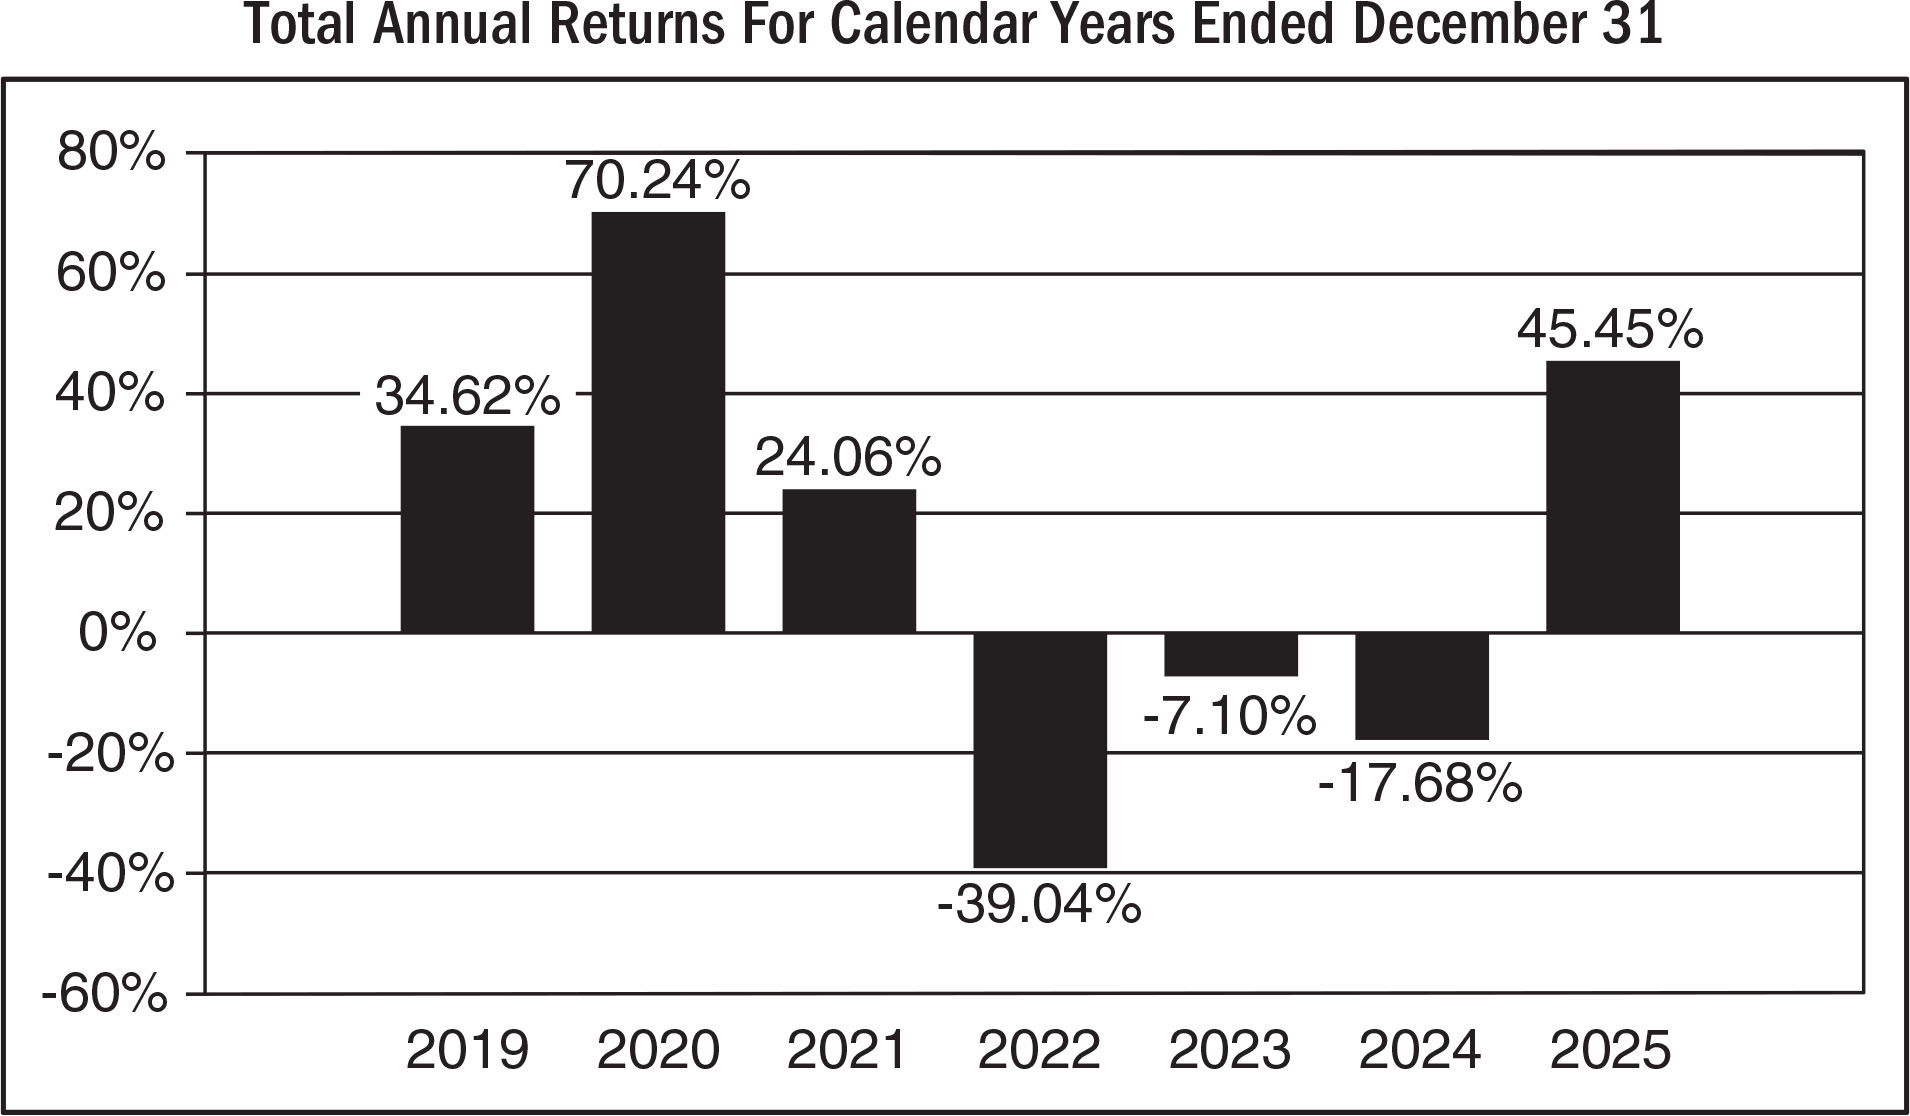
| Years |
Returns |
| 2019 |
34.62% |
| 2020 |
70.24% |
| 2021 |
24.06% |
| 2022 |
-39.04% |
| 2023 |
-7.10% |
| 2024 |
-17.68% |
| 2025 |
45.45% |
|
| Bar Chart Closing [Text Block] |
As of June 30, 2026, the Fund’s calendar year-to-date total return was 2.89%.
Best and Worst Quarter Returns (for the period reflected in the bar chart above)
| |
Return |
Quarter Ended/Year |
| Highest Return |
39.17% |
9/30/2025 |
| Lowest Return |
-19.61% |
3/31/2020 |
|
| Year to Date Return, Label [Optional Text] |
year-to-date total return
|
| Bar Chart, Year to Date Return |
2.89%
|
| Bar Chart, Year to Date Return, Date |
Jun. 30, 2026
|
| Highest Quarterly Return, Label [Optional Text] |
Highest Return
|
| Highest Quarterly Return |
39.17%
|
| Highest Quarterly Return, Date |
Sep. 30, 2025
|
| Lowest Quarterly Return, Label [Optional Text] |
Lowest Return
|
| Lowest Quarterly Return |
(19.61%)
|
| Lowest Quarterly Return, Date |
Mar. 31, 2020
|
| Performance Table Heading |
Average Annual Total Returns for the periods ended December 31, 2025
|
| Performance Table Uses Highest Federal Rate |
After-tax returns for the Fund are calculated using the historical highest individual federal marginal income tax rates and do not reflect the impact of state and local taxes.
|
| Performance Table Not Relevant to Tax Deferred |
Actual after-tax returns depend on an investor’s tax situation and may differ from those shown. After-tax returns shown are not relevant to investors who hold shares through tax-deferred arrangements, such as 401(k) plans or individual retirement plans.
|
| Performance [Table] |
| KraneShares Electric Vehicles and Future Mobility Index ETF |
1 Year |
5 years |
Since Inception
(1-18-2018) |
| Return Before Taxes |
45.45% |
-3.40% |
4.31% |
| Return After Taxes on Distributions |
45.48% |
-3.85% |
3.93% |
| Return After Taxes on Distributions and Sale of Fund Shares |
27.04% |
-2.50% |
3.42% |
MSCI ACWI
(Reflects no deduction for fees, expenses or taxes) |
22.34% |
11.19% |
10.20% |
Custom Blended KARS Index
(Reflects no deduction for fees, expenses or taxes)* |
45.03% |
-2.74% |
4.89% |
MSCI ACWI (Reflects no deduction for fees, expenses or taxes)
Custom Blended KARS Index (Reflects no deduction for fees, expenses or taxes)
|
* |
The Custom Blended KARS Index consists of the Solactive Electric Vehicles and Future Mobility Index from the inception of the Fund through June 15, 2021 and the Bloomberg Electric Vehicles Total Return Index going forward. |
|
| Performance Table Closing [Text Block] |
Average annual total returns are shown on a before- and after-tax basis for the Fund. After-tax returns for the Fund are calculated using the historical highest individual federal marginal income tax rates and do not reflect the impact of state and local taxes. Actual after-tax returns depend on an investor’s tax situation and may differ from those shown. After-tax returns shown are not relevant to investors who hold shares through tax-deferred arrangements, such as 401(k) plans or individual retirement plans.
|
| Performance Availability Website Address [Text] |
www.kraneshares.com
|
| KraneShares Global Carbon Strategy ETF |
|
| Prospectus [Line Items] |
|
| Bar Chart and Performance Table [Heading] |
Performance Information
|
| Performance Narrative [Text Block] |
The following bar chart and table illustrate the variability of the Fund’s returns and indicate the risks of investing in the Fund by showing how the Fund’s average annual total returns compare with those of a broad measure of market performance and an additional index with characteristics relevant to the Fund. All returns include the reinvestment of dividends and distributions. As always, please note that the Fund’s past performance (before and after taxes) is not necessarily an indication of how it will perform in the future. Prior to December 3, 2021, the Fund was actively managed and sought to outperform the Index through investments in debt instruments. Prior to November 3, 2025, the Fund previously sought to track the performance of the S&P Global Carbon Credit Total Return Index, before fees and expenses. Updated performance information is available at no cost by visiting www.kraneshares.com.
|
| Performance Past Does Not Indicate Future [Text] |
As always, please note that the Fund’s past performance (before and after taxes) is not necessarily an indication of how it will perform in the future.
|
| Performance Information Illustrates Variability of Returns [Text] |
The following bar chart and table illustrate the variability of the Fund’s returns and indicate the risks of investing in the Fund by showing how the Fund’s average annual total returns compare with those of a broad measure of market performance and an additional index with characteristics relevant to the Fund.
|
| Bar Chart [Heading] |
Total Annual Returns For Calender Years Ended December 31
|
| Bar Chart [Table] |
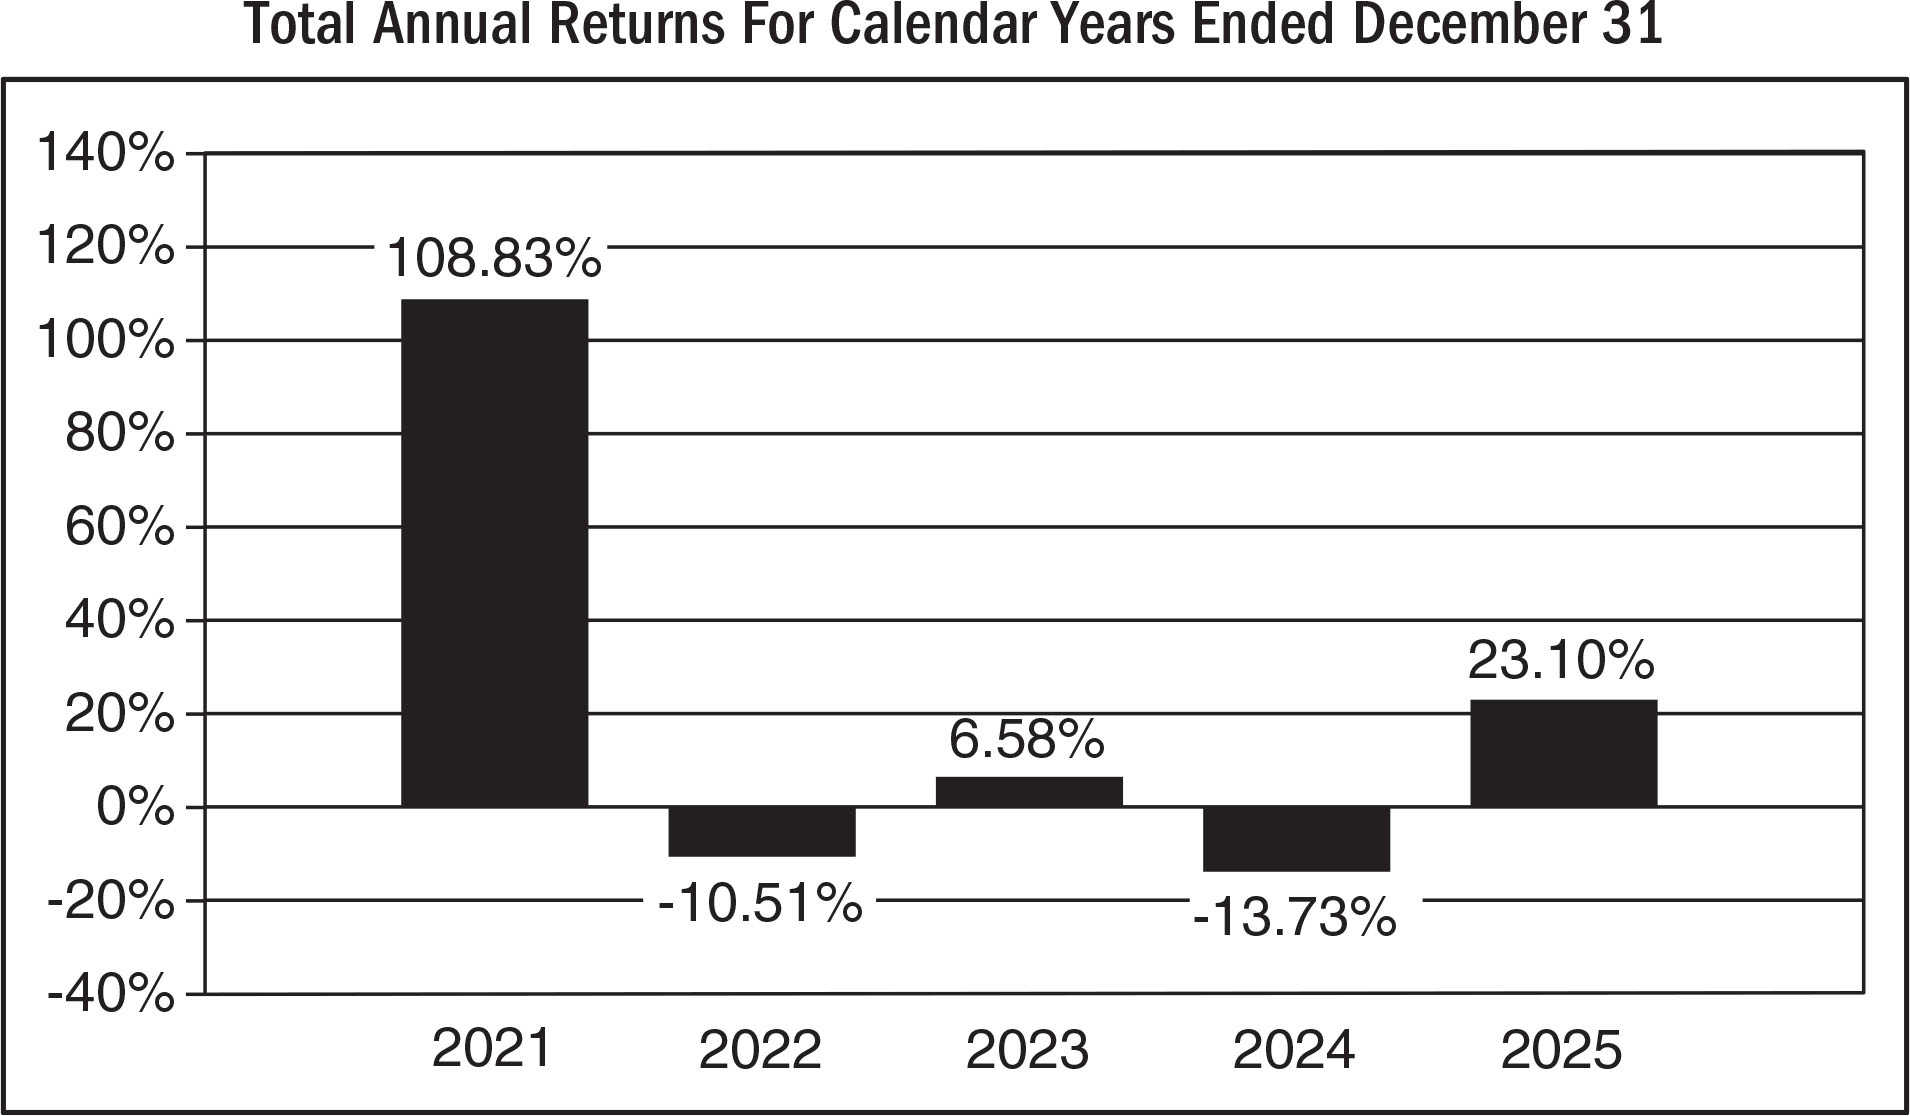
| Years |
Returns |
| 2021 |
108.83% |
| 2022 |
-10.51% |
| 2023 |
6.58% |
| 2024 |
-13.73% |
| 2025 |
23.10% |
|
| Bar Chart Closing [Text Block] |
As of June 30, 2026, the Fund’s calendar year-to-date total return was -5.88%.
Best and Worst Quarter Returns (for the period reflected in the bar chart above)
| |
Return |
Quarter Ended/Year |
| Highest Return |
28.78% |
6/30/2021 |
| Lowest Return |
-24.70% |
9/30/2022 |
|
| Year to Date Return, Label [Optional Text] |
year-to-date total return
|
| Bar Chart, Year to Date Return |
5.88%
|
| Bar Chart, Year to Date Return, Date |
Jun. 30, 2026
|
| Highest Quarterly Return, Label [Optional Text] |
Highest Return
|
| Highest Quarterly Return |
28.78%
|
| Highest Quarterly Return, Date |
Jun. 30, 2021
|
| Lowest Quarterly Return, Label [Optional Text] |
Lowest Return
|
| Lowest Quarterly Return |
(24.70%)
|
| Lowest Quarterly Return, Date |
Sep. 30, 2022
|
| Performance Table Heading |
Average Annual Total Returns for the periods ended December 31, 2025
|
| Performance Table Uses Highest Federal Rate |
After-tax returns for the Fund are calculated using the historical highest individual federal marginal income tax rates and do not reflect the impact of state and local taxes.
|
| Performance Table Not Relevant to Tax Deferred |
Actual after-tax returns depend on an investor’s tax situation and may differ from those shown. After-tax returns shown are not relevant to investors who hold shares through tax-deferred arrangements, such as 401(k) plans or individual retirement plans.
|
| Performance [Table] |
| KraneShares Global Carbon Strategy ETF |
1 year |
5 years |
Since Inception
(7-30-2020) |
| Return Before Taxes |
23.10% |
16.16% |
19.05% |
| Return After Taxes on Distributions |
22.16% |
12.79% |
15.86% |
| Return After Taxes on Distributions and Sale of Fund Shares |
13.67% |
11.41% |
14.02% |
S&P 500 Index
(Reflects no deduction for fees, expenses or taxes) |
17.88% |
14.42% |
16.38% |
S&P Global Carbon Credit Index
(Reflects no deduction for fees, expenses or taxes) |
25.12% |
7.72% |
20.34% |
S&P 500 Index (Reflects no deduction for fees, expenses or taxes)
S&P Global Carbon Credit Index (Reflects no deduction for fees, expenses or taxes)
|
| Performance Table Closing [Text Block] |
Average annual total returns are shown on a before- and after-tax basis for the Fund. After-tax returns for the Fund are calculated using the historical highest individual federal marginal income tax rates and do not reflect the impact of state and local taxes. Actual after-tax returns depend on an investor’s tax situation and may differ from those shown. After-tax returns shown are not relevant to investors who hold shares through tax-deferred arrangements, such as 401(k) plans or individual retirement plans.
|
| Performance Availability Website Address [Text] |
www.kraneshares.com
|
| KraneShares Global Humanoid Robotics and Physical AI Index ETF |
|
| Prospectus [Line Items] |
|
| Bar Chart and Performance Table [Heading] |
Performance Information
|
| Performance Narrative [Text Block] |
Once the Fund has completed a full calendar year of operations, a bar chart and table will be included in this Prospectus that will provide some indication of the risks of investing in the Fund by showing the variability of the Fund’s return based on net assets and comparing the variability of the Fund’s return to a broad measure of market performance. Once available, the Fund’s current performance information will be available at www.kraneshares.com. Past performance does not necessarily indicate how the Fund will perform in the future.
|
| Performance Past Does Not Indicate Future [Text] |
Past performance does not necessarily indicate how the Fund will perform in the future.
|
| Performance Information Illustrates Variability of Returns [Text] |
Once the Fund has completed a full calendar year of operations, a bar chart and table will be included in this Prospectus that will provide some indication of the risks of investing in the Fund by showing the variability of the Fund’s return based on net assets and comparing the variability of the Fund’s return to a broad measure of market performance.
|
| Performance Availability Website Address [Text] |
www.kraneshares.com
|
| KraneShares Hang Seng TECH Index ETF |
|
| Prospectus [Line Items] |
|
| Bar Chart and Performance Table [Heading] |
Performance Information
|
| Performance Narrative [Text Block] |
The following bar chart and table illustrate the variability of the Fund’s returns and indicate the risks of investing in the Fund by showing how the Fund’s average annual total returns compare with those of a broad measure of market performance and an additional index with characteristics relevant to the Fund. All returns include the reinvestment of dividends and distributions. As always, please note that the Fund’s past performance (before and after taxes) is not necessarily an indication of how it will perform in the future. Updated performance information is available at no cost by visiting www.kraneshares.com.
|
| Performance Past Does Not Indicate Future [Text] |
As always, please note that the Fund’s past performance (before and after taxes) is not necessarily an indication of how it will perform in the future.
|
| Performance Information Illustrates Variability of Returns [Text] |
The following bar chart and table illustrate the variability of the Fund’s returns and indicate the risks of investing in the Fund by showing how the Fund’s average annual total returns compare with those of a broad measure of market performance and an additional index with characteristics relevant to the Fund.
|
| Bar Chart [Heading] |
Total Annual Returns For Calender Years Ended December 31
|
| Bar Chart [Table] |
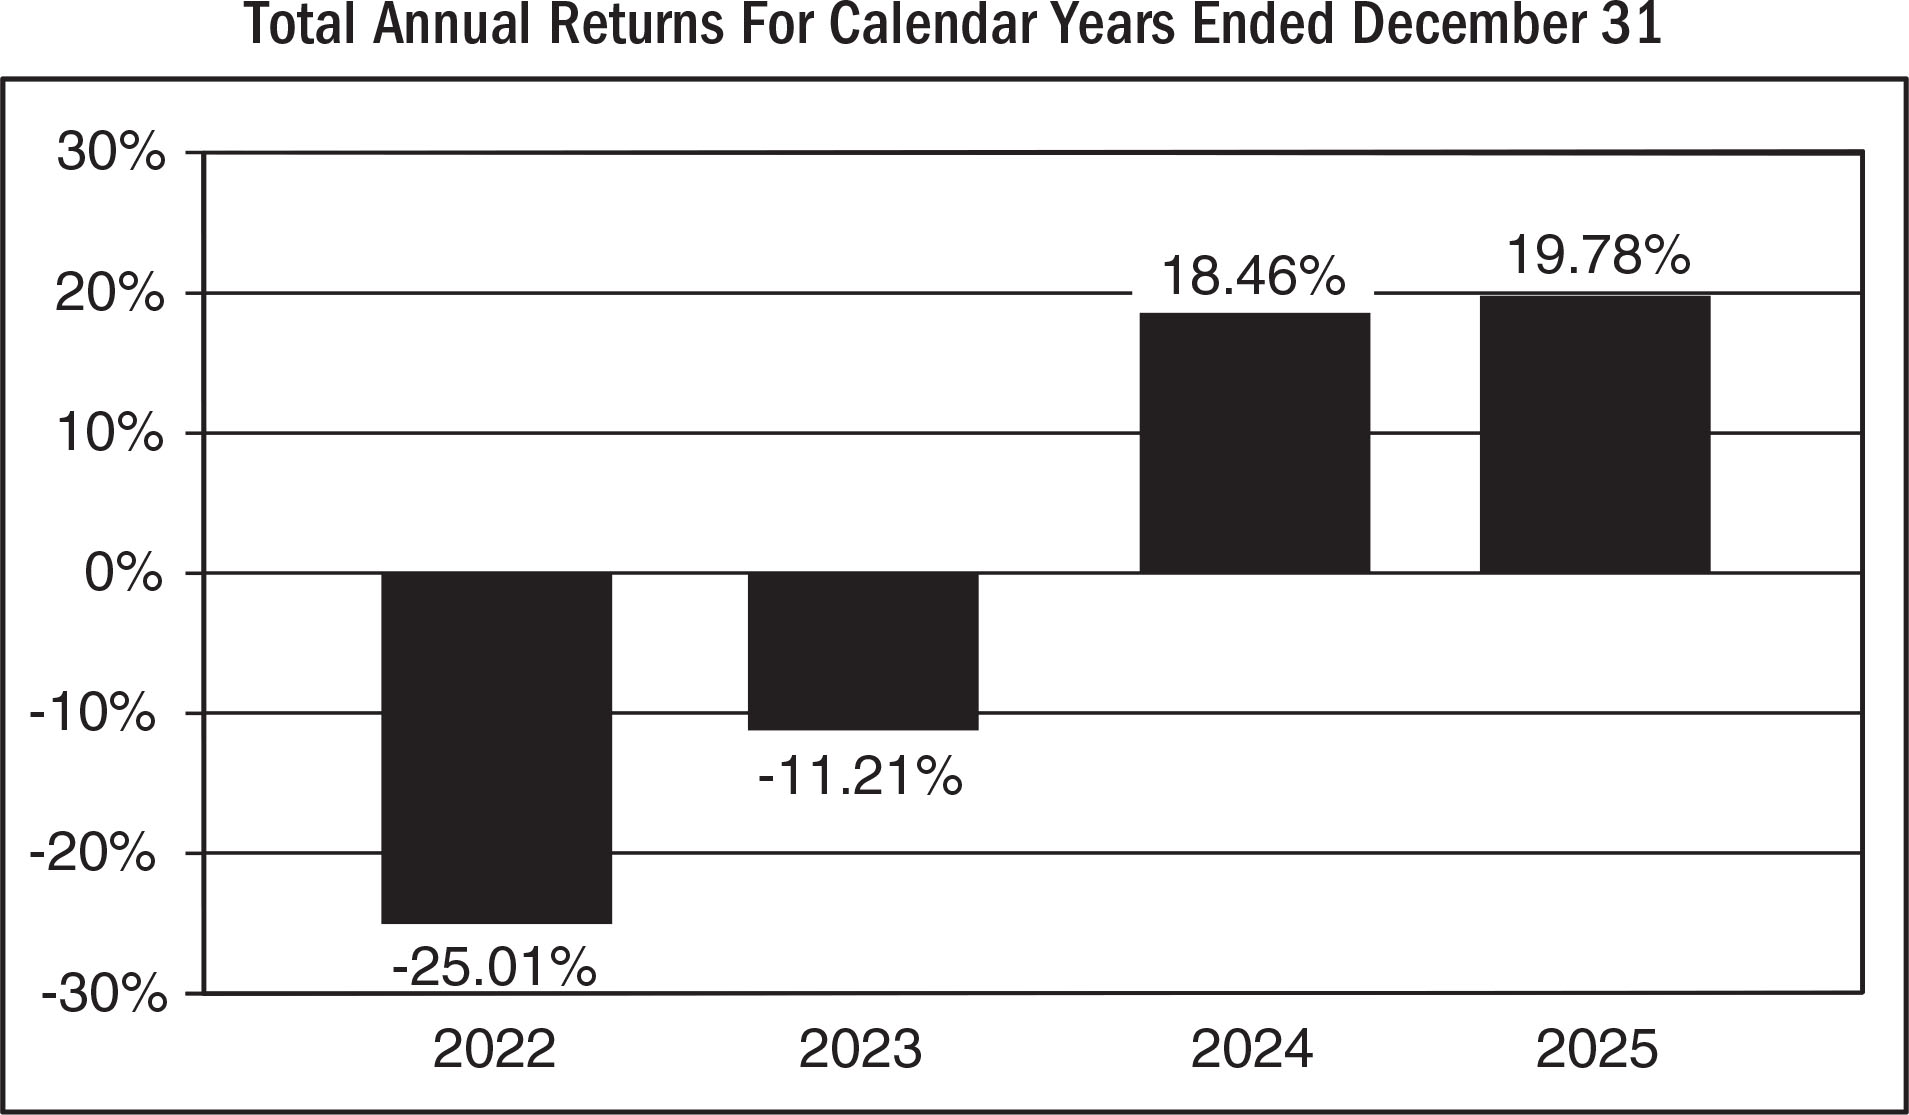
| Years |
Returns |
| 2022 |
-25.01% |
| 2023 |
-11.21% |
| 2024 |
18.46% |
| 2025 |
19.78% |
|
| Bar Chart Closing [Text Block] |
As of June 30, 2026, the Fund’s calendar year-to-date total return was -22.88%.
Best and Worst Quarter Returns (for the period reflected in the bar chart above)
| |
Return |
Quarter Ended/Year |
| Highest Return |
34.12% |
9/30/2024 |
| Lowest Return |
-29.75% |
9/30/2022 |
|
| Year to Date Return, Label [Optional Text] |
year-to-date total return
|
| Bar Chart, Year to Date Return |
22.88%
|
| Bar Chart, Year to Date Return, Date |
Jun. 30, 2026
|
| Highest Quarterly Return, Label [Optional Text] |
Highest Return
|
| Highest Quarterly Return |
34.12%
|
| Highest Quarterly Return, Date |
Sep. 30, 2024
|
| Lowest Quarterly Return, Label [Optional Text] |
Lowest Return
|
| Lowest Quarterly Return |
(29.75%)
|
| Lowest Quarterly Return, Date |
Sep. 30, 2022
|
| Performance Table Heading |
Average Annual Total Returns for the periods ended December 31, 2025
|
| Performance Table Uses Highest Federal Rate |
After-tax returns for the Fund are calculated using the historical highest individual federal marginal income tax rates and do not reflect the impact of state and local taxes.
|
| Performance Table Not Relevant to Tax Deferred |
Actual after-tax returns depend on an investor’s tax situation and may differ from those shown. After-tax returns shown are not relevant to investors who hold shares through tax-deferred arrangements, such as 401(k) plans or individual retirement plans.
|
| Performance [Table] |
| KraneShares Hang Seng TECH Index ETF |
1 year |
Since Inception
(06-08-2021) |
| Return Before Taxes |
19.78% |
-8.69% |
| Return After Taxes on Distributions |
18.26% |
-9.04% |
| Return After Taxes on Distributions and Sale of Fund Shares |
11.76% |
-6.48% |
MSCI China All Shares Index
(Reflects no deduction for fees, expenses or taxes) |
28.94% |
-3.07% |
Hang Seng TECH Index
(Reflects no deduction for fees, expenses or taxes) |
24.37% |
-7.12% |
MSCI China All Shares Index (Reflects no deduction for fees, expenses or taxes)
Hang Seng TECH Index (Reflects no deduction for fees, expenses or taxes)
|
| Performance Table Closing [Text Block] |
Average annual total returns are shown on a before- and after-tax basis for the Fund. After-tax returns for the Fund are calculated using the historical highest individual federal marginal income tax rates and do not reflect the impact of state and local taxes. Actual after-tax returns depend on an investor’s tax situation and may differ from those shown. After-tax returns shown are not relevant to investors who hold shares through tax-deferred arrangements, such as 401(k) plans or individual retirement plans.
|
| Performance Availability Website Address [Text] |
www.kraneshares.com
|
| KraneShares Hedgeye Hedged Equity Index ETF |
|
| Prospectus [Line Items] |
|
| Bar Chart and Performance Table [Heading] |
Performance Information
|
| Performance Narrative [Text Block] |
The following bar chart and table illustrate the variability of the Fund’s returns and indicate the risks of investing in the Fund by showing how the Fund’s average annual total returns compare with those of a broad measure of market performance and an additional index with characteristics relevant to the Fund. All returns include the reinvestment of dividends and distributions. As always, please note that the Fund’s past performance (before and after taxes) is not necessarily an indication of how it will perform in the future. Updated performance information is available at no cost by visiting www.kraneshares.com.
|
| Performance Past Does Not Indicate Future [Text] |
As always, please note that the Fund’s past performance (before and after taxes) is not necessarily an indication of how it will perform in the future.
|
| Performance Information Illustrates Variability of Returns [Text] |
The following bar chart and table illustrate the variability of the Fund’s returns and indicate the risks of investing in the Fund by showing how the Fund’s average annual total returns compare with those of a broad measure of market performance and an additional index with characteristics relevant to the Fund.
|
| Bar Chart [Heading] |
Total Annual Returns For Calender Years Ended December 31
|
| Bar Chart [Table] |
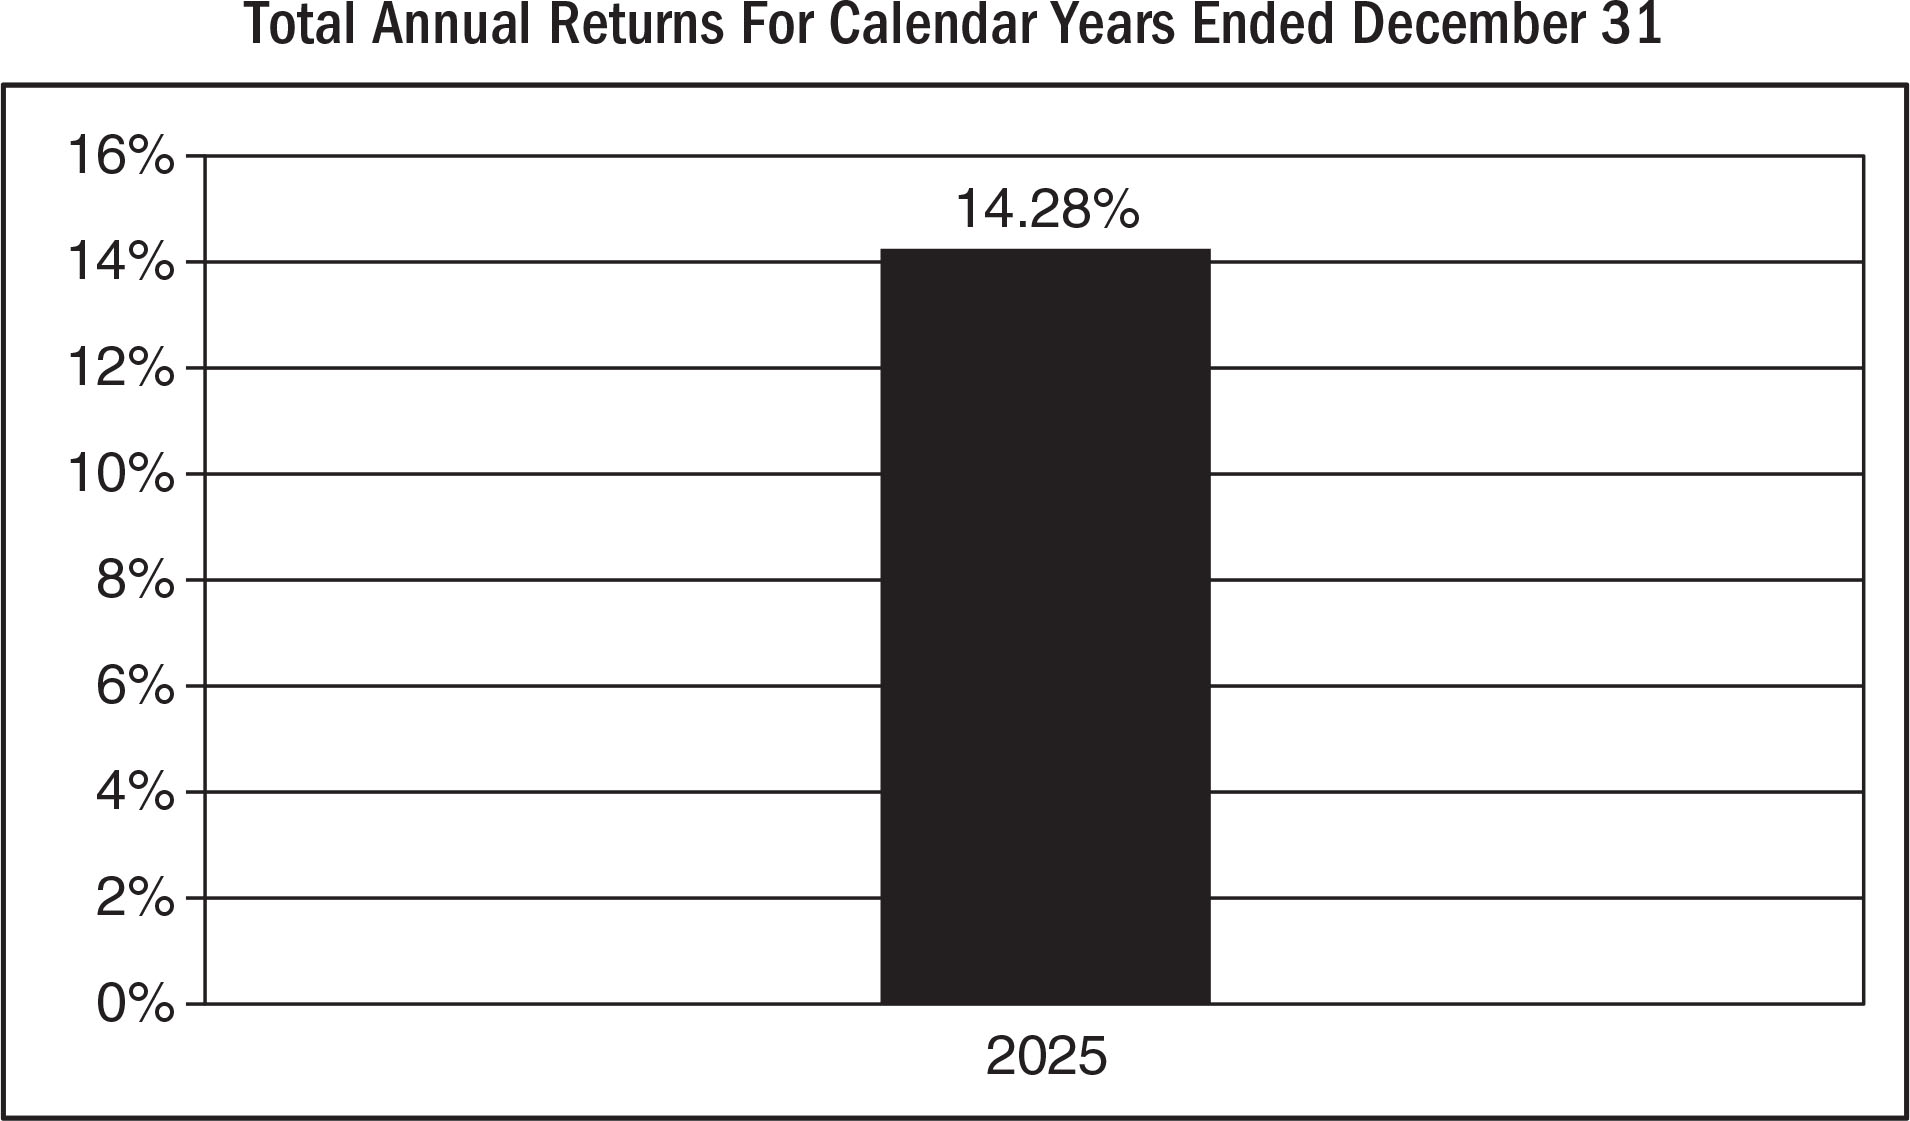
| Years |
Returns |
| 2025 |
14.28% |
|
| Bar Chart Closing [Text Block] |
As of June 30, 2026, the Fund’s calendar year-to-date total return was 6.48%.
Best and Worst Quarter Returns (for the period reflected in the bar chart above)
| |
Return |
Quarter Ended/Year |
| Highest Return |
6.43% |
9/30/2025 |
| Lowest Return |
-0.74% |
3/31/2025 |
|
| Year to Date Return, Label [Optional Text] |
year-to-date total return
|
| Bar Chart, Year to Date Return |
6.48%
|
| Bar Chart, Year to Date Return, Date |
Jun. 30, 2026
|
| Highest Quarterly Return, Label [Optional Text] |
Highest Return
|
| Highest Quarterly Return |
6.43%
|
| Highest Quarterly Return, Date |
Sep. 30, 2025
|
| Lowest Quarterly Return, Label [Optional Text] |
Lowest Return
|
| Lowest Quarterly Return |
(0.74%)
|
| Lowest Quarterly Return, Date |
Mar. 31, 2025
|
| Performance Table Heading |
Average Annual Total Returns for the periods ended December 31, 2025
|
| Performance Table Uses Highest Federal Rate |
After-tax returns for the Fund are calculated using the historical highest individual federal marginal income tax rates and do not reflect the impact of state and local taxes.
|
| Performance Table Not Relevant to Tax Deferred |
Actual after-tax returns depend on an investor’s tax situation and may differ from those shown. After-tax returns shown are not relevant to investors who hold shares through tax-deferred arrangements, such as 401(k) plans or individual retirement plans.
|
| Performance [Table] |
| KraneShares Hedgeye Hedged Equity Index ETF |
1 year |
Since Inception
(07-15-2024) |
| Return Before Taxes |
14.28% |
12.29% |
| Return After Taxes on Distributions |
11.45% |
10.04% |
| Return After Taxes on Distributions and Sale of Fund Shares |
8.45% |
8.49% |
S&P 500 Index
(Reflects no deduction for fees, expenses or taxes) |
17.88% |
15.77% |
Hedgeye Hedged Equity Index
(Reflects no deduction for fees, expenses or taxes) |
15.96% |
13.93% |
S&P 500 Index (Reflects no deduction for fees, expenses or taxes)
Hedgeye Hedged Equity Index (Reflects no deduction for fees, expenses or taxes)
|
| Performance Table Closing [Text Block] |
Average annual total returns are shown on a before- and after-tax basis for the Fund. After-tax returns for the Fund are calculated using the historical highest individual federal marginal income tax rates and do not reflect the impact of state and local taxes. Actual after-tax returns depend on an investor’s tax situation and may differ from those shown. After-tax returns shown are not relevant to investors who hold shares through tax-deferred arrangements, such as 401(k) plans or individual retirement plans.
|
| Performance Availability Website Address [Text] |
www.kraneshares.com
|
| KraneShares High-Bandwidth Memory ETF |
|
| Prospectus [Line Items] |
|
| Bar Chart and Performance Table [Heading] |
Performance Information
|
| Performance Narrative [Text Block] |
Once the Fund has completed a full calendar year of operations, a bar chart and table will be included in this Prospectus that will provide some indication of the risks of investing in the Fund by showing the variability of the Fund’s return based on net assets and comparing the variability of the Fund’s return to a broad measure of market performance. Once available, the Fund’s current performance information will be available at www.kraneshares.com. Past performance does not necessarily indicate how the Fund will perform in the future.
|
| Performance Past Does Not Indicate Future [Text] |
Past performance does not necessarily indicate how the Fund will perform in the future.
|
| Performance Information Illustrates Variability of Returns [Text] |
Once the Fund has completed a full calendar year of operations, a bar chart and table will be included in this Prospectus that will provide some indication of the risks of investing in the Fund by showing the variability of the Fund’s return based on net assets and comparing the variability of the Fund’s return to a broad measure of market performance.
|
| Performance Availability Website Address [Text] |
www.kraneshares.com
|
| KraneShares InspereX Nasdaq Dynamic Buffered High Income Index ETF |
|
| Prospectus [Line Items] |
|
| Bar Chart and Performance Table [Heading] |
Performance Information
|
| Performance Narrative [Text Block] |
Once the Fund has completed a full calendar year of operations, a bar chart and table will be included in this Prospectus that will provide some indication of the risks of investing in the Fund by showing the variability of the Fund’s return based on net assets and comparing the variability of the Fund’s return to a broad measure of market performance. Once available, the Fund’s current performance information will be available at www.kraneshares.com. Past performance does not necessarily indicate how the Fund will perform in the future.
|
| Performance Past Does Not Indicate Future [Text] |
Past performance does not necessarily indicate how the Fund will perform in the future.
|
| Performance Information Illustrates Variability of Returns [Text] |
Once the Fund has completed a full calendar year of operations, a bar chart and table will be included in this Prospectus that will provide some indication of the risks of investing in the Fund by showing the variability of the Fund’s return based on net assets and comparing the variability of the Fund’s return to a broad measure of market performance.
|
| Performance Availability Website Address [Text] |
www.kraneshares.com.
|
| KraneShares KWEB Covered Call Strategy ETF |
|
| Prospectus [Line Items] |
|
| Bar Chart and Performance Table [Heading] |
Performance Information
|
| Performance Narrative [Text Block] |
The following bar chart and table illustrate the variability of the Fund’s returns and indicate the risks of investing in the Fund by showing how the Fund’s average annual total returns compare with those of a broad measure of market performance and an additional index with characteristics relevant to the Fund. All returns include the reinvestment of dividends and distributions. As always, please note that the Fund’s past performance (before and after taxes) is not necessarily an indication of how it will perform in the future. Updated performance information is available at no cost by visiting www.kraneshares.com.
|
| Performance Past Does Not Indicate Future [Text] |
As always, please note that the Fund’s past performance (before and after taxes) is not necessarily an indication of how it will perform in the future.
|
| Performance Information Illustrates Variability of Returns [Text] |
The following bar chart and table illustrate the variability of the Fund’s returns and indicate the risks of investing in the Fund by showing how the Fund’s average annual total returns compare with those of a broad measure of market performance and an additional index with characteristics relevant to the Fund.
|
| Bar Chart [Heading] |
Total Annual Returns For Calendar Years Ended December 31
|
| Bar Chart [Table] |
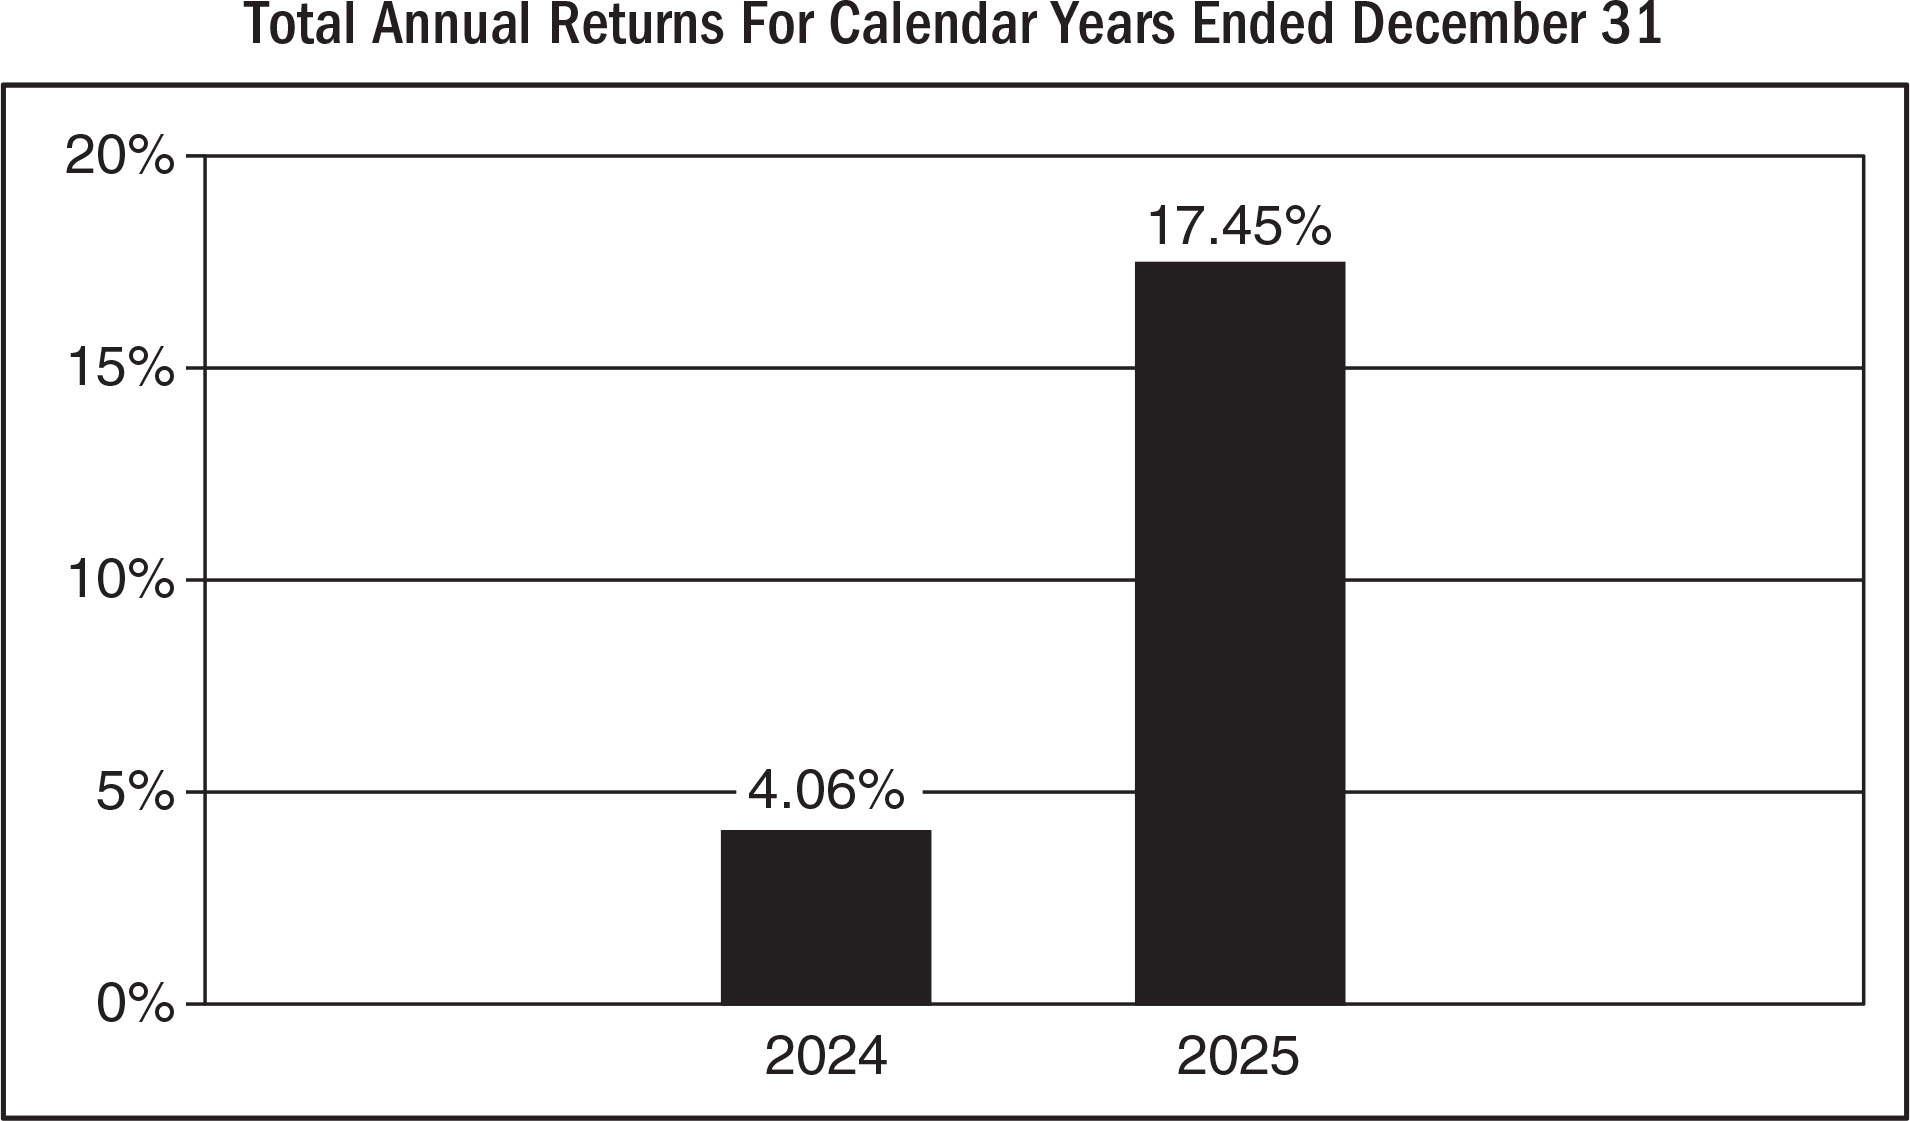
| Years |
Returns |
| 2024 |
4.06% |
| 2025 |
17.45% |
|
| Bar Chart Closing [Text Block] |
As of June 30, 2026, the Fund’s calendar year-to-date total return was -14.14%.
Best and Worst Quarter Returns (for the period reflected in the bar chart above)
| |
Return |
Quarter Ended/Year |
| Highest Return |
10.21% |
9/30/2025 |
| Lowest Return |
-3.13% |
12/31/2025 |
|
| Year to Date Return, Label [Optional Text] |
year-to-date total return
|
| Bar Chart, Year to Date Return |
14.14%
|
| Bar Chart, Year to Date Return, Date |
Jun. 30, 2026
|
| Highest Quarterly Return, Label [Optional Text] |
Highest Return
|
| Highest Quarterly Return |
10.21%
|
| Highest Quarterly Return, Date |
Sep. 30, 2025
|
| Lowest Quarterly Return, Label [Optional Text] |
Lowest Return
|
| Lowest Quarterly Return |
(3.13%)
|
| Lowest Quarterly Return, Date |
Dec. 31, 2025
|
| Performance Table Heading |
Average Annual Total Returns for the periods ended December 31, 2025
|
| Performance Table Uses Highest Federal Rate |
After-tax returns for the Fund are calculated using the historical highest individual federal marginal income tax rates and do not reflect the impact of state and local taxes.
|
| Performance Table Not Relevant to Tax Deferred |
Actual after-tax returns depend on an investor’s tax situation and may differ from those shown. After-tax returns shown are not relevant to investors who hold shares through tax-deferred arrangements, such as 401(k) plans or individual retirement plans.
|
| Performance [Table] |
| KraneShares KWEB Covered Call Strategy ETF |
1 year |
Since Inception
(01-11-2023) |
| Return Before Taxes |
17.45% |
10.17% |
| Return After Taxes on Distributions |
9.09% |
-3.68% |
| Return After Taxes on Distributions and Sale of Fund Shares |
10.19% |
1.44% |
MSCI China All Shares Index
(Reflects no deduction for fees, expenses or taxes) |
28.94% |
6.93% |
CSI Overseas China Internet Index
(Reflects no deduction for fees, expenses or taxes) |
23.29% |
3.07% |
MSCI China All Shares Index (Reflects no deduction for fees, expenses or taxes)
|
| Performance Table Closing [Text Block] |
Average annual total returns are shown on a before- and after-tax basis for the Fund. After-tax returns for the Fund are calculated using the historical highest individual federal marginal income tax rates and do not reflect the impact of state and local taxes. Actual after-tax returns depend on an investor’s tax situation and may differ from those shown. After-tax returns shown are not relevant to investors who hold shares through tax-deferred arrangements, such as 401(k) plans or individual retirement plans.
|
| Performance Availability Website Address [Text] |
www.kraneshares.com
|
| KraneShares Man Buyout Beta Index ETF |
|
| Prospectus [Line Items] |
|
| Bar Chart and Performance Table [Heading] |
Performance Information
|
| Performance Narrative [Text Block] |
The following bar chart and table illustrate the variability of the Fund’s returns and indicate the risks of investing in the Fund by showing how the Fund’s average annual total returns compare with those of a broad measure of market performance and an additional index with characteristics relevant to the Fund. All returns include the reinvestment of dividends and distributions. As always, please note that the Fund’s past performance (before and after taxes) is not necessarily an indication of how it will perform in the future. Updated performance information is available at no cost by visiting www.kraneshares.com.
|
| Performance Past Does Not Indicate Future [Text] |
As always, please note that the Fund’s past performance (before and after taxes) is not necessarily an indication of how it will perform in the future.
|
| Performance Information Illustrates Variability of Returns [Text] |
The following bar chart and table illustrate the variability of the Fund’s returns and indicate the risks of investing in the Fund by showing how the Fund’s average annual total returns compare with those of a broad measure of market performance and an additional index with characteristics relevant to the Fund.
|
| Bar Chart [Heading] |
Total Annual Returns For Calender Years Ended December 31
|
| Bar Chart [Table] |
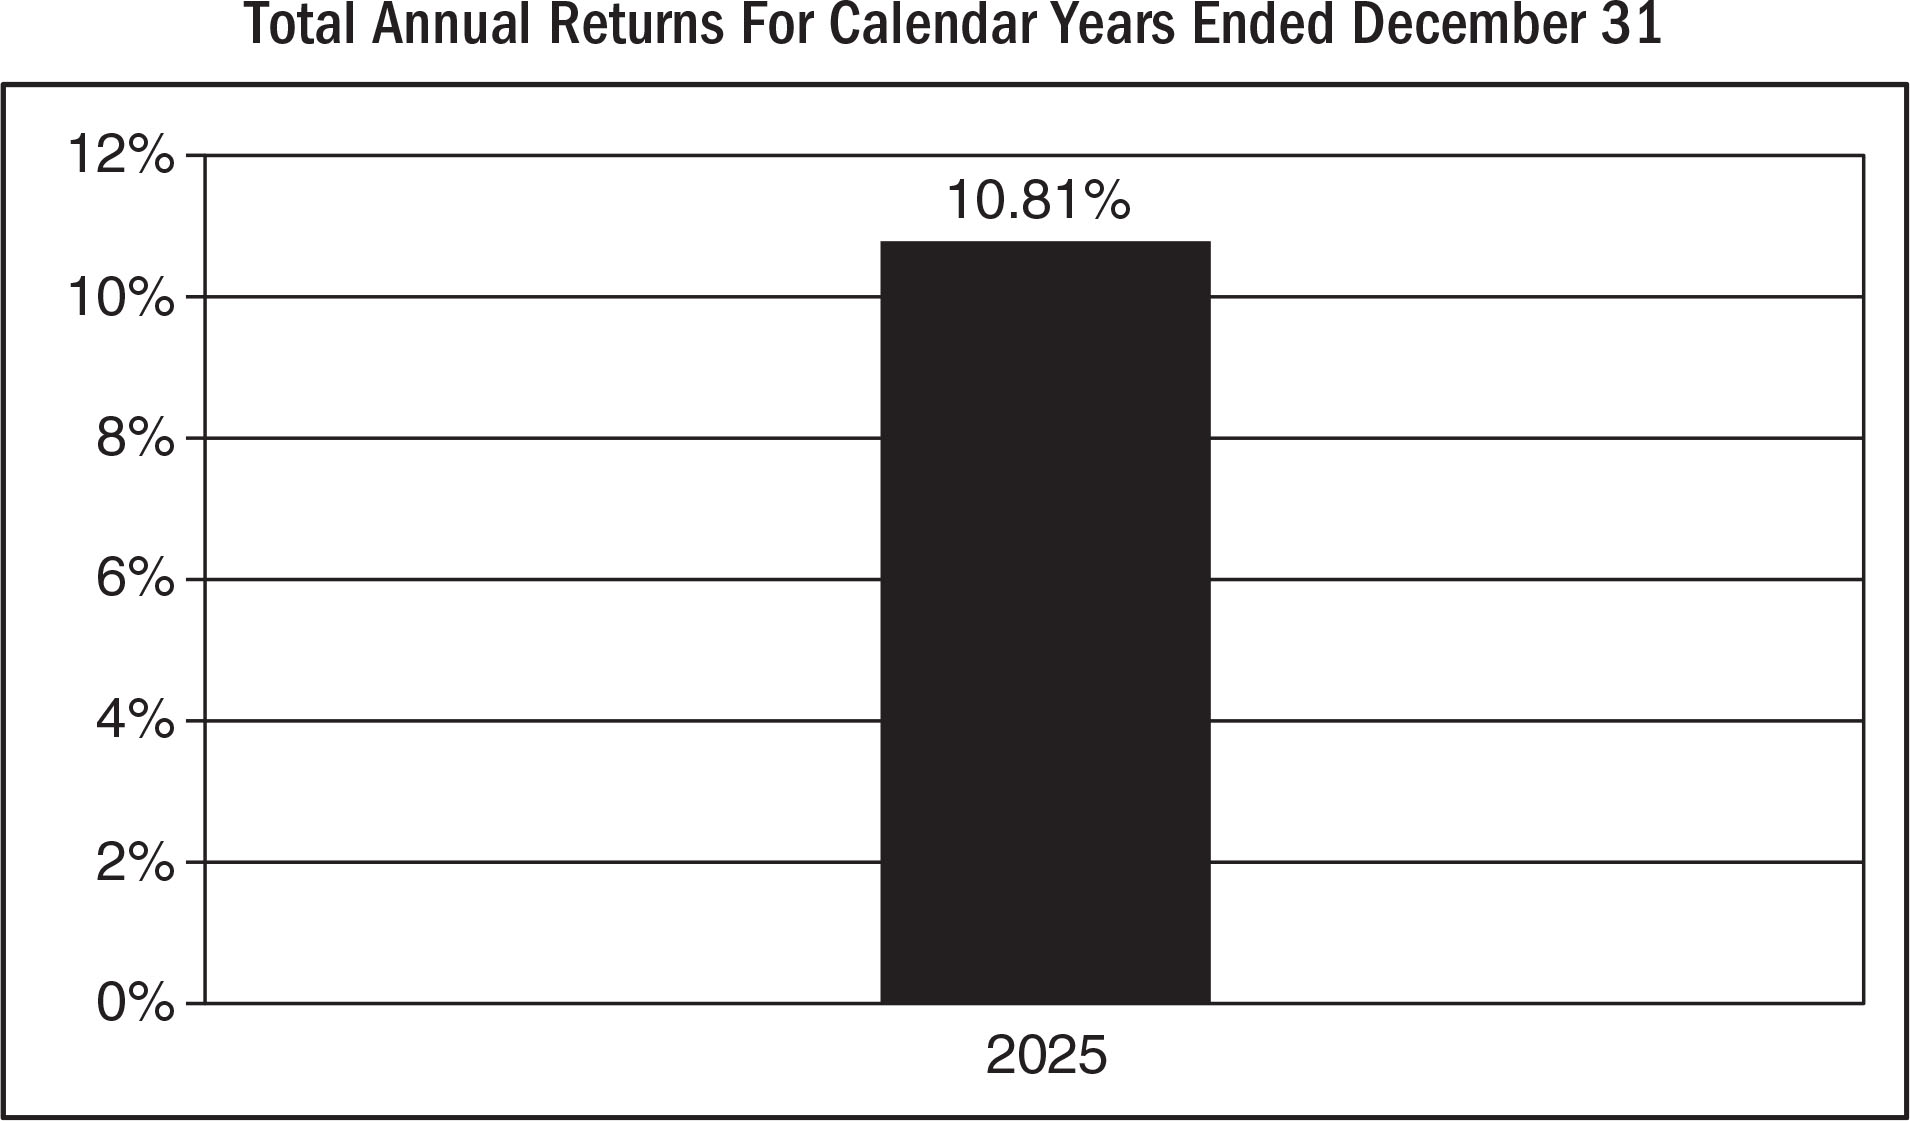
| Years |
Returns |
| 2025 |
10.81% |
|
| Bar Chart Closing [Text Block] |
As of June 30, 2026, the Fund’s calendar year-to-date total return was 21.22%.
Best and Worst Quarter Returns (for the period reflected in the bar chart above)
| |
Return |
Quarter Ended/Year |
| Highest Return |
10.35% |
6/30/2025 |
| Lowest Return |
-9.53% |
3/31/2025 |
|
| Year to Date Return, Label [Optional Text] |
year-to-date total return
|
| Bar Chart, Year to Date Return |
21.22%
|
| Bar Chart, Year to Date Return, Date |
Jun. 30, 2026
|
| Highest Quarterly Return, Label [Optional Text] |
Highest Return
|
| Highest Quarterly Return |
10.35%
|
| Highest Quarterly Return, Date |
Jun. 30, 2025
|
| Lowest Quarterly Return, Label [Optional Text] |
Lowest Return
|
| Lowest Quarterly Return |
(9.53%)
|
| Lowest Quarterly Return, Date |
Mar. 31, 2025
|
| Performance Table Heading |
Average Annual Total Returns for the periods ended December 31, 2025
|
| Performance Table Uses Highest Federal Rate |
After-tax returns for the Fund are calculated using the historical highest individual federal marginal income tax rates and do not reflect the impact of state and local taxes.
|
| Performance Table Not Relevant to Tax Deferred |
Actual after-tax returns depend on an investor’s tax situation and may differ from those shown. After-tax returns shown are not relevant to investors who hold shares through tax-deferred arrangements, such as 401(k) plans or individual retirement plans.
|
| Performance [Table] |
| KraneShares Man Buyout Beta Index ETF |
1 year |
Since Inception
(10-07-2024) |
| Return Before Taxes |
10.81% |
9.04% |
| Return After Taxes on Distributions |
10.81% |
9.03% |
| Return After Taxes on Distributions and Sale of Fund Shares |
6.40% |
6.90% |
Russell 3000 Index
(Reflects no deduction for fees, expenses or taxes) |
17.15% |
17.17% |
Man Buyout Beta Index
(Reflects no deduction for fees, expenses or taxes) |
11.90% |
10.07% |
Russell 3000 Index (Reflects no deduction for fees, expenses or taxes)
Man Buyout Beta Index (Reflects no deduction for fees, expenses or taxes)
|
| Performance Table Closing [Text Block] |
Average annual total returns are shown on a before- and after-tax basis for the Fund. After-tax returns for the Fund are calculated using the historical highest individual federal marginal income tax rates and do not reflect the impact of state and local taxes. Actual after-tax returns depend on an investor’s tax situation and may differ from those shown. After-tax returns shown are not relevant to investors who hold shares through tax-deferred arrangements, such as 401(k) plans or individual retirement plans.
|
| Performance Availability Website Address [Text] |
www.kraneshares.com
|
| KraneShares Mount Lucas Managed Futures Index Strategy ETF |
|
| Prospectus [Line Items] |
|
| Bar Chart and Performance Table [Heading] |
Performance Information
|
| Performance Narrative [Text Block] |
The following bar chart and table illustrate the variability of the Fund’s returns and indicate the risks of investing in the Fund by showing how the Fund’s average annual total returns compare with those of a broad measure of market performance and an additional index with characteristics relevant to the Fund. All returns include the reinvestment of dividends and distributions. As always, please note that the Fund’s past performance (before and after taxes) is not necessarily an indication of how it will perform in the future. Prior to April 1, 2022, the Fund was actively managed and sought to outperform the Index through investments in debt instruments. Updated performance information is available at no cost by visiting www.kraneshares.com.
|
| Performance Past Does Not Indicate Future [Text] |
As always, please note that the Fund’s past performance (before and after taxes) is not necessarily an indication of how it will perform in the future.
|
| Performance Information Illustrates Variability of Returns [Text] |
The following bar chart and table illustrate the variability of the Fund’s returns and indicate the risks of investing in the Fund by showing how the Fund’s average annual total returns compare with those of a broad measure of market performance and an additional index with characteristics relevant to the Fund
|
| Bar Chart [Heading] |
Total Annual Returns For Calender Years Ended December 31
|
| Bar Chart [Table] |
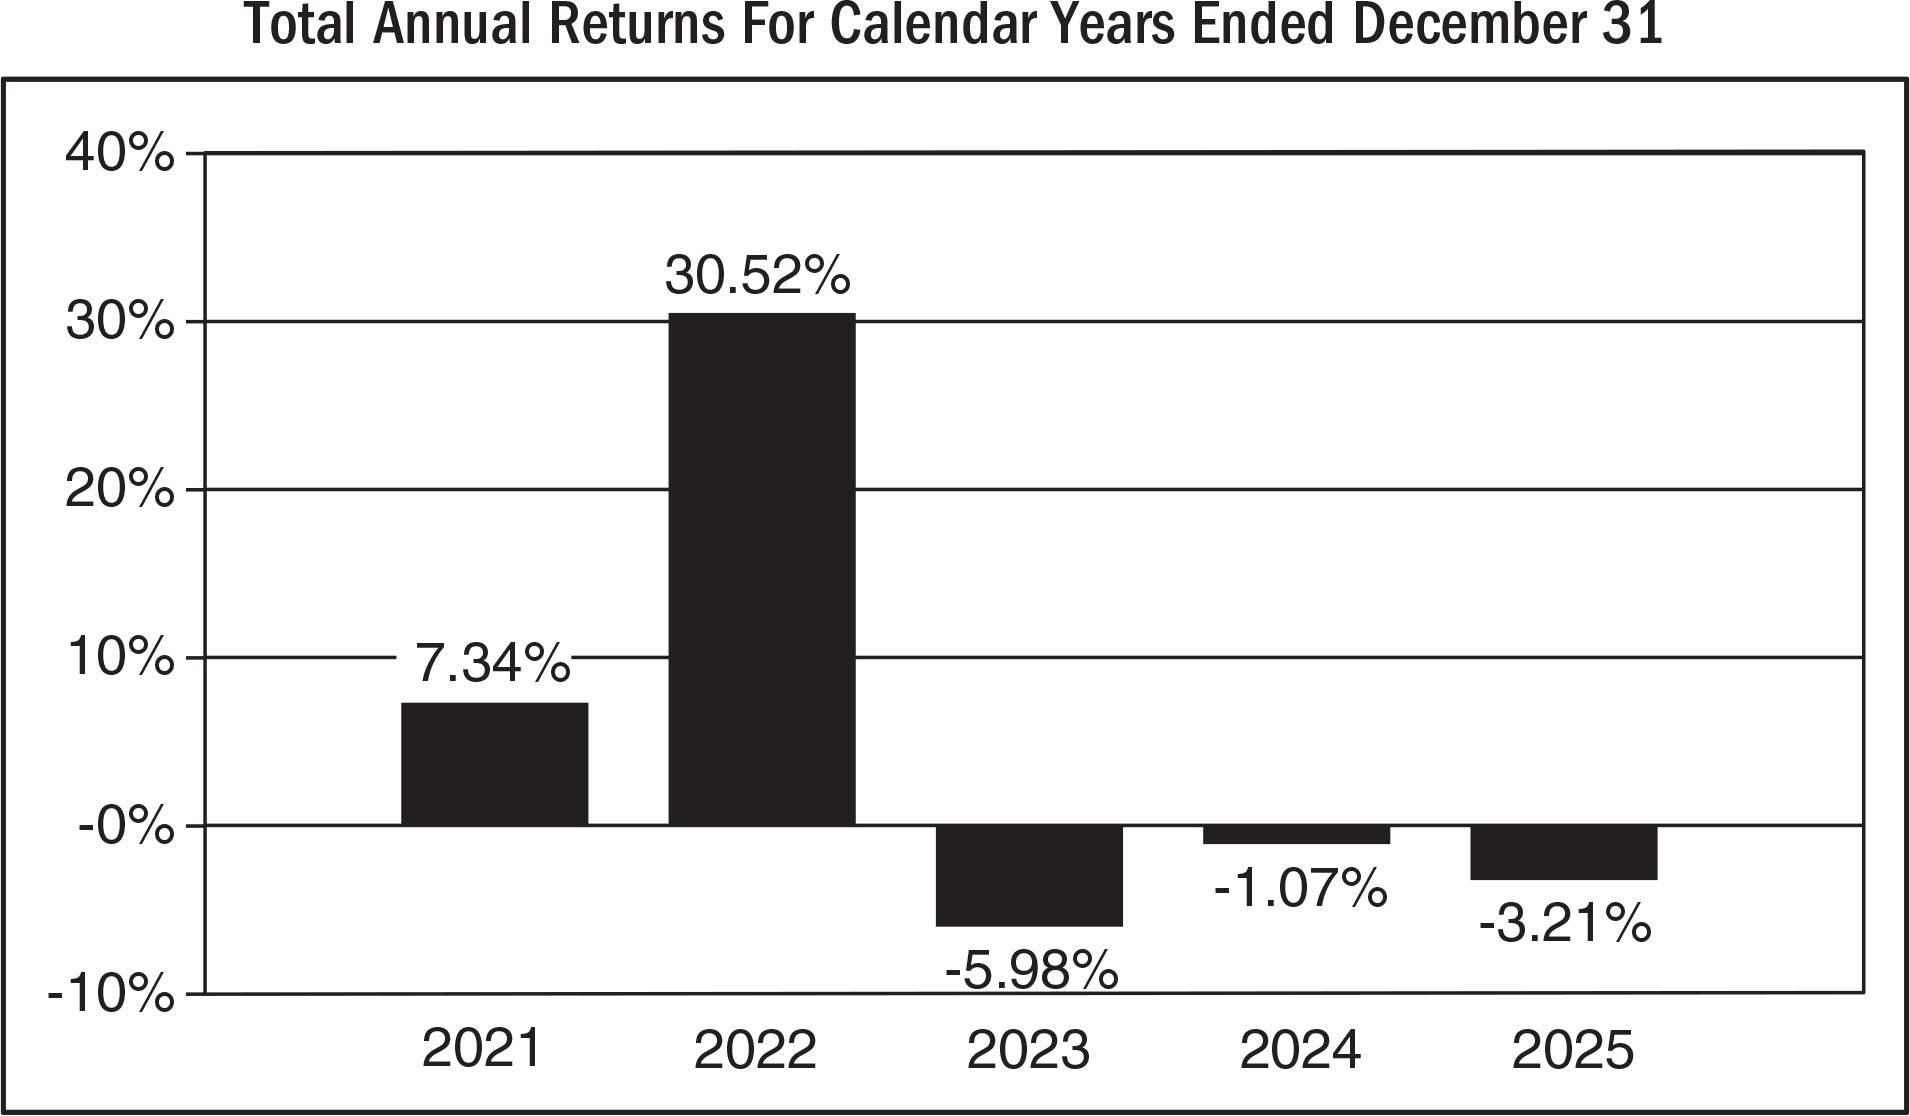
| Years |
Returns |
| 2021 |
7.34% |
| 2022 |
30.52% |
| 2023 |
-5.98% |
| 2024 |
-1.07% |
| 2025 |
-3.21% |
|
| Bar Chart Closing [Text Block] |
As of June 30, 2026, the Fund’s calendar year-to-date total return was 5.62%.
Best and Worst Quarter Returns (for the period reflected in the bar chart above)
| |
Return |
Quarter Ended/Year |
| Highest Return |
18.95% |
3/31/2022 |
| Lowest Return |
-11.32% |
12/31/2023 |
|
| Year to Date Return, Label [Optional Text] |
year-to-date total return
|
| Bar Chart, Year to Date Return |
5.62%
|
| Bar Chart, Year to Date Return, Date |
Jun. 30, 2026
|
| Highest Quarterly Return, Label [Optional Text] |
Highest Return
|
| Highest Quarterly Return |
18.95%
|
| Highest Quarterly Return, Date |
Mar. 31, 2022
|
| Lowest Quarterly Return, Label [Optional Text] |
Lowest Return
|
| Lowest Quarterly Return |
(11.32%)
|
| Lowest Quarterly Return, Date |
Dec. 31, 2023
|
| Performance Table Heading |
Average Annual Total Returns for the periods ended December 31, 2025
|
| Performance [Table] |
| KraneShares Mount Lucas Managed Futures Index Strategy ETF |
1 year |
5 years |
Since Inception
(12-1-2020) |
| Return Before Taxes |
-3.21% |
4.75% |
5.77% |
| Return After Taxes on Distributions |
-5.10% |
2.92% |
3.96% |
| Return After Taxes on Distributions and Sale of Fund Shares |
-1.90% |
3.06% |
3.88% |
Bloomberg Global Aggregate Index
(Reflects no deduction for fees, expenses or taxes) |
8.17% |
-2.15% |
-1.83% |
KFA MLM Index
(Reflects no deduction for fees, expenses or taxes) |
-1.69% |
6.76% |
7.77% |
Bloomberg Global Aggregate Index (Reflects no deduction for fees, expenses or taxes)
KFA MLM Index (Reflects no deduction for fees, expenses or taxes)
|
| Performance Availability Website Address [Text] |
www.kraneshares.com
|
| KraneShares MSCI All China Health Care Index ETF |
|
| Prospectus [Line Items] |
|
| Bar Chart and Performance Table [Heading] |
Performance Information
|
| Performance Narrative [Text Block] |
The following bar chart and table illustrate the variability of the Fund’s returns and indicate the risks of investing in the Fund by showing how the Fund’s average annual total returns compare with those of a broad measure of market performance and an additional index with characteristics relevant to the Fund. All returns include the reinvestment of dividends and distributions. As always, please note that the Fund’s past performance (before and after taxes) is not necessarily an indication of how it will perform in the future. Updated performance information is available at no cost by visiting www.kraneshares.com.
|
| Performance Past Does Not Indicate Future [Text] |
As always, please note that the Fund’s past performance (before and after taxes) is not necessarily an indication of how it will perform in the future.
|
| Performance Information Illustrates Variability of Returns [Text] |
The following bar chart and table illustrate the variability of the Fund’s returns and indicate the risks of investing in the Fund by showing how the Fund’s average annual total returns compare with those of a broad measure of market performance and an additional index with characteristics relevant to the Fund.
|
| Bar Chart [Heading] |
Total Annual Returns For Calender Years Ended December 31
|
| Bar Chart [Table] |
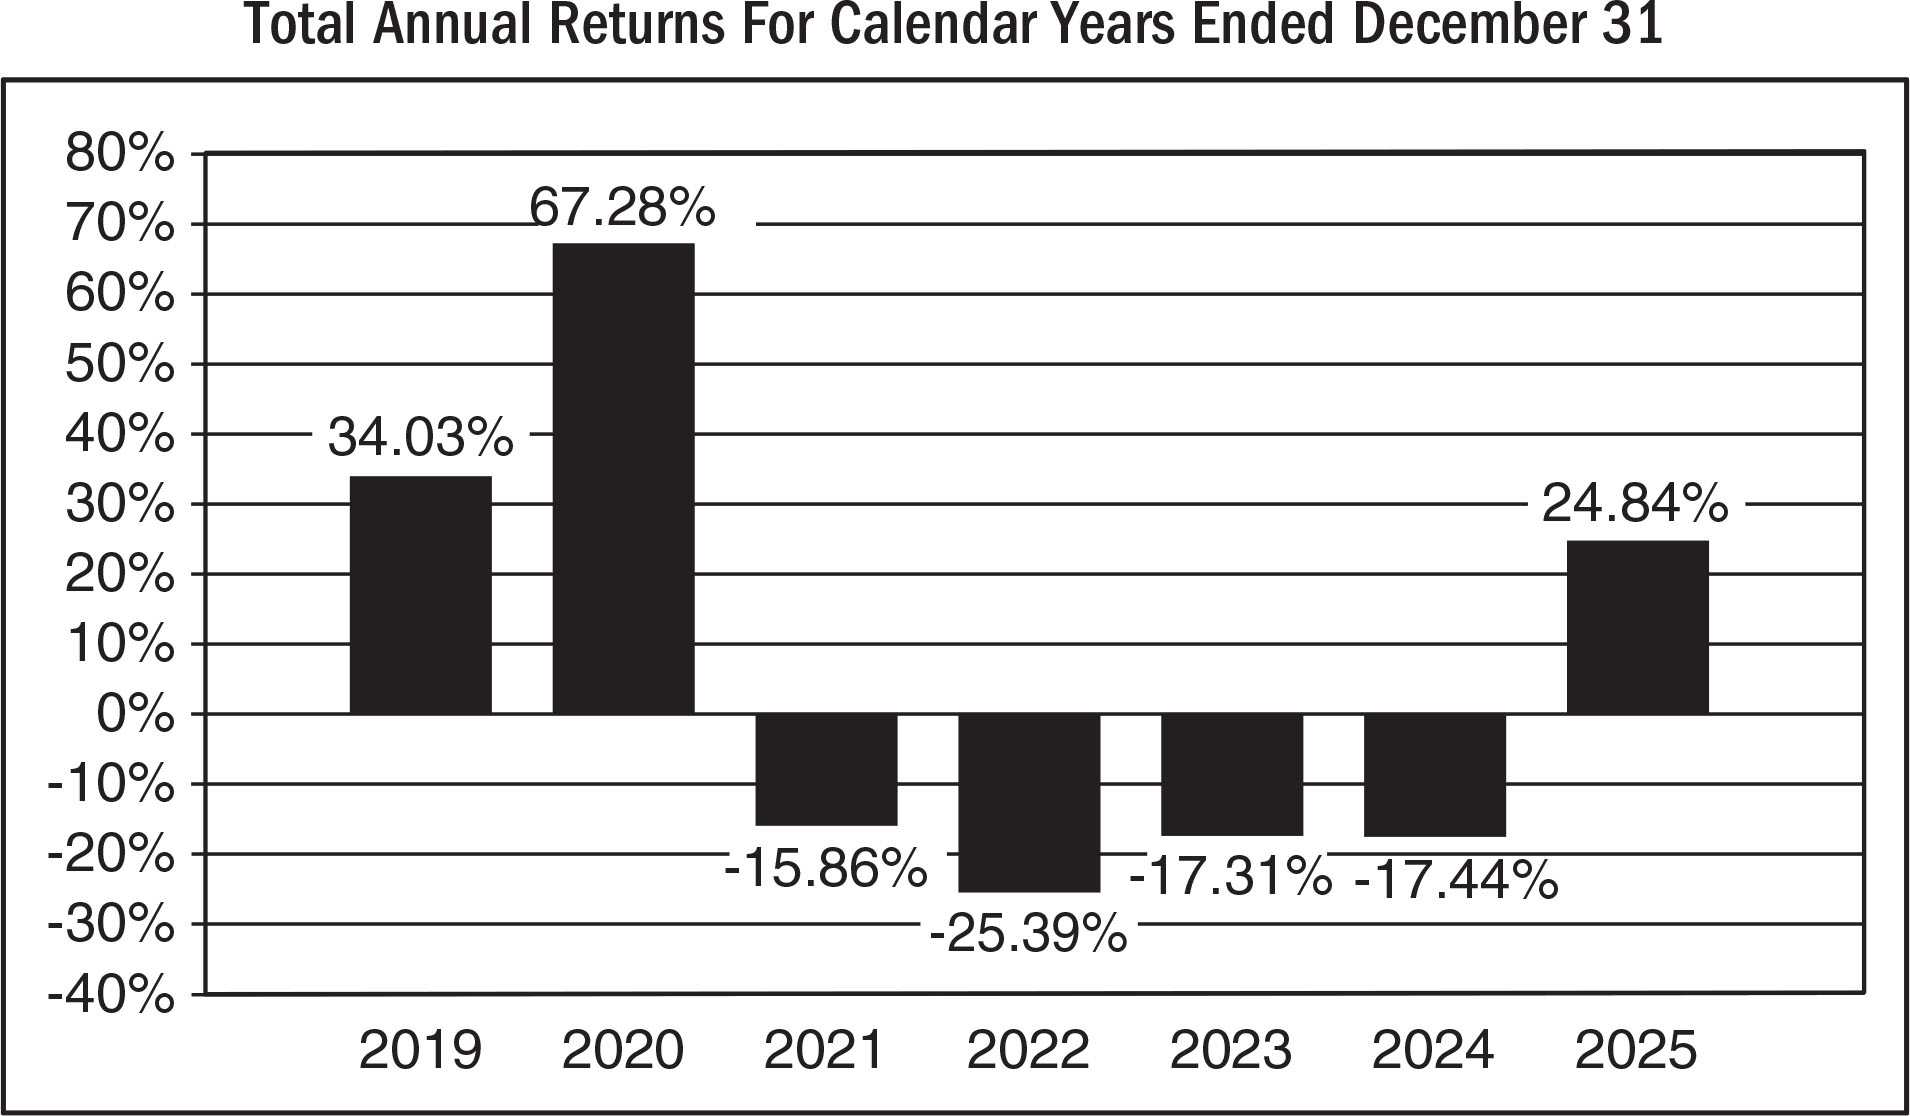
| Years |
Returns |
| 2019 |
34.03% |
| 2020 |
67.28% |
| 2021 |
-15.86% |
| 2022 |
-25.39% |
| 2023 |
-17.31% |
| 2024 |
-17.44% |
| 2025 |
24.84% |
|
| Bar Chart Closing [Text Block] |
As of June 30, 2026, the Fund’s calendar year-to-date total return was -8.80%.
Best and Worst Quarter Returns (for the period reflected in the bar chart above)
| |
Return |
Quarter Ended/Year |
| Highest Return |
33.43% |
6/30/2020 |
| Lowest Return |
-23.35% |
9/30/2022 |
|
| Year to Date Return, Label [Optional Text] |
year-to-date total return
|
| Bar Chart, Year to Date Return |
(8.80%)
|
| Bar Chart, Year to Date Return, Date |
Jun. 30, 2026
|
| Highest Quarterly Return, Label [Optional Text] |
Highest Return
|
| Highest Quarterly Return |
33.43%
|
| Highest Quarterly Return, Date |
Jun. 30, 2020
|
| Lowest Quarterly Return, Label [Optional Text] |
Lowest Return
|
| Lowest Quarterly Return |
(23.35%)
|
| Lowest Quarterly Return, Date |
Sep. 30, 2022
|
| Performance Table Heading |
Average Annual Total Returns for the periods ended December 31, 2025
|
| Performance Table Uses Highest Federal Rate |
After-tax returns for the Fund are calculated using the historical highest individual federal marginal income tax rates and do not reflect the impact of state and local taxes.
|
| Performance Table Not Relevant to Tax Deferred |
Actual after-tax returns depend on an investor’s tax situation and may differ from those shown. After-tax returns shown are not relevant to investors who hold shares through tax-deferred arrangements, such as 401(k) plans or individual retirement plans.
|
| Performance [Table] |
| KraneShares MSCI All China Health Care Index ETF |
1 year |
5 years |
Since Inception
(1-31-2018) |
| Return Before Taxes |
24.84% |
-11.76% |
-2.18% |
| Return After Taxes on Distributions |
23.15% |
-12.57% |
-2.76% |
| Return After Taxes on Distributions and Sale of Fund Shares |
15.03% |
-8.22% |
-1.50% |
MSCI China All Shares Index
(Reflects no deduction for fees, expenses or taxes) |
28.94% |
-2.45% |
0.50% |
MSCI China All Shares Health Care 10/40 Index
(Reflects reinvested dividends net of withholding taxes, but reflects no deduction for fees, expenses or other taxes) |
25.42% |
-11.03% |
-1.47% |
MSCI China All Shares Index (Reflects no deduction for fees, expenses or taxes)
MSCI China All Shares Health Care 10/40 Index (Reflects reinvested dividends net of withholding taxes, but reflects no deduction for fees, expenses or other taxes)
|
| Performance Table Closing [Text Block] |
Average annual total returns are shown on a before- and after-tax basis for the Fund. After-tax returns for the Fund are calculated using the historical highest individual federal marginal income tax rates and do not reflect the impact of state and local taxes. Actual after-tax returns depend on an investor’s tax situation and may differ from those shown. After-tax returns shown are not relevant to investors who hold shares through tax-deferred arrangements, such as 401(k) plans or individual retirement plans.
|
| Performance Availability Website Address [Text] |
www.kraneshares.com
|
| KraneShares MSCI China Clean Technology Index ETF |
|
| Prospectus [Line Items] |
|
| Bar Chart and Performance Table [Heading] |
Performance Information
|
| Performance Narrative [Text Block] |
The following bar chart and table illustrate the variability of the Fund’s returns and indicate the risks of investing in the Fund by showing how the Fund’s average annual total returns compare with those of a broad measure of market performance and an additional index with characteristics relevant to the Fund. All returns include the reinvestment of dividends and distributions. As always, please note that the Fund’s past performance (before and after taxes) is not necessarily an indication of how it will perform in the future. Updated performance information is available at no cost by visiting www.kraneshares.com.
|
| Performance Past Does Not Indicate Future [Text] |
As always, please note that the Fund’s past performance (before and after taxes) is not necessarily an indication of how it will perform in the future.
|
| Performance Information Illustrates Variability of Returns [Text] |
The following bar chart and table illustrate the variability of the Fund’s returns and indicate the risks of investing in the Fund by showing how the Fund’s average annual total returns compare with those of a broad measure of market performance and an additional index with characteristics relevant to the Fund.
|
| Bar Chart [Heading] |
Total Annual Returns For Calender Years Ended December 31
|
| Bar Chart [Table] |
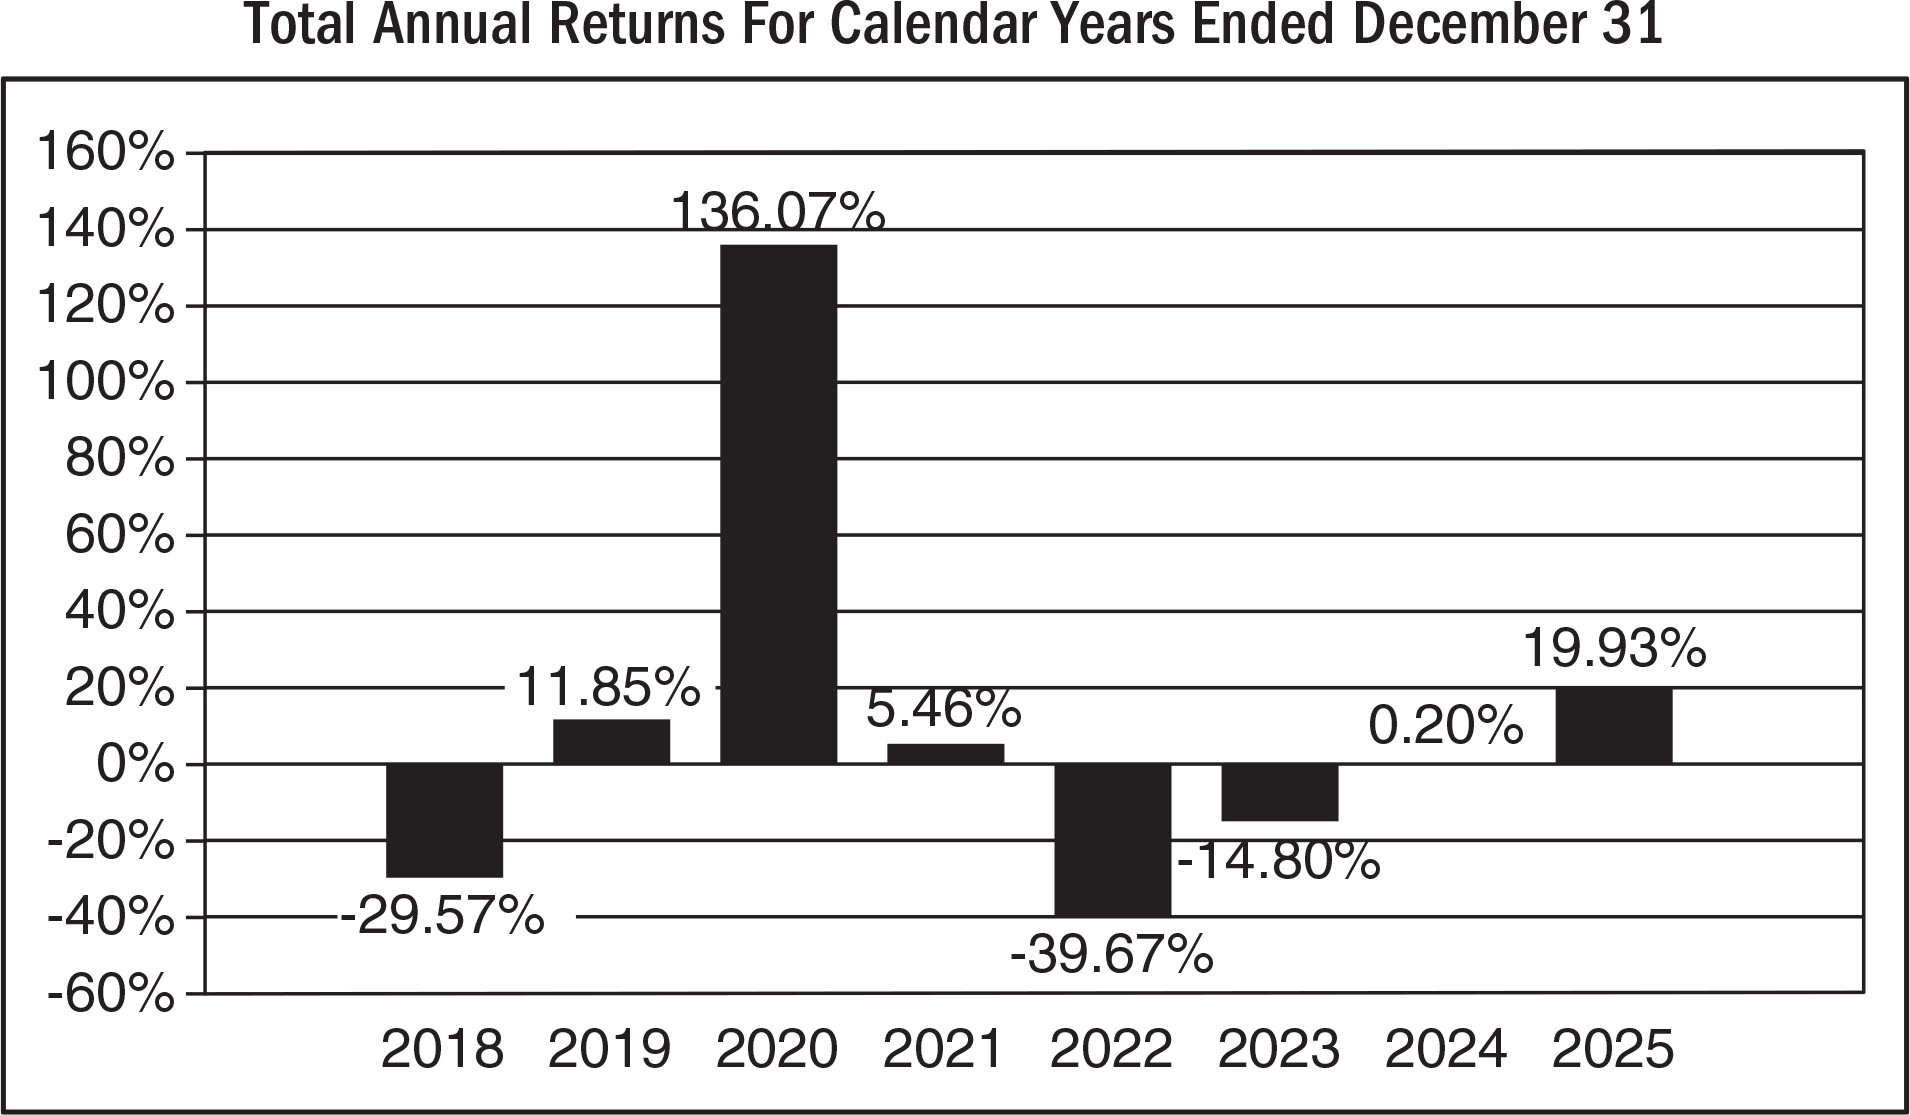
| Years |
Returns |
| 2018 |
-29.57% |
| 2019 |
11.85% |
| 2020 |
136.07% |
| 2021 |
5.46% |
| 2022 |
-39.67% |
| 2023 |
-14.80% |
| 2024 |
0.20% |
| 2025 |
19.93% |
|
| Bar Chart Closing [Text Block] |
As of June 30, 2026, the Fund’s calendar year-to-date total return was -13.22%.
Best and Worst Quarter Returns (for the period reflected in the bar chart above)
| |
Return |
Quarter Ended/Year |
| Highest Return |
43.63% |
9/30/2020 |
| Lowest Return |
-31.48% |
9/30/2022 |
|
| Year to Date Return, Label [Optional Text] |
year-to-date total return
|
| Bar Chart, Year to Date Return |
(13.22%)
|
| Bar Chart, Year to Date Return, Date |
Jun. 30, 2026
|
| Highest Quarterly Return, Label [Optional Text] |
Highest Return
|
| Highest Quarterly Return |
43.63%
|
| Highest Quarterly Return, Date |
Sep. 30, 2020
|
| Lowest Quarterly Return, Label [Optional Text] |
Lowest Return
|
| Lowest Quarterly Return |
(31.48%)
|
| Lowest Quarterly Return, Date |
Sep. 30, 2022
|
| Performance Table Heading |
Average Annual Total Returns for the periods ended December 31, 2025
|
| Performance Table Uses Highest Federal Rate |
After-tax returns for the Fund are calculated using the historical highest individual federal marginal income tax rates and do not reflect the impact of state and local taxes.
|
| Performance Table Not Relevant to Tax Deferred |
Actual after-tax returns depend on an investor’s tax situation and may differ from those shown. After-tax returns shown are not relevant to investors who hold shares through tax-deferred arrangements, such as 401(k) plans or individual retirement plans.
|
| Performance [Table] |
| KraneShares MSCI China Clean Technology Index ETF |
1 year |
5 years |
Since Inception
(10-12-2017) |
| Return Before Taxes |
19.93% |
-8.21% |
2.64% |
| Return After Taxes on Distributions |
19.80% |
-8.44% |
2.17% |
| Return After Taxes on Distributions and Sale of Fund Shares |
12.08% |
-5.98% |
1.90% |
MSCI China All Shares Index
(Reflects no deduction for fees, expenses or taxes) |
28.94% |
-2.45% |
2.02% |
MSCI China IMI Environment 10/40 Index (Net)
(Reflects reinvested dividends net of withholding taxes, but reflects no deduction for fees, expenses or other taxes) |
21.14% |
-8.44% |
2.06% |
MSCI China All Shares Index Reflects no deduction for fees, expenses or taxes)
MSCI China IMI Environment 10/40 Index (Net) (Reflects reinvested dividends net of withholding taxes, but reflects no deduction for fees, expenses or other taxes)
|
| Performance Table Closing [Text Block] |
Average annual total returns are shown on a before- and after-tax basis for the Fund. After-tax returns for the Fund are calculated using the historical highest individual federal marginal income tax rates and do not reflect the impact of state and local taxes. Actual after-tax returns depend on an investor’s tax situation and may differ from those shown. After-tax returns shown are not relevant to investors who hold shares through tax-deferred arrangements, such as 401(k) plans or individual retirement plans.
|
| Performance Availability Website Address [Text] |
www.kraneshares.com
|
| KraneShares MSCI Emerging Markets ex China Index ETF |
|
| Prospectus [Line Items] |
|
| Bar Chart and Performance Table [Heading] |
Performance Information
|
| Performance Narrative [Text Block] |
The following bar chart and table illustrate the variability of the Fund’s returns and indicate the risks of investing in the Fund by showing how the Fund’s average annual total returns compare with those of a broad measure of market performance and an additional index with characteristics relevant to the Fund. All returns include the reinvestment of dividends and distributions. As always, please note that the Fund’s past performance (before and after taxes) is not necessarily an indication of how it will perform in the future. Updated performance information is available at no cost by visiting www.kraneshares.com.
|
| Performance Past Does Not Indicate Future [Text] |
As always, please note that the Fund’s past performance (before and after taxes) is not necessarily an indication of how it will perform in the future.
|
| Performance Information Illustrates Variability of Returns [Text] |
The following bar chart and table illustrate the variability of the Fund’s returns and indicate the risks of investing in the Fund by showing how the Fund’s average annual total returns compare with those of a broad measure of market performance and an additional index with characteristics relevant to the Fund.
|
| Bar Chart [Heading] |
Total Annual Returns For Calender Years Ended December 31
|
| Bar Chart [Table] |
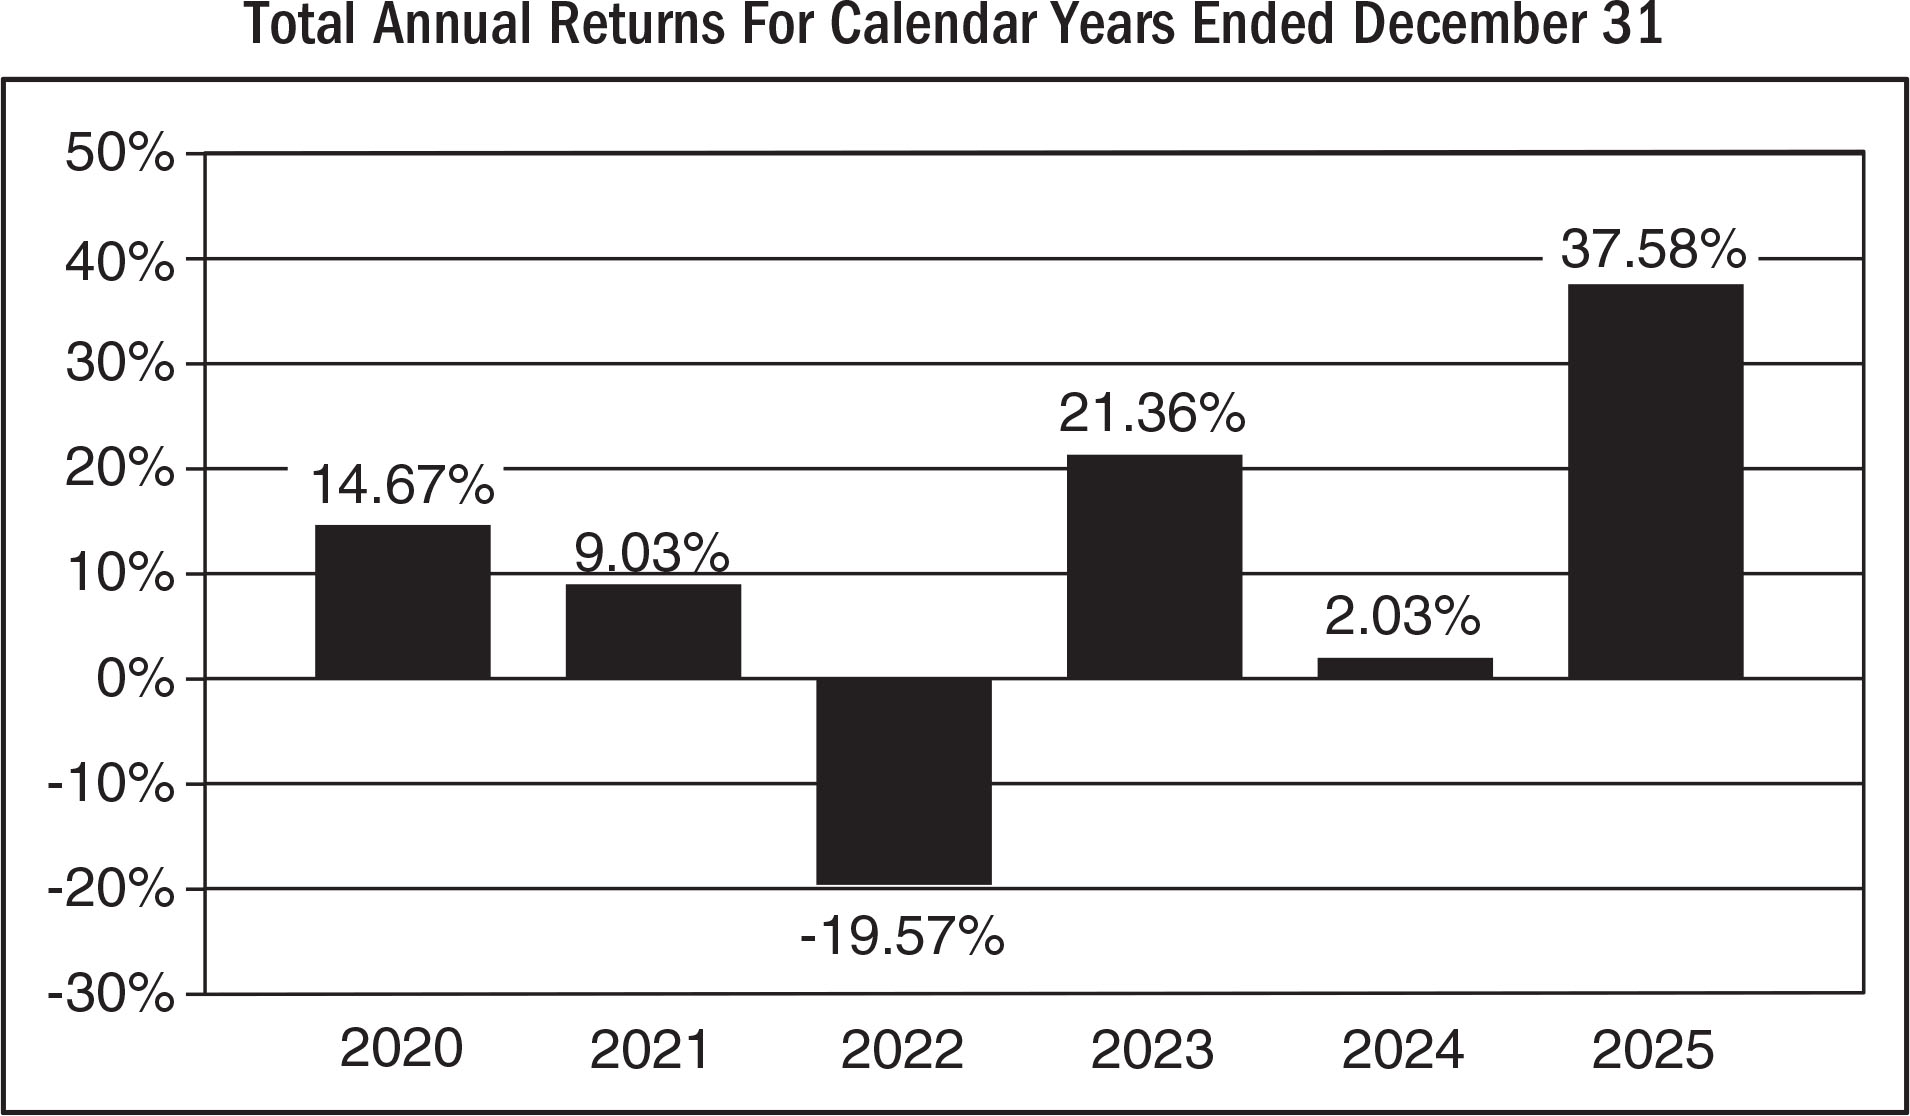
| Years |
Returns |
| 2020 |
14.67% |
| 2021 |
9.03% |
| 2022 |
-19.57% |
| 2023 |
21.36% |
| 2024 |
2.03% |
| 20025 |
37.58% |
|
| Bar Chart Closing [Text Block] |
As of June 30, 2026, the Fund’s calendar year-to-date total return was 37.75%.
Best and Worst Quarter Returns (for the period reflected in the bar chart above)
| |
Return |
Quarter Ended/Year |
| Highest Return |
27.71% |
12/31/2020 |
| Lowest Return |
-30.11% |
3/31/2020 |
|
| Year to Date Return, Label [Optional Text] |
year-to-date total return
|
| Bar Chart, Year to Date Return |
37.75%
|
| Bar Chart, Year to Date Return, Date |
Jun. 30, 2026
|
| Highest Quarterly Return, Label [Optional Text] |
Highest Return
|
| Highest Quarterly Return |
27.71%
|
| Highest Quarterly Return, Date |
Dec. 31, 2020
|
| Lowest Quarterly Return, Label [Optional Text] |
Lowest Return
|
| Lowest Quarterly Return |
(30.11%)
|
| Lowest Quarterly Return, Date |
Mar. 31, 2020
|
| Performance Table Heading |
Average Annual Total Returns for the periods ended December 31, 2025
|
| Performance Table Uses Highest Federal Rate |
After-tax returns for the Fund are calculated using the historical highest individual federal marginal income tax rates and do not reflect the impact of state and local taxes.
|
| Performance Table Not Relevant to Tax Deferred |
Actual after-tax returns depend on an investor’s tax situation and may differ from those shown. After-tax returns shown are not relevant to investors who hold shares through tax-deferred arrangements, such as 401(k) plans or individual retirement plans.
|
| Performance [Table] |
| KraneShares MSCI Emerging Markets ex China Index ETF |
1 year |
5 years |
Since Inception
(04-12-2019) |
| Return Before Taxes |
37.58% |
8.36% |
9.62% |
| Return After Taxes on Distributions |
36.61% |
7.49% |
8.78% |
| Return After Taxes on Distributions and Sale of Fund Shares |
23.05% |
6.42% |
7.53% |
MSCI Emerging Markets Index
(Reflects no deduction for fees, expenses or taxes) |
33.57% |
4.20% |
6.45% |
MSCI Emerging Markets ex China Index
(Reflects reinvested dividends net of withholding taxes, but reflects no deduction for fees, expenses or other taxes) |
34.61% |
8.25% |
8.93% |
MSCI Emerging Markets Index (Reflects no deduction for fees, expenses or taxes)
MSCI Emerging Markets ex China Index (Reflects reinvested dividends net of withholding taxes, but reflects no deduction for fees, expenses or other taxes)
|
| Performance Table Closing [Text Block] |
Average annual total returns are shown on a before- and after-tax basis for the Fund. After-tax returns for the Fund are calculated using the historical highest individual federal marginal income tax rates and do not reflect the impact of state and local taxes. Actual after-tax returns depend on an investor’s tax situation and may differ from those shown. After-tax returns shown are not relevant to investors who hold shares through tax-deferred arrangements, such as 401(k) plans or individual retirement plans.
|
| Performance Availability Website Address [Text] |
www.kraneshares.com
|
| KraneShares MSCI One Belt One Road Index ETF |
|
| Prospectus [Line Items] |
|
| Bar Chart and Performance Table [Heading] |
Performance Information
|
| Performance Narrative [Text Block] |
The following bar chart and table illustrate the variability of the Fund’s returns and indicate the risks of investing in the Fund by showing how the Fund’s average annual total returns compare with those of a broad measure of market performance and an additional index with characteristics relevant to the Fund. All returns include the reinvestment of dividends and distributions. As always, please note that the Fund’s past performance (before and after taxes) is not necessarily an indication of how it will perform in the future. Updated performance information is available at no cost by visiting www.kraneshares.com.
Total Annual Returns For Calender Years Ended December 31
|
| Performance Past Does Not Indicate Future [Text] |
As always, please note that the Fund’s past performance (before and after taxes) is not necessarily an indication of how it will perform in the future.
|
| Performance Information Illustrates Variability of Returns [Text] |
The following bar chart and table illustrate the variability of the Fund’s returns and indicate the risks of investing in the Fund by showing how the Fund’s average annual total returns compare with those of a broad measure of market performance and an additional index with characteristics relevant to the Fund.
|
| Bar Chart [Heading] |
Total Annual Returns For Calender Years Ended December 31
|
| Bar Chart [Table] |
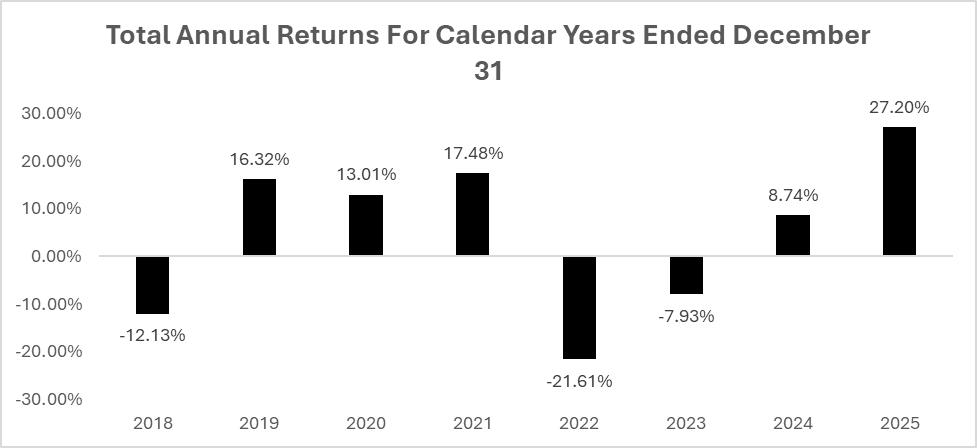
| Years |
Returns |
| 2018 |
-12.13% |
| 2019 |
16.32% |
| 2020 |
13.01% |
| 2021 |
17.48% |
| 2022 |
-21.61% |
| 2023 |
-7.93% |
| 2024 |
8.74% |
| 2025 |
27.20% |
|
| Bar Chart Closing [Text Block] |
As of June 30, 2026, the Fund’s calendar year-to-date total return was -1.80%.
Best
and Worst Quarter Returns (for the period reflected in the bar chart above)
| |
Return |
Quarter Ended/Year |
| Highest Return |
26.74% |
12/31/2020 |
| Lowest Return |
-26.85% |
3/31/2020 |
|
| Year to Date Return, Label [Optional Text] |
year-to-date total return
|
| Bar Chart, Year to Date Return |
(1.80%)
|
| Bar Chart, Year to Date Return, Date |
Jun. 30, 2026
|
| Highest Quarterly Return, Label [Optional Text] |
Highest Return
|
| Highest Quarterly Return |
26.74%
|
| Highest Quarterly Return, Date |
Dec. 31, 2020
|
| Lowest Quarterly Return, Label [Optional Text] |
Lowest Return
|
| Lowest Quarterly Return |
(26.85%)
|
| Lowest Quarterly Return, Date |
Mar. 31, 2020
|
| Performance Table Heading |
Average Annual Total Returns for the periods ended December 31, 2025
|
| Performance Table Uses Highest Federal Rate |
After-tax returns for the Fund are calculated using the historical highest individual federal marginal income tax rates and do not reflect the impact of state and local taxes.
|
| Performance Table Not Relevant to Tax Deferred |
Actual after-tax returns depend on an investor’s tax situation and may differ from those shown. After-tax returns shown are not relevant to investors who hold shares through tax-deferred arrangements, such as 401(k) plans or individual retirement plans.
|
| Performance [Table] |
| KraneShares MSCI One Belt One Road Index ETF |
1 year |
5 years |
Since Inception
(9-7-2017) |
| Return Before Taxes |
27.20% |
3.24% |
3.98% |
| Return After Taxes on Distributions |
26.91% |
2.70% |
3.51% |
| Return After Taxes on Distributions and Sale of Fund Shares |
16.80% |
2.67% |
3.30% |
MSCI ACWI
(Reflects no deduction for fees, expenses or taxes) |
22.34% |
11.19% |
11.29% |
MSCI Global China Infrastructure Exposure Index (Net)
(Reflects reinvested dividends net of withholding taxes, but reflects no deduction for fees, expenses or other taxes)* |
28.70% |
4.07% |
5.08% |
|
* |
The
MSCI Global China Infrastructure Exposure Index (Net) reflects the reinvestment of any cash distributions after deduction of any
withholding tax using the maximum rate applicable to non-resident institutional investors who do not benefit from double taxation
treaties. |
MSCI ACWI (Reflects no deduction for fees, expenses or taxes)
MSCI Global China Infrastructure Exposure Index (Net) (Reflects reinvested dividends net of withholding taxes, but reflects no deduction for fees, expenses or other taxes)
|
| Performance Table Closing [Text Block] |
Average annual total returns are shown on a before- and after-tax basis for the Fund. After-tax returns for the Fund are calculated using the historical highest individual federal marginal income tax rates and do not reflect the impact of state and local taxes. Actual after-tax returns depend on an investor’s tax situation and may differ from those shown. After-tax returns shown are not relevant to investors who hold shares through tax-deferred arrangements, such as 401(k) plans or individual retirement plans.
|
| Performance Availability Website Address [Text] |
www.kraneshares.com
|
| KraneShares Public-Private AI & Technology ETF |
|
| Prospectus [Line Items] |
|
| Bar Chart and Performance Table [Heading] |
Performance Information
|
| Performance Narrative [Text Block] |
The following bar chart and table illustrate the variability of the Fund’s returns and indicate the risks of investing in the Fund by showing how the Fund’s average annual total returns compare with those of a broad measure of market performance and an additional index with characteristics relevant to the Fund. All returns include the reinvestment of dividends and distributions. As always, please note that the Fund’s past performance (before and after taxes) is not necessarily an indication of how it will perform in the future. Updated performance information is available at no cost by visiting www.kraneshares.com.
|
| Performance Past Does Not Indicate Future [Text] |
As always, please note that the Fund’s past performance (before and after taxes) is not necessarily an indication of how it will perform in the future.
|
| Performance Information Illustrates Variability of Returns [Text] |
The following bar chart and table illustrate the variability of the Fund’s returns and indicate the risks of investing in the Fund by showing how the Fund’s average annual total returns compare with those of a broad measure of market performance and an additional index with characteristics relevant to the Fund.
|
| Bar Chart [Heading] |
Total Annual Returns For Calender Years Ended December 31
|
| Bar Chart [Table] |
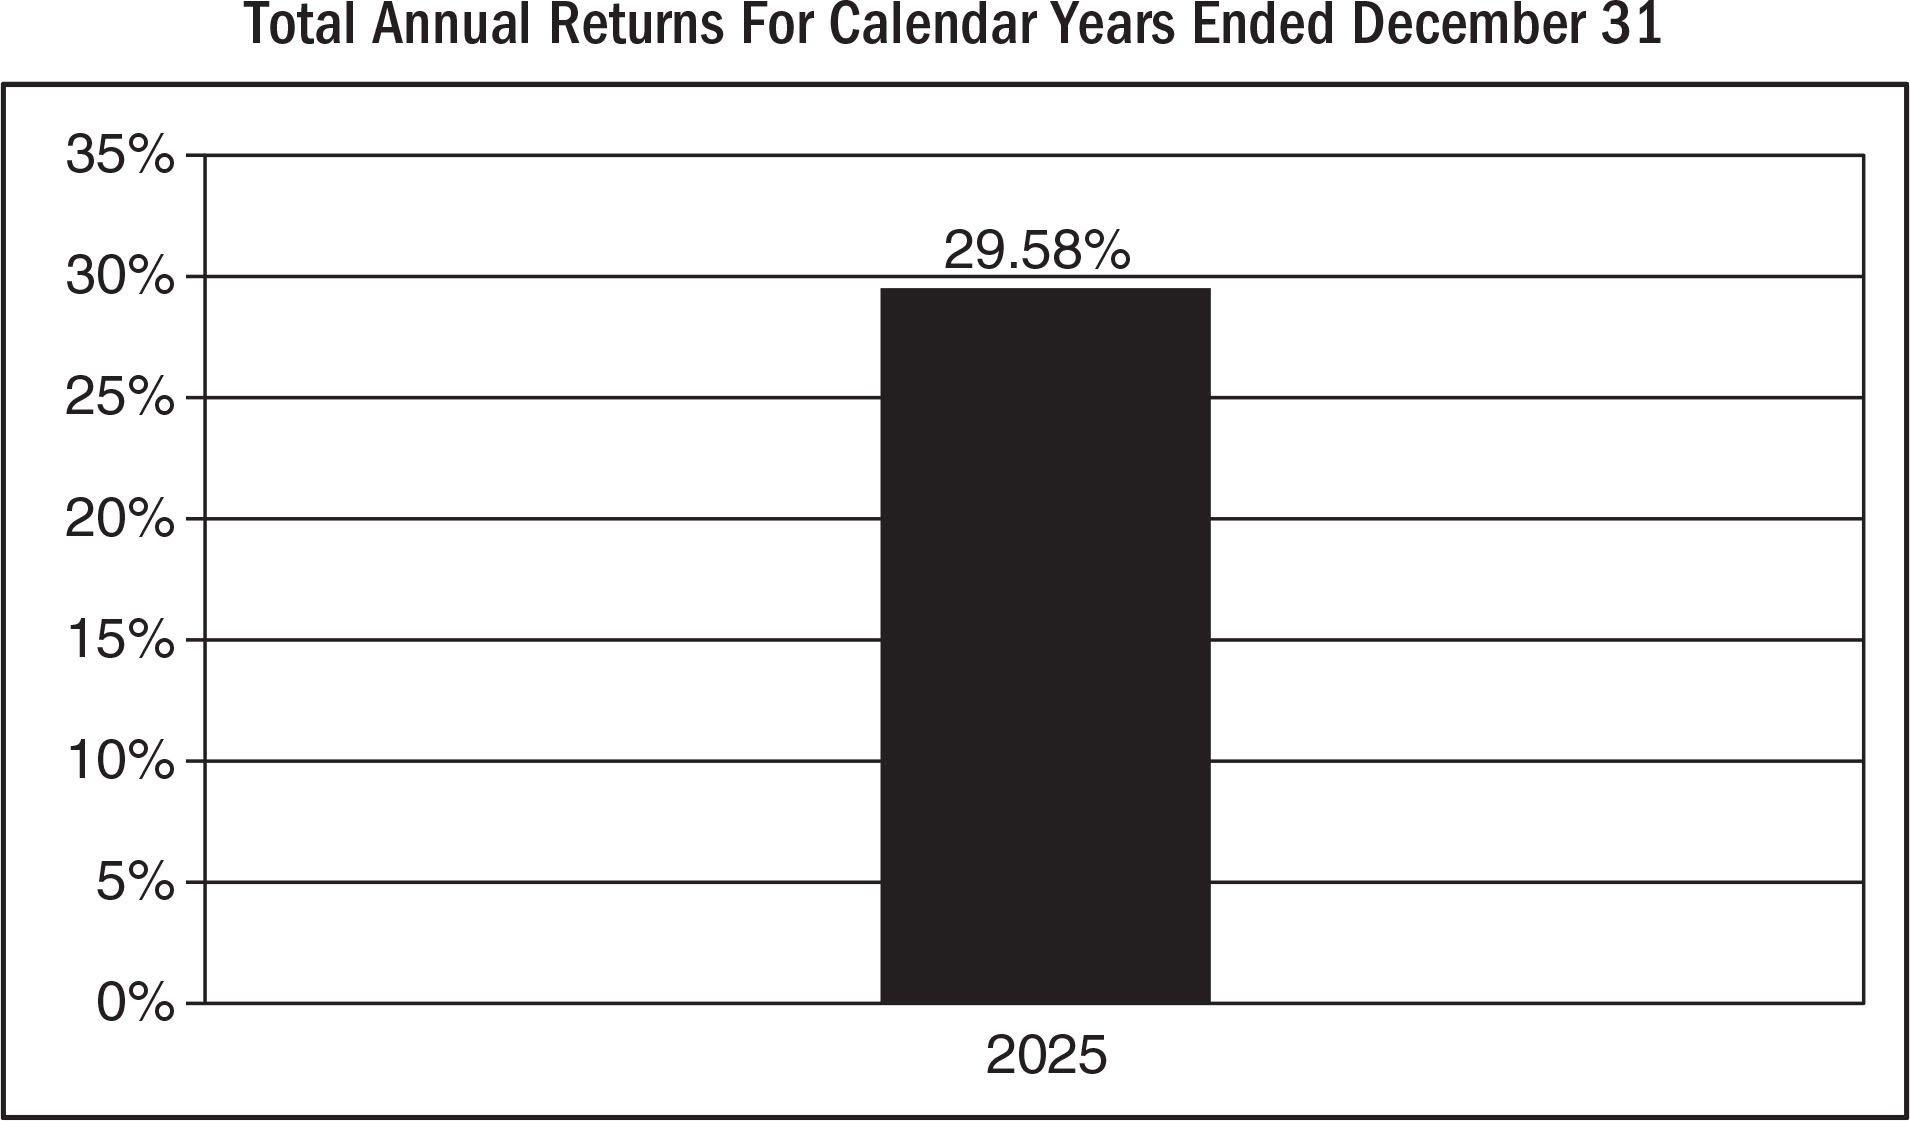
| Years |
Returns |
| 2025 |
29.58% |
|
| Bar Chart Closing [Text Block] |
As of June 30, 2026, the Fund’s calendar year-to-date total return was 28.85%.
Best and Worst Quarter Returns (for the period reflected in the bar chart above)
| |
Return |
Quarter Ended/Year |
| Highest Return |
28.01% |
6/30/2025 |
| Lowest Return |
-13.29% |
3/31/2025 |
|
| Year to Date Return, Label [Optional Text] |
year-to-date total return
|
| Bar Chart, Year to Date Return |
28.85%
|
| Bar Chart, Year to Date Return, Date |
Jun. 30, 2026
|
| Highest Quarterly Return, Label [Optional Text] |
Highest Return
|
| Highest Quarterly Return |
28.01%
|
| Highest Quarterly Return, Date |
Jun. 30, 2025
|
| Lowest Quarterly Return, Label [Optional Text] |
Lowest Return
|
| Lowest Quarterly Return |
(13.29%)
|
| Lowest Quarterly Return, Date |
Mar. 31, 2025
|
| Performance Table Heading |
Average Annual Total Returns for the periods ended December 31, 2025
|
| Performance Table Uses Highest Federal Rate |
After-tax returns for the Fund are calculated using the historical highest individual federal marginal income tax rates and do not reflect the impact of state and local taxes.
|
| Performance Table Not Relevant to Tax Deferred |
Actual after-tax returns depend on an investor’s tax situation and may differ from those shown. After-tax returns shown are not relevant to investors who hold shares through tax-deferred arrangements, such as 401(k) plans or individual retirement plans.
|
| Performance [Table] |
| KraneShares Public-Private AI & Technology ETF |
1 year |
Since Inception
(07-17-2024) |
| Return Before Taxes |
29.58% |
30.61% |
| Return After Taxes on Distributions |
29.17% |
30.21% |
| Return After Taxes on Distributions and Sale of Fund Shares |
17.73% |
23.57% |
S&P 500 Index
(Reflects no deduction for fees, expenses or taxes) |
17.88% |
16.44% |
Solactive Etna Artificial General Intelligence Index
(Reflects no deduction for fees, expenses or taxes) |
23.73% |
26.06% |
Solactive Etna Artificial General Intelligence Index (Reflects no deduction for fees, expenses or taxes)
S&P 500 Index (Reflects no deduction for fees, expenses or taxes)
|
| Performance Table Closing [Text Block] |
Average annual total returns are shown on a before- and after-tax basis for the Fund. After-tax returns for the Fund are calculated using the historical highest individual federal marginal income tax rates and do not reflect the impact of state and local taxes. Actual after-tax returns depend on an investor’s tax situation and may differ from those shown. After-tax returns shown are not relevant to investors who hold shares through tax-deferred arrangements, such as 401(k) plans or individual retirement plans.
|
| Performance Availability Website Address [Text] |
www.kraneshares.com
|
| KraneShares Public-Private Emerging Markets Internet and Technology ETF |
|
| Prospectus [Line Items] |
|
| Bar Chart and Performance Table [Heading] |
Performance Information
|
| Performance Narrative [Text Block] |
The following bar chart and table illustrate the variability of the Fund’s returns and indicate the risks of investing in the Fund by showing how the Fund’s average annual total returns compare with those of a broad measure of market performance and an additional index with characteristics relevant to the Fund. All returns include the reinvestment of dividends and distributions. As always, please note that the Fund’s past performance (before and after taxes) is not necessarily an indication of how it will perform in the future. Updated performance information is available at no cost by visiting www.kraneshares.com.
|
| Performance Past Does Not Indicate Future [Text] |
As always, please note that the Fund’s past performance (before and after taxes) is not necessarily an indication of how it will perform in the future.
|
| Performance Information Illustrates Variability of Returns [Text] |
The following bar chart and table illustrate the variability of the Fund’s returns and indicate the risks of investing in the Fund by showing how the Fund’s average annual total returns compare with those of a broad measure of market performance and an additional index with characteristics relevant to the Fund.
|
| Bar Chart [Heading] |
Total Annual Returns For Calender Years Ended December 31
|
| Bar Chart [Table] |
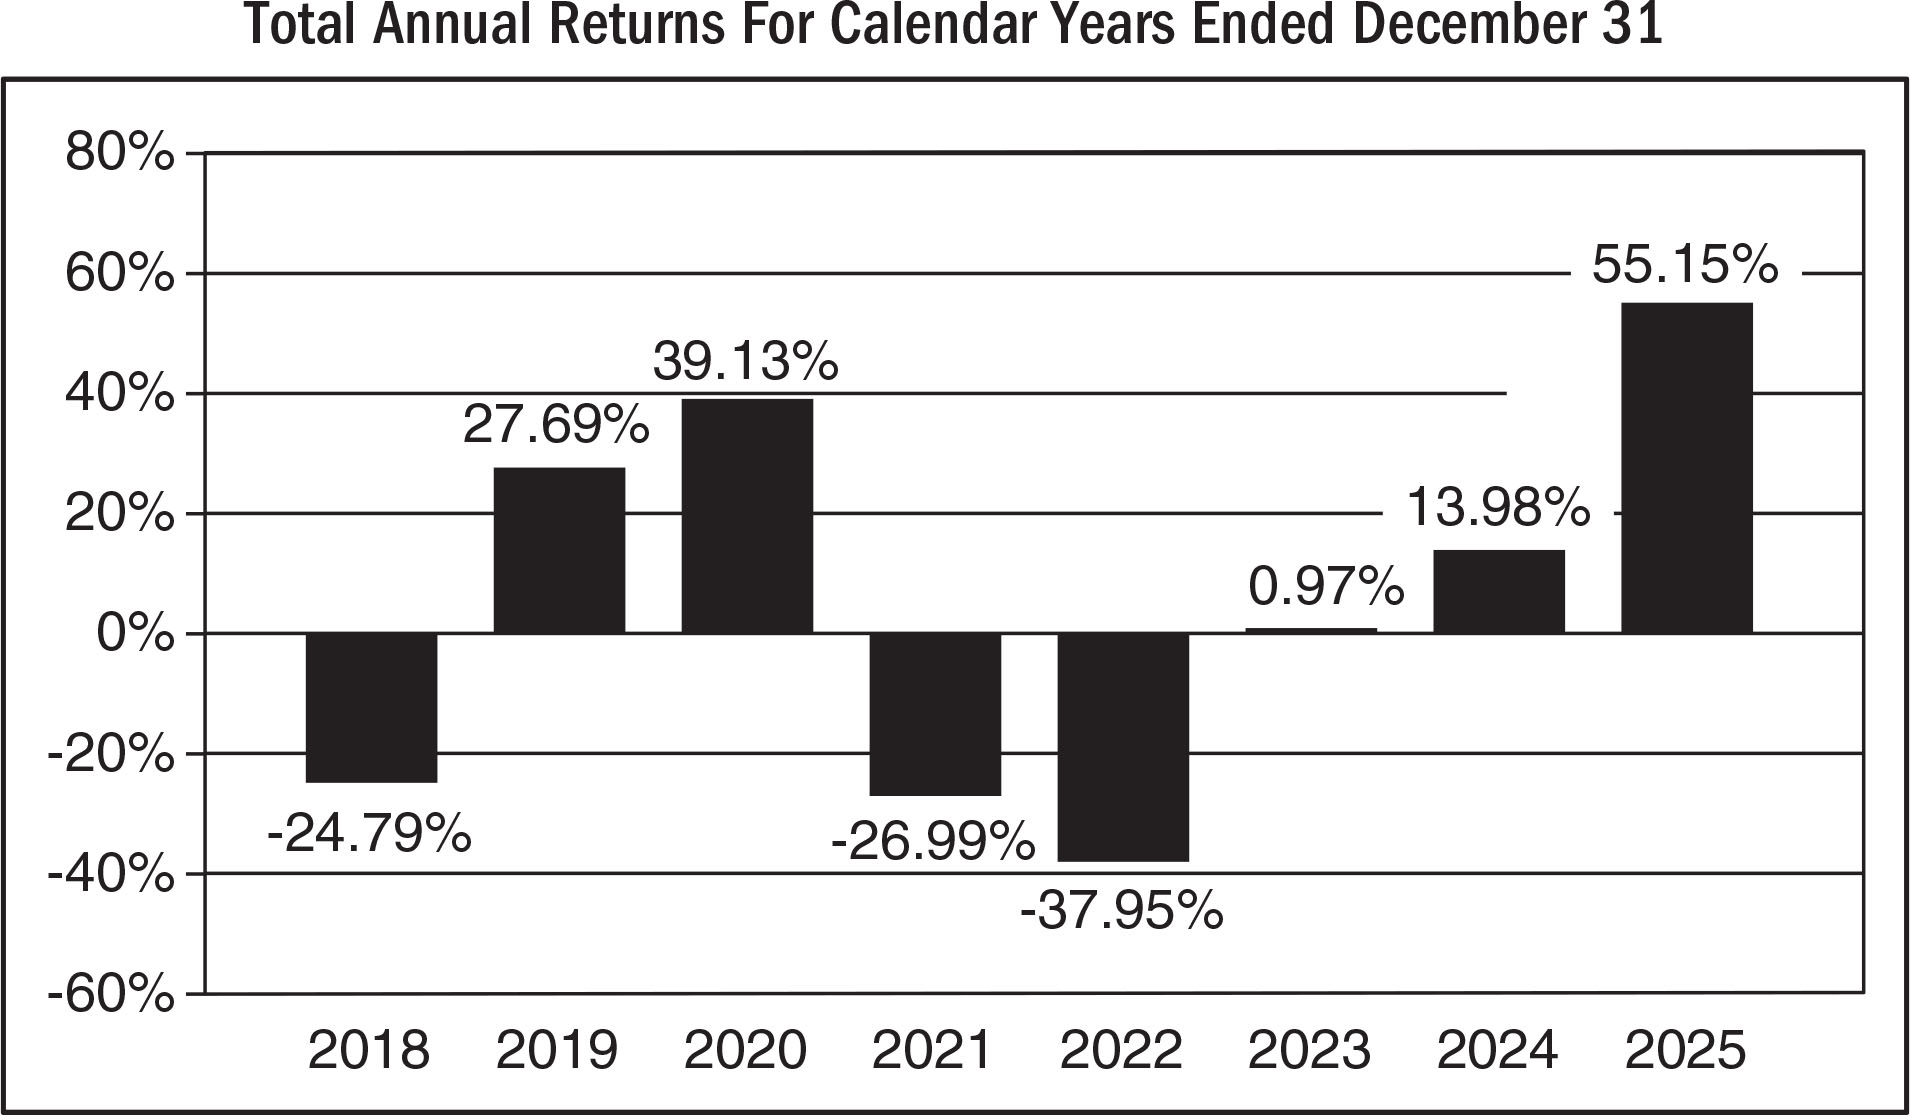
| Years |
Returns |
| 2018 |
-24.79% |
| 2019 |
27.69% |
| 2020 |
39.13% |
| 2021 |
-26.99% |
| 2022 |
-37.95% |
| 2023 |
0.97% |
| 2024 |
13.98% |
| 2025 |
55.15% |
|
| Bar Chart Closing [Text Block] |
As of June 30, 2026, the Fund’s calendar year-to-date total return was 3.59%.
Best and Worst Quarter Returns (for the period reflected in the bar chart above)
| |
Return |
Quarter Ended/Year |
| Highest Return |
32.94% |
6/30/2020 |
| Lowest Return |
-24.11% |
3/31/2022 |
|
| Year to Date Return, Label [Optional Text] |
year-to-date total return
|
| Bar Chart, Year to Date Return |
3.59%
|
| Bar Chart, Year to Date Return, Date |
Jun. 30, 2026
|
| Highest Quarterly Return, Label [Optional Text] |
Highest Return
|
| Highest Quarterly Return |
32.94%
|
| Highest Quarterly Return, Date |
Jun. 30, 2020
|
| Lowest Quarterly Return, Label [Optional Text] |
Lowest Return
|
| Lowest Quarterly Return |
(24.11%)
|
| Lowest Quarterly Return, Date |
Mar. 31, 2022
|
| Performance Table Heading |
Average Annual Total Returns for the periods ended December 31, 2025
|
| Performance Table Uses Highest Federal Rate |
After-tax returns for the Fund are calculated using the historical highest individual federal marginal income tax rates and do not reflect the impact of state and local taxes.
|
| Performance Table Not Relevant to Tax Deferred |
Actual after-tax returns depend on an investor’s tax situation and may differ from those shown. After-tax returns shown are not relevant to investors who hold shares through tax-deferred arrangements, such as 401(k) plans or individual retirement plans.
|
| Performance [Table] |
| KraneShares Public-Private Emerging Markets Internet and Technology ETF |
1 year |
5 years |
Since Inception
(10-11-2017) |
| Return Before Taxes |
55.15% |
-4.15% |
1.17% |
| Return After Taxes on Distributions |
52.03% |
-4.60% |
0.73% |
| Return After Taxes on Distributions and Sale of Fund Shares |
32.69% |
-3.27% |
0.76% |
MSCI Emerging Markets Index
(Reflects no deduction for fees, expenses or taxes) |
33.57% |
4.20% |
5.29% |
Solactive Emerging Markets Consumer Technology Index
(Reflects no deduction for fees, expenses or taxes) |
55.06% |
-3.55% |
2.04% |
MSCI Emerging Markets Index
(Reflects no deduction for fees, expenses or taxes)
Solactive Emerging Markets
Consumer Technology Index (Reflects no deduction for fees, expenses or taxes)
|
| Performance Table Closing [Text Block] |
Average annual total returns are shown on a before- and after-tax basis for the Fund. After-tax returns for the Fund are calculated using the historical highest individual federal marginal income tax rates and do not reflect the impact of state and local taxes. Actual after-tax returns depend on an investor’s tax situation and may differ from those shown. After-tax returns shown are not relevant to investors who hold shares through tax-deferred arrangements, such as 401(k) plans or individual retirement plans.
|
| Performance Availability Website Address [Text] |
www.kraneshares.com
|
| KraneShares Sustainable Ultra Short Duration Index ETF |
|
| Prospectus [Line Items] |
|
| Bar Chart and Performance Table [Heading] |
Performance Information
|
| Performance Narrative [Text Block] |
The following bar chart and table illustrate the variability of the Fund’s returns and indicate the risks of investing in the Fund by showing how the Fund’s average annual total returns compare with those of a broad measure of market performance and an additional index with characteristics relevant to the Fund. All returns include the reinvestment of dividends and distributions. As always, please note that the Fund’s past performance (before and after taxes) is not necessarily an indication of how it will perform in the future. Updated performance information is available at no cost by visiting www.kraneshares.com.
|
| Performance Past Does Not Indicate Future [Text] |
As always, please note that the Fund’s past performance (before and after taxes) is not necessarily an indication of how it will perform in the future.
|
| Performance Information Illustrates Variability of Returns [Text] |
The following bar chart and table illustrate the variability of the Fund’s returns and indicate the risks of investing in the Fund by showing how the Fund’s average annual total returns compare with those of a broad measure of market performance and an additional index with characteristics relevant to the Fund.
|
| Bar Chart [Heading] |
Total Annual Returns For Calender Years Ended December 31
|
| Bar Chart [Table] |
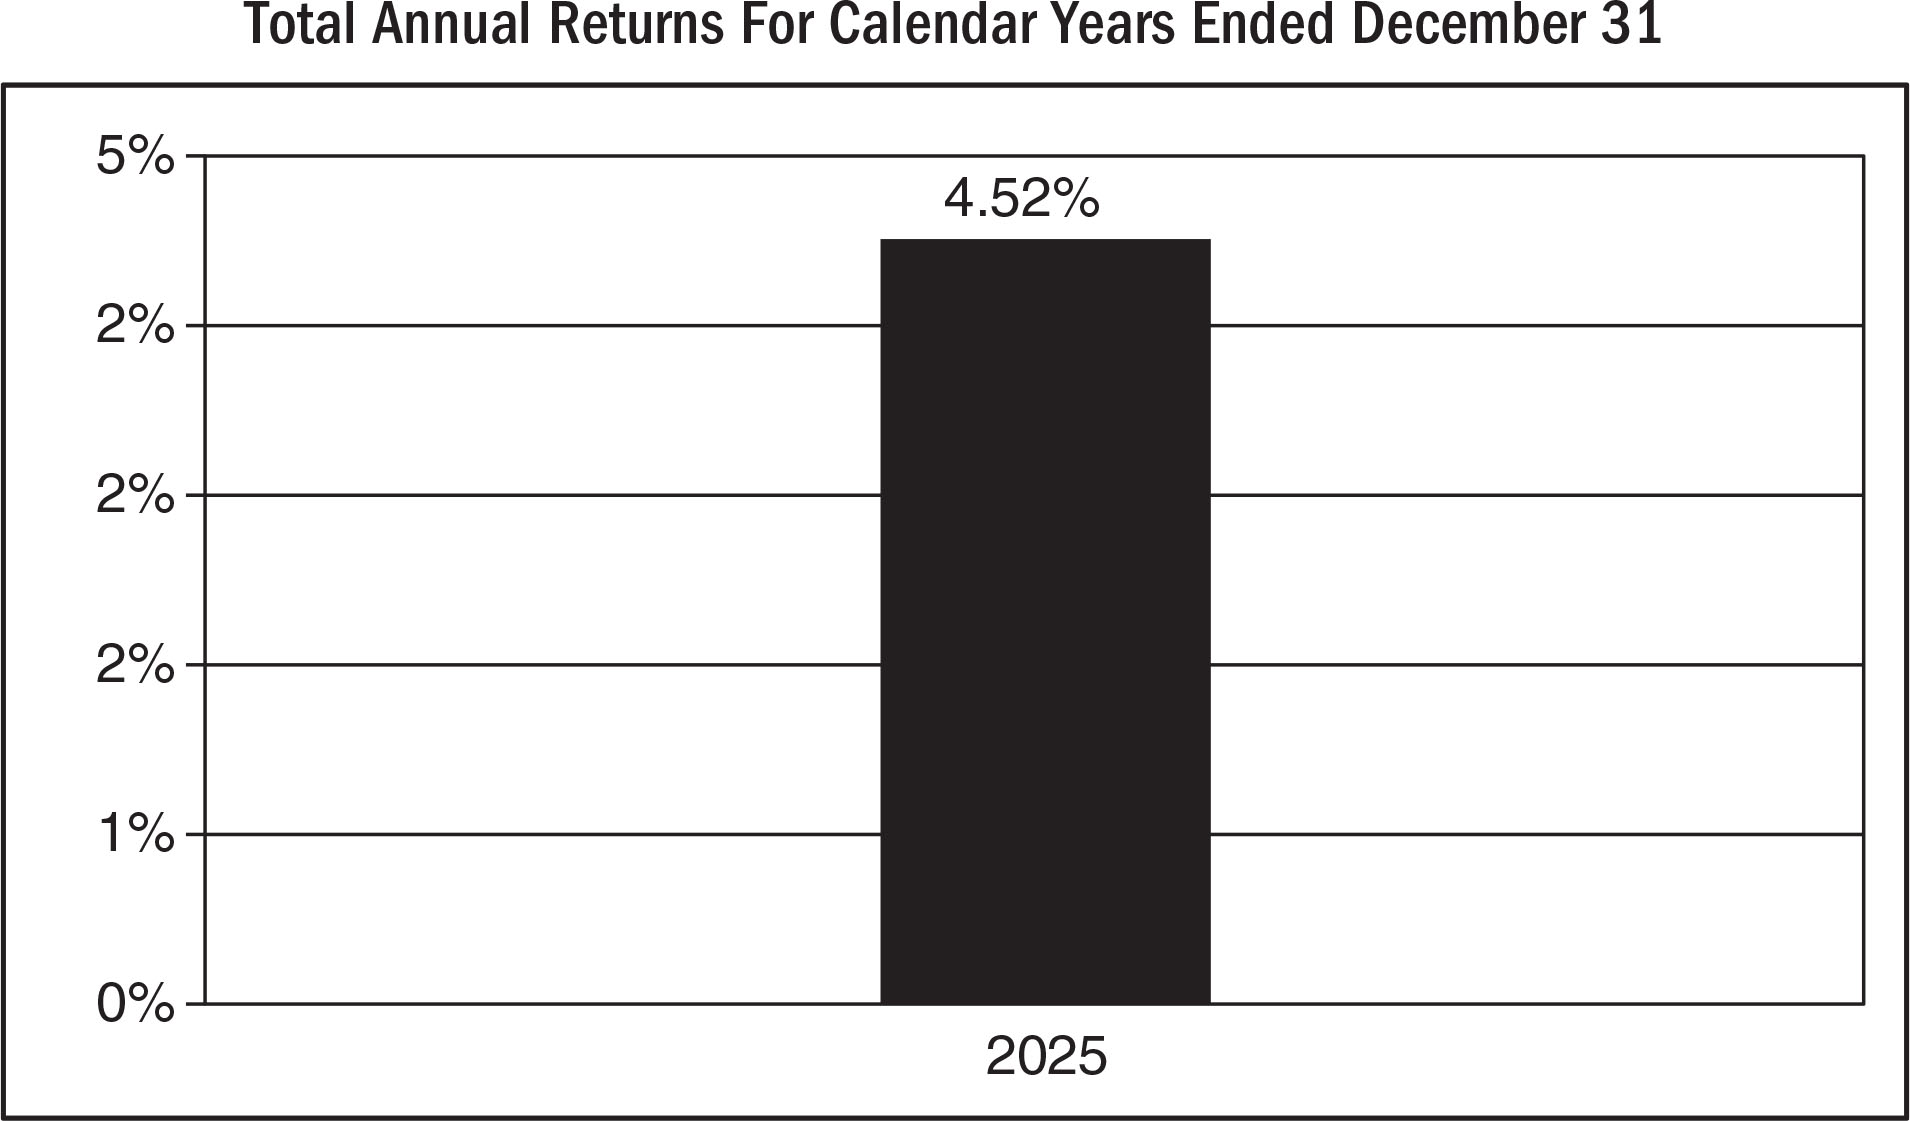
|
| Bar Chart Closing [Text Block] |
As of June 30, 2026, the Fund’s calendar year-to-date total return was 1.70%.
Best and Worst Quarter Returns (for the period reflected in the bar chart above)
| |
Return |
Quarter Ended/Year |
| Highest Return |
1.14% |
3/31/2025 |
| Lowest Return |
1.06% |
12/31/2025 |
|
| Year to Date Return, Label [Optional Text] |
year-to-date total return
|
| Bar Chart, Year to Date Return |
1.70%
|
| Bar Chart, Year to Date Return, Date |
Jun. 30, 2026
|
| Highest Quarterly Return, Label [Optional Text] |
Highest Return
|
| Highest Quarterly Return |
1.14%
|
| Highest Quarterly Return, Date |
Mar. 31, 2025
|
| Lowest Quarterly Return, Label [Optional Text] |
Lowest Return
|
| Lowest Quarterly Return |
1.06%
|
| Lowest Quarterly Return, Date |
Dec. 31, 2025
|
| Performance Table Heading |
Average Annual Total Returns for the periods ended December 31, 2025
|
| Performance Table Uses Highest Federal Rate |
After-tax returns for the Fund are calculated using the historical highest individual federal marginal income tax rates and do not reflect the impact of state and local taxes.
|
| Performance Table Not Relevant to Tax Deferred |
Actual after-tax returns depend on an investor’s tax situation and may differ from those shown. After-tax returns shown are not relevant to investors who hold shares through tax-deferred arrangements, such as 401(k) plans or individual retirement plans.
|
| Performance [Table] |
| KraneShares Sustainable Ultra Short Duration Index ETF |
1 year |
Since Inception
(07-25-2024) |
| Return Before Taxes |
4.52% |
4.74% |
| Return After Taxes on Distributions |
2.69% |
2.85% |
| Return After Taxes on Distributions and Sale of Fund Shares |
2.65% |
2.82% |
Bloomberg U.S Aggregate Bond
(Reflects no deduction for fees, expenses or taxes) |
7.30% |
5.65% |
Solactive ISS Sustainable Select 0-1 Year USD Corporate IG Index
(Reflects no deduction for fees, expenses or taxes) |
4.54% |
4.82% |
Bloomberg U.S Aggregate
Bond (Reflects no deduction for fees, expenses or taxes)
Solactive ISS Sustainable
Select 0-1 Year USD Corporate IG Index (Reflects no deduction for fees, expenses or taxes)
|
| Performance Table Closing [Text Block] |
Average annual total returns are shown on a before- and after-tax basis for the Fund. After-tax returns for the Fund are calculated using the historical highest individual federal marginal income tax rates and do not reflect the impact of state and local taxes. Actual after-tax returns depend on an investor’s tax situation and may differ from those shown. After-tax returns shown are not relevant to investors who hold shares through tax-deferred arrangements, such as 401(k) plans or individual retirement plans.
|
| Performance Availability Website Address [Text] |
www.kraneshares.com
|
| KraneShares Value Line(R) Dynamic Dividend Equity Index ETF |
|
| Prospectus [Line Items] |
|
| Bar Chart and Performance Table [Heading] |
Performance Information
|
| Performance Narrative [Text Block] |
The following bar chart and table illustrate the variability of the Fund’s returns and indicate the risks of investing in the Fund by showing how the Fund’s average annual total returns compare with those of a broad measure of market performance and an additional index with characteristics relevant to the Fund. All returns include the reinvestment of dividends and distributions. As always, please note that the Fund’s past performance (before and after taxes) is not necessarily an indication of how it will perform in the future. Updated performance information is available at no cost by visiting www.kraneshares.com.
|
| Performance Past Does Not Indicate Future [Text] |
As always, please note that the Fund’s past performance (before and after taxes) is not necessarily an indication of how it will perform in the future.
|
| Performance Information Illustrates Variability of Returns [Text] |
The following bar chart and table illustrate the variability of the Fund’s returns and indicate the risks of investing in the Fund by showing how the Fund’s average annual total returns compare with those of a broad measure of market performance and an additional index with characteristics relevant to the Fund.
|
| Bar Chart [Heading] |
Total Annual Returns For Calender Years Ended December 31
|
| Bar Chart [Table] |
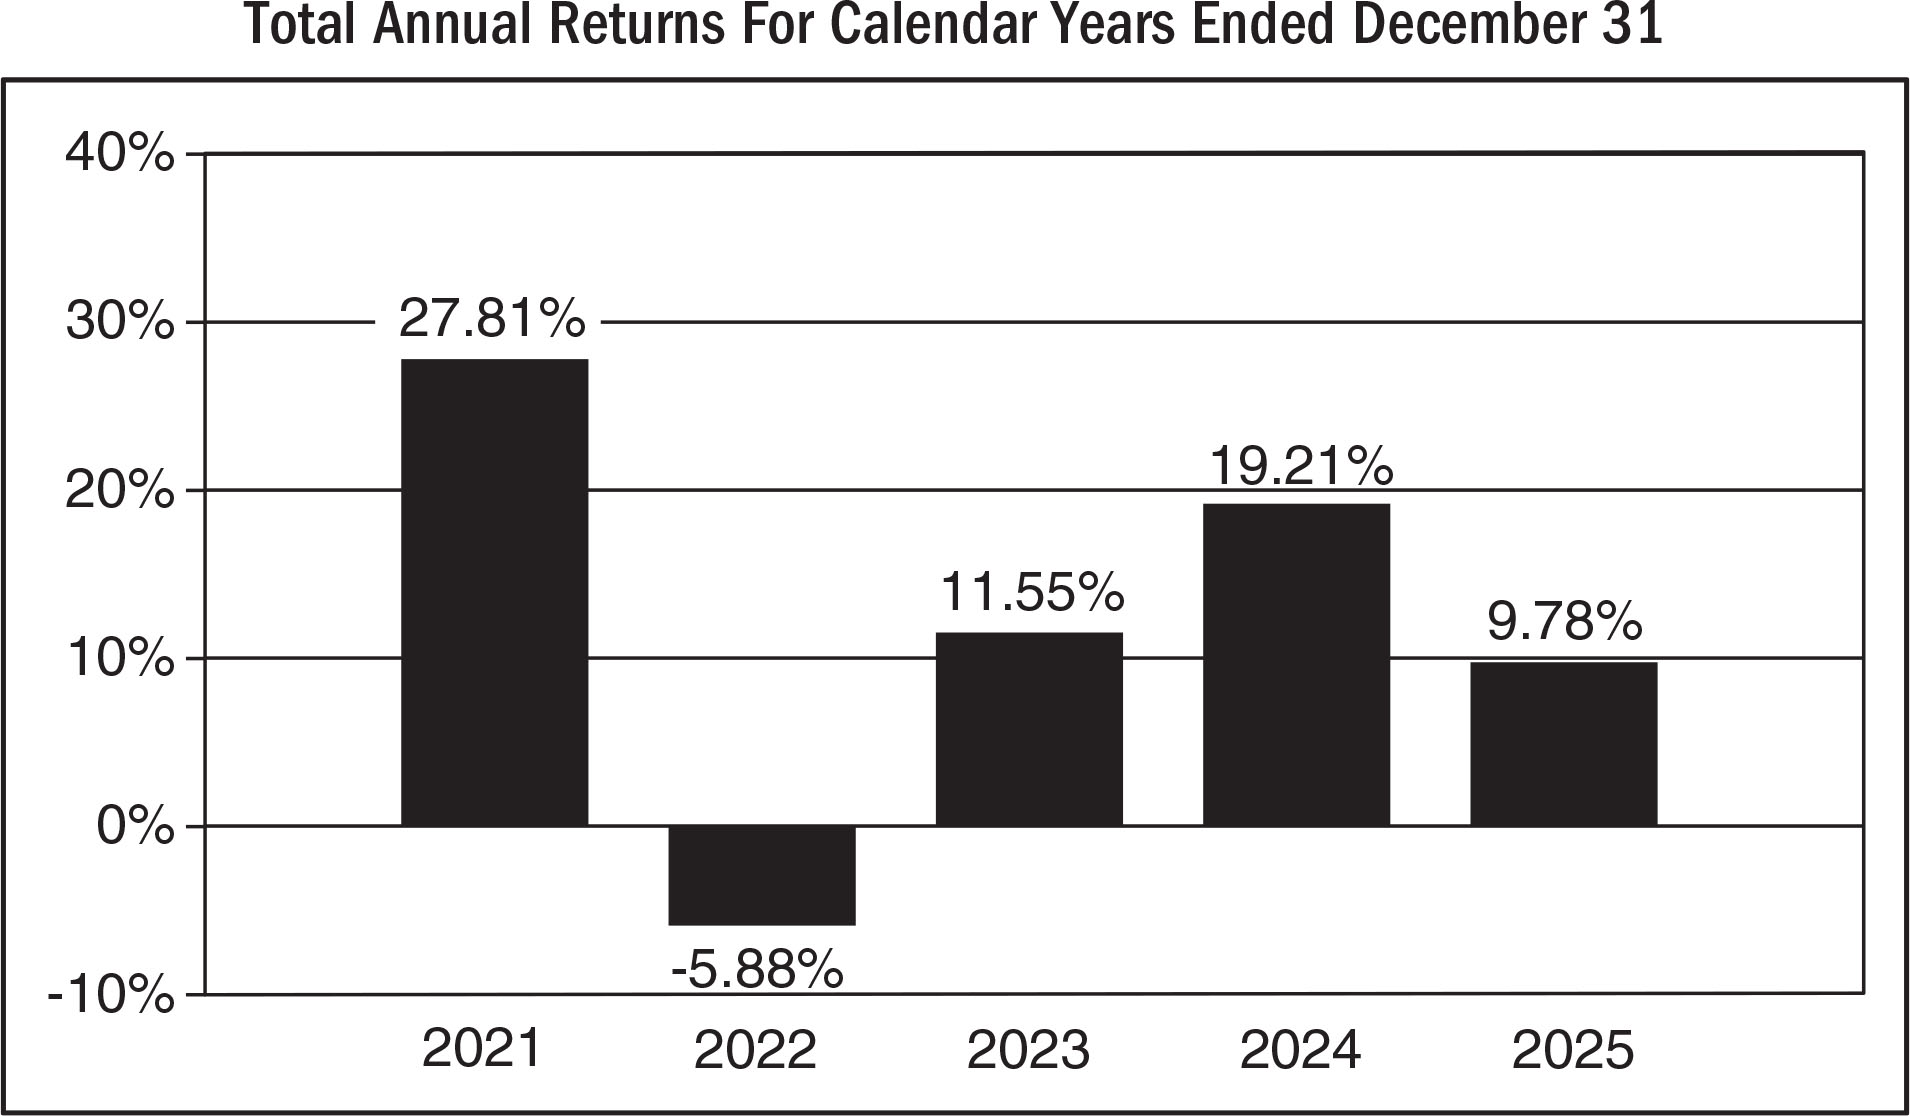
| Years |
Returns |
| 2021 |
27.81% |
| 2022 |
-5.88% |
| 2023 |
11.55% |
| 2024 |
19.21% |
| 2025 |
9.78% |
|
| Bar Chart Closing [Text Block] |
As of June 30, 2026, the Fund’s calendar year-to-date total return was 11.41%.
Best and Worst Quarter Returns (for the period reflected in the bar chart above)
| |
Return |
Quarter Ended/Year |
| Highest Return |
12.93% |
12/31/2022 |
| Lowest Return |
-7.91% |
9/30/2022 |
|
| Year to Date Return, Label [Optional Text] |
year-to-date total return
|
| Bar Chart, Year to Date Return |
11.41%
|
| Bar Chart, Year to Date Return, Date |
Jun. 30, 2026
|
| Highest Quarterly Return, Label [Optional Text] |
Highest Return
|
| Highest Quarterly Return |
12.93%
|
| Highest Quarterly Return, Date |
Dec. 31, 2022
|
| Lowest Quarterly Return, Label [Optional Text] |
Lowest Return
|
| Lowest Quarterly Return |
(7.91%)
|
| Lowest Quarterly Return, Date |
Sep. 30, 2022
|
| Performance Table Heading |
Average Annual Total Returns for the periods ended December 31, 2025
|
| Performance [Table] |
| KraneShares Value Line® Dynamic Dividend Equity Index ETF |
1 year |
5 years |
Since Inception
(11-23-2020) |
| Return Before Taxes |
9.78% |
11.92% |
12.46% |
| Return After Taxes on Distributions |
7.40% |
9.61% |
10.15% |
| Return After Taxes on Distributions and Sale of Fund Shares |
7.02% |
8.76% |
9.21% |
S&P 500 Index
(Reflects no deduction for fees, expenses or taxes) |
17.88% |
14.42% |
15.23% |
Value Line® Dynamic Dividend Equity Index
(Reflects no deduction for fees, expenses or taxes) |
9.57% |
11.62% |
12.15% |
S&P 500 Index (Reflects no deduction for fees, expenses or taxes)
Value Line® Dynamic Dividend Equity Index (Reflects no deduction for fees, expenses or taxes)
|
| Performance Availability Website Address [Text] |
www.kraneshares.com.
|
| KraneShares Wahed Alternative Income Index ETF |
|
| Prospectus [Line Items] |
|
| Bar Chart and Performance Table [Heading] |
Performance Information
|
| Performance Narrative [Text Block] |
Once the Fund has completed a full calendar year of operations, a bar chart and table will be included in this Prospectus that will provide some indication of the risks of investing in the Fund by showing the variability of the Fund’s return based on net assets and comparing the variability of the Fund’s return to a broad measure of market performance. Once available, the Fund’s current performance information will be available at www.kraneshares.com. Past performance does not necessarily indicate how the Fund will perform in the future.
|
| Performance Past Does Not Indicate Future [Text] |
Past performance does not necessarily indicate how the Fund will perform in the future.
|
| Performance Information Illustrates Variability of Returns [Text] |
Once the Fund has completed a full calendar year of operations, a bar chart and table will be included in this Prospectus that will provide some indication of the risks of investing in the Fund by showing the variability of the Fund’s return based on net assets and comparing the variability of the Fund’s return to a broad measure of market performance.
|
| Performance Availability Website Address [Text] |
www.kraneshares.com
|
| Quadratic Interest Rate Volatility and Inflation Hedge ETF |
|
| Prospectus [Line Items] |
|
| Bar Chart and Performance Table [Heading] |
Performance Information
|
| Performance Narrative [Text Block] |
The following bar chart and table illustrate the variability of the Fund’s returns and indicate the risks of investing in the Fund by showing how the Fund’s average annual total returns compare with those of a broad measure of market performance. All returns include the reinvestment of dividends and distributions. As always, please note that the Fund’s past performance (before and after taxes) is not necessarily an indication of how it will perform in the future. Updated performance information is available at no cost by visiting www.ivoletf.com.
|
| Performance Past Does Not Indicate Future [Text] |
As always, please note that the Fund’s past performance (before and after taxes) is not necessarily an indication of how it will perform in the future.
|
| Performance Information Illustrates Variability of Returns [Text] |
The following bar chart and table illustrate the variability of the Fund’s returns and indicate the risks of investing in the Fund by showing how the Fund’s average annual total returns compare with those of a broad measure of market performance.
|
| Bar Chart [Heading] |
Total Annual Returns For Calender Years Ended December 31
|
| Bar Chart [Table] |
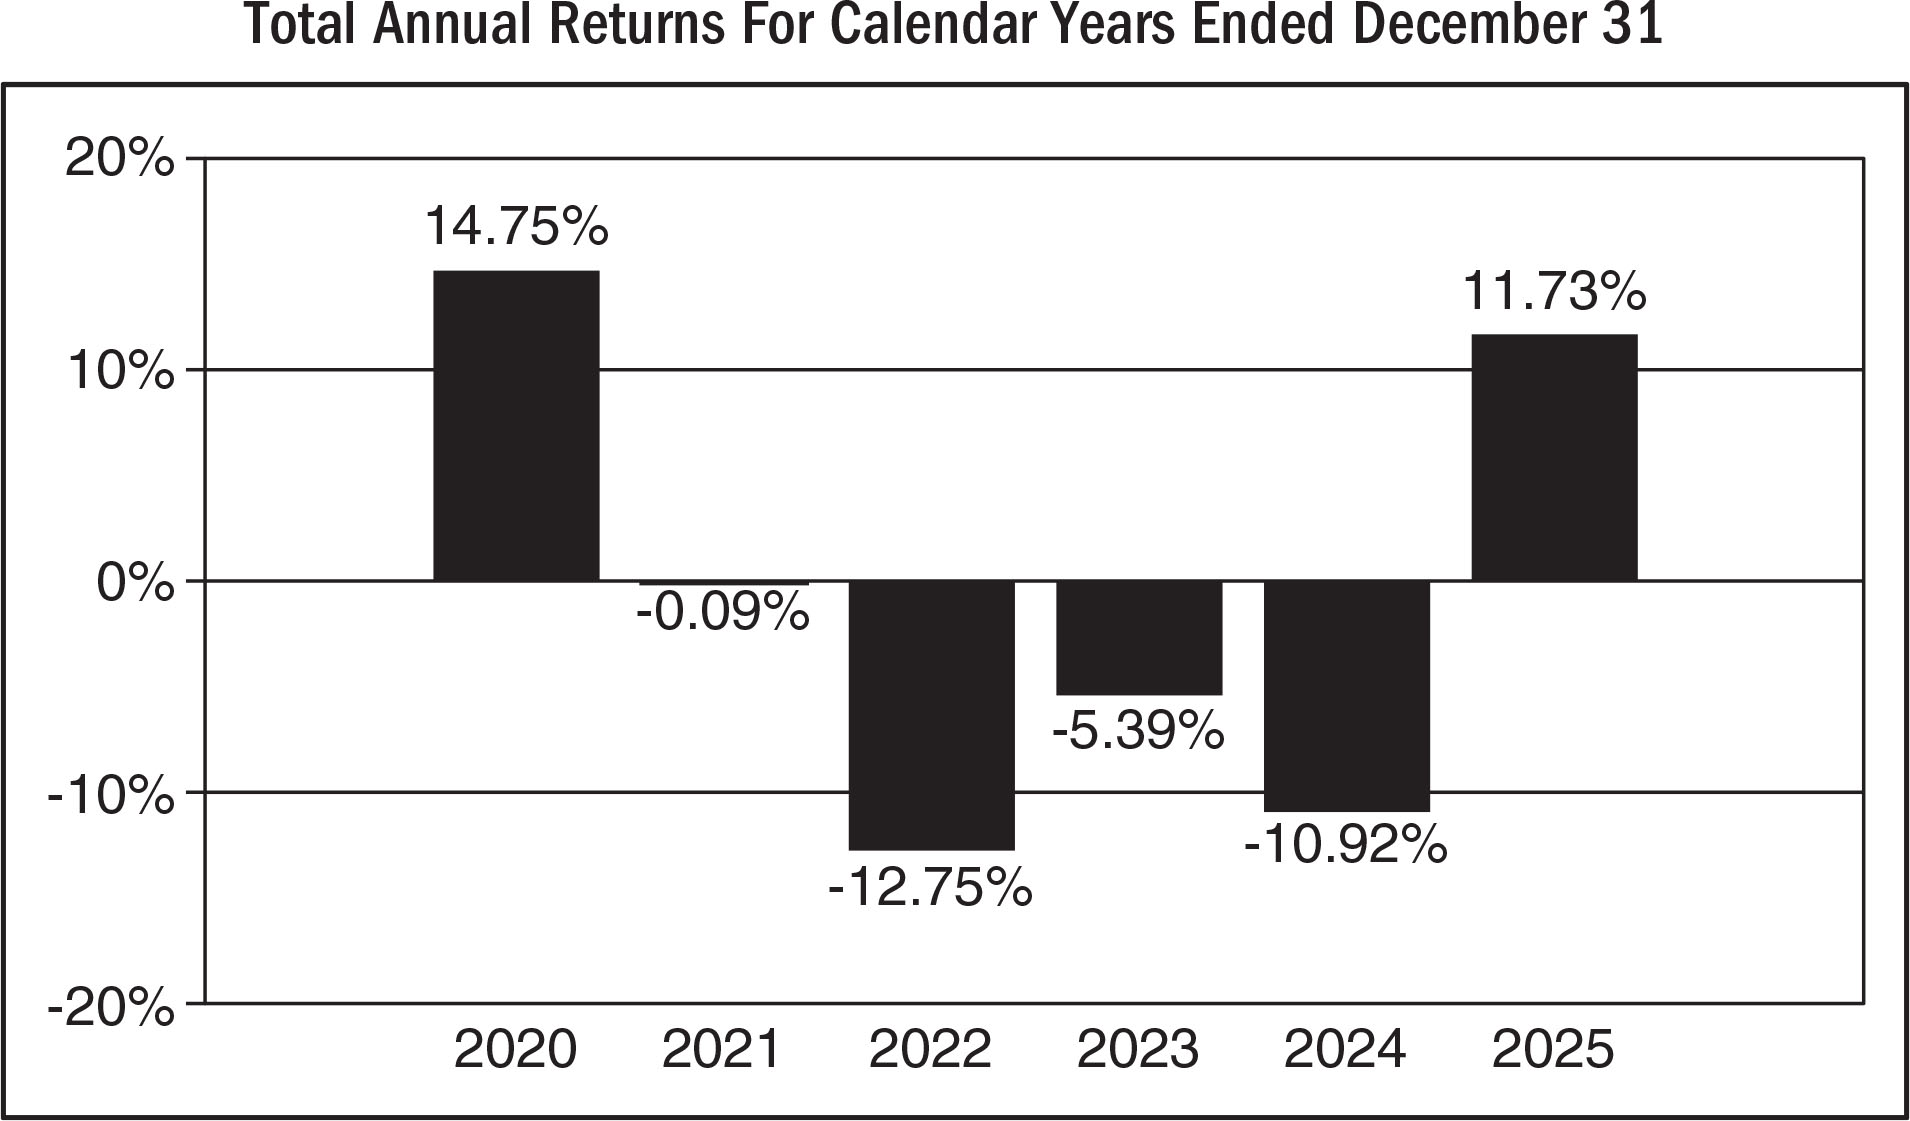
| Years |
Returns |
| 2020 |
14.75% |
| 2021 |
-0.09% |
| 2022 |
-12.75% |
| 2023 |
-5.39% |
| 2024 |
-10.92% |
| 2025 |
11.73% |
|
| Bar Chart Closing [Text Block] |
As of June 30, 2026, the Fund’s calendar year-to-date total return was -7.86%.
Best and Worst Quarter Returns (for the period reflected in the bar chart above)
| |
Return |
Quarter Ended/Year |
| Highest Return |
6.02% |
3/31/2025 |
| Lowest Return |
-11.51% |
9/30/2022 |
|
| Year to Date Return, Label [Optional Text] |
year-to-date total return
|
| Bar Chart, Year to Date Return |
(7.86%)
|
| Bar Chart, Year to Date Return, Date |
Jun. 30, 2026
|
| Highest Quarterly Return, Label [Optional Text] |
Highest Return
|
| Highest Quarterly Return |
6.02%
|
| Highest Quarterly Return, Date |
Mar. 31, 2025
|
| Lowest Quarterly Return, Label [Optional Text] |
Lowest Return
|
| Lowest Quarterly Return |
(11.51%)
|
| Lowest Quarterly Return, Date |
Sep. 30, 2022
|
| Performance Table Heading |
Average Annual Total Returns for the periods ended December 31, 2025
|
| Performance [Table] |
| Quadratic Interest Rate Volatility and Inflation Hedge ETF |
1 year |
5 years |
Since Inception
(5-14-2019) |
| Return Before Taxes |
11.73% |
-3.87% |
-0.44% |
| Return After Taxes on Distributions |
11.73% |
-4.14% |
-0.91% |
| Return After Taxes on Distributions and Sale of Fund Shares |
6.94% |
-2.98% |
-0.48% |
Bloomberg US Treasury Inflation-Linked Bond Index
(Reflects no deduction for fees, expenses or taxes) |
7.01% |
1.12% |
3.12% |
Bloomberg US Treasury Inflation-Linked Bond Index (Reflects no deduction for fees, expenses or taxes)
|
| Performance Availability Website Address [Text] |
www.ivoletf.com
|
| Quadratic Deflation ETF |
|
| Prospectus [Line Items] |
|
| Bar Chart and Performance Table [Heading] |
Performance Information
|
| Performance Narrative [Text Block] |
The following bar chart and table illustrate the variability of the Fund’s returns and indicate the risks of investing in the Fund by showing how the Fund’s average annual total returns compare with those of a broad measure of market performance. All returns include the reinvestment of dividends and distributions. As always, please note that the Fund’s past performance (before and after taxes) is not necessarily an indication of how it will perform in the future. Updated performance information is available at no cost by visiting www.bnddetf.com.
|
| Performance Past Does Not Indicate Future [Text] |
As always, please note that the Fund’s past performance (before and after taxes) is not necessarily an indication of how it will perform in the future.
|
| Performance Information Illustrates Variability of Returns [Text] |
The following bar chart and table illustrate the variability of the Fund’s returns and indicate the risks of investing in the Fund by showing how the Fund’s average annual total returns compare with those of a broad measure of market performance.
|
| Bar Chart [Heading] |
Total Annual Returns For Calender Years Ended December 31
|
| Bar Chart [Table] |
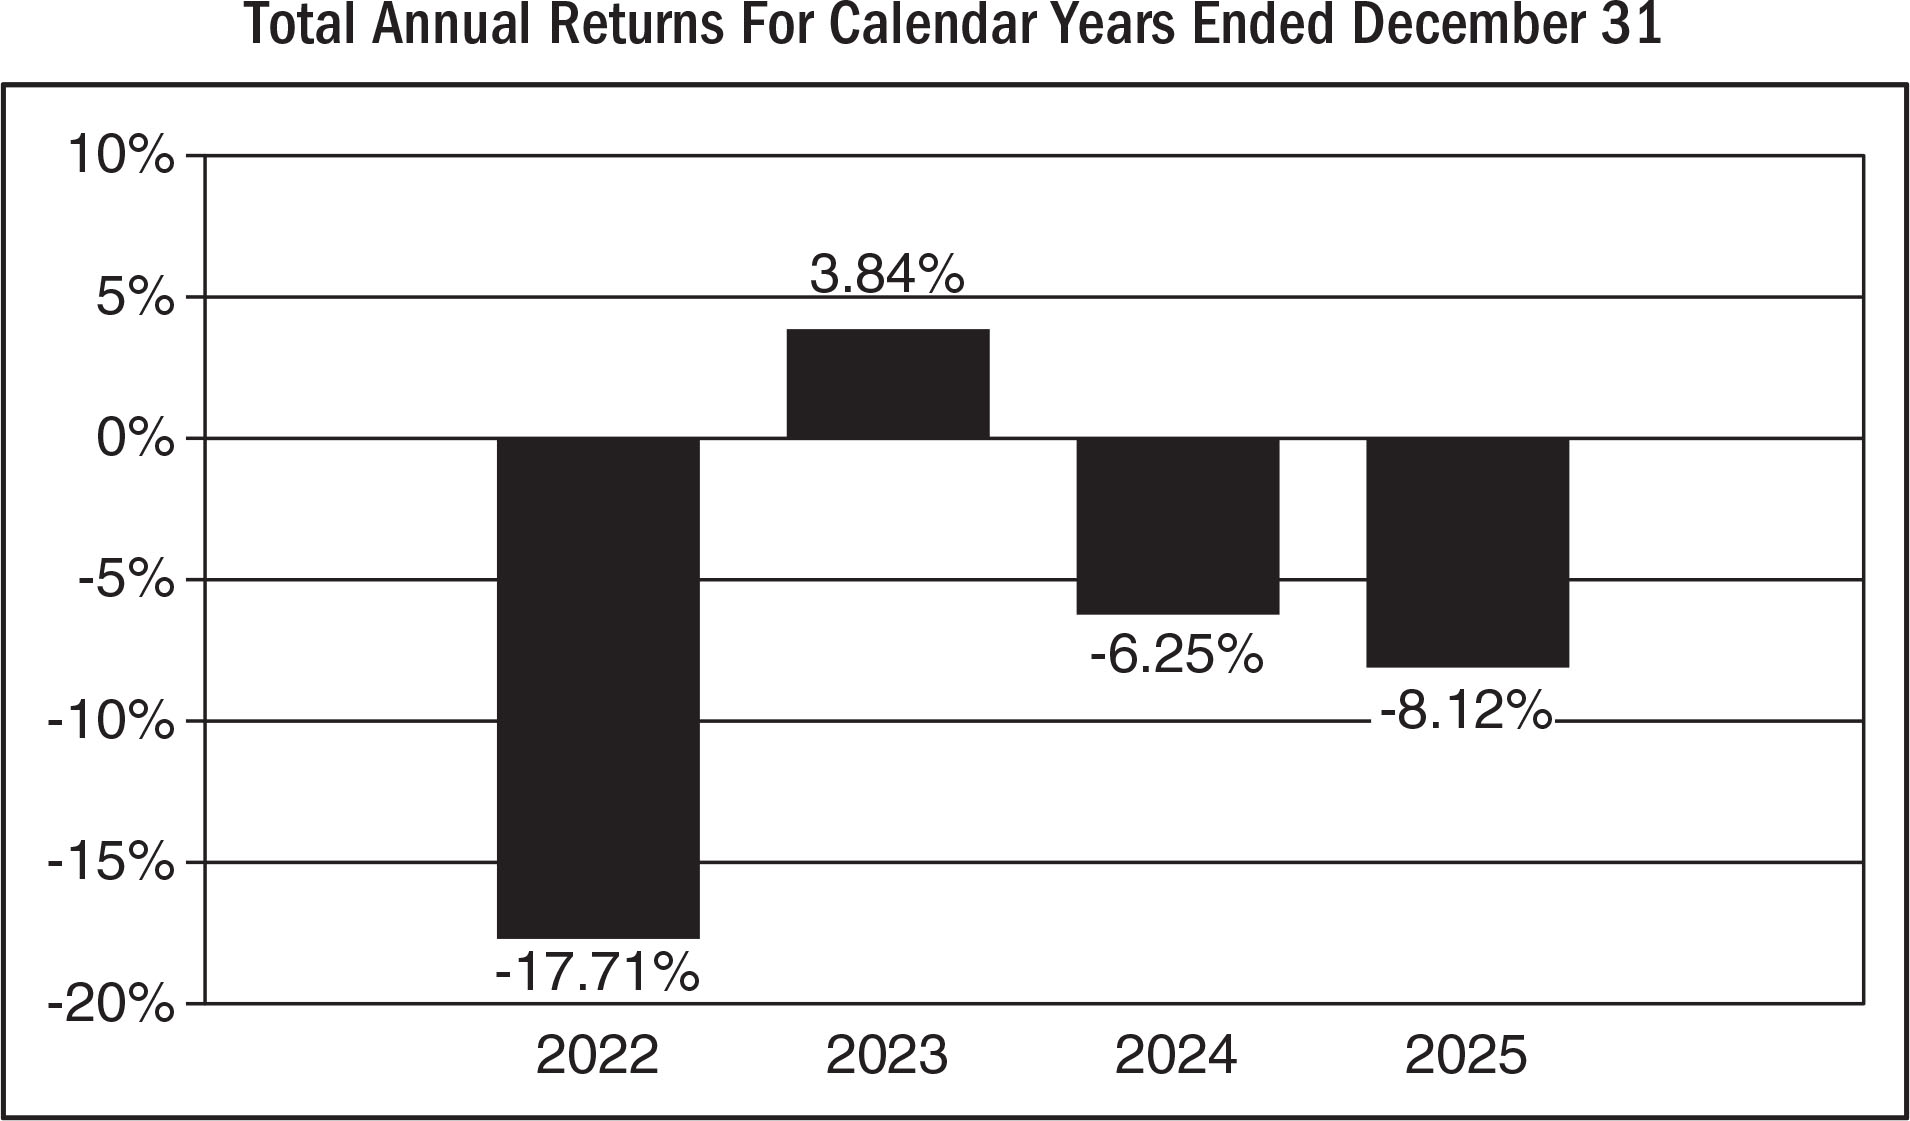
| Years |
Returns |
| 2022 |
-17.71% |
| 2023 |
3.84% |
| 2024 |
-6.25% |
| 2025 |
-8.12% |
|
| Bar Chart Closing [Text Block] |
As of June 30, 2026, the Fund’s calendar year-to-date total return was 5.90%.
Best and Worst Quarter Returns (for the period reflected in the bar chart above)
| |
Return |
Quarter Ended/Year |
| Highest Return |
6.46% |
12/31/2023 |
| Lowest Return |
-11.56% |
6/30/2022 |
|
| Year to Date Return, Label [Optional Text] |
year-to-date total return
|
| Bar Chart, Year to Date Return |
5.90%
|
| Bar Chart, Year to Date Return, Date |
Jun. 30, 2026
|
| Highest Quarterly Return, Label [Optional Text] |
Highest Return
|
| Highest Quarterly Return |
6.46%
|
| Highest Quarterly Return, Date |
Dec. 31, 2023
|
| Lowest Quarterly Return, Label [Optional Text] |
Lowest Return
|
| Lowest Quarterly Return |
(11.56%)
|
| Lowest Quarterly Return, Date |
Jun. 30, 2022
|
| Performance Table Heading |
Average Annual Total Returns for the periods ended December 31, 2025
|
| Performance [Table] |
| Quadratic Deflation ETF |
1 year |
Since Inception
(9-20-2021) |
| Return Before Taxes |
-8.12% |
-5.73% |
| Return After Taxes on Distributions |
-8.12% |
-9.32% |
| Return After Taxes on Distributions and Sale of Fund Shares |
-4.80% |
-5.47% |
Bloomberg Long U.S. Treasury Index
(Reflects no deduction for fees, expenses or taxes) |
5.59% |
-7.64% |
Bloomberg Long U.S. Treasury Index (Reflects no deduction for fees, expenses or taxes)
|
| Performance Availability Website Address [Text] |
www.bnddetf.com
|
| KraneShares 2x Long BABA Daily ETF |
|
| Prospectus [Line Items] |
|
| Bar Chart and Performance Table [Heading] |
Performance Information
|
| Performance Narrative [Text Block] |
Once the Fund has completed a full calendar year of operations, a bar chart and table will be included in this Prospectus that will provide some indication of the risks of investing in the Fund by showing the variability of the Fund’s return based on net assets and comparing the variability of the Fund’s return to a broad measure of market performance. Once available, the Fund’s current performance information is available at www.kraneshares.com. Past performance does not necessarily indicate how the Fund will perform in the future.
|
| Performance Past Does Not Indicate Future [Text] |
Past performance does not necessarily indicate how the Fund will perform in the future.
|
| Performance Information Illustrates Variability of Returns [Text] |
Once the Fund has completed a full calendar year of operations, a bar chart and table will be included in this Prospectus that will provide some indication of the risks of investing in the Fund by showing the variability of the Fund’s return based on net assets and comparing the variability of the Fund’s return to a broad measure of market performance.
|
| Performance Availability Website Address [Text] |
www.kraneshares.com
|
| KraneShares 2x Long BIDU Daily ETF |
|
| Prospectus [Line Items] |
|
| Bar Chart and Performance Table [Heading] |
Performance Information
|
| Performance Narrative [Text Block] |
Once the Fund has completed a full calendar year of operations, a bar chart and table will be included in this Prospectus that will provide some indication of the risks of investing in the Fund by showing the variability of the Fund’s return based on net assets and comparing the variability of the Fund’s return to a broad measure of market performance. Once available, the Fund’s current performance information will be available at www.kraneshares.com. Past performance does not necessarily indicate how the Fund will perform in the future.
Management
Investment
Adviser
Krane
Funds Advisors, LLC (“Krane” or “Adviser”) serves as the investment adviser to the Fund.
Portfolio
Managers
James
Maund, Head of Capital Markets at the Adviser, has served as the lead portfolio manager of the Fund since the Fund’s inception.
Jonathan Shelon, Chief Operating Officer of the Adviser, supports Mr. Maund and Krane’s investment team for the Fund and has
been a portfolio manager of the Fund since the Fund’s inception.
Purchase
and Sale of Fund Shares
Shares
may be purchased and redeemed from the Fund only in a large specified number of Shares each called a “Creation Unit,” or
multiples thereof. As a practical matter, only institutions and large investors, such as market makers or other large broker-dealers,
purchase or redeem Creation Units. Most investors will buy and sell shares of the Fund on the Exchange. Individual shares can be bought
and sold throughout the trading day like other publicly traded securities through a broker-dealer on the Exchange. These transactions
do not involve the Fund. The price of an individual Fund share is based on market prices, which may be different from its NAV. As a result,
the Fund’s shares may trade at a price greater than the NAV (at a premium) or less than the NAV (at a discount). An investor may
incur costs attributable to the difference between the highest price a buyer is willing to pay to purchase shares of the Fund (bid) and
the lowest price a seller is willing to accept for shares of the Fund (ask) when buying or selling shares in the secondary market (the
“bid-ask spread”). Most investors will incur customary brokerage commissions and charges when buying or selling shares of
the Fund through a broker-dealer.
Recent
information regarding the Fund, including its NAV, market price, premiums and discounts, and bid ask spreads, are available on the Fund’s
website at www.kraneshares.com.
Tax
Information
Fund
distributions are generally taxable as ordinary income, qualified dividend income or capital gains (or a combination), unless your investment
is in an IRA or other tax-advantaged retirement account, which may be taxable upon withdrawal.
Payments
to Broker-Dealers and Other Financial Intermediaries
If
you purchase Fund shares through a broker-dealer or other financial intermediary (such as a bank), the Fund and its related companies
may pay the intermediary for the sale of Fund shares and related services. These payments may create a conflict of interest by influencing
the broker-dealer or other intermediary and your sales person to recommend the Fund over another investment. Ask your sales person or
visit your financial intermediary’s website for more information.
|
| Performance Past Does Not Indicate Future [Text] |
Past performance does not necessarily indicate how the Fund will perform in the future.
|
| Performance Information Illustrates Variability of Returns [Text] |
Once the Fund has completed a full calendar year of operations, a bar chart and table will be included in this Prospectus that will provide some indication of the risks of investing in the Fund by showing the variability of the Fund’s return based on net assets and comparing the variability of the Fund’s return to a broad measure of market performance.
|
| Performance Availability Website Address [Text] |
www.kraneshares.com
|
| KraneShares 2x Long JD Daily ETF |
|
| Prospectus [Line Items] |
|
| Bar Chart and Performance Table [Heading] |
Performance Information
|
| Performance Narrative [Text Block] |
Once the Fund has completed a full calendar year of operations, a bar chart and table will be included in this Prospectus that will provide some indication of the risks of investing in the Fund by showing the variability of the Fund’s return based on net assets and comparing the variability of the Fund’s return to a broad measure of market performance. Once available, the Fund’s current performance information will be available at www.kraneshares.com. Past performance does not necessarily indicate how the Fund will perform in the future.
|
| Performance Past Does Not Indicate Future [Text] |
Past performance does not necessarily indicate how the Fund will perform in the future.
|
| Performance Information Illustrates Variability of Returns [Text] |
Once the Fund has completed a full calendar year of operations, a bar chart and table will be included in this Prospectus that will provide some indication of the risks of investing in the Fund by showing the variability of the Fund’s return based on net assets and comparing the variability of the Fund’s return to a broad measure of market performance.
|
| Performance Availability Website Address [Text] |
www.kraneshares.com
|
| KraneShares 2x Long MELI Daily ETF |
|
| Prospectus [Line Items] |
|
| Bar Chart and Performance Table [Heading] |
Performance Information
|
| Performance Narrative [Text Block] |
Once the Fund has completed a full calendar year of operations, a bar chart and table will be included in this Prospectus that will provide some indication of the risks of investing in the Fund by showing the variability of the Fund’s return based on net assets and comparing the variability of the Fund’s return to a broad measure of market performance. Once available, the Fund’s current performance information will be available at www.kraneshares.com. Past performance does not necessarily indicate how the Fund will perform in the future.
|
| Performance Past Does Not Indicate Future [Text] |
Past performance does not necessarily indicate how the Fund will perform in the future.
|
| Performance Information Illustrates Variability of Returns [Text] |
Once the Fund has completed a full calendar year of operations, a bar chart and table will be included in this Prospectus that will provide some indication of the risks of investing in the Fund by showing the variability of the Fund’s return based on net assets and comparing the variability of the Fund’s return to a broad measure of market performance.
|
| Performance Availability Website Address [Text] |
www.kraneshares.com
|
| KraneShares 2x Long PDD Daily ETF |
|
| Prospectus [Line Items] |
|
| Bar Chart and Performance Table [Heading] |
Performance Information
|
| Performance Narrative [Text Block] |
Once the Fund has completed a full calendar year of operations, a bar chart and table will be included in this Prospectus that will provide some indication of the risks of investing in the Fund by showing the variability of the Fund’s return based on net assets and comparing the variability of the Fund’s return to a broad measure of market performance. Once available, the Fund’s current performance information is available at www.kraneshares.com. Past performance does not necessarily indicate how the Fund will perform in the future.
|
| Performance Past Does Not Indicate Future [Text] |
Past performance does not necessarily indicate how the Fund will perform in the future.
|
| Performance Information Illustrates Variability of Returns [Text] |
Once the Fund has completed a full calendar year of operations, a bar chart and table will be included in this Prospectus that will provide some indication of the risks of investing in the Fund by showing the variability of the Fund’s return based on net assets and comparing the variability of the Fund’s return to a broad measure of market performance.
|
| Performance Availability Website Address [Text] |
www.kraneshares.com
|