
Q2 2026 Earnings Release July 29, 2026
2Littelfuse, Inc. © 2026 DISCLAIMERS Important Information About Littelfuse, Inc. This presentation does not constitute or form part of, and should not be construed as, an offer or solicitation to purchase or sell securities of Littelfuse, Inc. and no investment decision should be made based upon the information provided herein. Littelfuse strongly urges you to review its filings with the Securities and Exchange Commission, which can be found at investor.littelfuse.com. This website also provides additional information about Littelfuse. “Safe Harbor” Statement Under the Private Securities Litigation Reform Act of 1995. These risks, uncertainties and other factors include, but are not limited to, risks and uncertainties relating to general economic conditions; product demand and market acceptance; economic conditions; the impact of competitive products and pricing; product quality problems or product recalls; capacity and supply difficulties or constraints; coal mining exposures reserves; cybersecurity matters; failure of an indemnification for environmental liability; changes in import and export duty and tariff rates; exchange rate fluctuations; commodity price fluctuations; the effect of the Company's accounting policies; labor disputes and shortages; restructuring costs in excess of expectations; pension plan asset returns less than assumed; uncertainties related to political or regulatory changes; integration of acquisitions may not be achieved in a timely manner, or at all; limited realization of the expected benefits from investment and strategic plans; the risk that expected benefits, synergies and growth prospects of the Basler acquisition may not be achieved in a timely manner, or at all; the risk that Basler’s business may not be successfully integrated with Littelfuse business and / or future acquisitions. Should one or more of these risks or uncertainties materialize or should the underlying assumptions prove incorrect, actual results and outcomes may differ materially from those indicated or implied in the forward-looking statements. This presentation should be read in conjunction with information provided in the financial statements appearing in the company's Annual Report on Form 10-K for the year ended December 27, 2025. Further discussion of the risk factors of the company can be found under the caption "Risk Factors" in the company's Annual Report on Form 10-K for the year ended December 27, 2025, and in other filings and submissions with the SEC, each of which are available free of charge on the company’s investor relations website at investor.littelfuse.com and on the SEC’s website at http://www.sec.gov. These forward-looking statements are made as of the date hereof. The company does not undertake any obligation to update, amend or clarify these forward-looking statements to reflect events or circumstances after the date hereof or to reflect the availability of new information. Non-GAAP Financial Measures. The information included in this presentation includes the non-GAAP financial measures of organic net sales growth, adjusted operating margin, adjusted EBITDA margin, adjusted diluted earnings per share, adjusted effective tax rate, free cash flow conversion, and consolidated net leverage ratio (as defined in the credit agreement). A reconciliation of these non-GAAP financial measures to the most directly comparable GAAP financial measures are set forth in the appendix. The company believes that these non-GAAP financial measures provide useful information to investors regarding its operational performance, ability to generate cash and its credit position enhancing an investor’s overall understanding of its core financial performance. The company believes that free cash flow is a useful measure of its ability to generate cash. The company believes that these non-GAAP financial measures are commonly used by financial analysts and provide useful information to analysts. Management uses these measures when assessing the performance of the business and for business planning purposes. Note that the definitions of these non-GAAP financial measures may differ from those terms as defined or used by other companies.
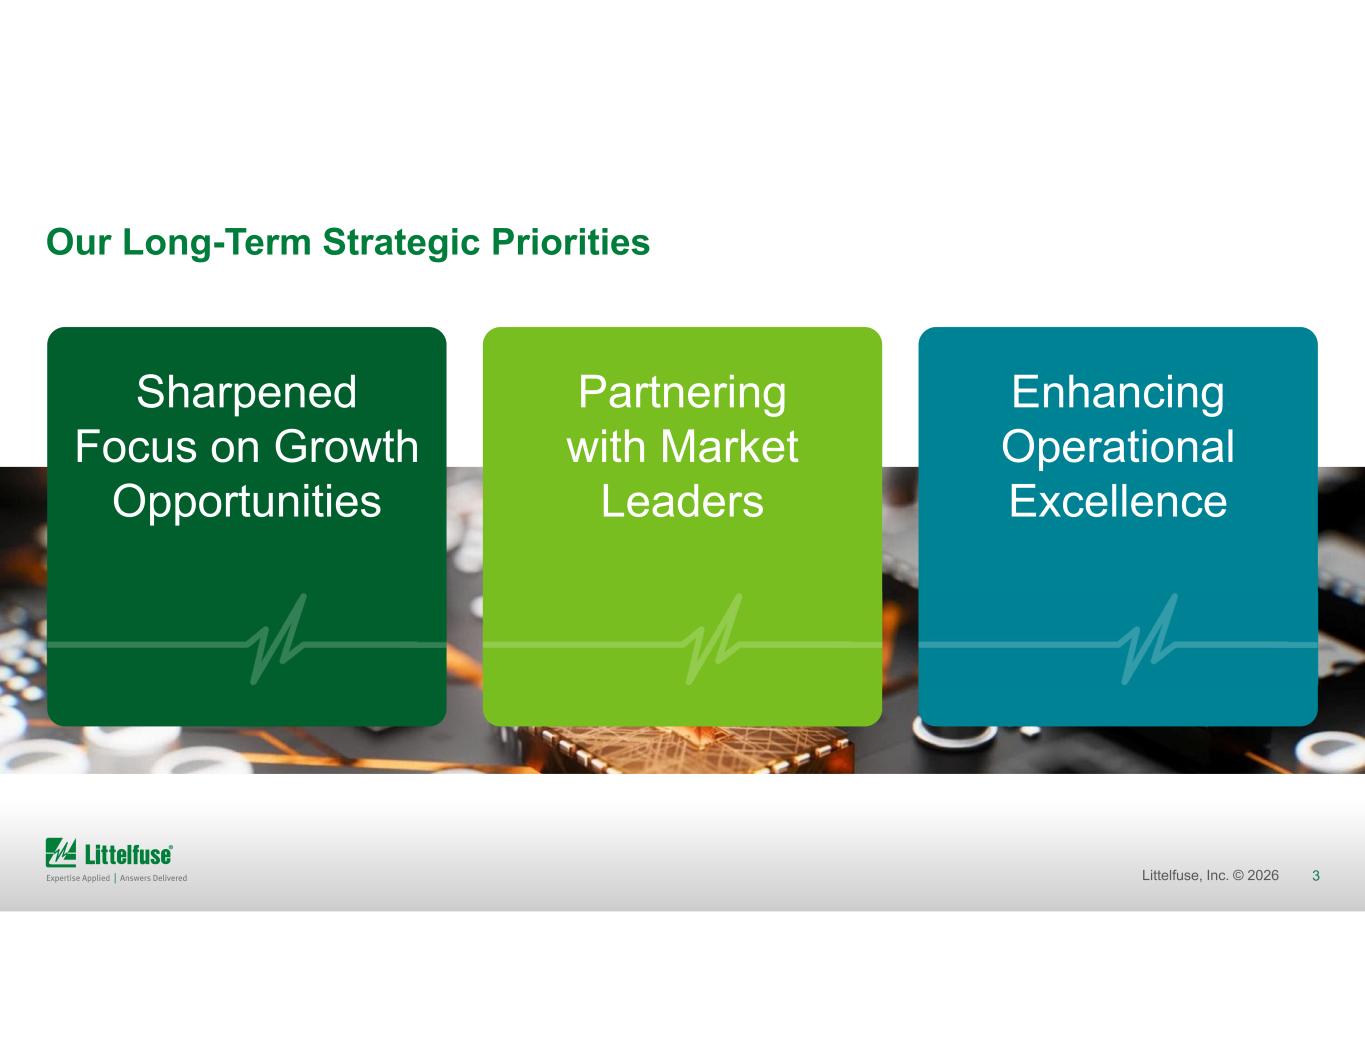
3Littelfuse, Inc. © 2026 Our Long-Term Strategic Priorities Sharpened Focus on Growth Opportunities Partnering with Market Leaders Enhancing Operational Excellence
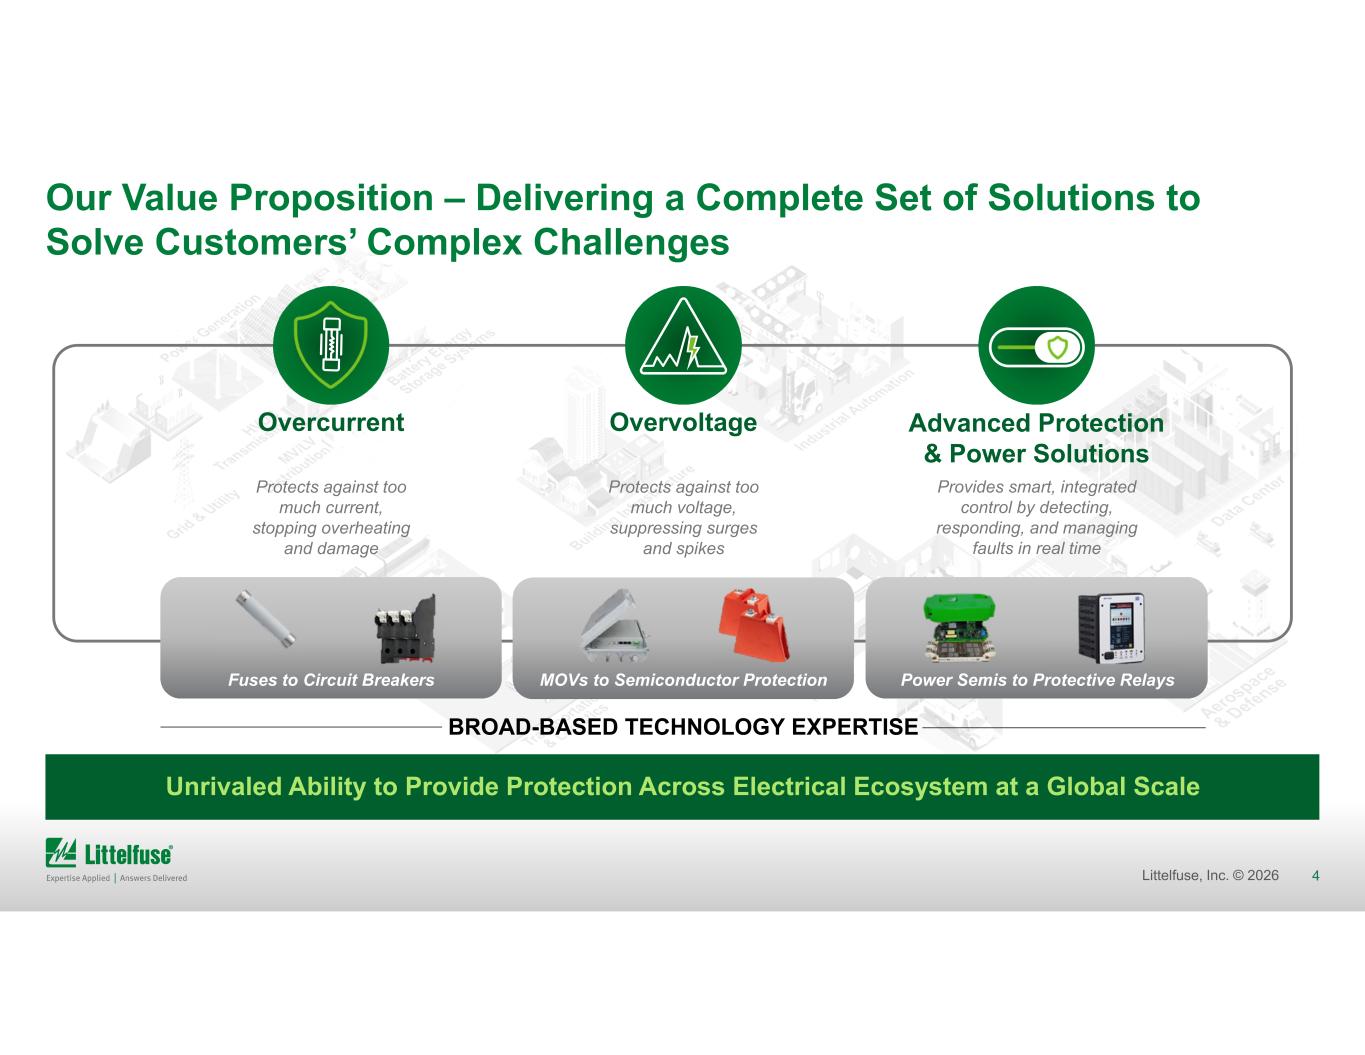
4Littelfuse, Inc. © 2026 Overvoltage BROAD-BASED TECHNOLOGY EXPERTISE Our Value Proposition – Delivering a Complete Set of Solutions to Solve Customers’ Complex Challenges Protects against too much voltage, suppressing surges and spikes Unrivaled Ability to Provide Protection Across Electrical Ecosystem at a Global Scale Advanced Protection & Power Solutions Provides smart, integrated control by detecting, responding, and managing faults in real time Power Semis to Protective RelaysMOVs to Semiconductor Protection Overcurrent Protects against too much current, stopping overheating and damage Fuses to Circuit Breakers
5Littelfuse, Inc. © 2026 Q2 2026 FINANCIAL SUMMARY Delivered results ahead of expectations while advancing our strategic priorities to drive long-term outperformance01 Q2 Adj. EBITDA Margin of 23.6%, +220 bps vs. PY, reflecting volume leverage and operational execution02 Continued strong cash generation with Q2 FCF of $127 million, +75% vs. PY03 Basler performing ahead of expectations, Full-Year Basler outlook increased to $135m-$140m Sales and $0.25-$0.30 EPS contribution04
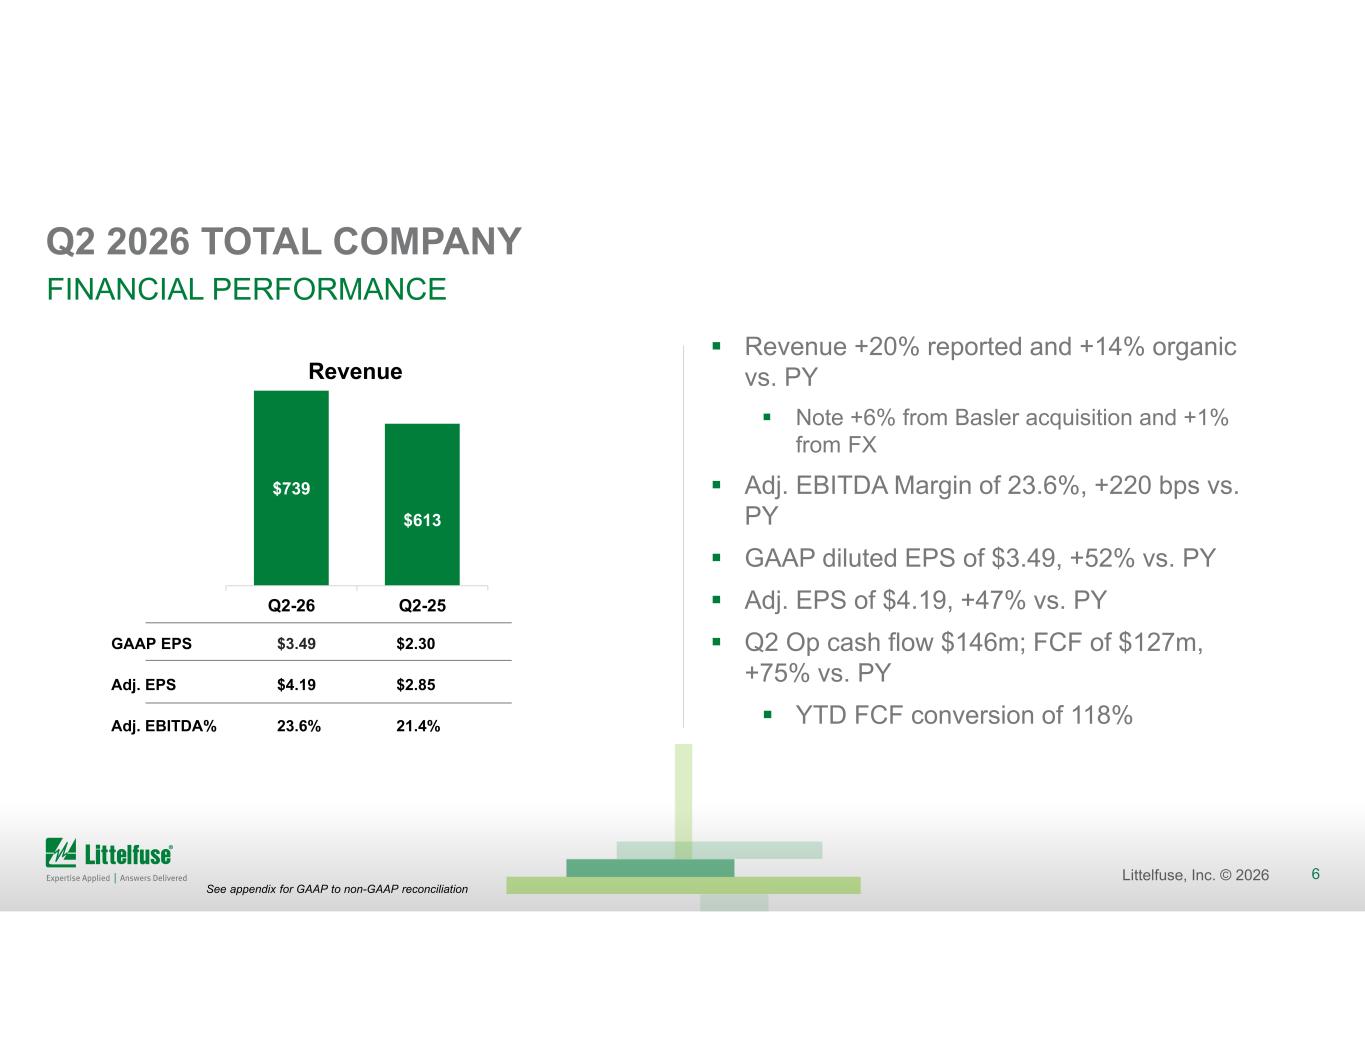
6Littelfuse, Inc. © 2026 Q2 2026 TOTAL COMPANY FINANCIAL PERFORMANCE Revenue +20% reported and +14% organic vs. PY Note +6% from Basler acquisition and +1% from FX Adj. EBITDA Margin of 23.6%, +220 bps vs. PY GAAP diluted EPS of $3.49, +52% vs. PY Adj. EPS of $4.19, +47% vs. PY Q2 Op cash flow $146m; FCF of $127m, +75% vs. PY YTD FCF conversion of 118% $2.30$3.49GAAP EPS $2.85$4.19Adj. EPS 21.4%23.6%Adj. EBITDA% $739 $613 Q2-26 Q2-25 Revenue See appendix for GAAP to non-GAAP reconciliation
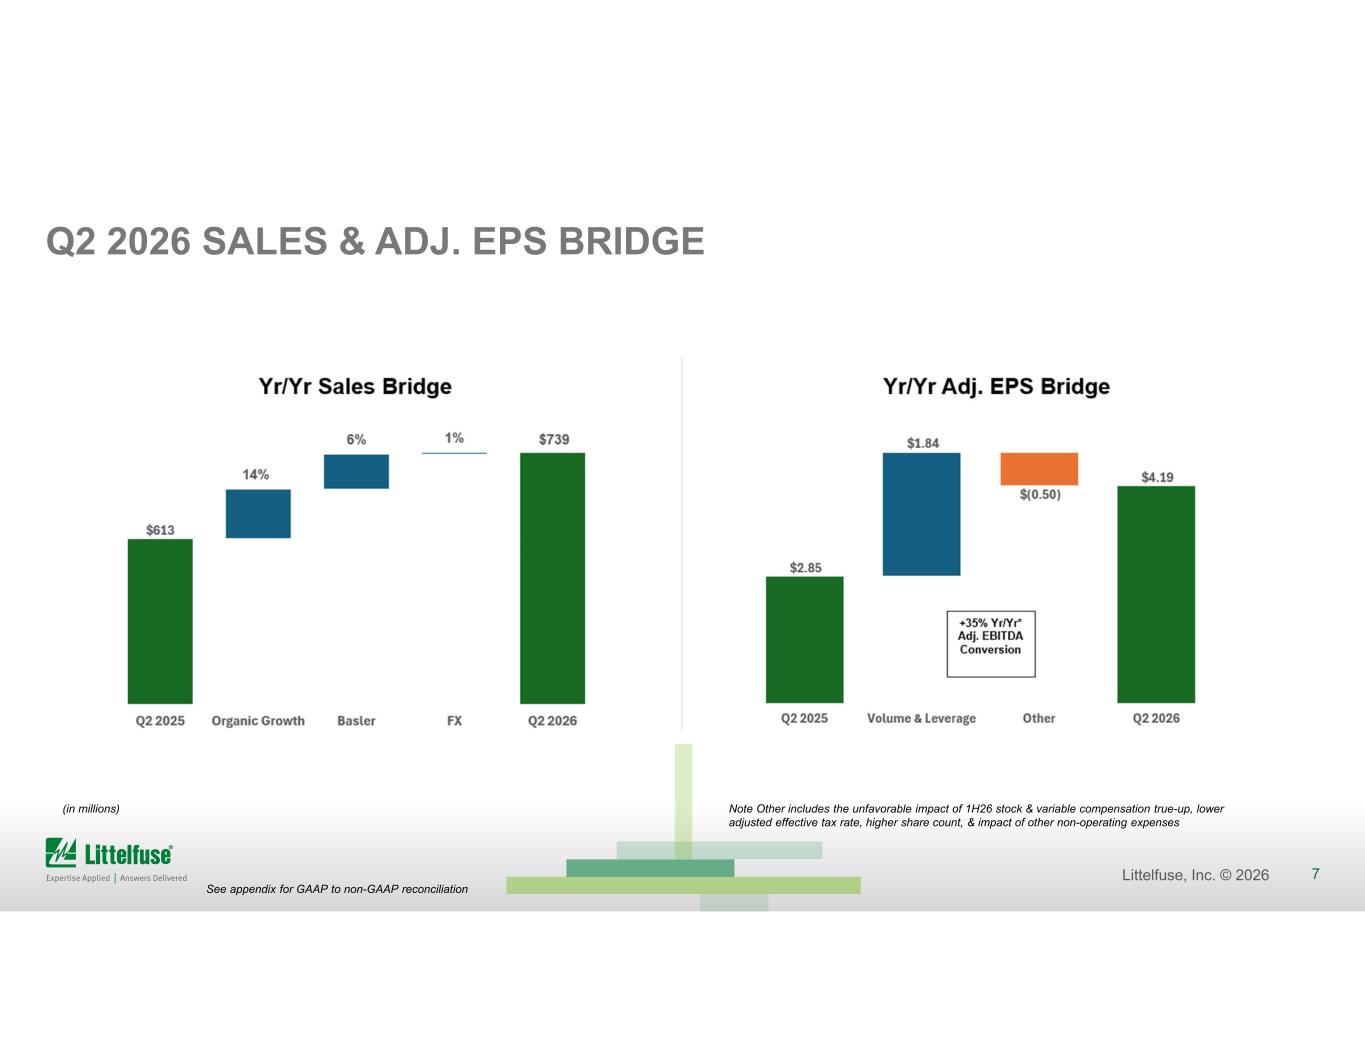
7Littelfuse, Inc. © 2026 Q2 2026 SALES & ADJ. EPS BRIDGE (in millions) See appendix for GAAP to non-GAAP reconciliation Note Other includes the unfavorable impact of 1H26 stock & variable compensation true-up, lower adjusted effective tax rate, higher share count, & impact of other non-operating expenses
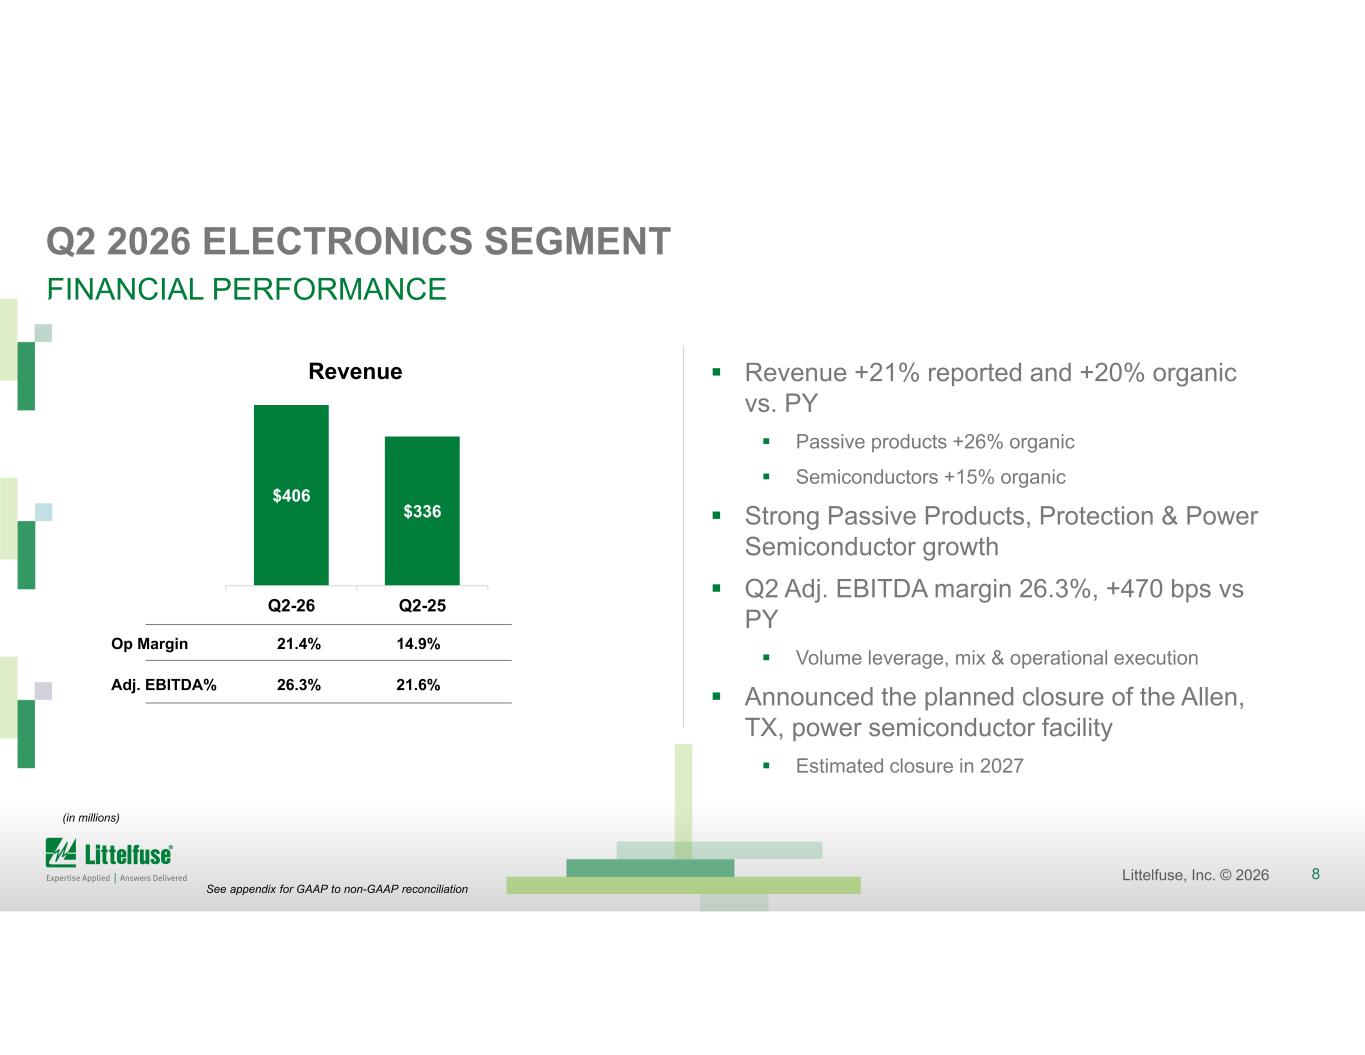
8Littelfuse, Inc. © 2026 Q2 2026 ELECTRONICS SEGMENT FINANCIAL PERFORMANCE Revenue +21% reported and +20% organic vs. PY Passive products +26% organic Semiconductors +15% organic Strong Passive Products, Protection & Power Semiconductor growth Q2 Adj. EBITDA margin 26.3%, +470 bps vs PY Volume leverage, mix & operational execution Announced the planned closure of the Allen, TX, power semiconductor facility Estimated closure in 2027 14.9%21.4%Op Margin 21.6%26.3%Adj. EBITDA% $406 $336 Q2-26 Q2-25 Revenue (in millions) See appendix for GAAP to non-GAAP reconciliation
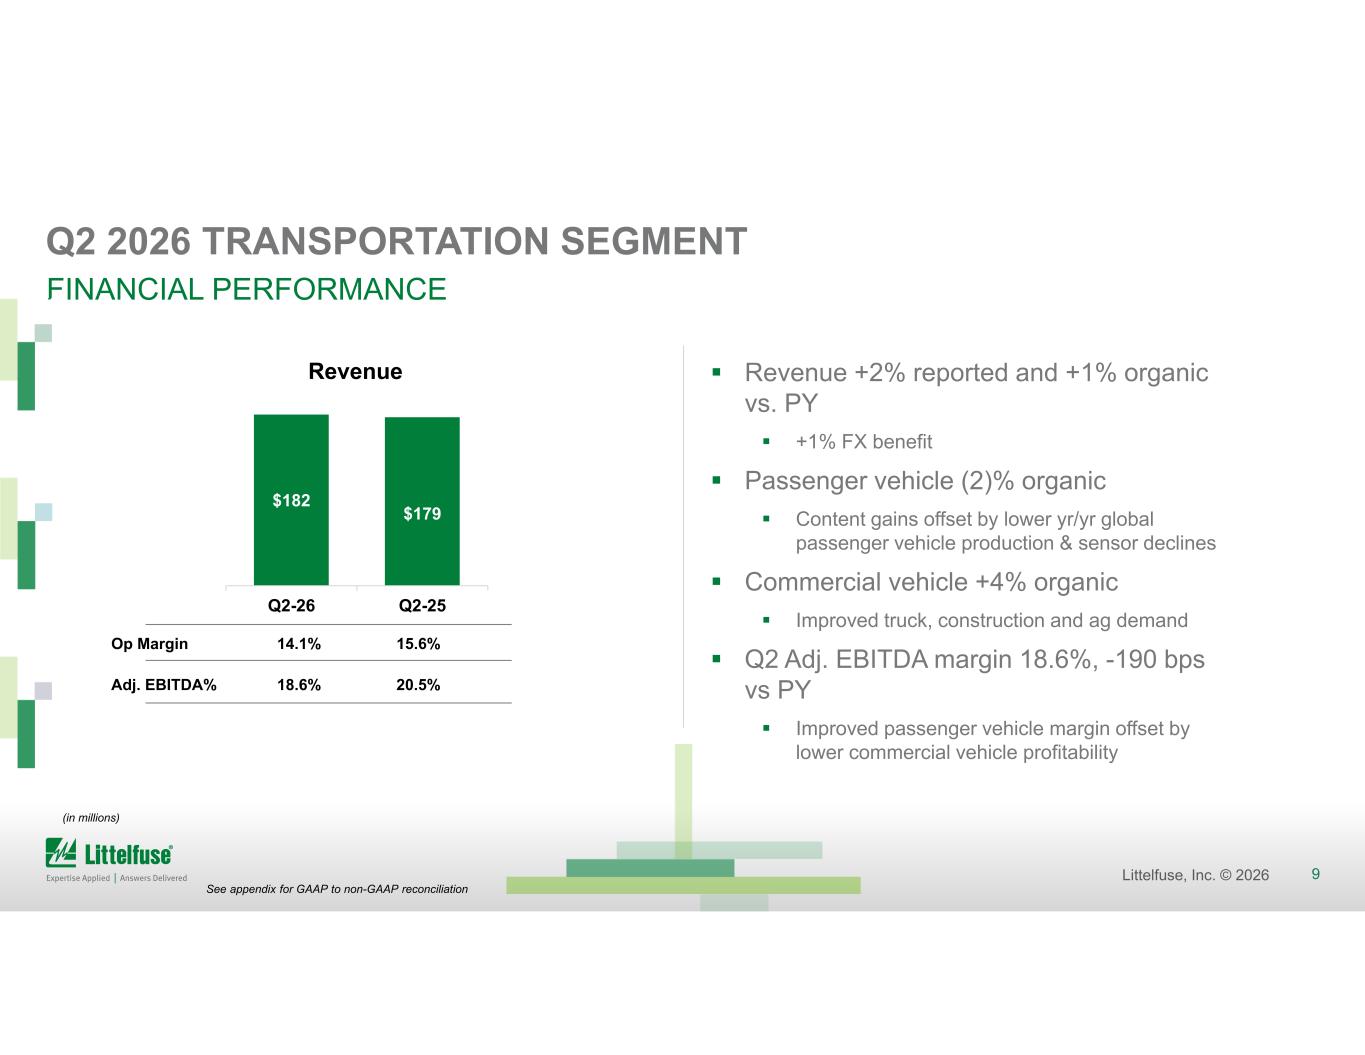
9Littelfuse, Inc. © 2026 Q2 2026 TRANSPORTATION SEGMENT FINANCIAL PERFORMANCE Revenue +2% reported and +1% organic vs. PY +1% FX benefit Passenger vehicle (2)% organic Content gains offset by lower yr/yr global passenger vehicle production & sensor declines Commercial vehicle +4% organic Improved truck, construction and ag demand Q2 Adj. EBITDA margin 18.6%, -190 bps vs PY Improved passenger vehicle margin offset by lower commercial vehicle profitability 15.6%14.1%Op Margin 20.5%18.6%Adj. EBITDA% $182 $179 Q2-26 Q2-25 Revenue (in millions) See appendix for GAAP to non-GAAP reconciliation
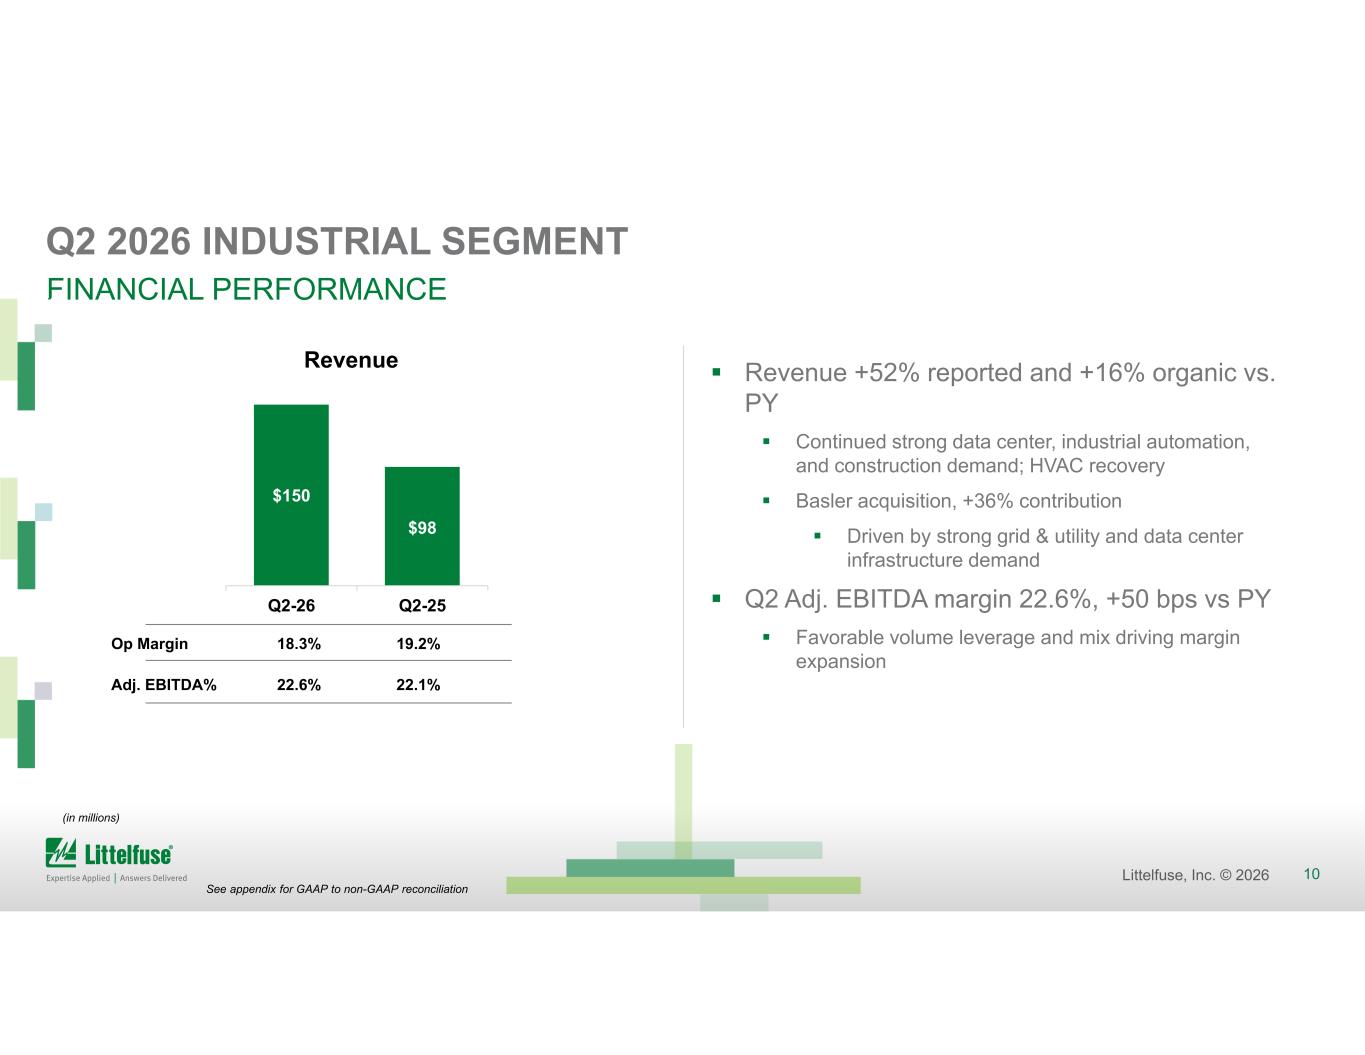
10Littelfuse, Inc. © 2026 Q2 2026 INDUSTRIAL SEGMENT FINANCIAL PERFORMANCE Revenue +52% reported and +16% organic vs. PY Continued strong data center, industrial automation, and construction demand; HVAC recovery Basler acquisition, +36% contribution Driven by strong grid & utility and data center infrastructure demand Q2 Adj. EBITDA margin 22.6%, +50 bps vs PY Favorable volume leverage and mix driving margin expansion 19.2%18.3%Op Margin 22.1%22.6%Adj. EBITDA% $150 $98 Q2-26 Q2-25 Revenue (in millions) See appendix for GAAP to non-GAAP reconciliation
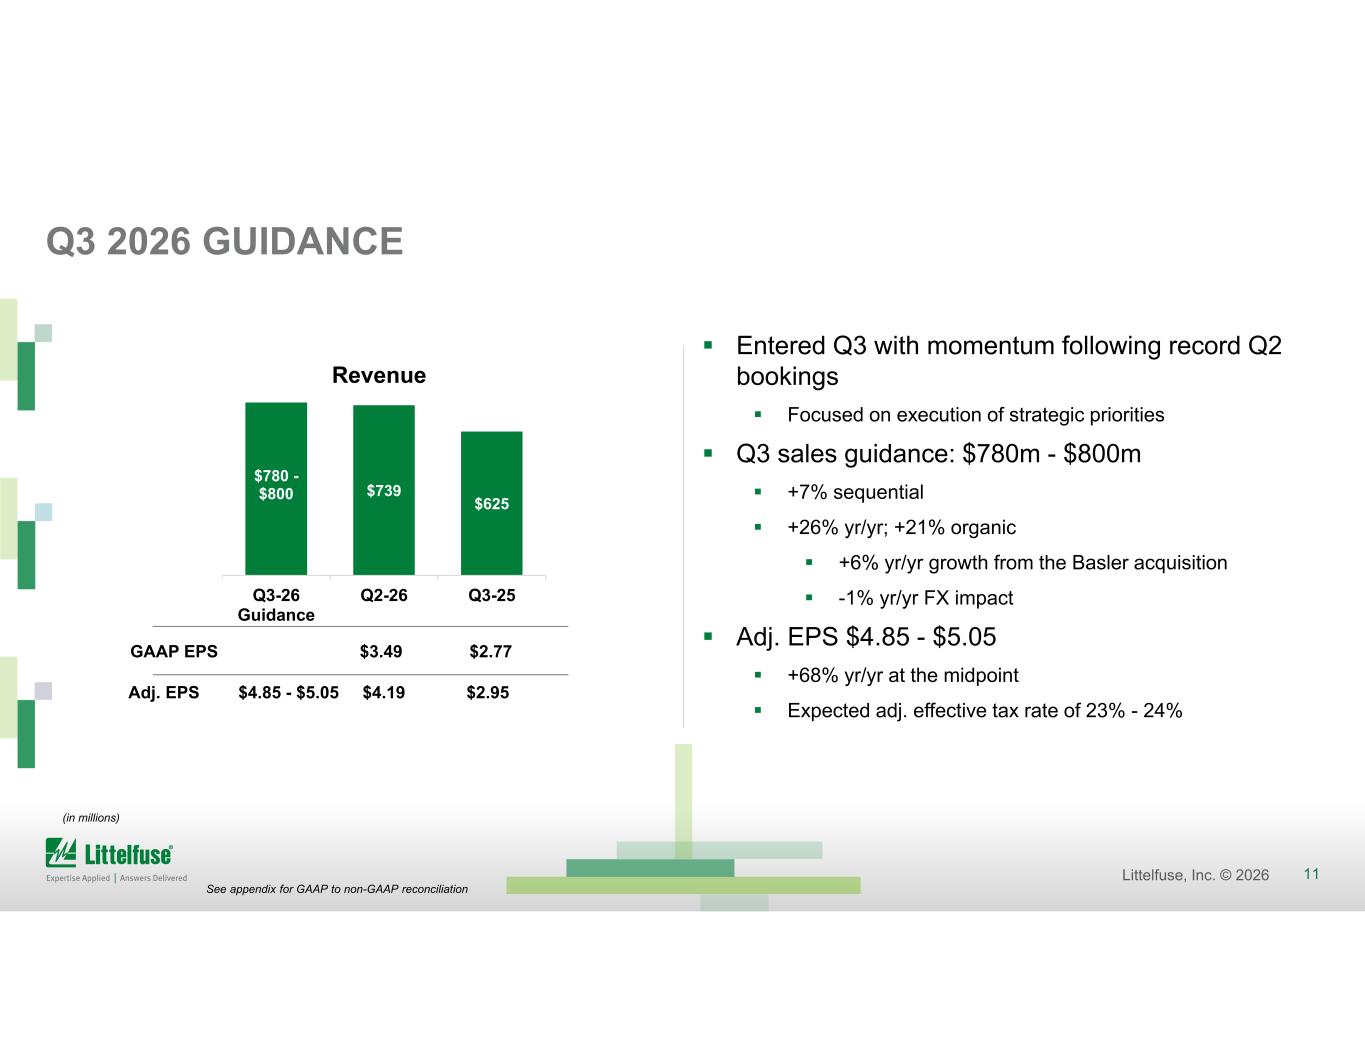
11Littelfuse, Inc. © 2026 Q3 2026 GUIDANCE Entered Q3 with momentum following record Q2 bookings Focused on execution of strategic priorities Q3 sales guidance: $780m - $800m +7% sequential +26% yr/yr; +21% organic +6% yr/yr growth from the Basler acquisition -1% yr/yr FX impact Adj. EPS $4.85 - $5.05 +68% yr/yr at the midpoint Expected adj. effective tax rate of 23% - 24% (in millions) $780 - $800 $739 $625 Q3-26 Guidance Q2-26 Q3-25 Revenue $2.95$4.85 - $5.05 $4.19Adj. EPS $2.77$3.49GAAP EPS See appendix for GAAP to non-GAAP reconciliation
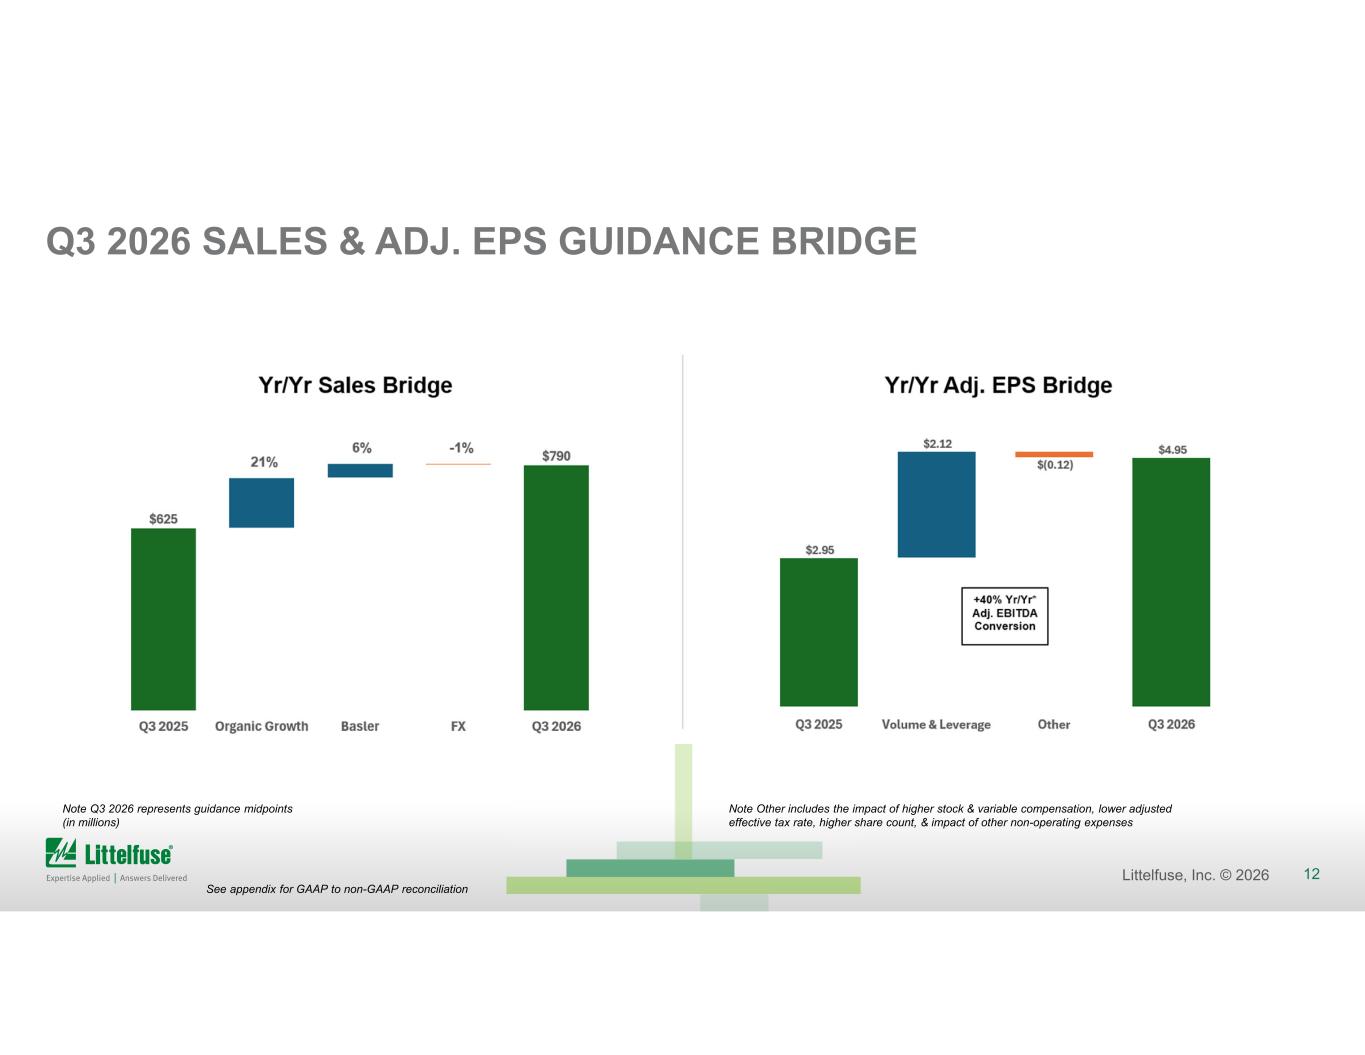
12Littelfuse, Inc. © 2026 Q3 2026 SALES & ADJ. EPS GUIDANCE BRIDGE Note Q3 2026 represents guidance midpoints (in millions) See appendix for GAAP to non-GAAP reconciliation Note Other includes the impact of higher stock & variable compensation, lower adjusted effective tax rate, higher share count, & impact of other non-operating expenses
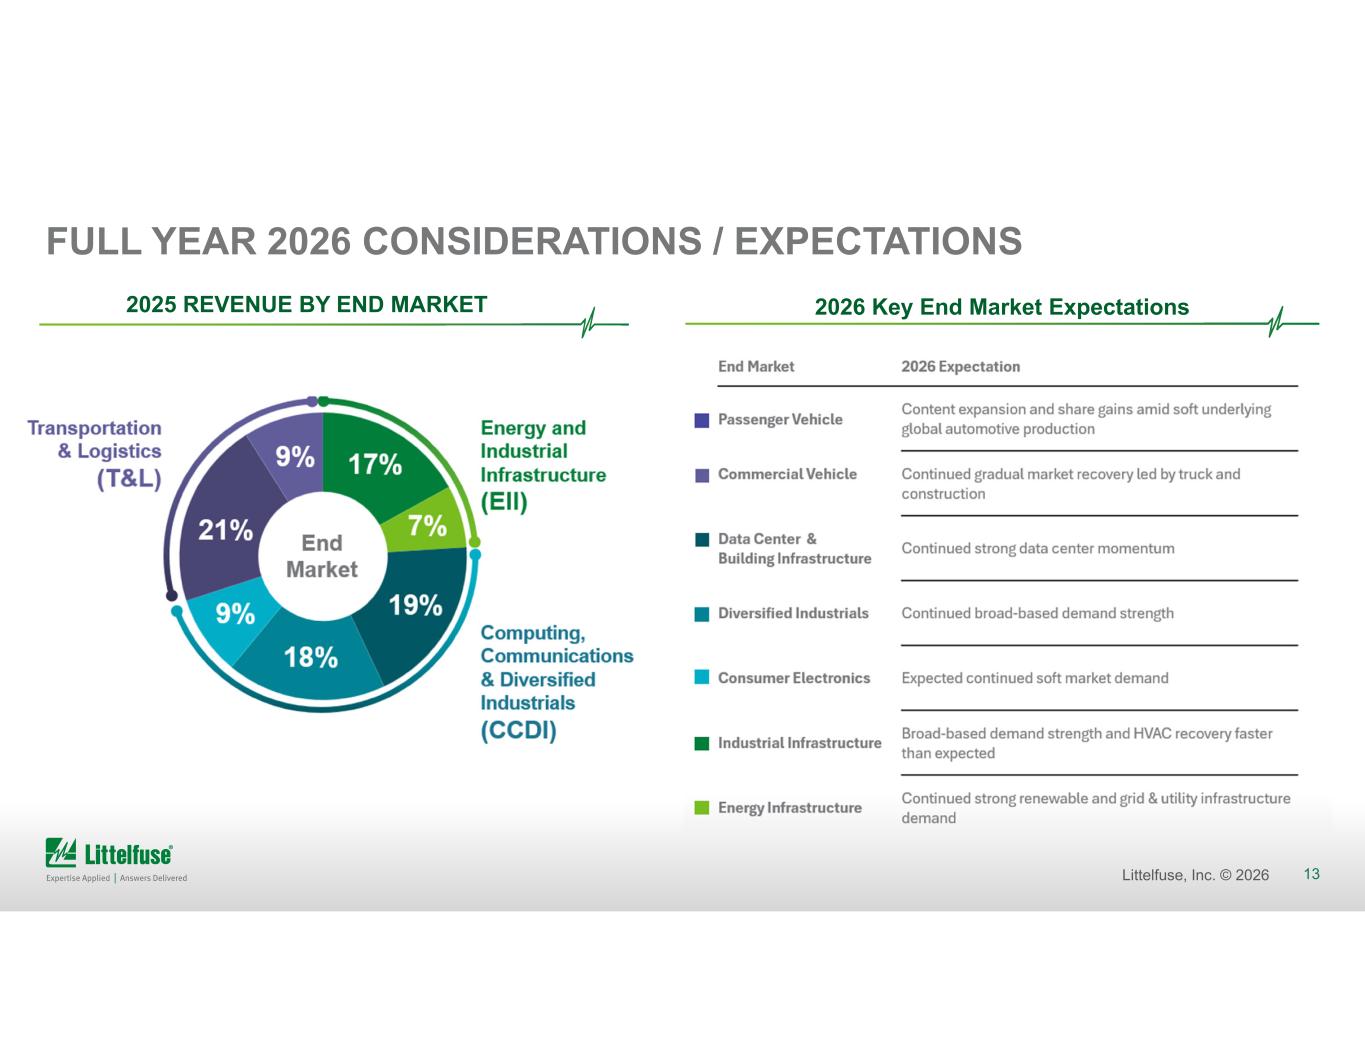
13Littelfuse, Inc. © 2026 FULL YEAR 2026 CONSIDERATIONS / EXPECTATIONS 18% 2025 REVENUE BY END MARKET 2026 Key End Market Expectations
14Littelfuse, Inc. © 2026 APPENDIX
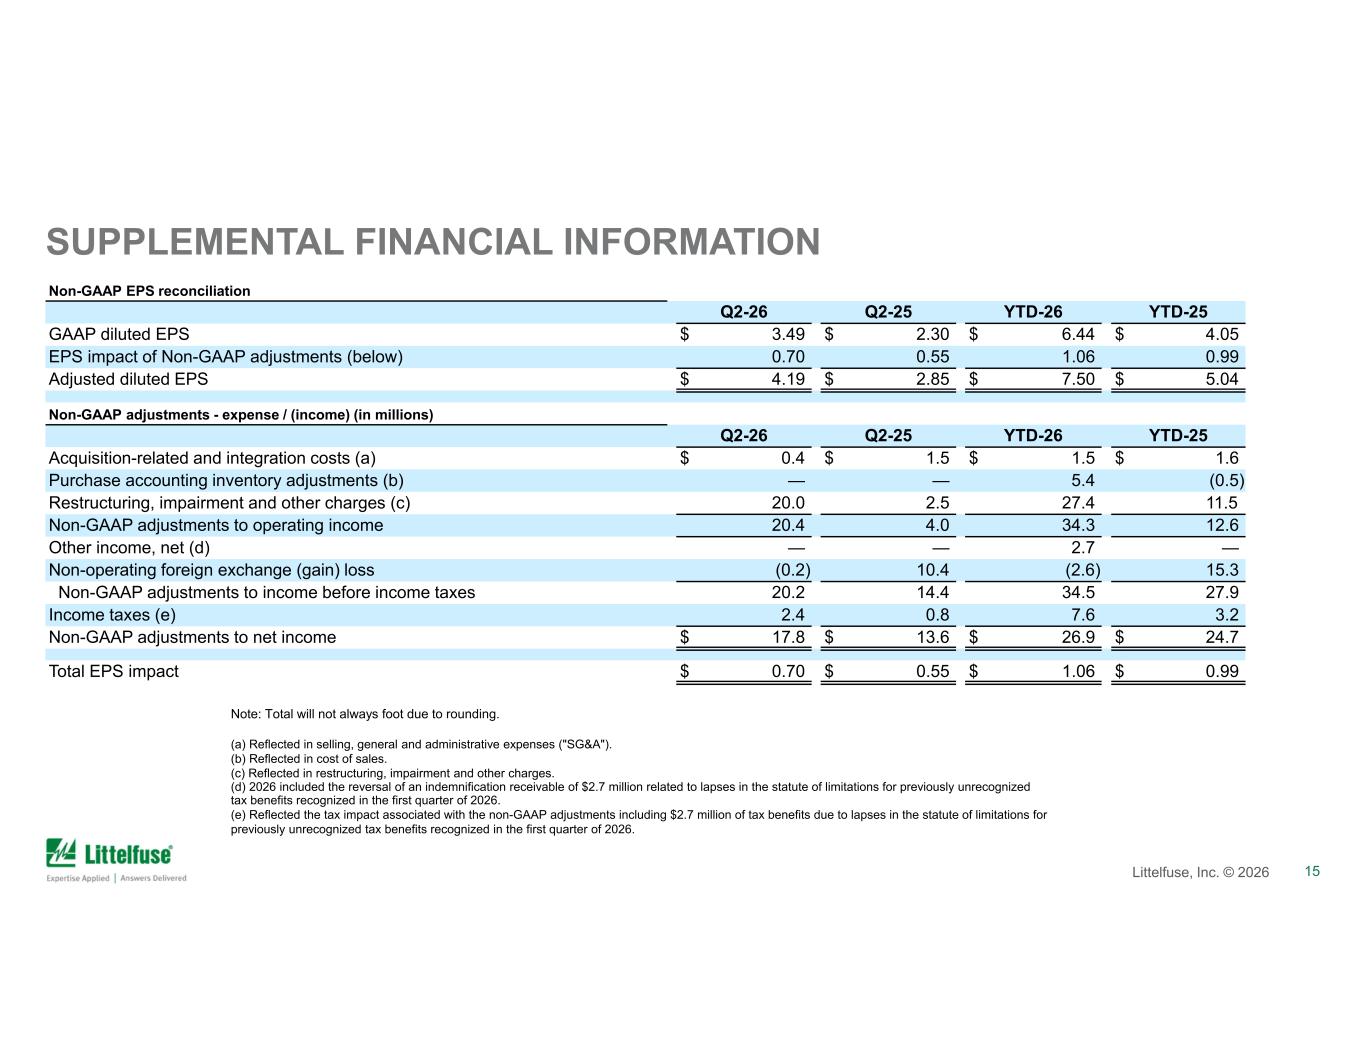
15Littelfuse, Inc. © 2025 15Littelfuse, Inc. © 2026 SUPPLEMENTAL FINANCIAL INFORMATION Note: Total will not always foot due to rounding. (a) Reflected in selling, general and administrative expenses ("SG&A"). (b) Reflected in cost of sales. (c) Reflected in restructuring, impairment and other charges. (d) 2026 included the reversal of an indemnification receivable of $2.7 million related to lapses in the statute of limitations for previously unrecognized tax benefits recognized in the first quarter of 2026. (e) Reflected the tax impact associated with the non-GAAP adjustments including $2.7 million of tax benefits due to lapses in the statute of limitations for previously unrecognized tax benefits recognized in the first quarter of 2026. Non-GAAP EPS reconciliation YTD-25YTD-26Q2-25Q2-26 $ 4.05$ 6.44$ 2.30$ 3.49GAAP diluted EPS 0.991.060.550.70EPS impact of Non-GAAP adjustments (below) $ 5.04$ 7.50$ 2.85$ 4.19Adjusted diluted EPS Non-GAAP adjustments - expense / (income) (in millions) YTD-25YTD-26Q2-25Q2-26 $ 1.6$ 1.5$ 1.5$ 0.4Acquisition-related and integration costs (a) (0.5)5.4——Purchase accounting inventory adjustments (b) 11.527.42.520.0Restructuring, impairment and other charges (c) 12.634.34.020.4Non-GAAP adjustments to operating income —2.7——Other income, net (d) 15.3(2.6)10.4(0.2)Non-operating foreign exchange (gain) loss 27.934.514.420.2Non-GAAP adjustments to income before income taxes 3.27.60.82.4Income taxes (e) $ 24.7$ 26.9$ 13.6$ 17.8Non-GAAP adjustments to net income $ 0.99$ 1.06$ 0.55$ 0.70Total EPS impact
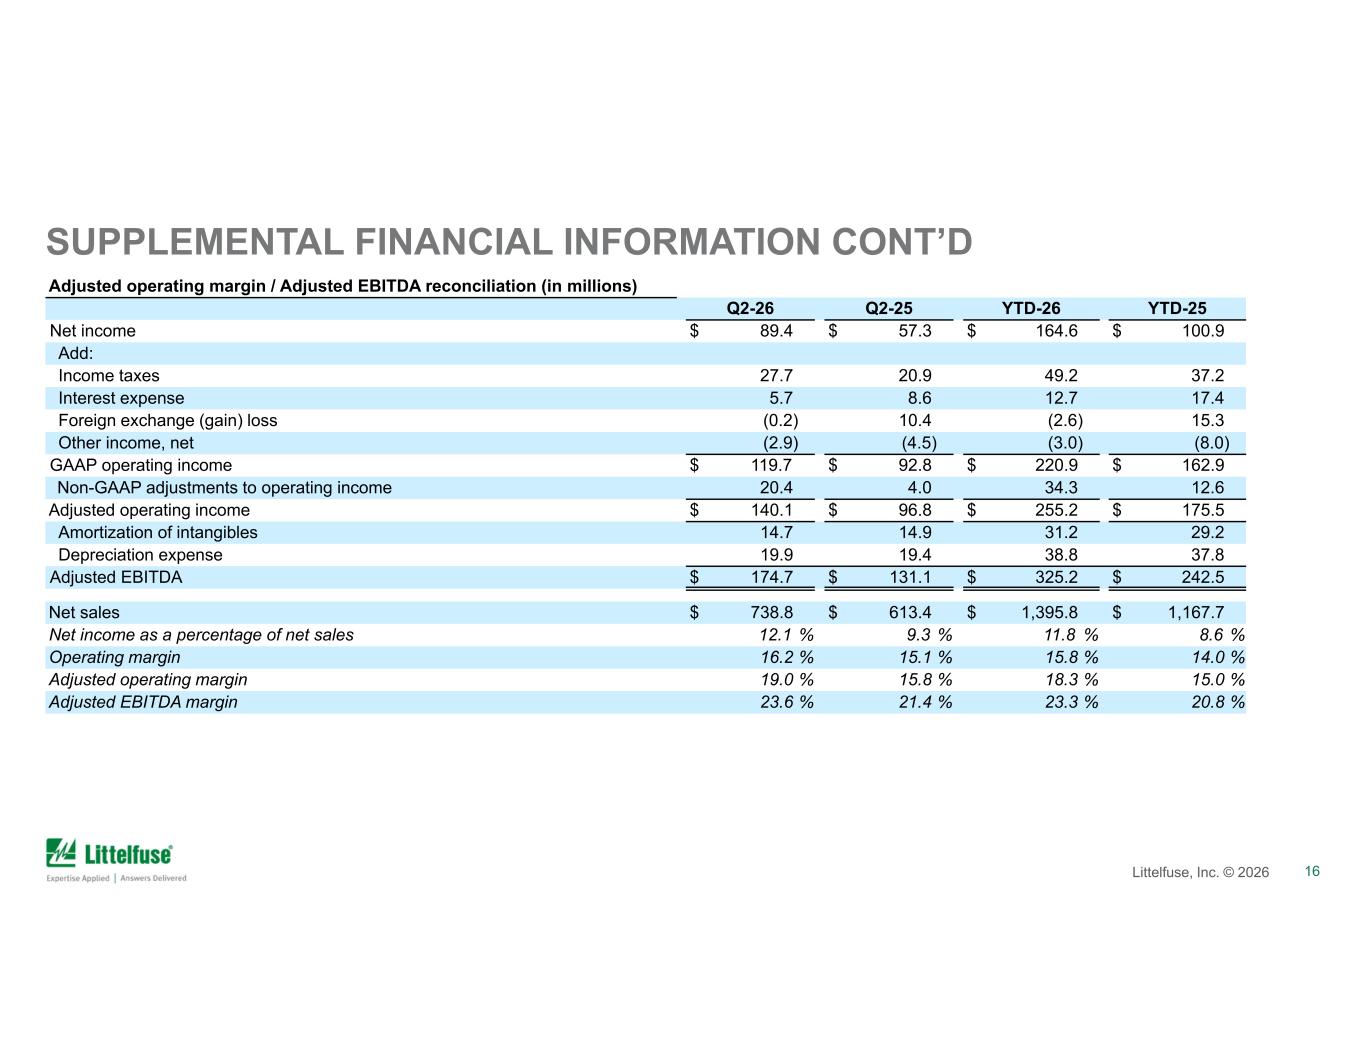
16Littelfuse, Inc. © 2025 16Littelfuse, Inc. © 2026 SUPPLEMENTAL FINANCIAL INFORMATION CONT’D Adjusted operating margin / Adjusted EBITDA reconciliation (in millions) YTD-25YTD-26Q2-25Q2-26 $ 100.9$ 164.6$ 57.3$ 89.4Net income Add: 37.249.220.927.7Income taxes 17.412.78.65.7Interest expense 15.3(2.6)10.4(0.2)Foreign exchange (gain) loss (8.0)(3.0)(4.5)(2.9)Other income, net $ 162.9$ 220.9$ 92.8$ 119.7GAAP operating income 12.634.34.020.4Non-GAAP adjustments to operating income $ 175.5$ 255.2$ 96.8$ 140.1Adjusted operating income 29.231.214.914.7Amortization of intangibles 37.838.819.419.9Depreciation expense $ 242.5$ 325.2$ 131.1$ 174.7Adjusted EBITDA $ 1,167.7$ 1,395.8$ 613.4$ 738.8Net sales 8.6 %11.8 %9.3 %12.1 %Net income as a percentage of net sales 14.0 %15.8 %15.1 %16.2 %Operating margin 15.0 %18.3 %15.8 %19.0 %Adjusted operating margin 20.8 %23.3 %21.4 %23.6 %Adjusted EBITDA margin
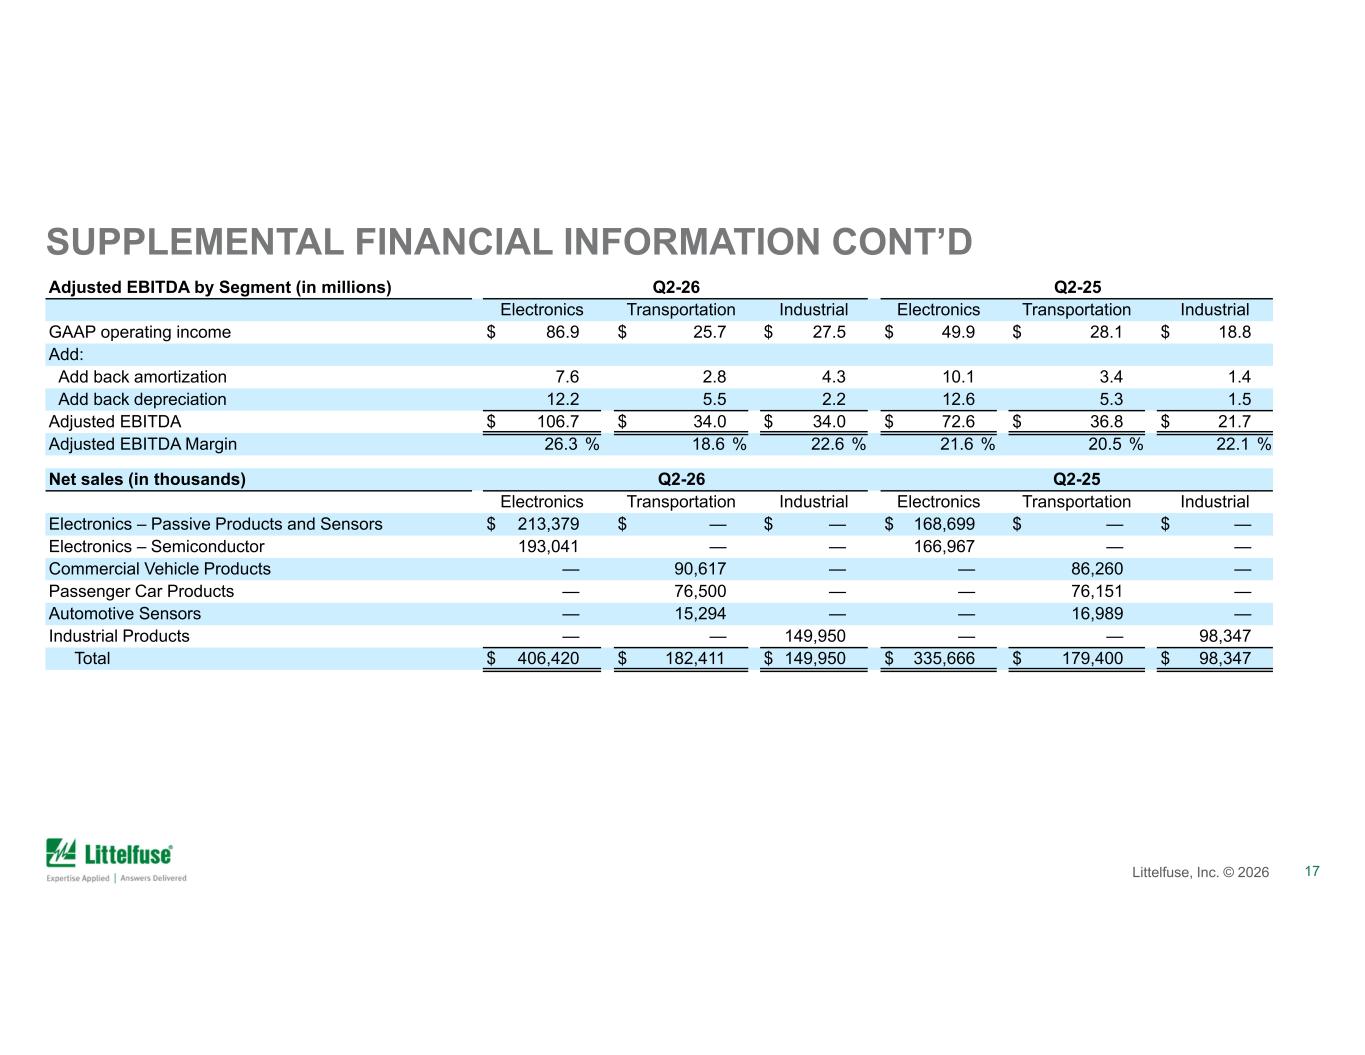
17Littelfuse, Inc. © 2025 17Littelfuse, Inc. © 2026 SUPPLEMENTAL FINANCIAL INFORMATION CONT’D Q2-25Q2-26Adjusted EBITDA by Segment (in millions) IndustrialTransportationElectronicsIndustrialTransportationElectronics $ 18.8$ 28.1$ 49.9$ 27.5$ 25.7$ 86.9GAAP operating income Add: 1.43.410.14.32.87.6Add back amortization 1.55.312.62.25.512.2Add back depreciation $ 21.7$ 36.8$ 72.6$ 34.0$ 34.0$ 106.7Adjusted EBITDA 22.1 %20.5 %21.6 %22.6 %18.6 %26.3 %Adjusted EBITDA Margin Q2-25Q2-26Net sales (in thousands) IndustrialTransportationElectronicsIndustrialTransportationElectronics $ —$ —$ 168,699$ —$ —$ 213,379Electronics – Passive Products and Sensors ——166,967——193,041Electronics – Semiconductor —86,260——90,617—Commercial Vehicle Products —76,151——76,500—Passenger Car Products —16,989——15,294—Automotive Sensors 98,347——149,950——Industrial Products $ 98,347$ 179,400$ 335,666$ 149,950$ 182,411$ 406,420Total
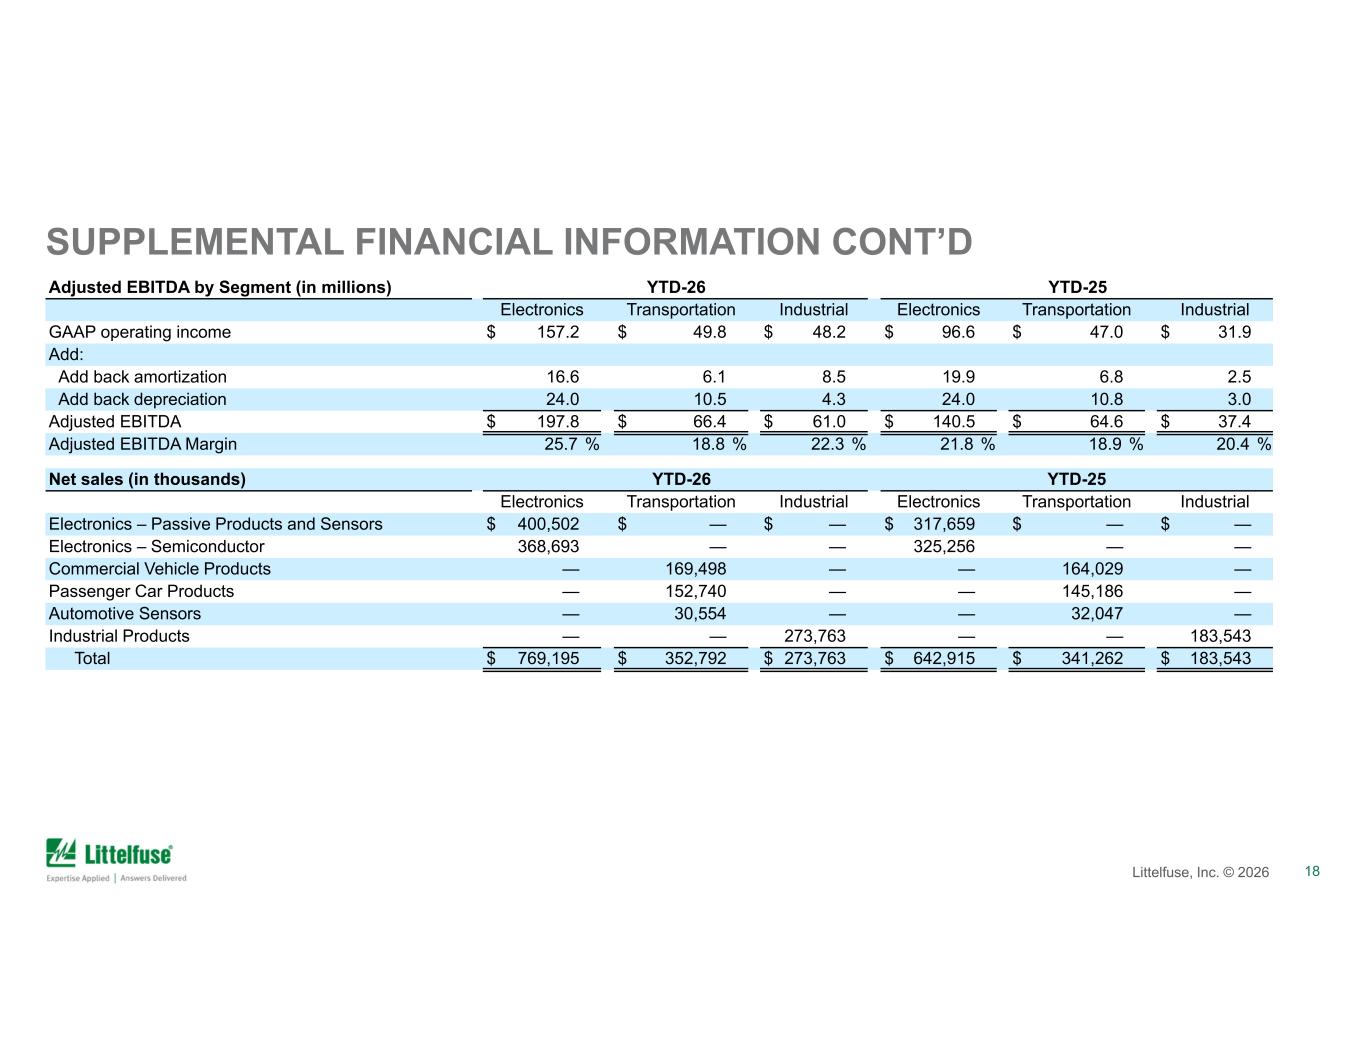
18Littelfuse, Inc. © 2025 18Littelfuse, Inc. © 2026 SUPPLEMENTAL FINANCIAL INFORMATION CONT’D YTD-25YTD-26Adjusted EBITDA by Segment (in millions) IndustrialTransportationElectronicsIndustrialTransportationElectronics $ 31.9$ 47.0$ 96.6$ 48.2$ 49.8$ 157.2GAAP operating income Add: 2.56.819.98.56.116.6Add back amortization 3.010.824.04.310.524.0Add back depreciation $ 37.4$ 64.6$ 140.5$ 61.0$ 66.4$ 197.8Adjusted EBITDA 20.4 %18.9 %21.8 %22.3 %18.8 %25.7 %Adjusted EBITDA Margin YTD-25YTD-26Net sales (in thousands) IndustrialTransportationElectronicsIndustrialTransportationElectronics $ —$ —$ 317,659$ —$ —$ 400,502Electronics – Passive Products and Sensors ——325,256——368,693Electronics – Semiconductor —164,029——169,498—Commercial Vehicle Products —145,186——152,740—Passenger Car Products —32,047——30,554—Automotive Sensors 183,543——273,763——Industrial Products $ 183,543$ 341,262$ 642,915$ 273,763$ 352,792$ 769,195Total
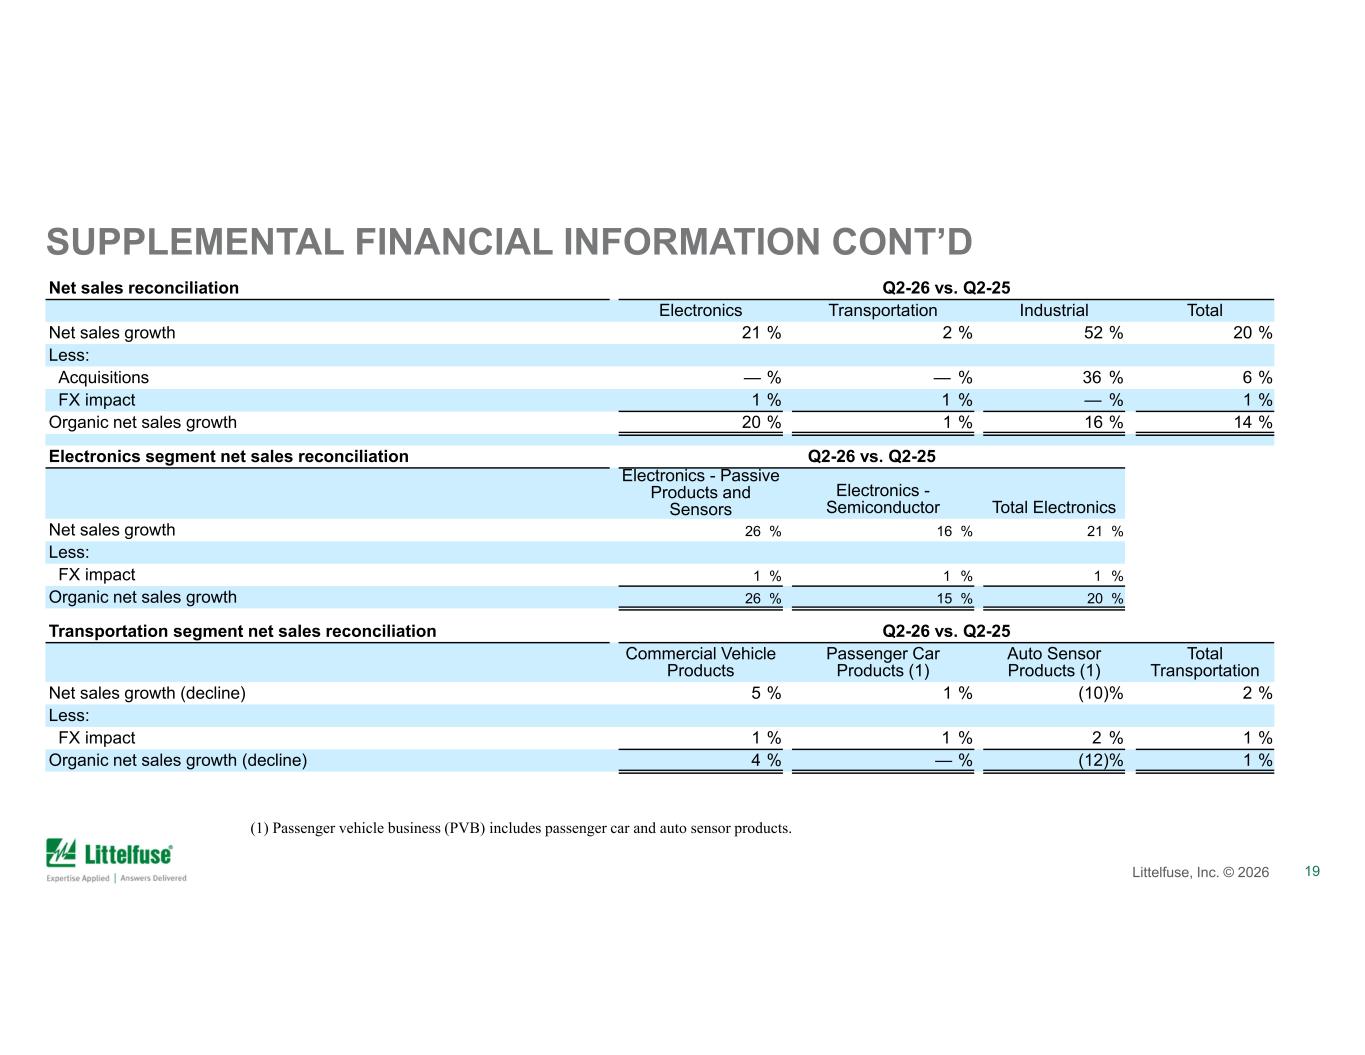
19Littelfuse, Inc. © 2025 19Littelfuse, Inc. © 2026 SUPPLEMENTAL FINANCIAL INFORMATION CONT’D (1) Passenger vehicle business (PVB) includes passenger car and auto sensor products. Q2-26 vs. Q2-25Net sales reconciliation TotalIndustrialTransportationElectronics 20 %52 %2 %21 %Net sales growth Less: 6 %36 %— %— %Acquisitions 1 %— %1 %1 %FX impact 14 %16 %1 %20 %Organic net sales growth Q2-26 vs. Q2-25Electronics segment net sales reconciliation Total Electronics Electronics - Semiconductor Electronics - Passive Products and Sensors 21 %16 %26 %Net sales growth Less: 1 %1 %1 %FX impact 20 %15 %26 %Organic net sales growth Q2-26 vs. Q2-25Transportation segment net sales reconciliation Total Transportation Auto Sensor Products (1) Passenger Car Products (1) Commercial Vehicle Products 2 %(10)%1 %5 %Net sales growth (decline) Less: 1 %2 %1 %1 %FX impact 1 %(12)%— %4 %Organic net sales growth (decline)
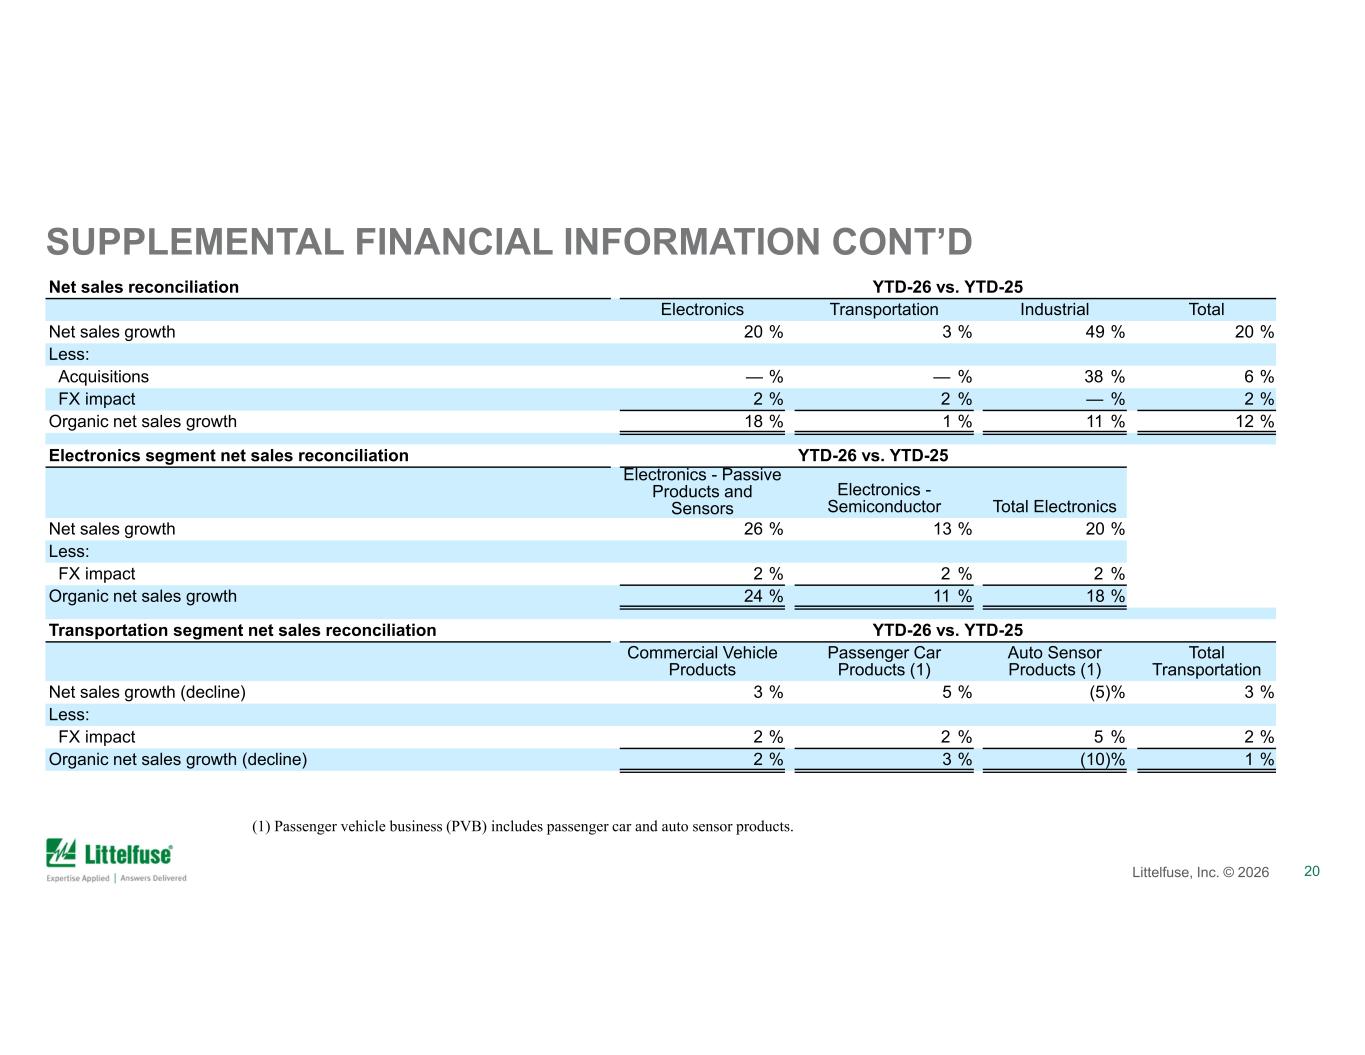
20Littelfuse, Inc. © 2025 20Littelfuse, Inc. © 2026 SUPPLEMENTAL FINANCIAL INFORMATION CONT’D (1) Passenger vehicle business (PVB) includes passenger car and auto sensor products. YTD-26 vs. YTD-25Net sales reconciliation TotalIndustrialTransportationElectronics 20 %49 %3 %20 %Net sales growth Less: 6 %38 %— %— %Acquisitions 2 %— %2 %2 %FX impact 12 %11 %1 %18 %Organic net sales growth YTD-26 vs. YTD-25Electronics segment net sales reconciliation Total Electronics Electronics - Semiconductor Electronics - Passive Products and Sensors 20 %13 %26 %Net sales growth Less: 2 %2 %2 %FX impact 18 %11 %24 %Organic net sales growth YTD-26 vs. YTD-25Transportation segment net sales reconciliation Total Transportation Auto Sensor Products (1) Passenger Car Products (1) Commercial Vehicle Products 3 %(5)%5 %3 %Net sales growth (decline) Less: 2 %5 %2 %2 %FX impact 1 %(10)%3 %2 %Organic net sales growth (decline)
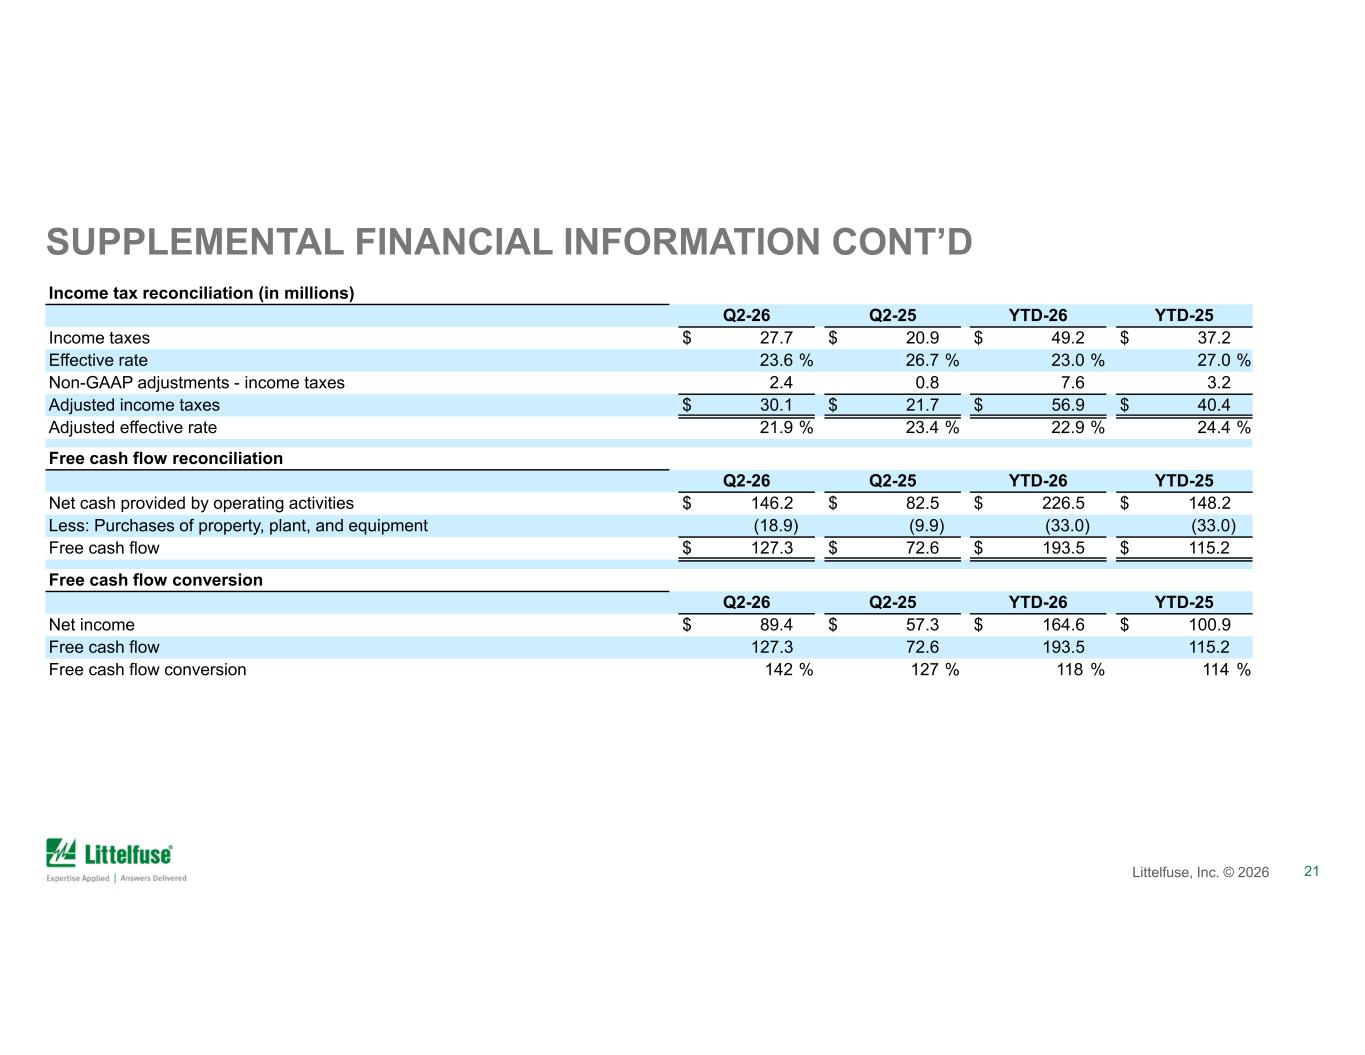
21Littelfuse, Inc. © 2025 21Littelfuse, Inc. © 2026 SUPPLEMENTAL FINANCIAL INFORMATION CONT’D Income tax reconciliation (in millions) YTD-25YTD-26Q2-25Q2-26 $ 37.2$ 49.2$ 20.9$ 27.7Income taxes 27.0 %23.0 %26.7 %23.6 %Effective rate 3.27.60.82.4Non-GAAP adjustments - income taxes $ 40.4$ 56.9$ 21.7$ 30.1Adjusted income taxes 24.4 %22.9 %23.4 %21.9 %Adjusted effective rate Free cash flow reconciliation YTD-25YTD-26Q2-25Q2-26 $ 148.2$ 226.5$ 82.5$ 146.2Net cash provided by operating activities (33.0)(33.0)(9.9)(18.9)Less: Purchases of property, plant, and equipment $ 115.2$ 193.5$ 72.6$ 127.3Free cash flow Free cash flow conversion YTD-25YTD-26Q2-25Q2-26 $ 100.9$ 164.6$ 57.3$ 89.4Net income 115.2193.572.6127.3Free cash flow 114 %118 %127 %142 %Free cash flow conversion
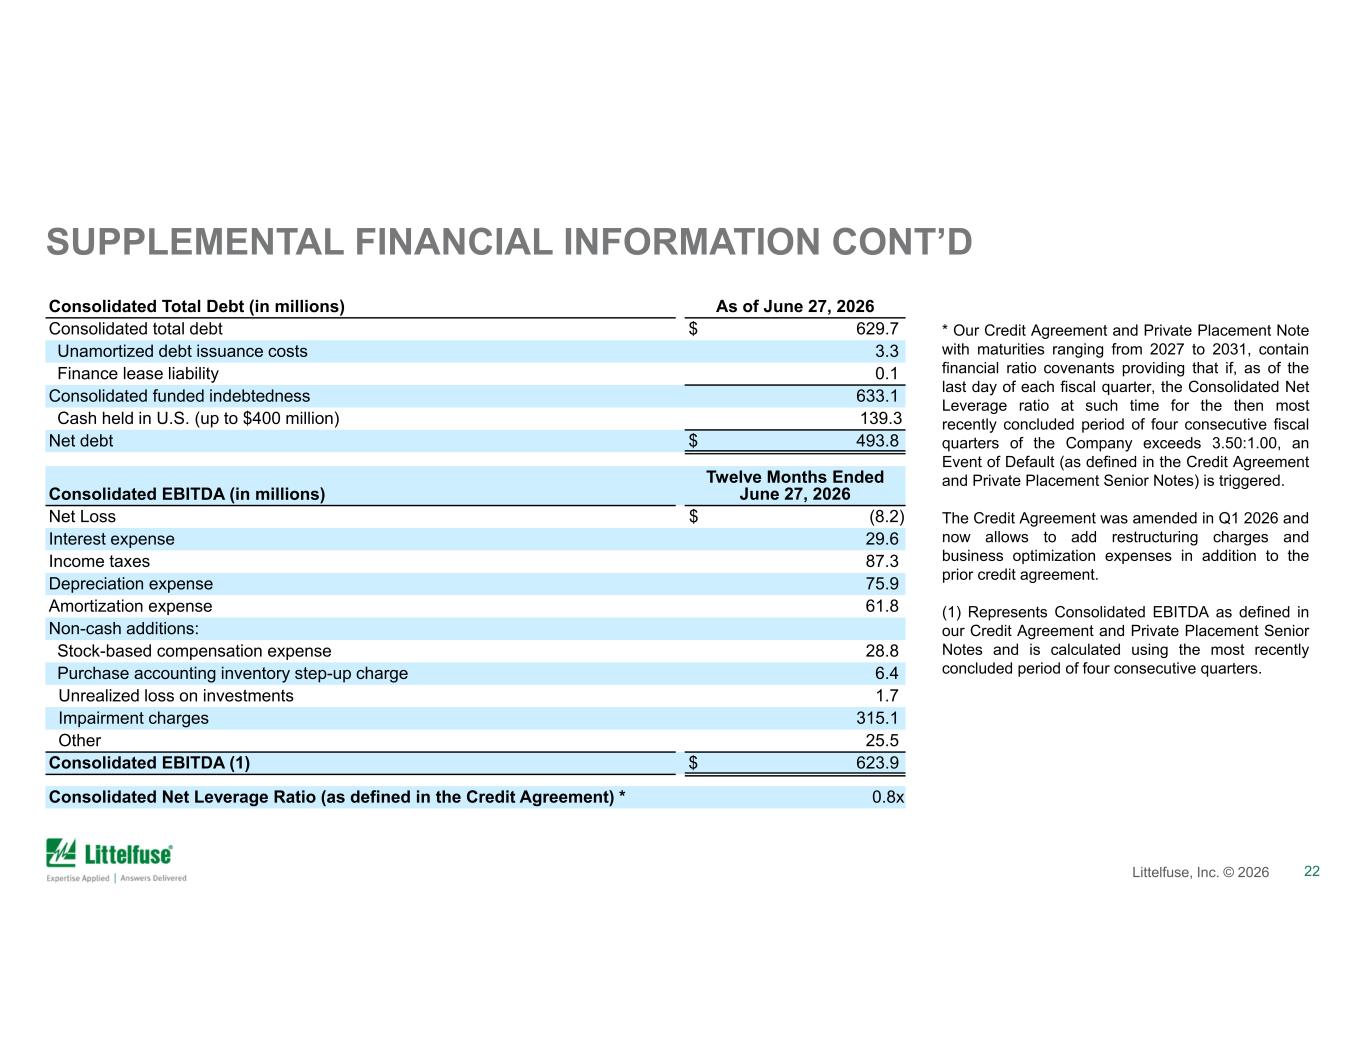
22Littelfuse, Inc. © 2025 22Littelfuse, Inc. © 2026 SUPPLEMENTAL FINANCIAL INFORMATION CONT’D * Our Credit Agreement and Private Placement Note with maturities ranging from 2027 to 2031, contain financial ratio covenants providing that if, as of the last day of each fiscal quarter, the Consolidated Net Leverage ratio at such time for the then most recently concluded period of four consecutive fiscal quarters of the Company exceeds 3.50:1.00, an Event of Default (as defined in the Credit Agreement and Private Placement Senior Notes) is triggered. The Credit Agreement was amended in Q1 2026 and now allows to add restructuring charges and business optimization expenses in addition to the prior credit agreement. (1) Represents Consolidated EBITDA as defined in our Credit Agreement and Private Placement Senior Notes and is calculated using the most recently concluded period of four consecutive quarters. As of June 27, 2026Consolidated Total Debt (in millions) $ 629.7Consolidated total debt 3.3Unamortized debt issuance costs 0.1Finance lease liability 633.1Consolidated funded indebtedness 139.3Cash held in U.S. (up to $400 million) $ 493.8Net debt Twelve Months Ended June 27, 2026Consolidated EBITDA (in millions) $ (8.2)Net Loss 29.6Interest expense 87.3Income taxes 75.9Depreciation expense 61.8Amortization expense Non-cash additions: 28.8Stock-based compensation expense 6.4Purchase accounting inventory step-up charge 1.7Unrealized loss on investments 315.1Impairment charges 25.5Other $ 623.9Consolidated EBITDA (1) 0.8xConsolidated Net Leverage Ratio (as defined in the Credit Agreement) *
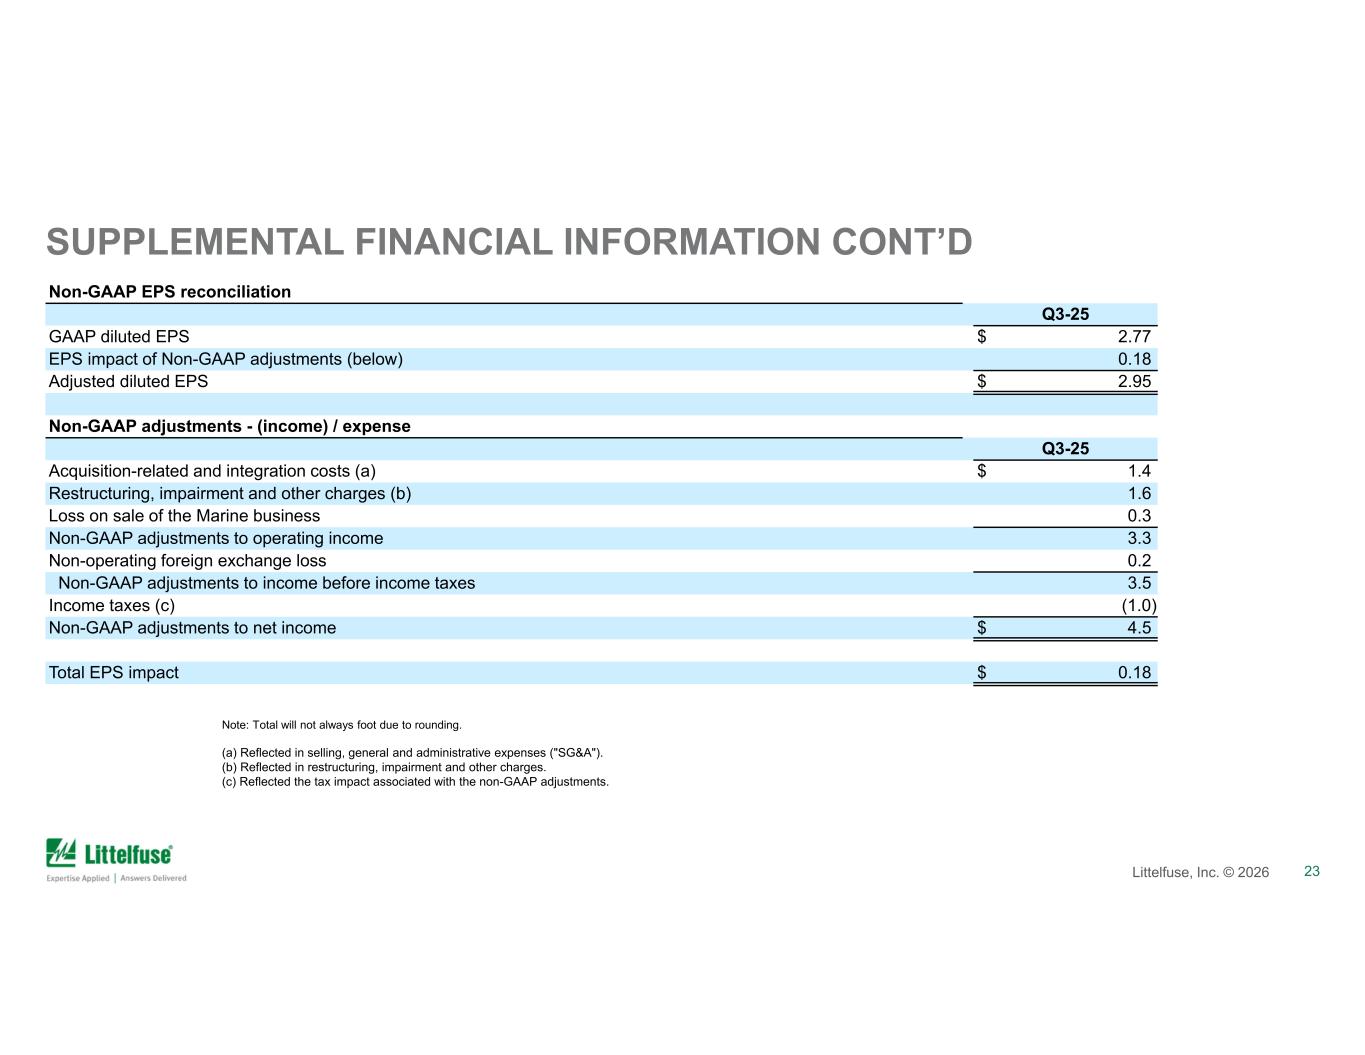
23Littelfuse, Inc. © 2025 23Littelfuse, Inc. © 2026 SUPPLEMENTAL FINANCIAL INFORMATION CONT’D Note: Total will not always foot due to rounding. (a) Reflected in selling, general and administrative expenses ("SG&A"). (b) Reflected in restructuring, impairment and other charges. (c) Reflected the tax impact associated with the non-GAAP adjustments. Non-GAAP EPS reconciliation Q3-25 $ 2.77GAAP diluted EPS 0.18EPS impact of Non-GAAP adjustments (below) $ 2.95Adjusted diluted EPS Non-GAAP adjustments - (income) / expense Q3-25 $ 1.4Acquisition-related and integration costs (a) 1.6Restructuring, impairment and other charges (b) 0.3Loss on sale of the Marine business 3.3Non-GAAP adjustments to operating income 0.2Non-operating foreign exchange loss 3.5Non-GAAP adjustments to income before income taxes (1.0)Income taxes (c) $ 4.5Non-GAAP adjustments to net income $ 0.18Total EPS impact