Investor Conference Call July 29, 2026
Call Agenda Discussion of Sanara MedTech Acquisition Review of Q2:26 Operating & Financial Results & (standalone) 2026 Outlook Q&A | 2 |
Disclaimer & Cautionary Statements This presentation and our earnings call includes forward-looking statements. Forward-looking statements are subject to risks and uncertainties, and the Company cautions investors against placing undue reliance on such statements. Actual results may differ materially from those set forth in the forward-looking statements. Such forward-looking statements include statements regarding: • Growing expansion outside of the U.S.; • Our growth expectations in 2026 and beyond, including our growth in surgery, increased funding in targeted research and expanded product portfolio; • Expected results of research and development, including that our efforts will innovate and diversify our product portfolio; • Placental-derived products and their potential clinical benefits; • EPIEFFECT® and CHORIOFIX randomized controlled trial enrollment; • Expectations regarding the reimbursement environment for the Company’s products, including Medicare Spending; • Expectations regarding HELIOGEN®, AMNIOFIX®, AMNIOEFFECT®, as well as Hydrelix, NovaForm®, and G4Derm® Plus driving Surgical growth; • Our expectations that we will continue to advocate for Medicare spending reform; • Exposure to tariffs and the anticipation that they will not impact the Company’s results; • 2026 full-year revenue range and Adjusted EBITDA margin, our Long-term non-GAAP effective tax rates and top-line growth post reform in Medicare spending; • Our ability to manage Private Office and Wound Care Center/Hospital Outpatient dynamics, including adjusting our strategy to remain competitive; and • The Company’s long-term strategy and goals for value creation, the status of its pipeline products, expectations for future products, and expectations for future growth and profitability Additional forward-looking statements may be identified by words such as "believe," "expect," "may," "plan," "potential," "will," "preliminary," and similar expressions, and are based on management's current beliefs and expectations. Forward-looking statements are subject to risks and uncertainties, and the Company cautions investors against placing undue reliance on such statements. Actual results may differ materially from those set forth in the forward-looking statements. Factors that could cause actual results to differ from expectations include: • Future sales are uncertain and are affected by competition, access to customers, patient access to hospitals and healthcare providers, the reimbursement environment and many other factors; • The future market for the Company’s products can depend on regulatory approval of such products, which might not occur at all or when expected, and is based in part on assumptions regarding the number of patients who elect less acute and more acute treatment than the Company’s products, market acceptance of the Company’s products, and adequate reimbursement for such therapies; • The process of obtaining regulatory clearances or approvals to market a biological product or medical device from the FDA or similar regulatory authorities outside of the U.S. is costly and time consuming, and such clearances or approvals may not be granted on a timely basis, or at all, and the ability to obtain the rights to market additional, suitable products depends on negotiations with third parties which may not be forthcoming; and • The Company describes additional risks and uncertainties in the Risk Factors section of its most recent annual report and quarterly reports filed with the Securities and Exchange Commission. Any forward-looking statements speak only as of the date of this presentation and the Company assumes no obligation to update any forward-looking statement. | 3 |
Disclaimer No Offer or Solicitation This presentation does not constitute an offer to sell or the solicitation of an offer to subscribe for or buy any securities or a solicitation of any vote or approval with respect to the Transactions or otherwise, nor shall there be any sale, issuance or transfer of securities in any jurisdiction in which such offer, solicitation or sale would be unlawful prior to registration or qualification under the securities laws of any such jurisdiction. Important Additional Information In connection with the Transactions, the Company intends to file with the SEC a Registration Statement on Form S-4 (the “S-4”). Additionally, Sanara MedTech intends to file with the SEC a proxy statement on Schedule 14A (the “Proxy Statement”). The definitive Proxy Statement (if and when available) will be mailed to stockholders of Sanara. Investors will be able to obtain free copies of the Registration Statement and Proxy Statement, as each may be amended from time to time, and other relevant documents filed by Sanara MedTech and the Company with the SEC (when they become available) through the website maintained by the SEC at www.sec.gov. Copies of documents filed with the SEC by Sanara MedTech will be available free of charge from Sanara’s website at www.sanaramedtech.com under the “Investor Relations” tab or by contacting Sanara MedTech’s Investor Relations Department IR@sanaramedtech.com. Copies of documents filed with the SEC by the Company will be available free of charge from the Company’s website at www.mimedx.com under the “Investors” tab or by contacting the Company’s Investor Relations Department at investorrelations@mimedx.com. Participants in the Solicitation Sanara MedTech, the Company and their respective directors and certain of their executive officers and other members of management and employees may be deemed, under SEC rules, to be participants in the solicitation of proxies from Sanara’s stockholders in connection with the Transactions. Information regarding the executive officers and directors of the Company is included in its Proxy Statement filed with the SEC on April 29, 2026. Information regarding the executive officers and directors of Sanara MedTech is included in its Proxy Statement filed with the SEC on April 17, 2026. Additional information regarding the persons who may be deemed participants and their direct and indirect interests, by security holdings or otherwise, will be set forth in the Registration Statement and other materials when they are filed with the SEC in connection with the Transactions. Free copies of these documents may be obtained as described in the paragraphs above. | 4 |

Opening Remarks Joseph H. Capper, Chief Executive Officer | 5 |
Leading Surgical-Focused Combination Driving Growth, Scale & Profitability | 6 | HEAL PROTECT HUMANS PROMOTE HELPING PREPARE
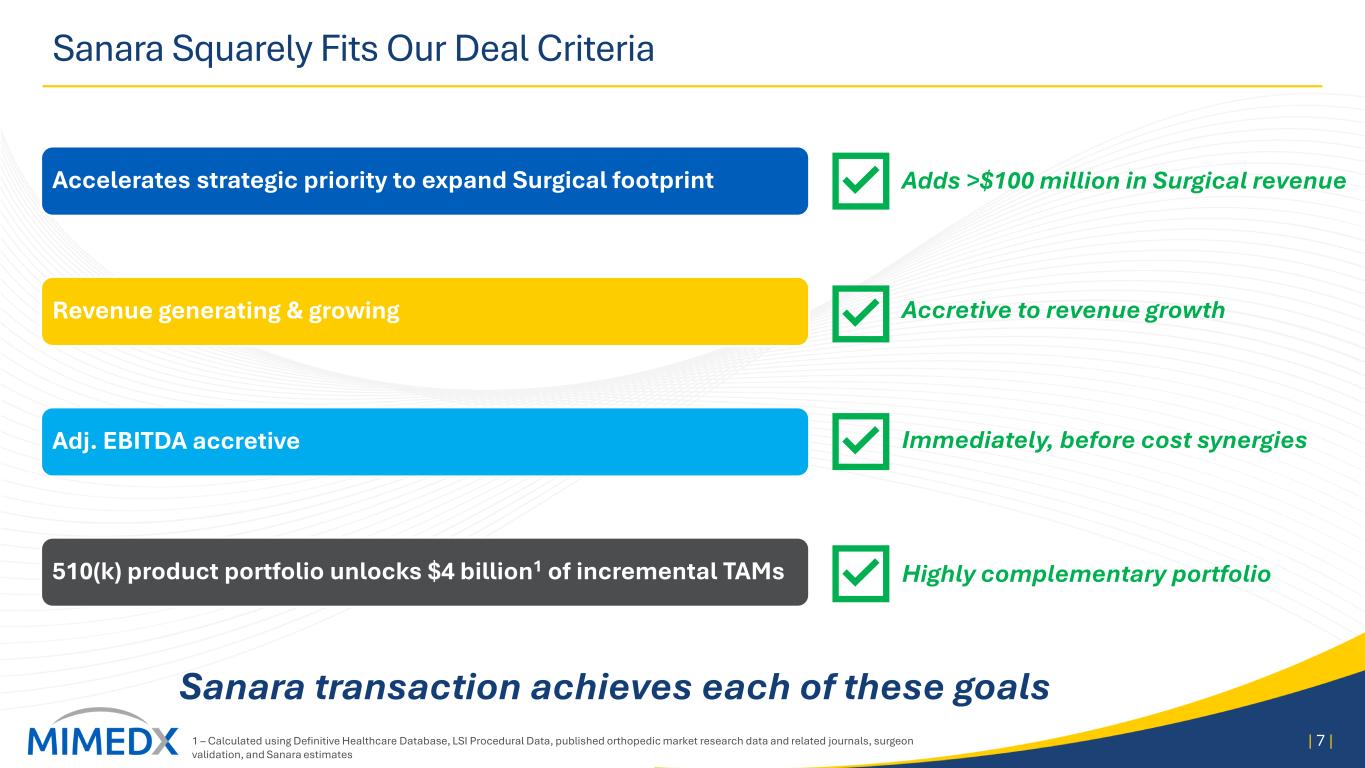
Sanara Squarely Fits Our Deal Criteria Accelerates strategic priority to expand Surgical footprint Revenue generating & growing Adj. EBITDA accretive 510(k) product portfolio unlocks $4 billion1 of incremental TAMs | 7 | Sanara transaction achieves each of these goals Adds >$100 million in Surgical revenue Accretive to revenue growth Immediately, before cost synergies Highly complementary portfolio 1 – Calculated using Definitive Healthcare Database, LSI Procedural Data, published orthopedic market research data and related journals, surgeon validation, and Sanara estimates
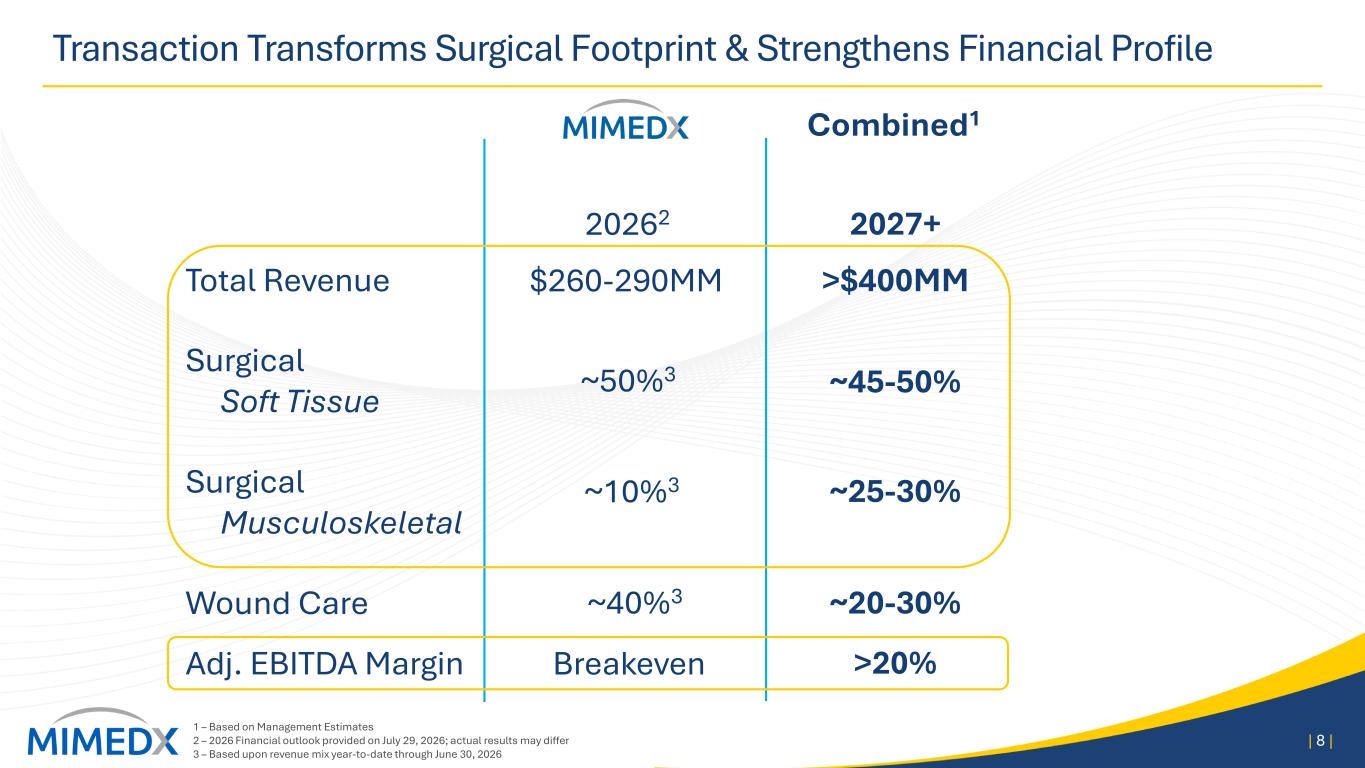
Transaction Transforms Surgical Footprint & Strengthens Financial Profile 1 – Based on Management Estimates 2 – 2026 Financial outlook provided on July 29, 2026; actual results may differ 3 – Based upon revenue mix year-to-date through June 30, 2026 | 8 | Surgical Soft Tissue Surgical Musculoskeletal Wound Care Total Revenue Adj. EBITDA Margin 20262 2027+ $260-290MM >$400MM Breakeven ~40%3 ~50%3 ~10%3 ~45-50% ~25-30% ~20-30% >20% Combined1
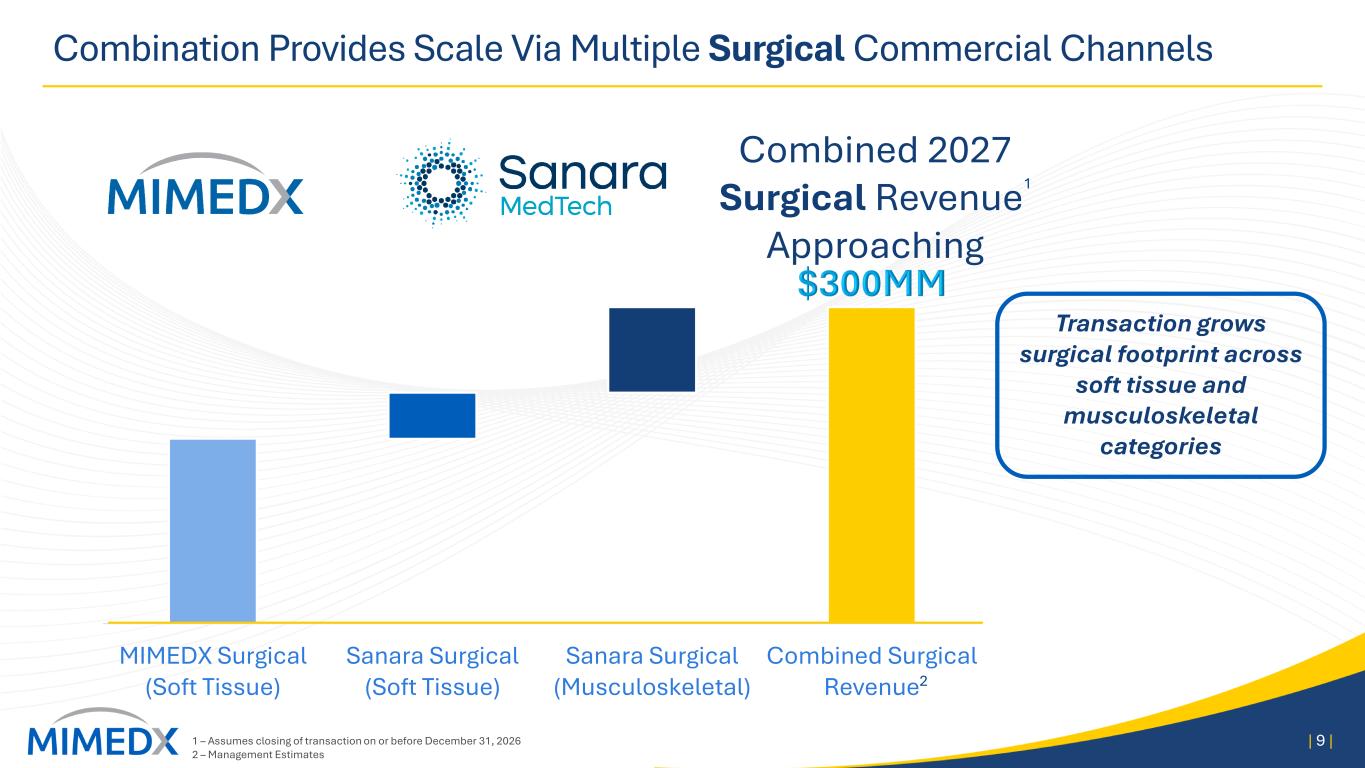
Combination Provides Scale Via Multiple Surgical Commercial Channels | 9 | Transaction grows surgical footprint across soft tissue and musculoskeletal categories MIMEDX Surgical (Soft Tissue) Sanara Surgical (Soft Tissue) Sanara Surgical (Musculoskeletal) Combined Surgical Revenue Combined 2027 Surgical Revenue Approaching 2 1 – Assumes closing of transaction on or before December 31, 2026 2 – Management Estimates 1
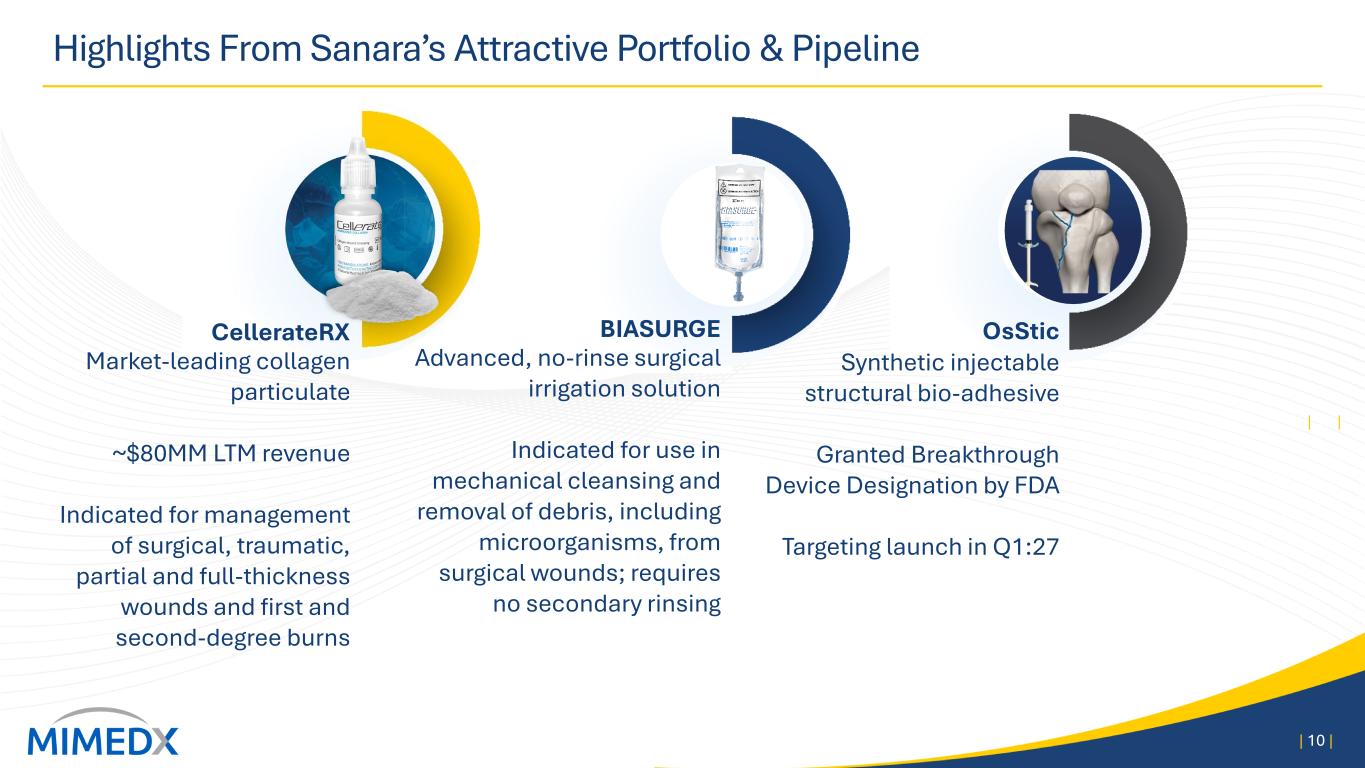
CellerateRX Market-leading collagen particulate ~$80MM LTM revenue Indicated for management of surgical, traumatic, partial and full-thickness wounds and first and second-degree burns Highlights From Sanara’s Attractive Portfolio & Pipeline | 10 | | 10 | OsStic Synthetic injectable structural bio-adhesive Granted Breakthrough Device Designation by FDA Targeting launch in Q1:27 BIASURGE Advanced, no-rinse surgical irrigation solution Indicated for use in mechanical cleansing and removal of debris, including microorganisms, from surgical wounds; requires no secondary rinsing
Q2:26 Highlights | 11 |
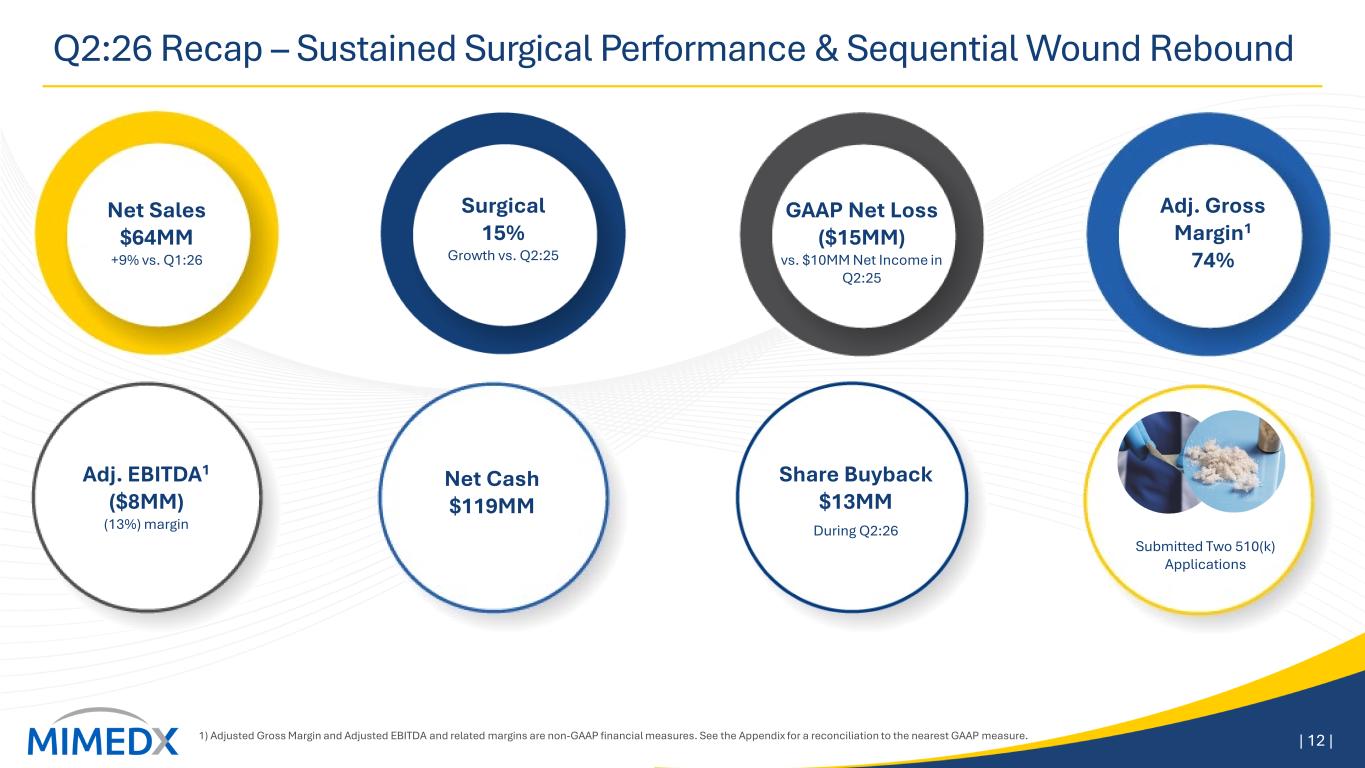
Q2:26 Recap – Sustained Surgical Performance & Sequential Wound Rebound 1) Adjusted Gross Margin and Adjusted EBITDA and related margins are non-GAAP financial measures. See the Appendix for a reconciliation to the nearest GAAP measure. | 12 | Surgical 15% Growth vs. Q2:25 Adj. Gross Margin1 74% GAAP Net Loss ($15MM) vs. $10MM Net Income in Q2:25 Net Sales $64MM +9% vs. Q1:26 Adj. EBITDA1 ($8MM) (13%) margin Net Cash $119MM During Q2:26 Share Buyback $13MM Submitted Two 510(k) Applications
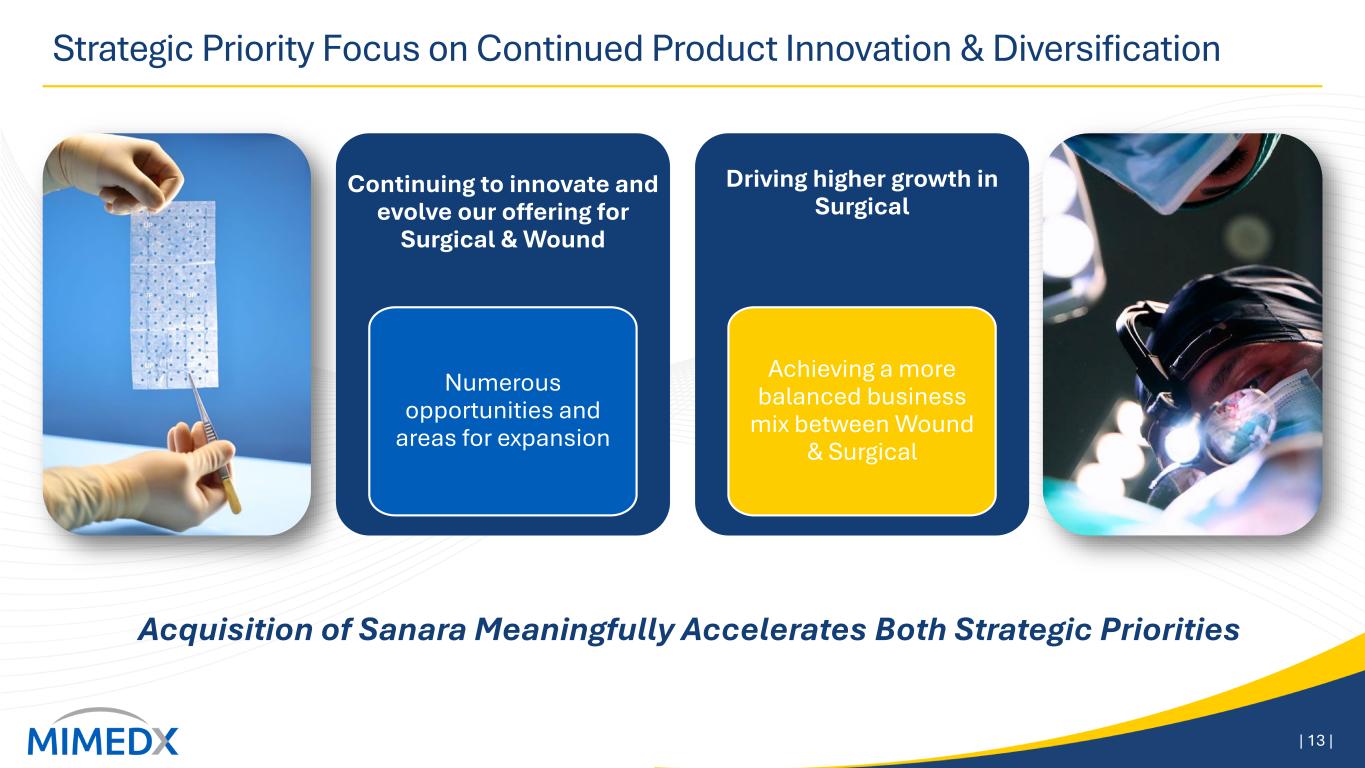
Strategic Priority Focus on Continued Product Innovation & Diversification | 13 | Continuing to innovate and evolve our offering for Surgical & Wound Numerous opportunities and areas for expansion Driving higher growth in Surgical Achieving a more balanced business mix between Wound & Surgical Acquisition of Sanara Meaningfully Accelerates Both Strategic Priorities
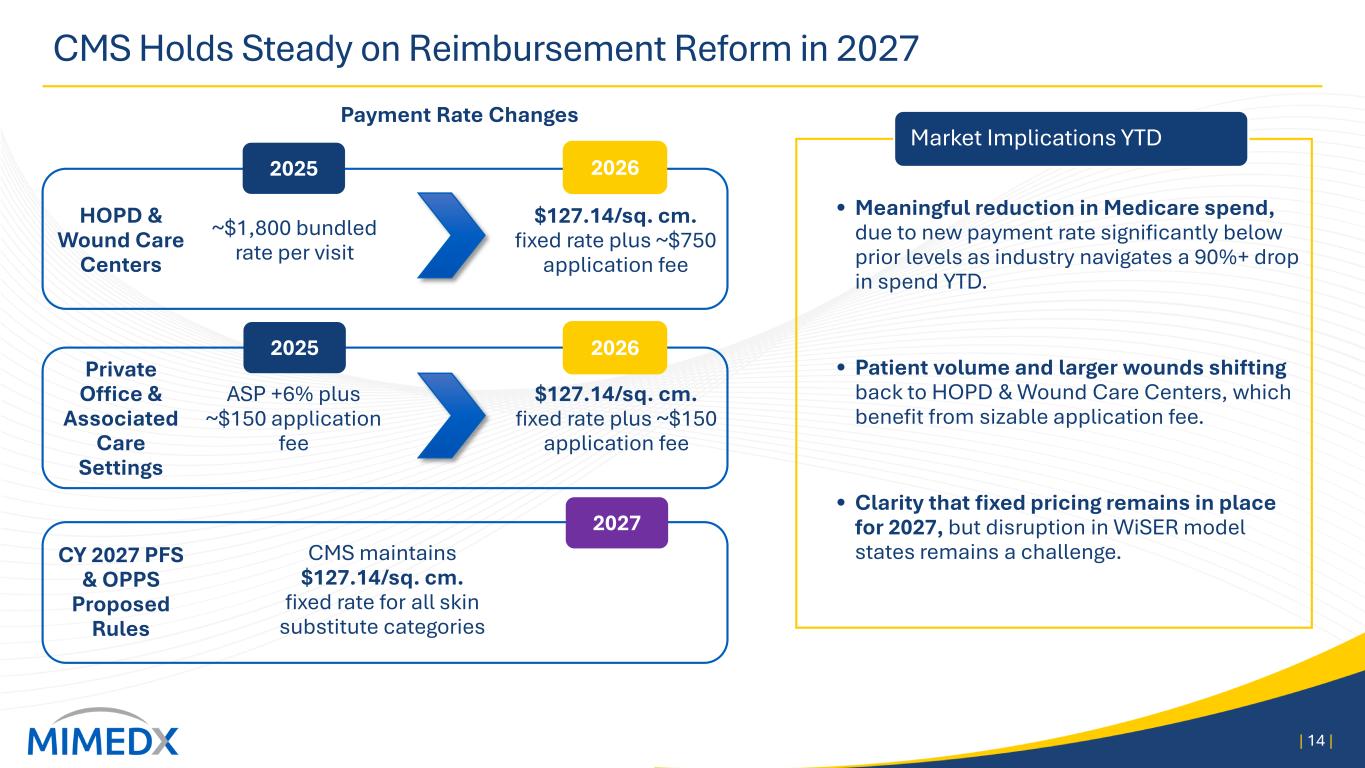
• Meaningful reduction in Medicare spend, due to new payment rate significantly below prior levels as industry navigates a 90%+ drop in spend YTD. • Patient volume and larger wounds shifting back to HOPD & Wound Care Centers, which benefit from sizable application fee. • Clarity that fixed pricing remains in place for 2027, but disruption in WiSER model states remains a challenge. CMS Holds Steady on Reimbursement Reform in 2027 | 14 | Payment Rate Changes HOPD & Wound Care Centers Private Office & Associated Care Settings ~$1,800 bundled rate per visit ASP +6% plus ~$150 application fee $127.14/sq. cm. fixed rate plus ~$750 application fee $127.14/sq. cm. fixed rate plus ~$150 application fee 2025 2026 2025 2026 Market Implications YTD 2027 CY 2027 PFS & OPPS Proposed Rules CMS maintains $127.14/sq. cm. fixed rate for all skin substitute categories
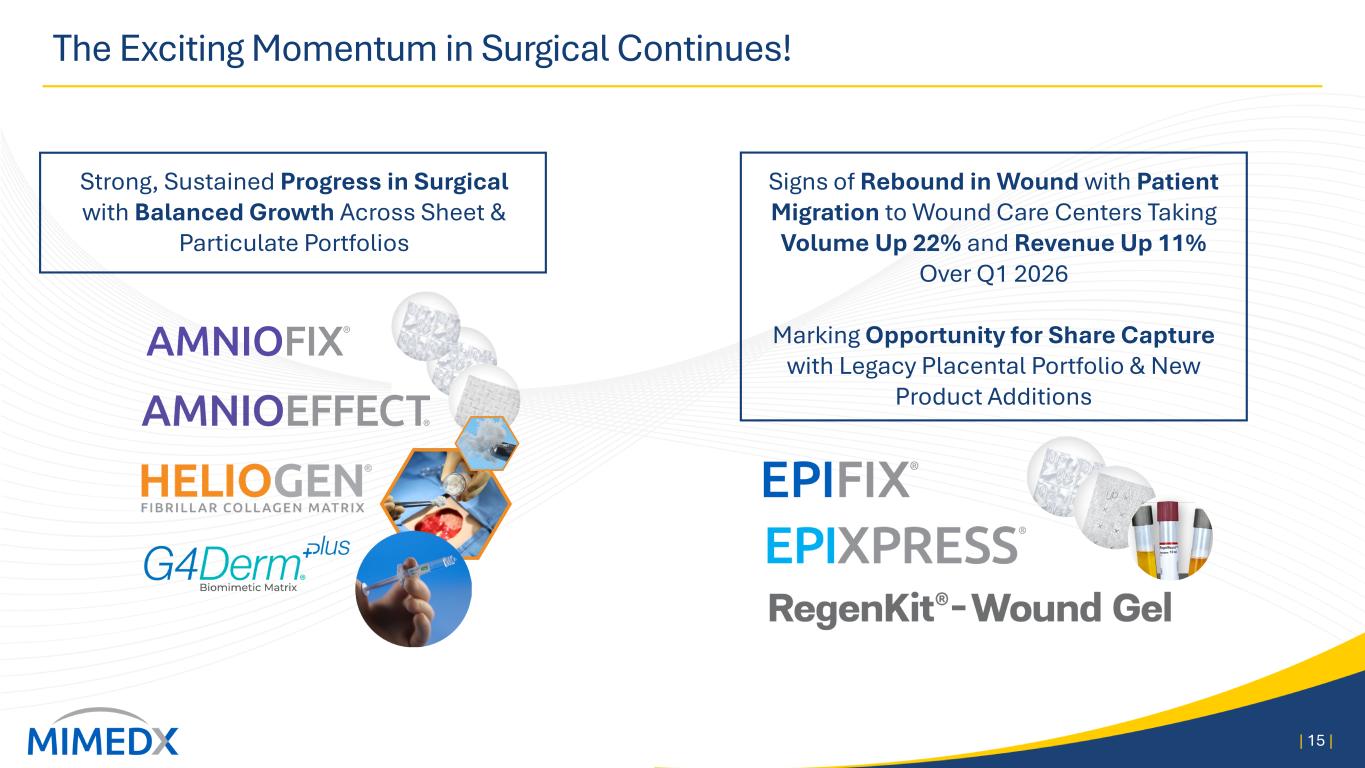
The Exciting Momentum in Surgical Continues! | 15 | Strong, Sustained Progress in Surgical with Balanced Growth Across Sheet & Particulate Portfolios Signs of Rebound in Wound with Patient Migration to Wound Care Centers Taking Volume Up 22% and Revenue Up 11% Over Q1 2026 Marking Opportunity for Share Capture with Legacy Placental Portfolio & New Product Additions
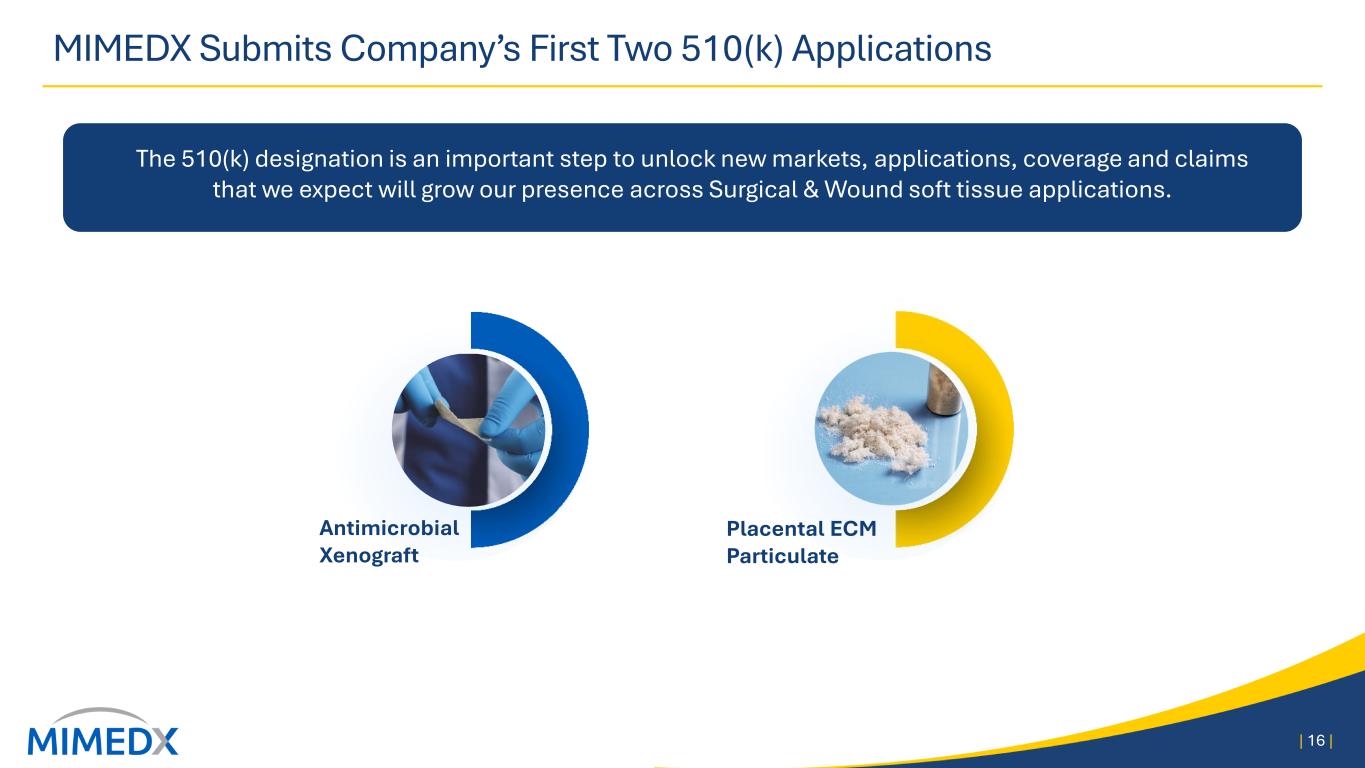
MIMEDX Submits Company’s First Two 510(k) Applications | 16 | Placental ECM Particulate Antimicrobial Xenograft The 510(k) designation is an important step to unlock new markets, applications, coverage and claims that we expect will grow our presence across Surgical & Wound soft tissue applications.

Financial Results Doug Rice, Chief Financial Officer | 17 |
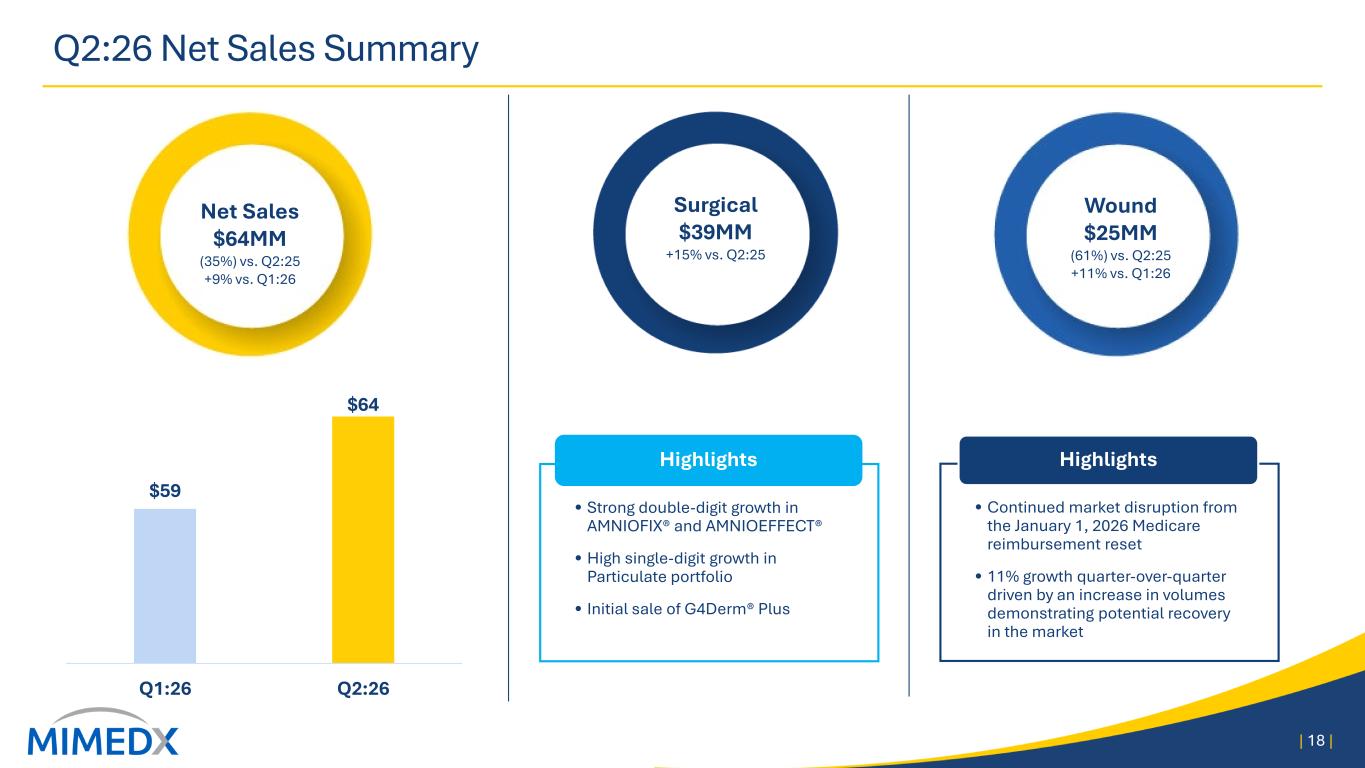
• Strong double-digit growth in AMNIOFIX® and AMNIOEFFECT® • High single-digit growth in Particulate portfolio • Initial sale of G4Derm® Plus Highlights Q2:26 Net Sales Summary | 18 | • Continued market disruption from the January 1, 2026 Medicare reimbursement reset • 11% growth quarter-over-quarter driven by an increase in volumes demonstrating potential recovery in the market Highlights UPDATE Surgical $39MM +15% vs. Q2:25 Wound $25MM (61%) vs. Q2:25 +11% vs. Q1:26 Net Sales $64MM (35%) vs. Q2:25 +9% vs. Q1:26 $59 $64 Q1:26 Q2:26
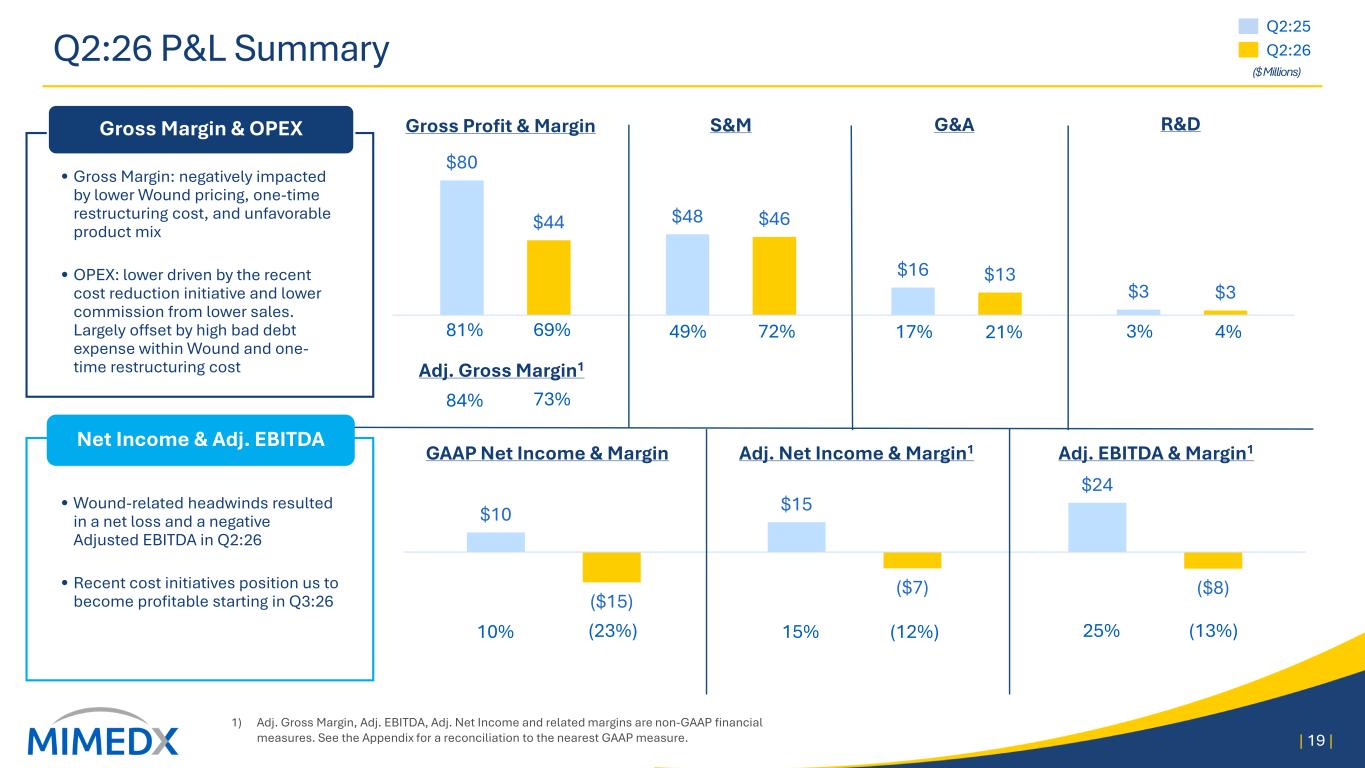
Q2:26 P&L Summary 1) Adj. Gross Margin, Adj. EBITDA, Adj. Net Income and related margins are non-GAAP financial measures. See the Appendix for a reconciliation to the nearest GAAP measure. | 19 | $10 $15 $24 ($15) ($7) ($8) $80 $48 $16 $3 $44 $46 $13 $3 Adj. EBITDA & Margin1GAAP Net Income & Margin R&D 49% 72% 3% 4% 10% (23%) 25% (13%) Adj. Net Income & Margin1 15% (12%) Gross Profit & Margin 81% 69% G&A 17% 21% Adj. Gross Margin1 84% 73% • Wound-related headwinds resulted in a net loss and a negative Adjusted EBITDA in Q2:26 • Recent cost initiatives position us to become profitable starting in Q3:26 Net Income & Adj. EBITDA • Gross Margin: negatively impacted by lower Wound pricing, one-time restructuring cost, and unfavorable product mix • OPEX: lower driven by the recent cost reduction initiative and lower commission from lower sales. Largely offset by high bad debt expense within Wound and one- time restructuring cost Gross Margin & OPEX UPDATE S&M Q2:25 Q2:26 ($ Millions)
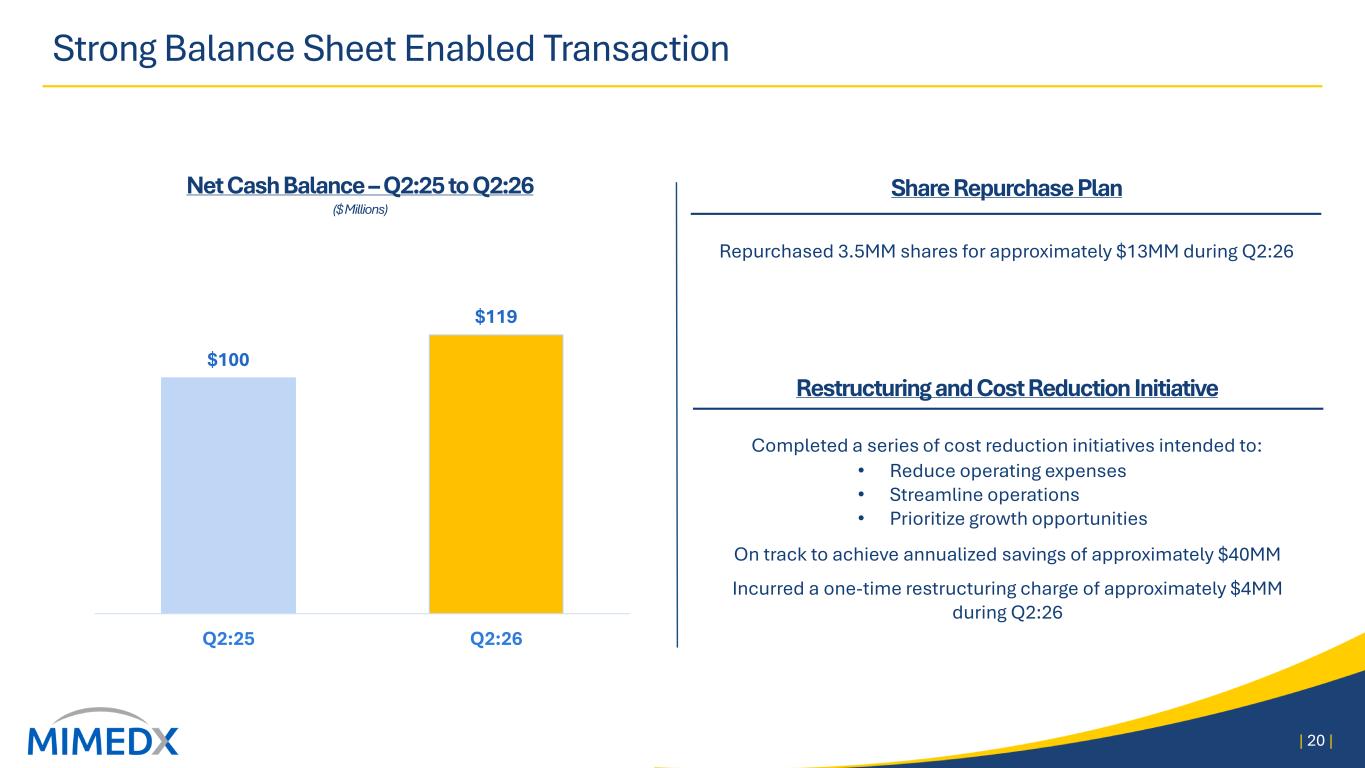
Strong Balance Sheet Enabled Transaction | 20 | Net Cash Balance – Q2:25 to Q2:26 ($ Millions) $100 $119 Q2:25 Q2:26 Restructuring and Cost Reduction Initiative Completed a series of cost reduction initiatives intended to: • Reduce operating expenses • Streamline operations • Prioritize growth opportunities On track to achieve annualized savings of approximately $40MM Incurred a one-time restructuring charge of approximately $4MM during Q2:26 Share Repurchase Plan Repurchased 3.5MM shares for approximately $13MM during Q2:26
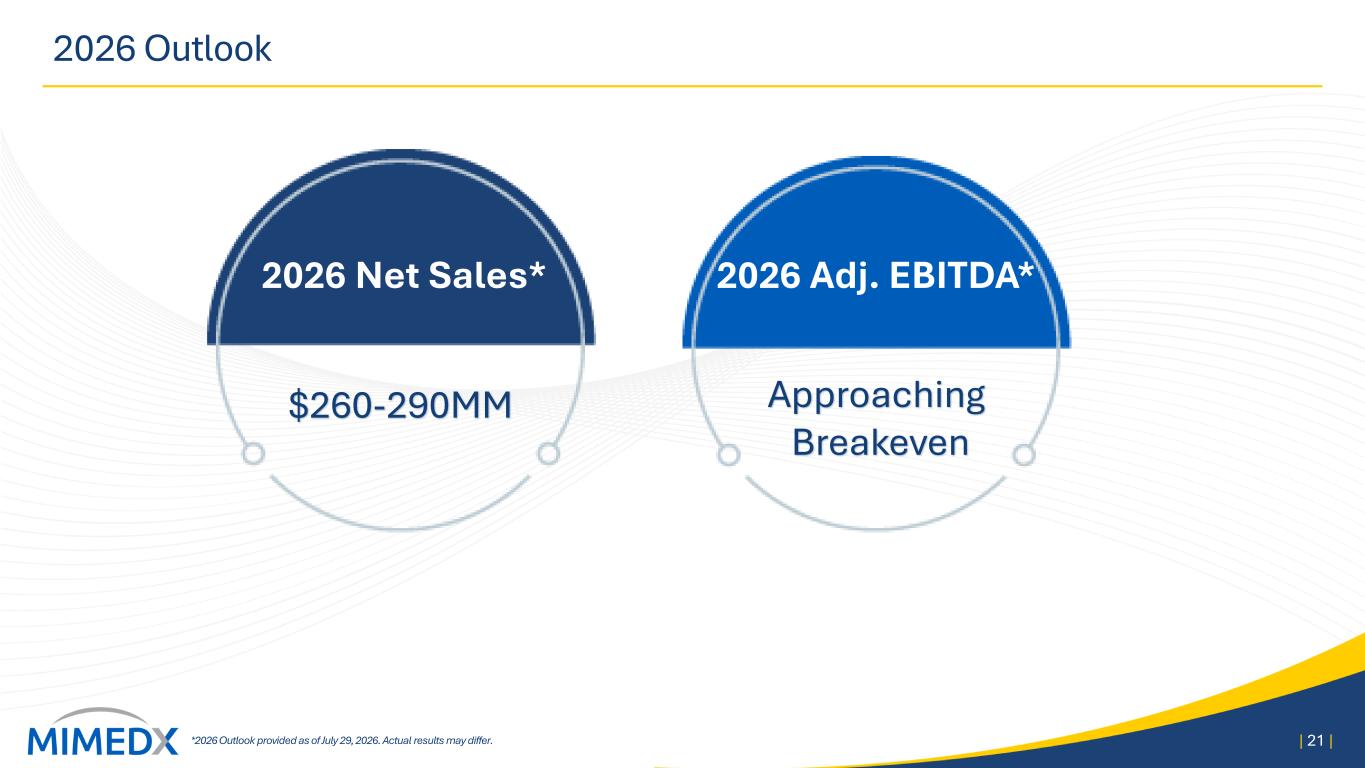
2026 Outlook *2026 Outlook provided as of July 29, 2026. Actual results may differ. | 21 | $260-290MM Approaching Breakeven 2026 Net Sales* 2026 Adj. EBITDA*
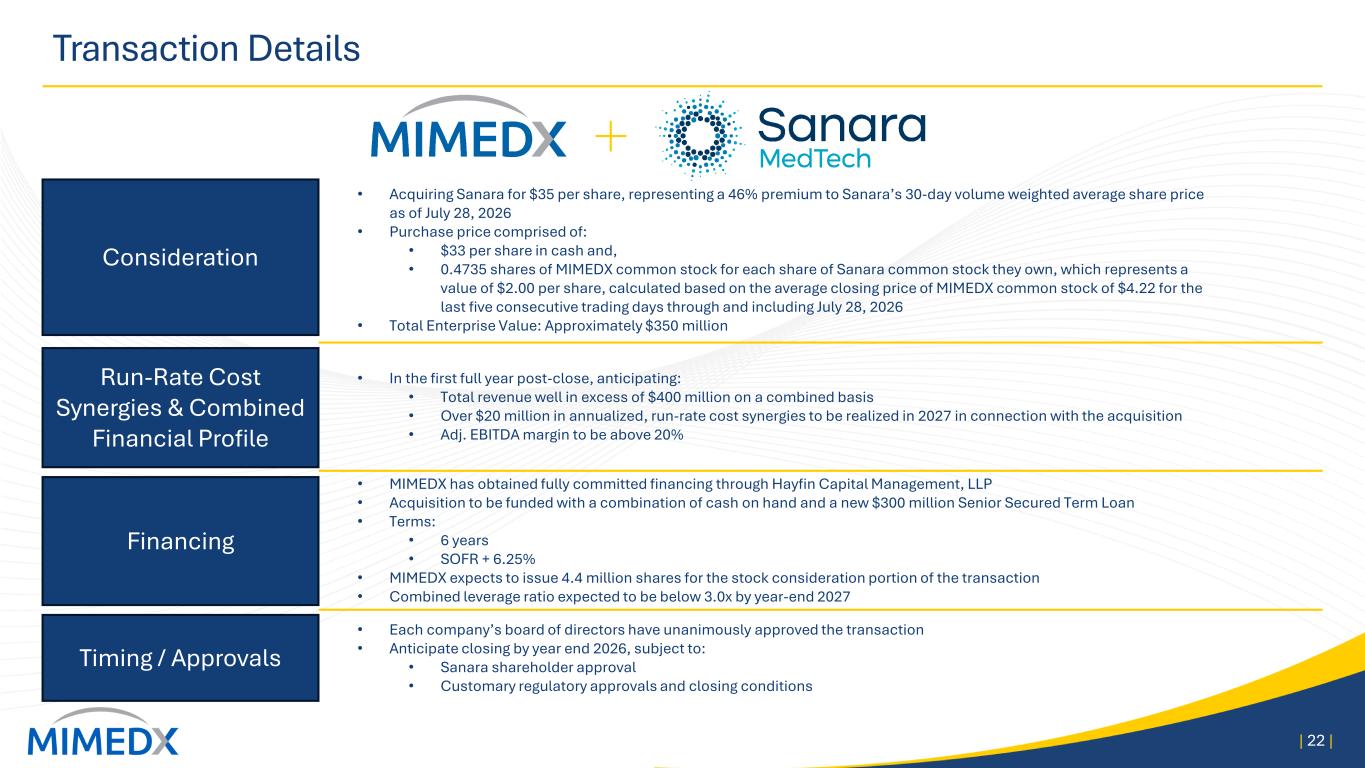
Transaction Details | 22 | Consideration Run-Rate Cost Synergies & Combined Financial Profile Timing / Approvals • Acquiring Sanara for $35 per share, representing a 46% premium to Sanara’s 30-day volume weighted average share price as of July 28, 2026 • Purchase price comprised of: • $33 per share in cash and, • 0.4735 shares of MIMEDX common stock for each share of Sanara common stock they own, which represents a value of $2.00 per share, calculated based on the average closing price of MIMEDX common stock of $4.22 for the last five consecutive trading days through and including July 28, 2026 • Total Enterprise Value: Approximately $350 million Financing • MIMEDX has obtained fully committed financing through Hayfin Capital Management, LLP • Acquisition to be funded with a combination of cash on hand and a new $300 million Senior Secured Term Loan • Terms: • 6 years • SOFR + 6.25% • MIMEDX expects to issue 4.4 million shares for the stock consideration portion of the transaction • Combined leverage ratio expected to be below 3.0x by year-end 2027 • Each company’s board of directors have unanimously approved the transaction • Anticipate closing by year end 2026, subject to: • Sanara shareholder approval • Customary regulatory approvals and closing conditions • In the first full year post-close, anticipating: • Total revenue well in excess of $400 million on a combined basis • Over $20 million in annualized, run-rate cost synergies to be realized in 2027 in connection with the acquisition • Adj. EBITDA margin to be above 20%

Closing Remarks, Q&A | 23 |
THANK YOU MIMEDX 1775 West Oak Commons Ct. Marietta, GA 30062 888.543.1917 | 770.651.9100 | 24 |
Appendix | 25 |
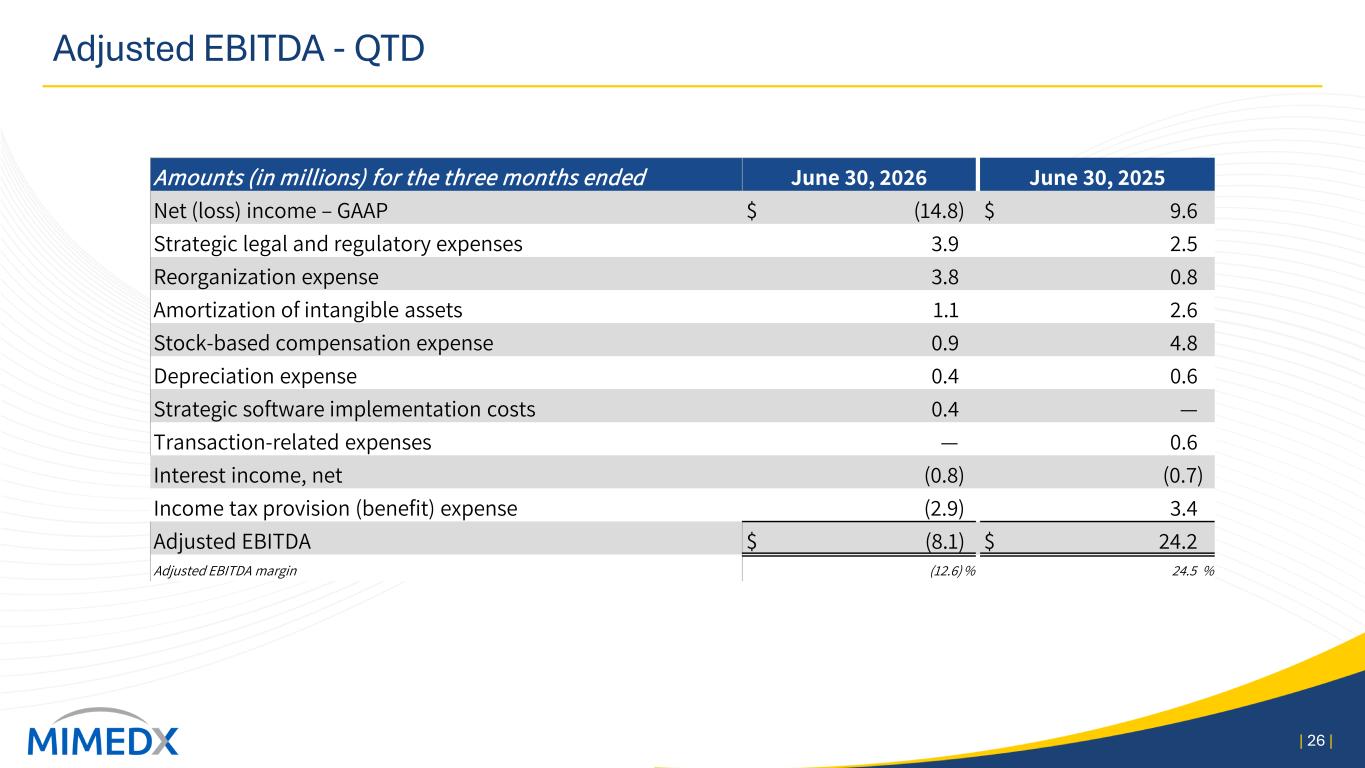
Adjusted EBITDA - QTD | 26 | Amounts (in millions) for the three months ended June 30, 2026 June 30, 2025 Net (loss) income – GAAP $ (14.8) $ 9.6 Strategic legal and regulatory expenses 3.9 2.5 Reorganization expense 3.8 0.8 Amortization of intangible assets 1.1 2.6 Stock-based compensation expense 0.9 4.8 Depreciation expense 0.4 0.6 Strategic software implementation costs 0.4 — Transaction-related expenses — 0.6 Interest income, net (0.8) (0.7) Income tax provision (benefit) expense (2.9) 3.4 Adjusted EBITDA $ (8.1) $ 24.2 Adjusted EBITDA margin (12.6) % 24.5 %
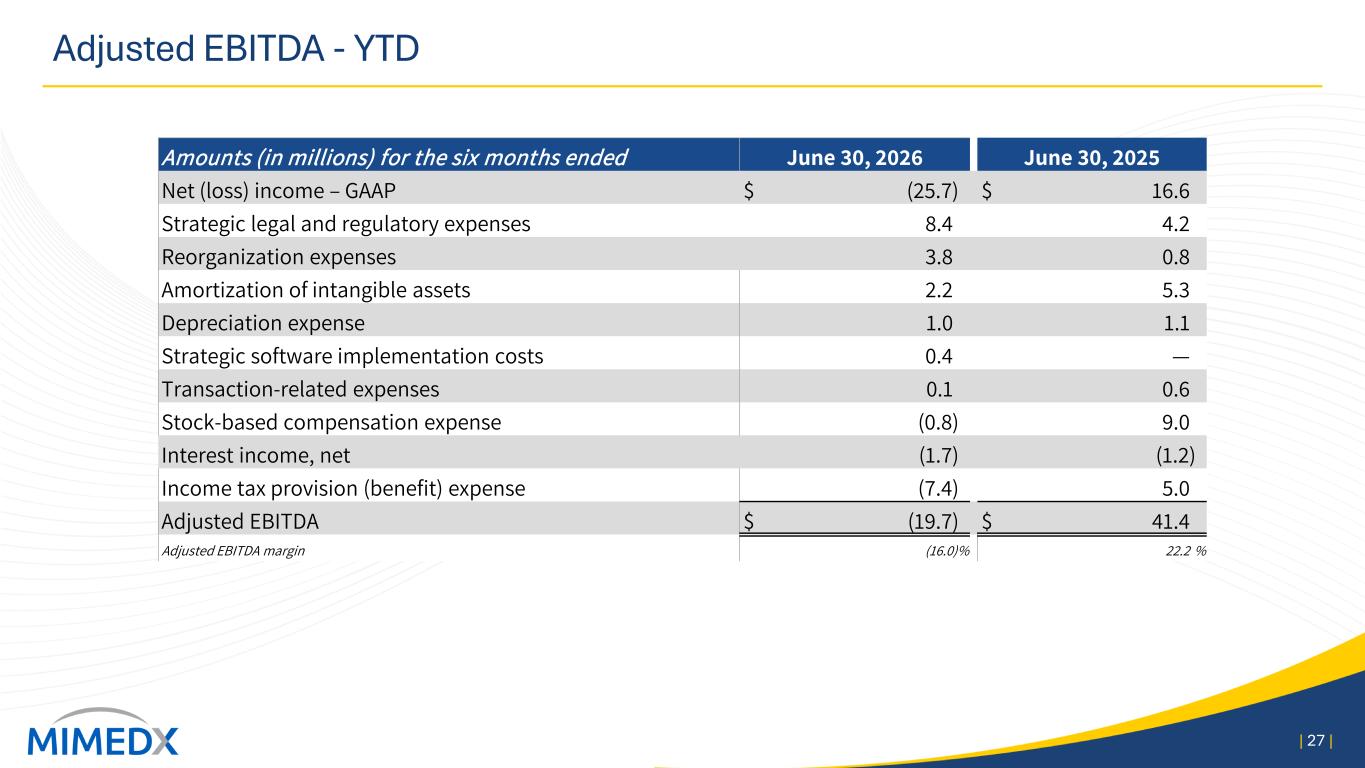
Adjusted EBITDA - YTD | 27 | Amounts (in millions) for the six months ended June 30, 2026 June 30, 2025 Net (loss) income – GAAP $ (25.7) $ 16.6 Strategic legal and regulatory expenses 8.4 4.2 Reorganization expenses 3.8 0.8 Amortization of intangible assets 2.2 5.3 Depreciation expense 1.0 1.1 Strategic software implementation costs 0.4 — Transaction-related expenses 0.1 0.6 Stock-based compensation expense (0.8) 9.0 Interest income, net (1.7) (1.2) Income tax provision (benefit) expense (7.4) 5.0 Adjusted EBITDA $ (19.7) $ 41.4 Adjusted EBITDA margin (16.0)% 22.2 %
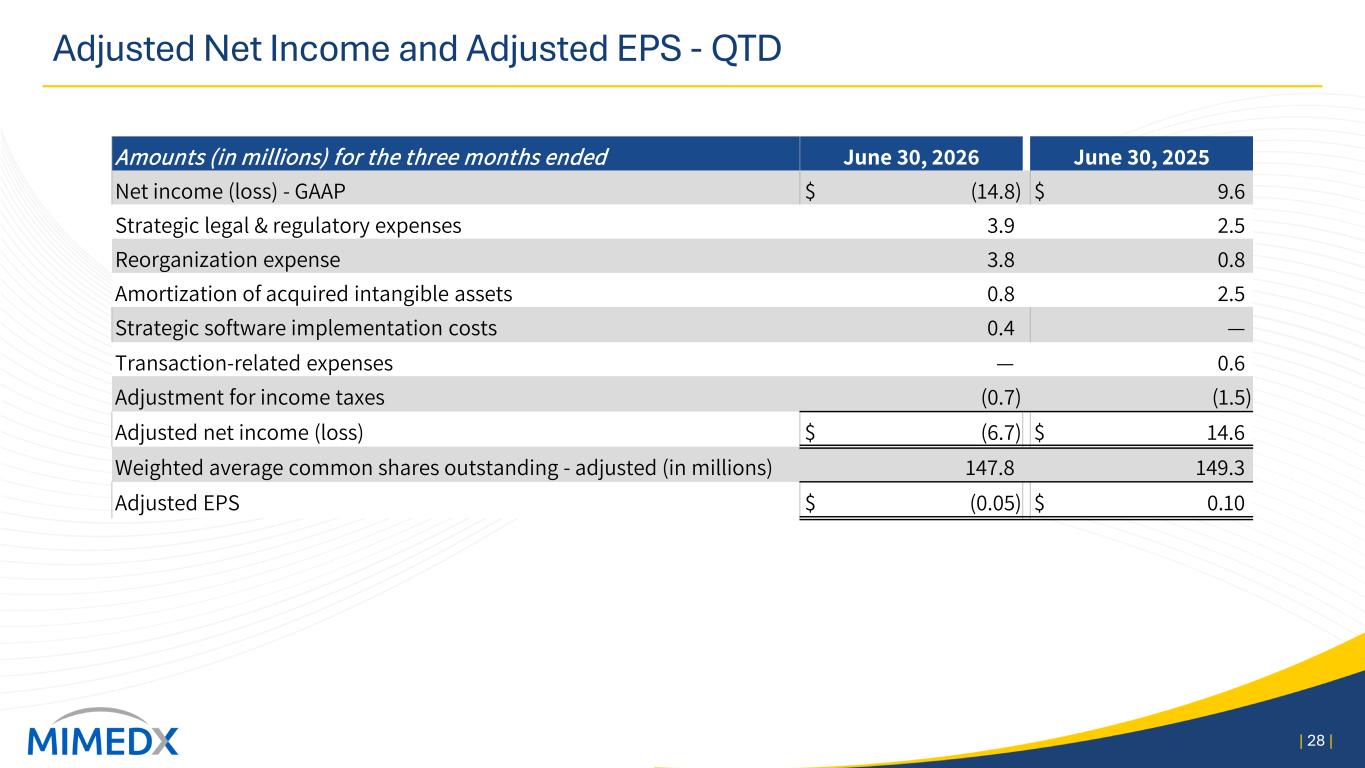
Adjusted Net Income and Adjusted EPS - QTD | 28 | Amounts (in millions) for the three months ended June 30, 2026 June 30, 2025 Net income (loss) - GAAP $ (14.8) $ 9.6 Strategic legal & regulatory expenses 3.9 2.5 Reorganization expense 3.8 0.8 Amortization of acquired intangible assets 0.8 2.5 Strategic software implementation costs 0.4 — Transaction-related expenses — 0.6 Adjustment for income taxes (0.7) (1.5) Adjusted net income (loss) $ (6.7) $ 14.6 Weighted average common shares outstanding - adjusted (in millions) 147.8 149.3 Adjusted EPS $ (0.05) $ 0.10
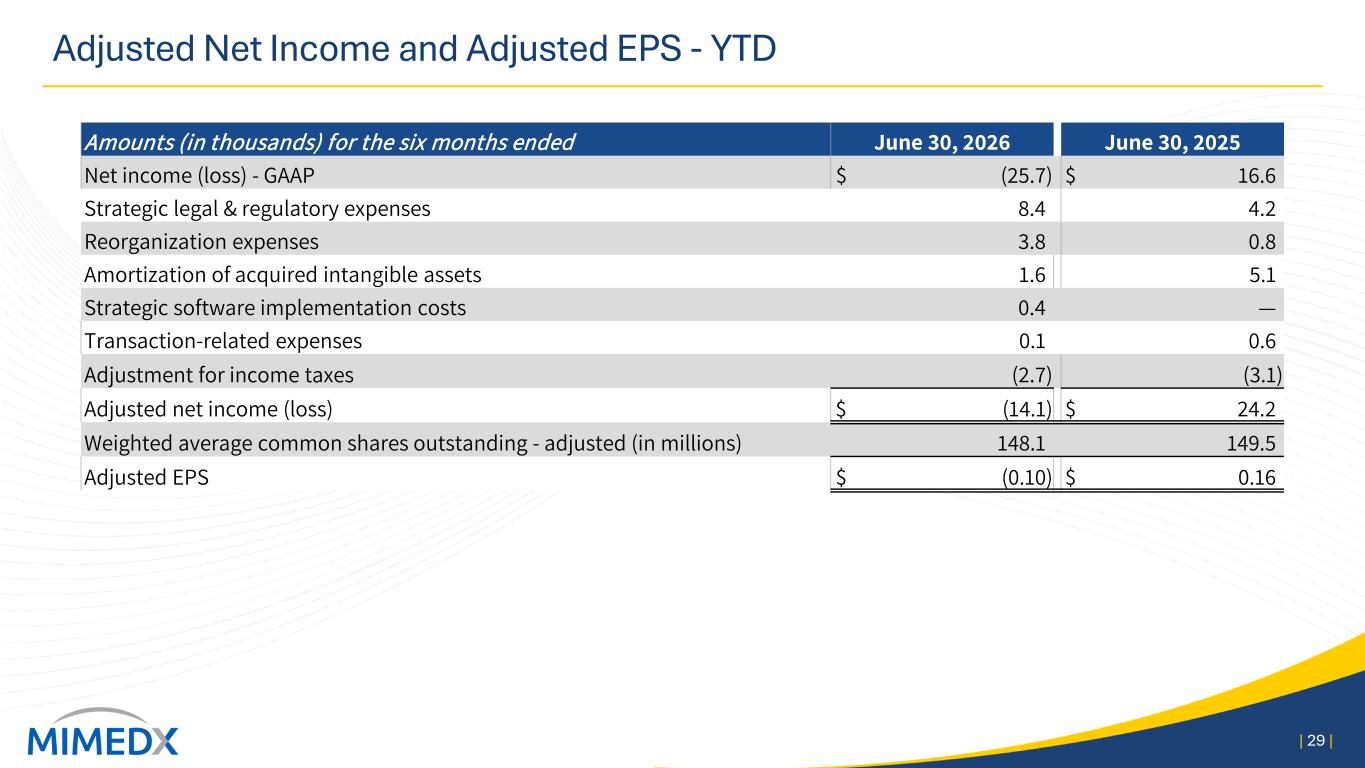
Adjusted Net Income and Adjusted EPS - YTD | 29 | Amounts (in thousands) for the six months ended June 30, 2026 June 30, 2025 Net income (loss) - GAAP $ (25.7) $ 16.6 Strategic legal & regulatory expenses 8.4 4.2 Reorganization expenses 3.8 0.8 Amortization of acquired intangible assets 1.6 5.1 Strategic software implementation costs 0.4 — Transaction-related expenses 0.1 0.6 Adjustment for income taxes (2.7) (3.1) Adjusted net income (loss) $ (14.1) $ 24.2 Weighted average common shares outstanding - adjusted (in millions) 148.1 149.5 Adjusted EPS $ (0.10) $ 0.16
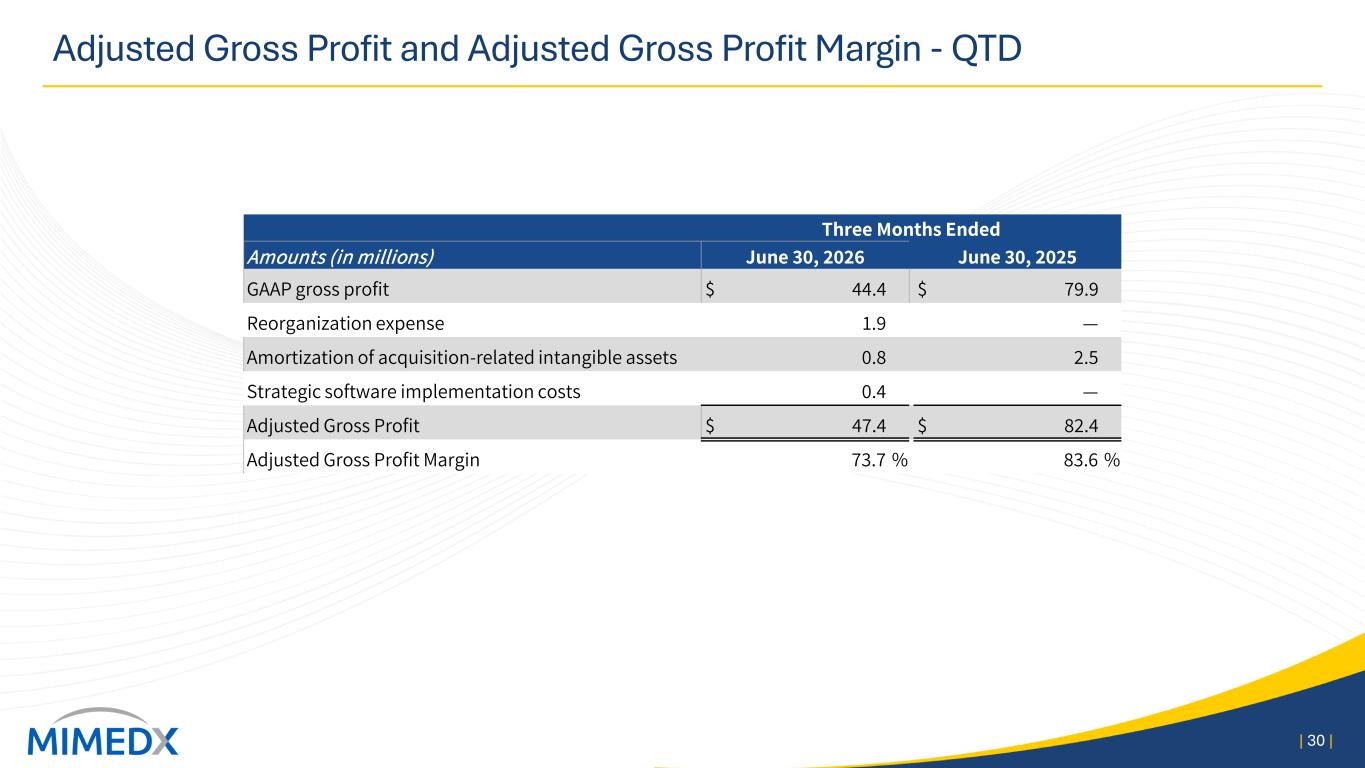
Adjusted Gross Profit and Adjusted Gross Profit Margin - QTD | 30 | Three Months Ended Amounts (in millions) June 30, 2026 June 30, 2025 GAAP gross profit $ 44.4 $ 79.9 Reorganization expense 1.9 — Amortization of acquisition-related intangible assets 0.8 2.5 Strategic software implementation costs 0.4 — Adjusted Gross Profit $ 47.4 $ 82.4 Adjusted Gross Profit Margin 73.7 % 83.6 %
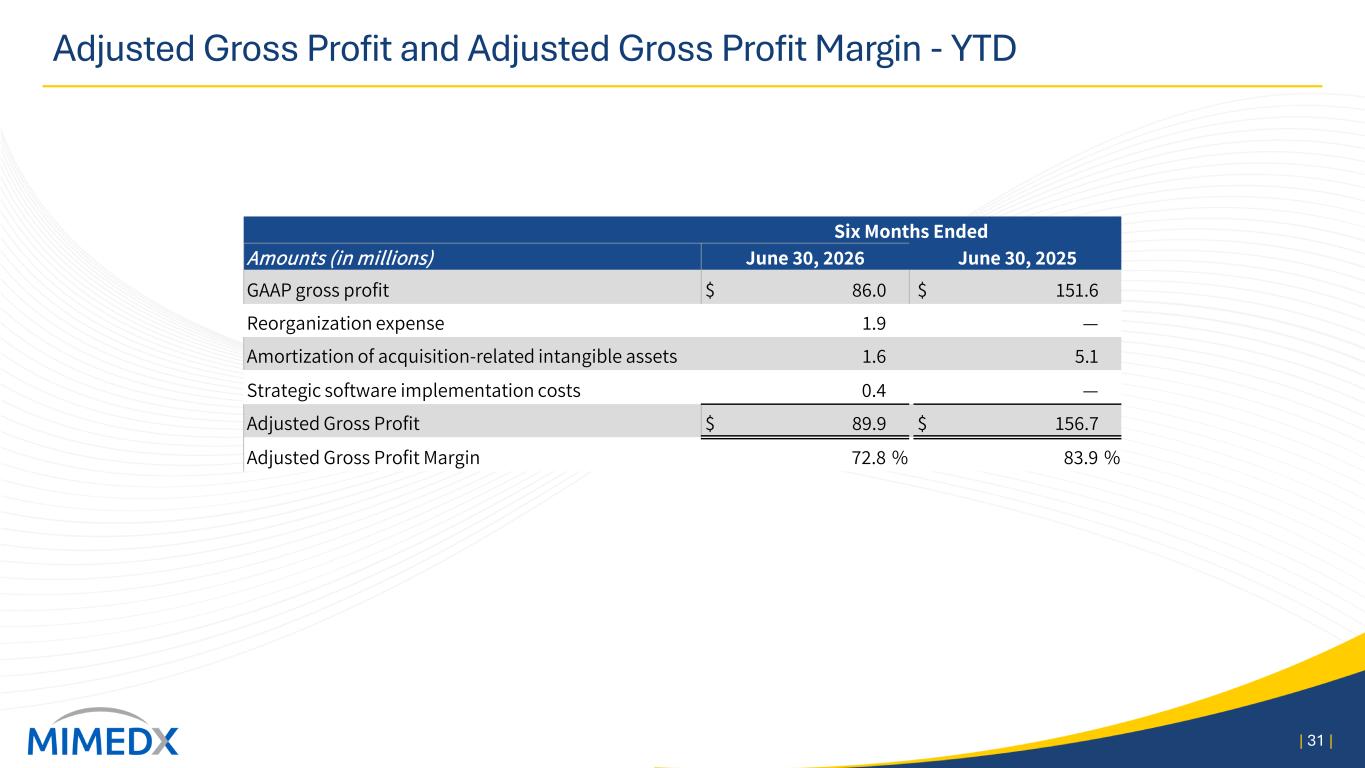
Adjusted Gross Profit and Adjusted Gross Profit Margin - YTD | 31 | Six Months Ended Amounts (in millions) June 30, 2026 June 30, 2025 GAAP gross profit $ 86.0 $ 151.6 Reorganization expense 1.9 — Amortization of acquisition-related intangible assets 1.6 5.1 Strategic software implementation costs 0.4 — Adjusted Gross Profit $ 89.9 $ 156.7 Adjusted Gross Profit Margin 72.8 % 83.9 %