Investor Presentation July 2026
Disclaimer FORWARD-LOOKING STATEMENTS Please note that in this presentation the Company may discuss events or results that have not yet occurred or been realized, commonly referred to as forward-looking statements. Such discussion and statements may contain words such as “expect,” “anticipate,” “will,” “should,” “believe,” “intend,” “plan,” “estimate,” “predict,” “seek,” “continue,” “outlook,” “may,” “might,” “should,” “can have,” “have,” “likely,” “potential,” “target,” “indicative,” “illustrative,” and variations of such words and similar expressions, and relate in this presentation, without limitation, to statements, beliefs, projections and expectations about future events. Such statements are based on the Company’s expectations, intentions and projections regarding the Company’s future performance, anticipated events or trends and other matters that are not historical facts. Such forward looking statements include statements relating to, among other things, the Company’s expectations with respect to the (i) timing for completion of the business combination, (ii) results, benefits and synergies of the business combination, (iii) future financial performance and condition, including estimated combined surgical revenue, combined leverage ratio, and Adjusted EBITDA margin, (iv) benefits of the business combination to the Company’s shareholders and (v) management’s estimates regarding the combined financial information. These statements are not guarantees of future performance and are subject to known and unknown risks, uncertainties and other factors that could cause actual results to differ materially from those expressed or implied by such forward-looking statements, including: (i) economic conditions, competition, political risks, and other risks that may affect the Company’s future performance, including the impacts of inflationary pressures and other macroeconomic factors on the Company’s business, markets, supply chain, customers and workforce, on the credit and financial markets, and on the global economy generally; (ii) the future market for the Company’s products can depend on regulatory approval of such products, which might not occur at all or when expected, and is based in part on assumptions regarding the number of patients who elect less acute and more acute treatment than the Company’s products, market acceptance of the Company’s products, and adequate reimbursement for such therapies; (iii) failure to realize the anticipated benefits of the Company’s acquisitions and acquisition strategy; (iv) failure to realize expected benefits from the Company’s other business strategies; (v) the possibility that stockholders of Sanara MedTech may not approve the Merger Agreement; (vi) the risk that a condition to closing may not be satisfied, that either party may terminate the Merger Agreement or that the closing might be delayed or not occur at all; (vii) potential adverse reactions or changes to business or employee relationships (viii) adverse developments in the credit markets which could impact the Company’s ability to secure financing in the future; (ix) the process of obtaining regulatory clearances or approvals to market a biological product or medical device from the FDA or similar regulatory authorities outside of the U.S. is costly and time consuming, and such clearances or approvals may not be granted on a timely basis, or at all, and the ability to obtain the rights to market additional, suitable products depends on negotiations with third parties which may not be forthcoming; (x) future sales are uncertain and are affected by competition, access to customers, patient access to hospitals and healthcare providers, the reimbursement environment and many other factors; (xi) changes in applicable laws or regulations, including environmental, health and safety regulations; (xii) the possibility that the Company may be adversely affected by other economic, business, and/or competitive factors; (xiii) market and economic conditions, or the Company’s financial performance or determinations following the date of this presentation to use the Company’s funds for other purposes; (xiv) geopolitical risks; and (xv) other risks and uncertainties, including those discussed in the Company’s Annual Report on Form 10-K for the fiscal year ended December 31, 2025 filed with the SEC on February 25, 2026 under the heading “Risk Factors.” Given these risks and uncertainties, you are cautioned not to place undue reliance on forward-looking statements. Additional information concerning these risks, uncertainties and other factors that could cause actual results to vary is, or will be, included in the reports filed by the Company with the Securities and Exchange Commission. Forward-looking statements included in this presentation speak only as of the date hereof and, except as required by applicable law, the Company does not undertake any obligation to update or revise publicly any forward-looking statements, whether as a result of new information, future events or circumstances, after the date of this presentation. NON-GAAP FINANCIAL MEASURES This presentation contains Adjusted EBITDA, Adjusted EBITDA Margin and Combined Surgical Revenue which are non-U.S. GAAP financial measures within the meaning of Regulation G promulgated by the Securities and Exchange Commission. The presentation of the estimated combined financial information of the Company and Sanara MedTech, is not in accordance with GAAP and is presented for illustrative purposes only and does not indicate the financial results of the combined company. Such presentation is not in accordance with Article 11 of Regulation S-X and may differ from the pro forma presentation to be included in the registration statement and other materials when they are filed with the SEC in connection with the transactions contemplated by the Merger Agreement dated July 29, 2026 (the “Transactions”). We believe that for purposes of discussion and analysis, the estimated combined financial information is useful for management and investors to assess the estimated combined financial and operational performance. As used in this presentation, Adjusted EBITDA consists of GAAP net income excluding: (i) depreciation, (ii) amortization of intangibles, (iii) interest (income) expense, net, (iv) income tax provision, (v) share-based compensation, (vi) investigation, restatement and related expenses, (vii) expenses related to disbanding of the Regenerative Medicine business unit, (viii) strategic legal and regulatory expenses, (ix) transaction-related expenses, (x) impairment of intangible assets, and (xi) reorganization expenses. Adjusted EBITDA Margin is defined as Adjusted EBITDA divided by Revenue. Combined Surgical Revenue is defined as the Company’s surgical revenue plus Sanara’s total revenue. While the Company believes these non-U.S. GAAP measures are useful in evaluating the Company’s performance, this information should be considered as supplemental in nature and not as a substitute for or superior to the related financial information prepared in accordance with U.S. GAAP. Additionally, these non-U.S. GAAP financial measures may differ from similar measures presented by other companies. The Company cannot provide a reconciliation of estimated financial measures, such as Adjusted EBITDA Margin and Combined Surgical Revenue, and the most directly comparable GAAP measures without unreasonable efforts because it is unable to predict with reasonable certainty the ultimate outcome of certain significant items required for the reconciliation. | 2 |
Disclaimer No Offer or Solicitation This presentation does not constitute an offer to sell or the solicitation of an offer to subscribe for or buy any securities or a solicitation of any vote or approval with respect to the Transactions or otherwise, nor shall there be any sale, issuance or transfer of securities in any jurisdiction in which such offer, solicitation or sale would be unlawful prior to registration or qualification under the securities laws of any such jurisdiction. Important Additional Information In connection with the Transactions, the Company intends to file with the SEC a Registration Statement on Form S-4 (the “S-4”). Additionally, Sanara MedTech intends to file with the SEC a proxy statement on Schedule 14A (the “Proxy Statement”). The definitive Proxy Statement (if and when available) will be mailed to stockholders of Sanara. Investors will be able to obtain free copies of the Registration Statement and Proxy Statement, as each may be amended from time to time, and other relevant documents filed by Sanara MedTech and the Company with the SEC (when they become available) through the website maintained by the SEC at www.sec.gov. Copies of documents filed with the SEC by Sanara MedTech will be available free of charge from Sanara’s website at www.sanaramedtech.com under the “Investor Relations” tab or by contacting Sanara MedTech’s Investor Relations Department IR@sanaramedtech.com. Copies of documents filed with the SEC by the Company will be available free of charge from the Company’s website at www.mimedx.com under the “Investors” tab or by contacting the Company’s Investor Relations Department at investorrelations@mimedx.com. Participants in the Solicitation Sanara MedTech, the Company and their respective directors and certain of their executive officers and other members of management and employees may be deemed, under SEC rules, to be participants in the solicitation of proxies from Sanara’s stockholders in connection with the Transactions. Information regarding the executive officers and directors of the Company is included in its Proxy Statement filed with the SEC on April 29, 2026. Information regarding the executive officers and directors of Sanara MedTech is included in its Proxy Statement filed with the SEC on April 17, 2026. Additional information regarding the persons who may be deemed participants and their direct and indirect interests, by security holdings or otherwise, will be set forth in the Registration Statement and other materials when they are filed with the SEC in connection with the Transactions. Free copies of these documents may be obtained as described in the paragraphs above. | 3 |
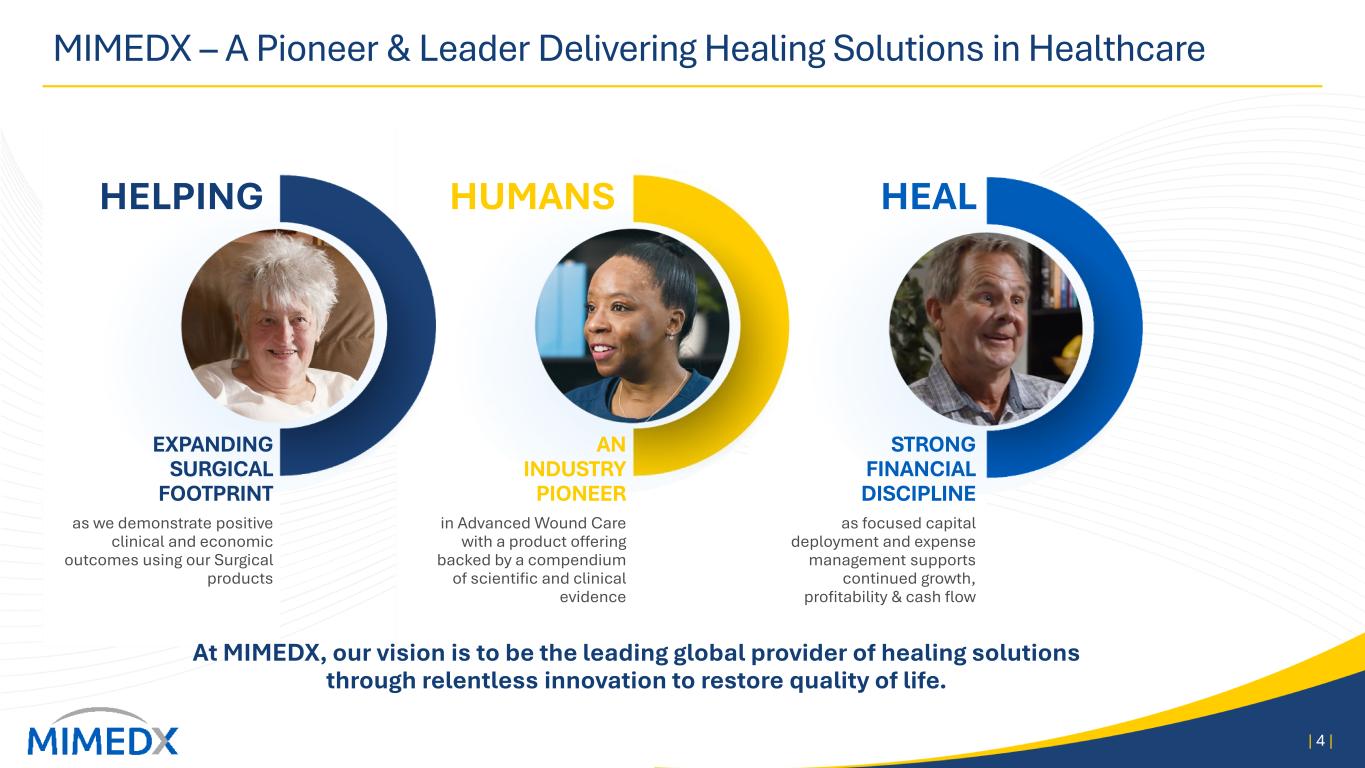
MIMEDX – A Pioneer & Leader Delivering Healing Solutions in Healthcare | 4 | At MIMEDX, our vision is to be the leading global provider of healing solutions through relentless innovation to restore quality of life. EXPANDING SURGICAL FOOTPRINT as we demonstrate positive clinical and economic outcomes using our Surgical products AN INDUSTRY PIONEER in Advanced Wound Care with a product offering backed by a compendium of scientific and clinical evidence STRONG FINANCIAL DISCIPLINE as focused capital deployment and expense management supports continued growth, profitability & cash flow HELPING HUMANS HEAL
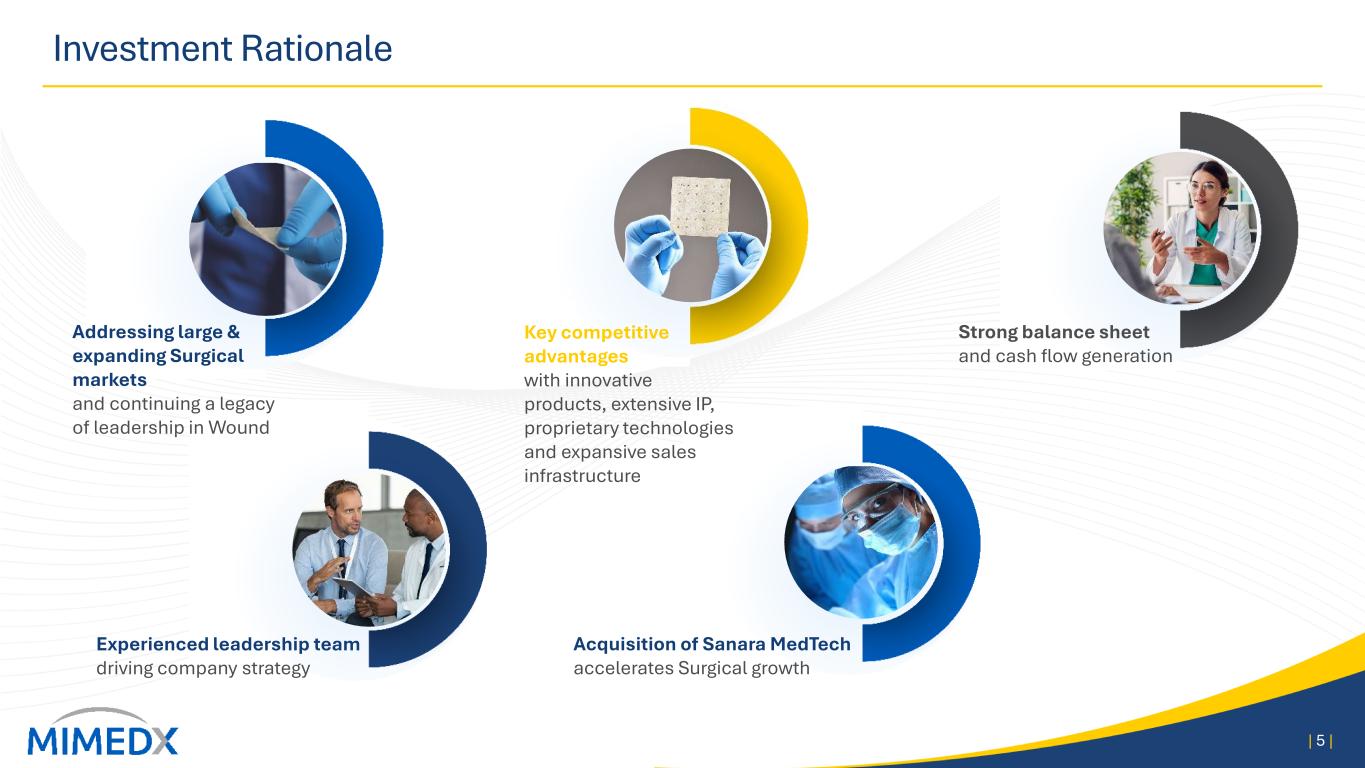
Investment Rationale | 5 | Addressing large & expanding Surgical markets and continuing a legacy of leadership in Wound Acquisition of Sanara MedTech accelerates Surgical growth Key competitive advantages with innovative products, extensive IP, proprietary technologies and expansive sales infrastructure Strong balance sheet and cash flow generation Experienced leadership team driving company strategy

Sanara MedTech Acquisition Details | 6 |
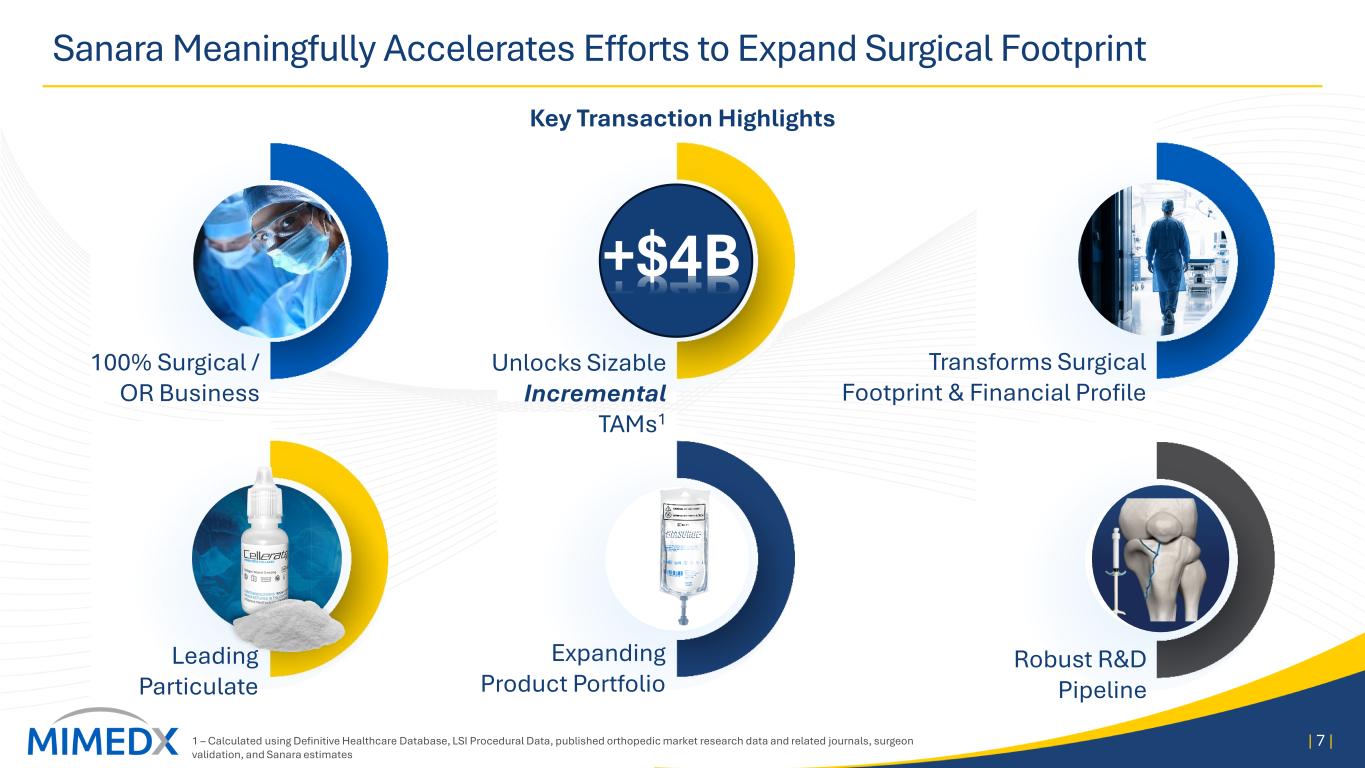
Sanara Meaningfully Accelerates Efforts to Expand Surgical Footprint | 7 | 100% Surgical / OR Business Leading Particulate Expanding Product Portfolio Unlocks Sizable Incremental TAMs1 +$4B Transforms Surgical Footprint & Financial Profile Robust R&D Pipeline Key Transaction Highlights 1 – Calculated using Definitive Healthcare Database, LSI Procedural Data, published orthopedic market research data and related journals, surgeon validation, and Sanara estimates
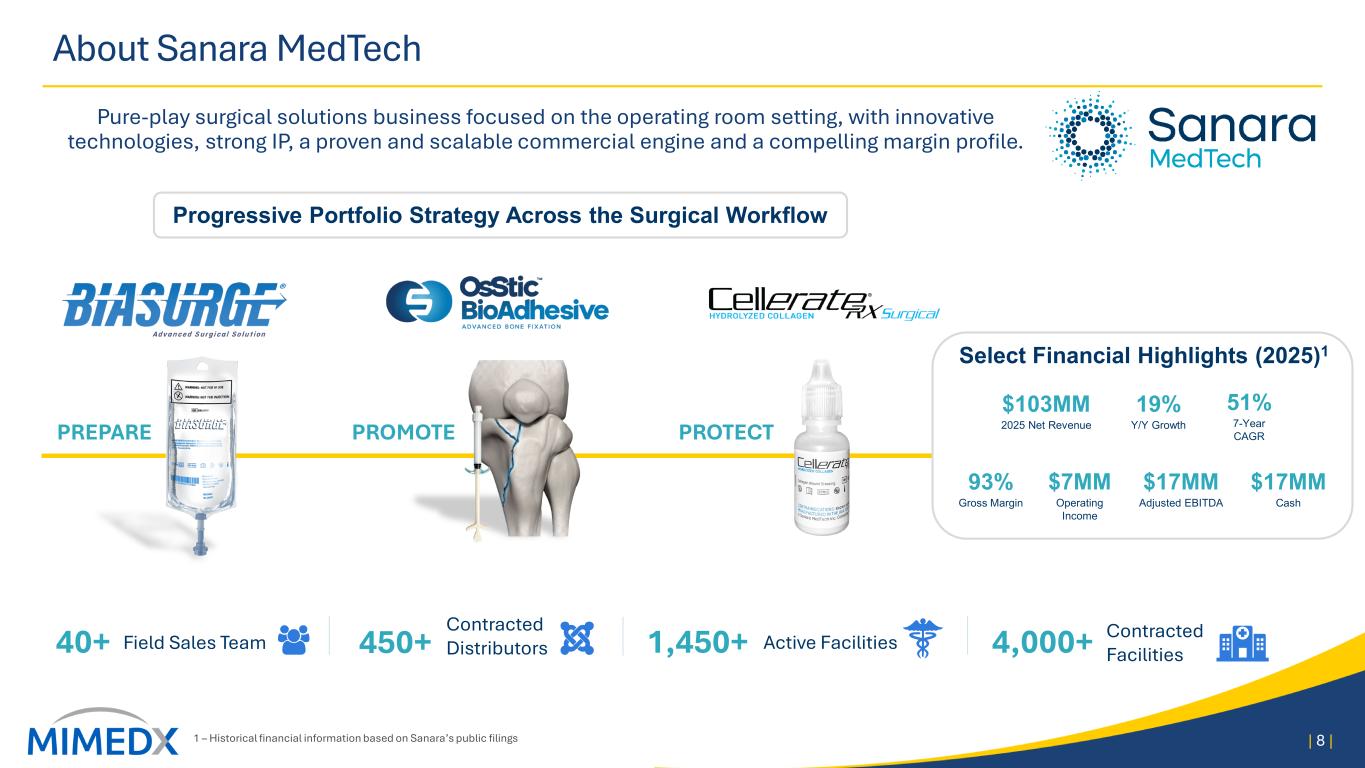
About Sanara MedTech Pure-play surgical solutions business focused on the operating room setting, with innovative technologies, strong IP, a proven and scalable commercial engine and a compelling margin profile. 1 – Historical financial information based on Sanara’s public filings | 8 | PREPARE PROMOTE PROTECT Progressive Portfolio Strategy Across the Surgical Workflow Select Financial Highlights (2025)1 $103MM 2025 Net Revenue 19% Y/Y Growth 51% 7-Year CAGR 93% Gross Margin $7MM Operating Income $17MM Adjusted EBITDA $17MM Cash 40+ Field Sales Team 450+ Contracted Distributors 1,450+ Active Facilities 4,000+ Contracted Facilities
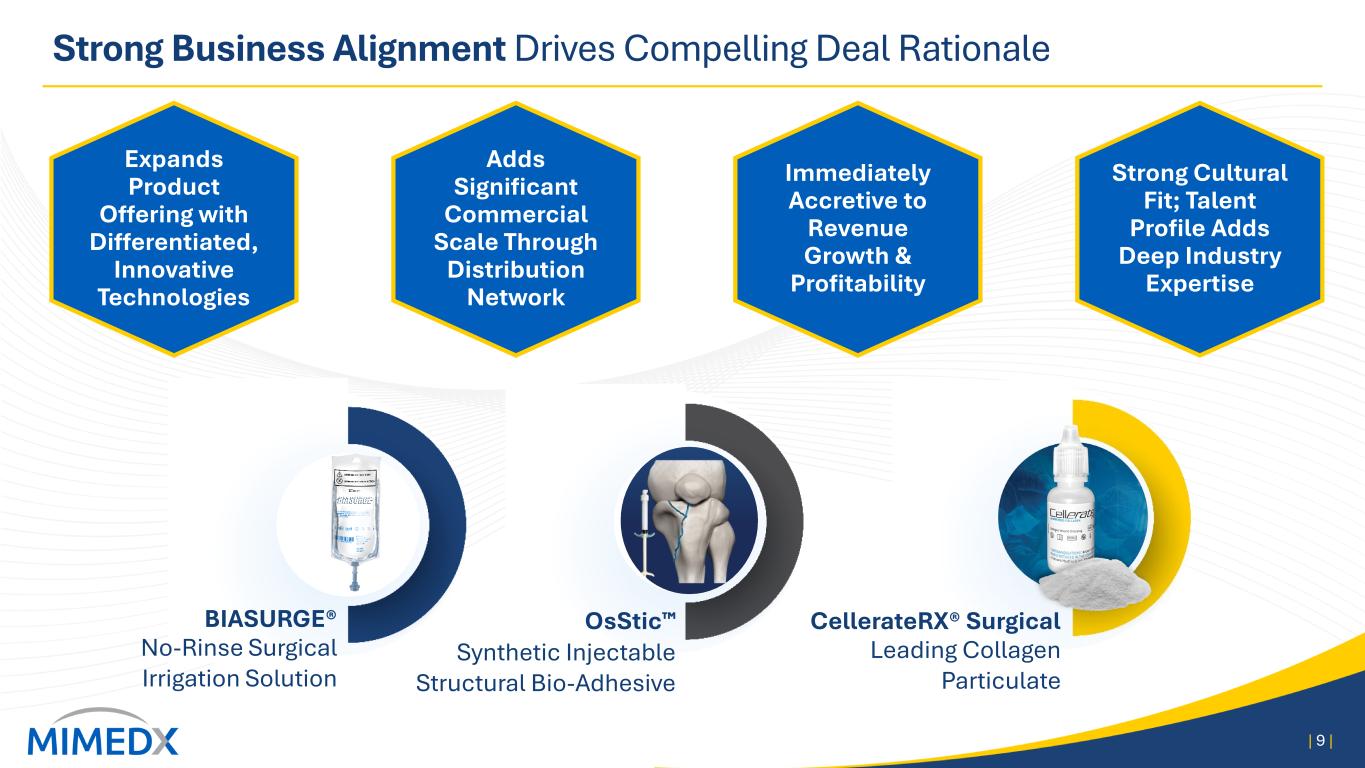
CellerateRX® Surgical Leading Collagen Particulate Strong Business Alignment Drives Compelling Deal Rationale | 9 | OsStic Synthetic Injectable Structural Bio-Adhesive BIASURGE® No-Rinse Surgical Irrigation Solution Expands Product Offering with Differentiated, Innovative Technologies Strong Cultural Fit; Talent Profile Adds Deep Industry Expertise Adds Significant Commercial Scale Through Distribution Network Immediately Accretive to Revenue Growth & Profitability
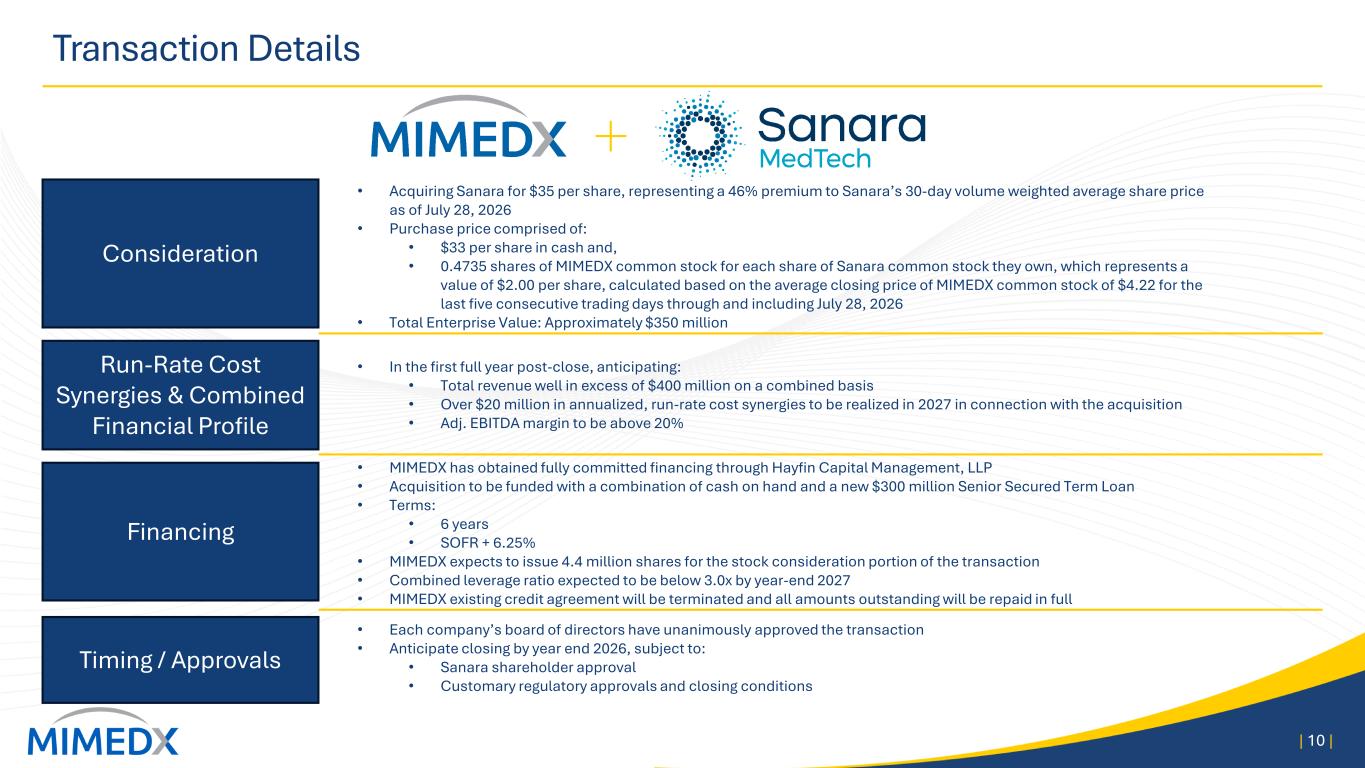
Transaction Details | 10 | Consideration Run-Rate Cost Synergies & Combined Financial Profile Timing / Approvals • Acquiring Sanara for $35 per share, representing a 46% premium to Sanara’s 30-day volume weighted average share price as of July 28, 2026 • Purchase price comprised of: • $33 per share in cash and, • 0.4735 shares of MIMEDX common stock for each share of Sanara common stock they own, which represents a value of $2.00 per share, calculated based on the average closing price of MIMEDX common stock of $4.22 for the last five consecutive trading days through and including July 28, 2026 • Total Enterprise Value: Approximately $350 million Financing • MIMEDX has obtained fully committed financing through Hayfin Capital Management, LLP • Acquisition to be funded with a combination of cash on hand and a new $300 million Senior Secured Term Loan • Terms: • 6 years • SOFR + 6.25% • MIMEDX expects to issue 4.4 million shares for the stock consideration portion of the transaction • Combined leverage ratio expected to be below 3.0x by year-end 2027 • MIMEDX existing credit agreement will be terminated and all amounts outstanding will be repaid in full • Each company’s board of directors have unanimously approved the transaction • Anticipate closing by year end 2026, subject to: • Sanara shareholder approval • Customary regulatory approvals and closing conditions • In the first full year post-close, anticipating: • Total revenue well in excess of $400 million on a combined basis • Over $20 million in annualized, run-rate cost synergies to be realized in 2027 in connection with the acquisition • Adj. EBITDA margin to be above 20%
About MIMEDX | 11 |
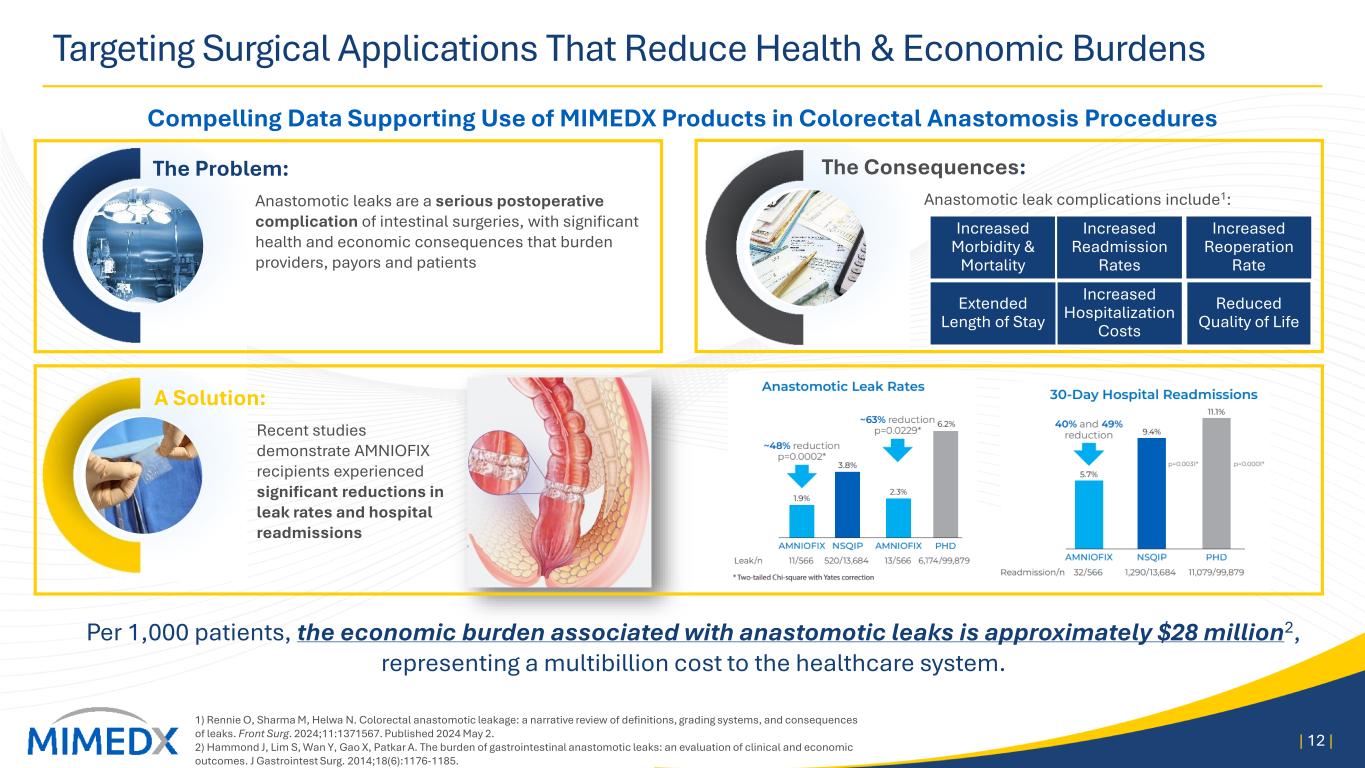
Increased Morbidity & Mortality Increased Hospitalization Costs Increased Reoperation Rate Reduced Quality of Life Extended Length of Stay Increased Readmission Rates The Consequences: Anastomotic leak complications include1: Targeting Surgical Applications That Reduce Health & Economic Burdens Compelling Data Supporting Use of MIMEDX Products in Colorectal Anastomosis Procedures 1) Rennie O, Sharma M, Helwa N. Colorectal anastomotic leakage: a narrative review of definitions, grading systems, and consequences of leaks. Front Surg. 2024;11:1371567. Published 2024 May 2. 2) Hammond J, Lim S, Wan Y, Gao X, Patkar A. The burden of gastrointestinal anastomotic leaks: an evaluation of clinical and economic outcomes. J Gastrointest Surg. 2014;18(6):1176-1185. | 12 | The Problem: Anastomotic leaks are a serious postoperative complication of intestinal surgeries, with significant health and economic consequences that burden providers, payors and patients A Solution: Recent studies demonstrate AMNIOFIX recipients experienced significant reductions in leak rates and hospital readmissions Per 1,000 patients, the economic burden associated with anastomotic leaks is approximately $28 million2, representing a multibillion cost to the healthcare system.
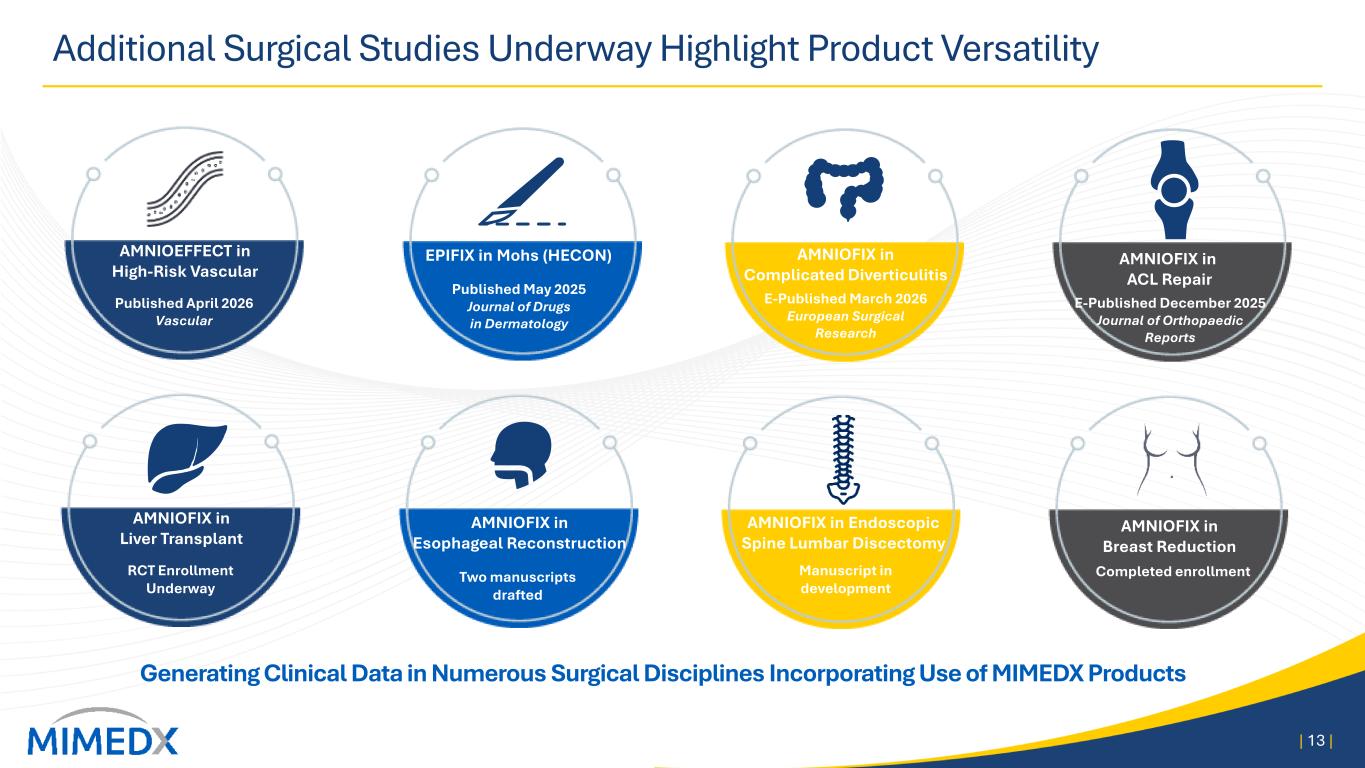
Additional Surgical Studies Underway Highlight Product Versatility | 13 | Generating Clinical Data in Numerous Surgical Disciplines Incorporating Use of MIMEDX Products AMNIOEFFECT in High-Risk Vascular Published April 2026 Vascular Published May 2025 Journal of Drugs in Dermatology EPIFIX in Mohs (HECON) E-Published March 2026 European Surgical Research AMNIOFIX in Complicated Diverticulitis AMNIOFIX in ACL Repair E-Published December 2025 Journal of Orthopaedic Reports AMNIOFIX in Liver Transplant RCT Enrollment Underway Manuscript in development Completed enrollment AMNIOFIX in Breast Reduction Two manuscripts drafted AMNIOFIX in Esophageal Reconstruction AMNIOFIX in Endoscopic Spine Lumbar Discectomy
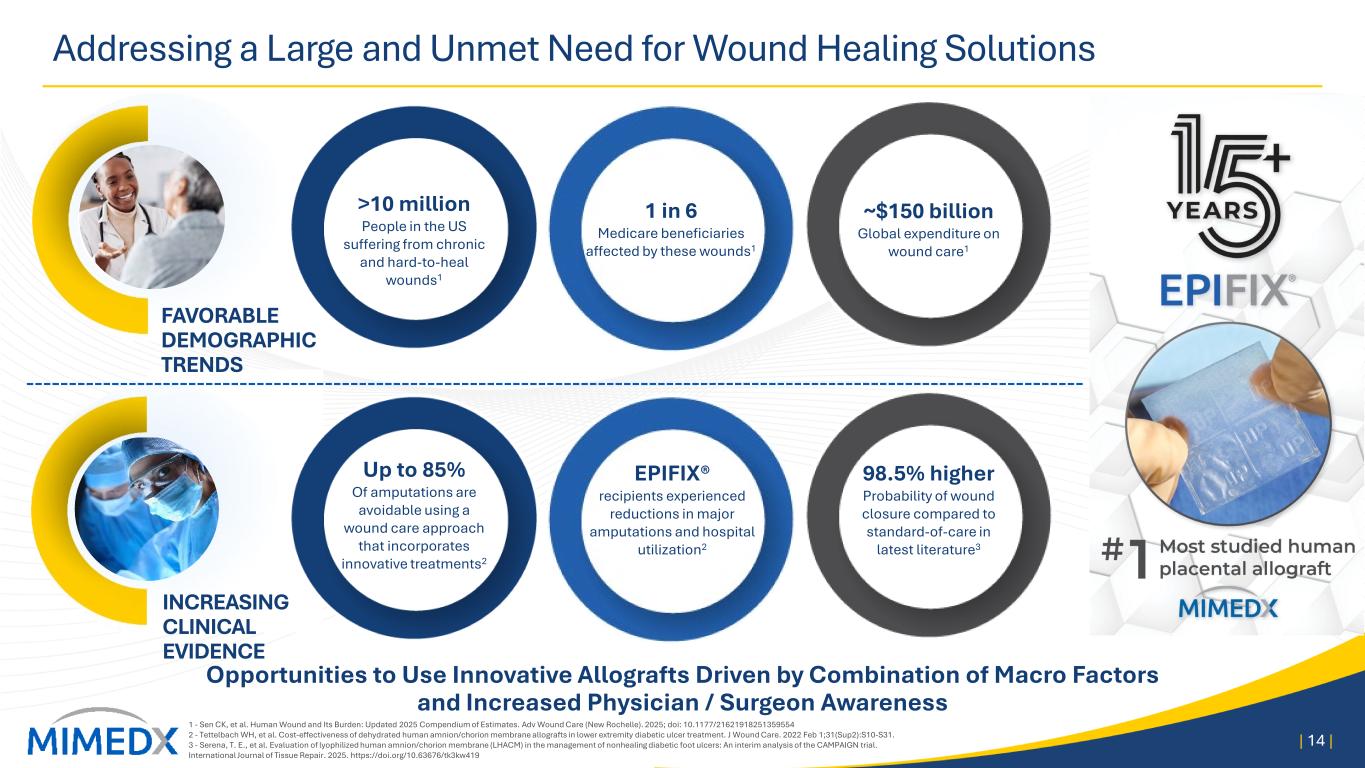
Addressing a Large and Unmet Need for Wound Healing Solutions 1 - Sen CK, et al. Human Wound and Its Burden: Updated 2025 Compendium of Estimates. Adv Wound Care (New Rochelle). 2025; doi: 10.1177/21621918251359554 2 - Tettelbach WH, et al. Cost-effectiveness of dehydrated human amnion/chorion membrane allografts in lower extremity diabetic ulcer treatment. J Wound Care. 2022 Feb 1;31(Sup2):S10-S31. 3 - Serena, T. E., et al. Evaluation of lyophilized human amnion/chorion membrane (LHACM) in the management of nonhealing diabetic foot ulcers: An interim analysis of the CAMPAIGN trial. International Journal of Tissue Repair. 2025. https://doi.org/10.63676/tk3kw419 | 14 | Opportunities to Use Innovative Allografts Driven by Combination of Macro Factors and Increased Physician / Surgeon Awareness INCREASING CLINICAL EVIDENCE FAVORABLE DEMOGRAPHIC TRENDS >10 million People in the US suffering from chronic and hard-to-heal wounds1 1 in 6 Medicare beneficiaries affected by these wounds1 Up to 85% Of amputations are avoidable using a wound care approach that incorporates innovative treatments2 EPIFIX® recipients experienced reductions in major amputations and hospital utilization2 98.5% higher Probability of wound closure compared to standard-of-care in latest literature3 ~$150 billion Global expenditure on wound care1
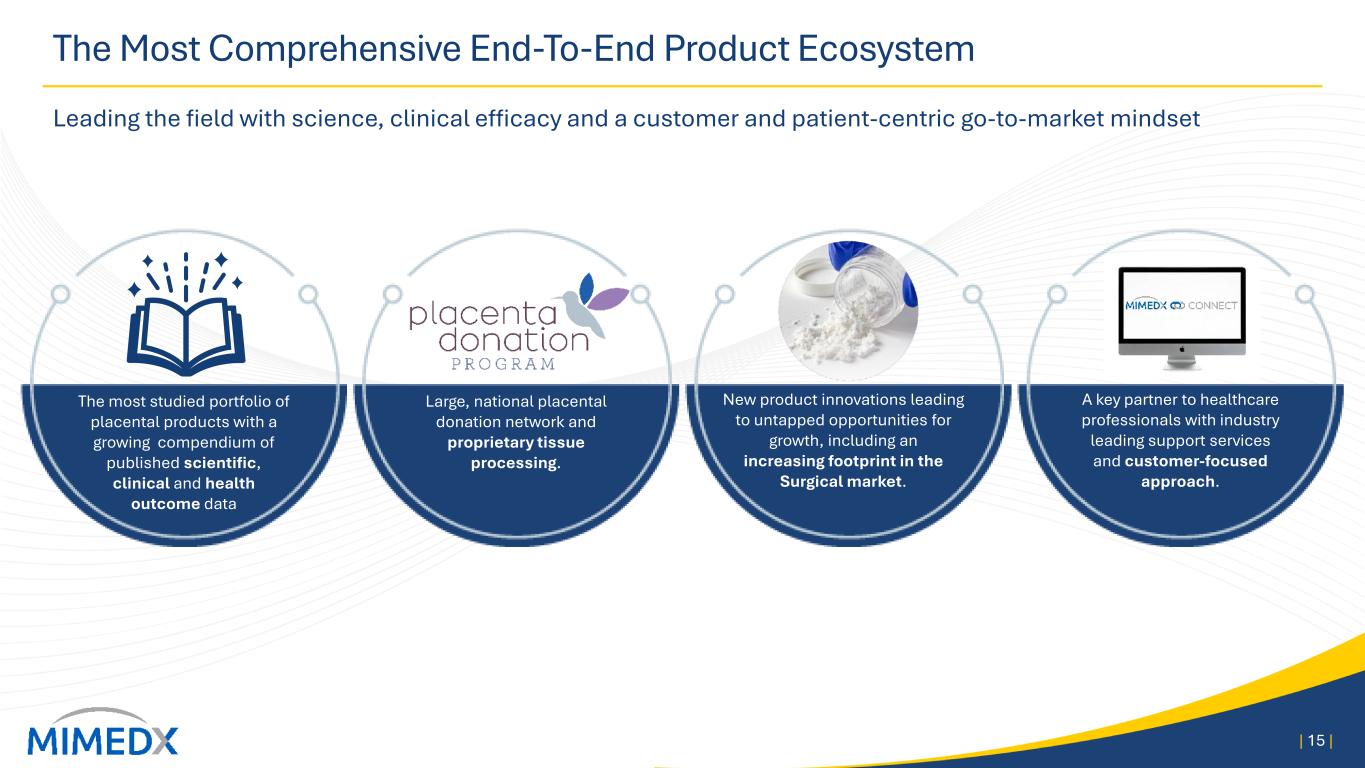
The Most Comprehensive End-To-End Product Ecosystem Leading the field with science, clinical efficacy and a customer and patient-centric go-to-market mindset | 15 | The most studied portfolio of placental products with a growing compendium of published scientific, clinical and health outcome data Large, national placental donation network and proprietary tissue processing. New product innovations leading to untapped opportunities for growth, including an increasing footprint in the Surgical market. A key partner to healthcare professionals with industry leading support services and customer-focused approach.
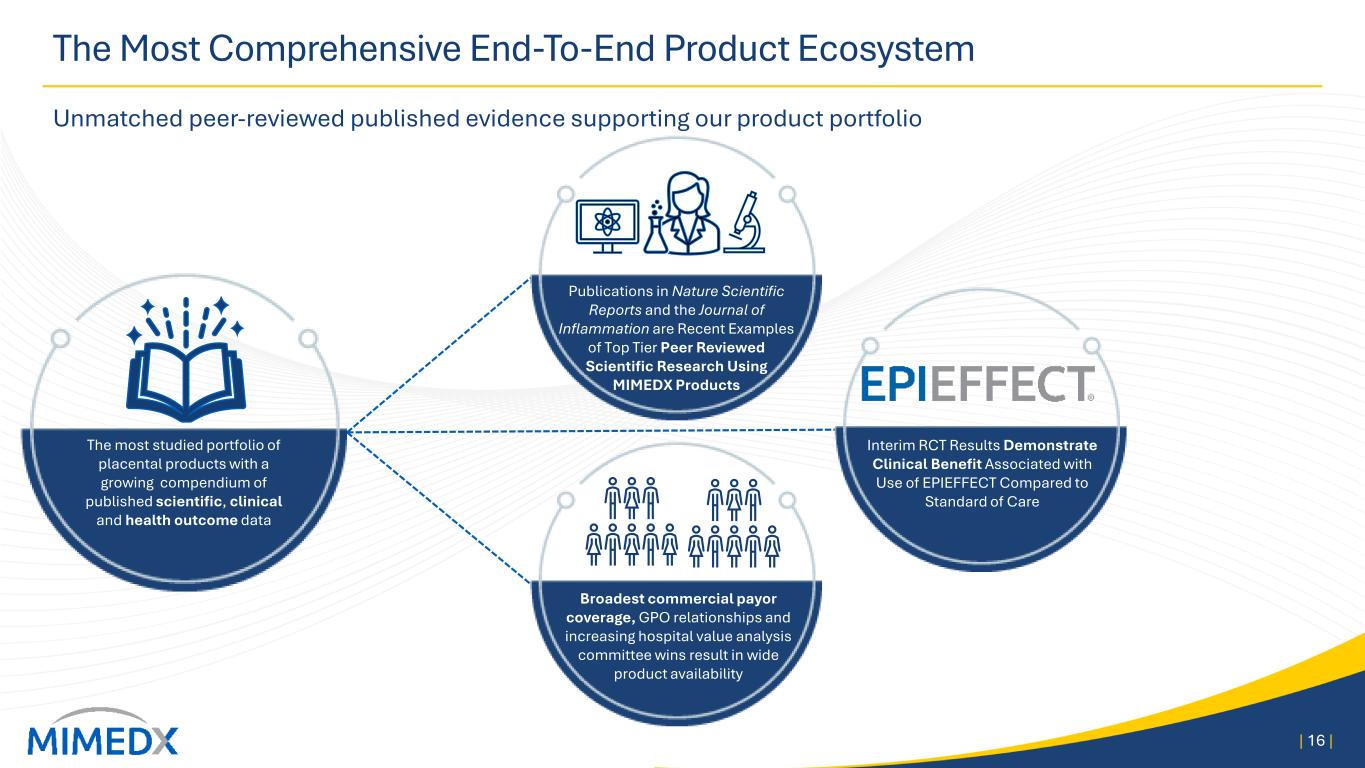
The Most Comprehensive End-To-End Product Ecosystem Unmatched peer-reviewed published evidence supporting our product portfolio | 16 | The most studied portfolio of placental products with a growing compendium of published scientific, clinical and health outcome data Broadest commercial payor coverage, GPO relationships and increasing hospital value analysis committee wins result in wide product availability Interim RCT Results Demonstrate Clinical Benefit Associated with Use of EPIEFFECT Compared to Standard of Care Publications in Nature Scientific Reports and the Journal of Inflammation are Recent Examples of Top Tier Peer Reviewed Scientific Research Using MIMEDX Products
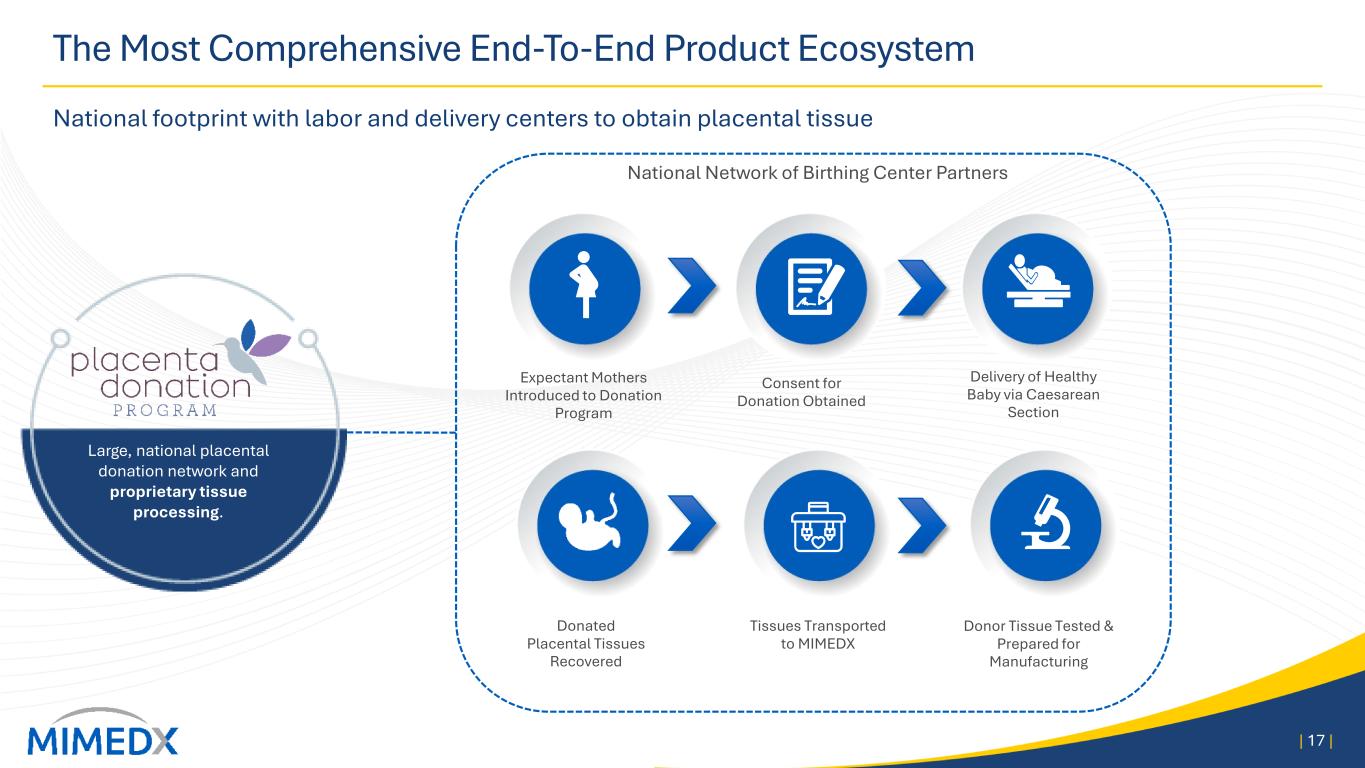
The Most Comprehensive End-To-End Product Ecosystem National footprint with labor and delivery centers to obtain placental tissue | 17 | Consent for Donation Obtained Delivery of Healthy Baby via Caesarean Section Donated Placental Tissues Recovered Tissues Transported to MIMEDX National Network of Birthing Center Partners Expectant Mothers Introduced to Donation Program Donor Tissue Tested & Prepared for Manufacturing Large, national placental donation network and proprietary tissue processing.
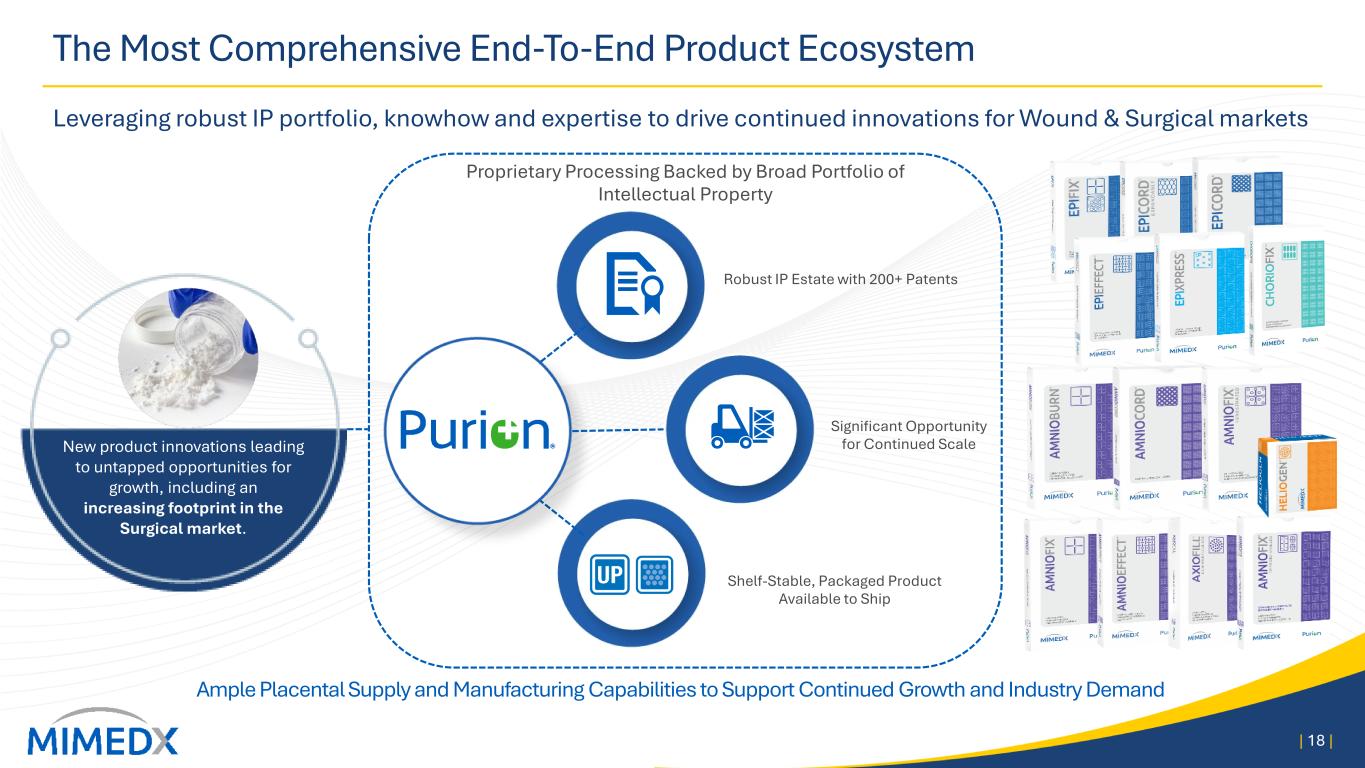
The Most Comprehensive End-To-End Product Ecosystem Leveraging robust IP portfolio, knowhow and expertise to drive continued innovations for Wound & Surgical markets | 18 | New product innovations leading to untapped opportunities for growth, including an increasing footprint in the Surgical market. Ample Placental Supply and Manufacturing Capabilities to Support Continued Growth and Industry Demand Proprietary Processing Backed by Broad Portfolio of Intellectual Property Shelf-Stable, Packaged Product Available to Ship Robust IP Estate with 200+ Patents Significant Opportunity for Continued Scale
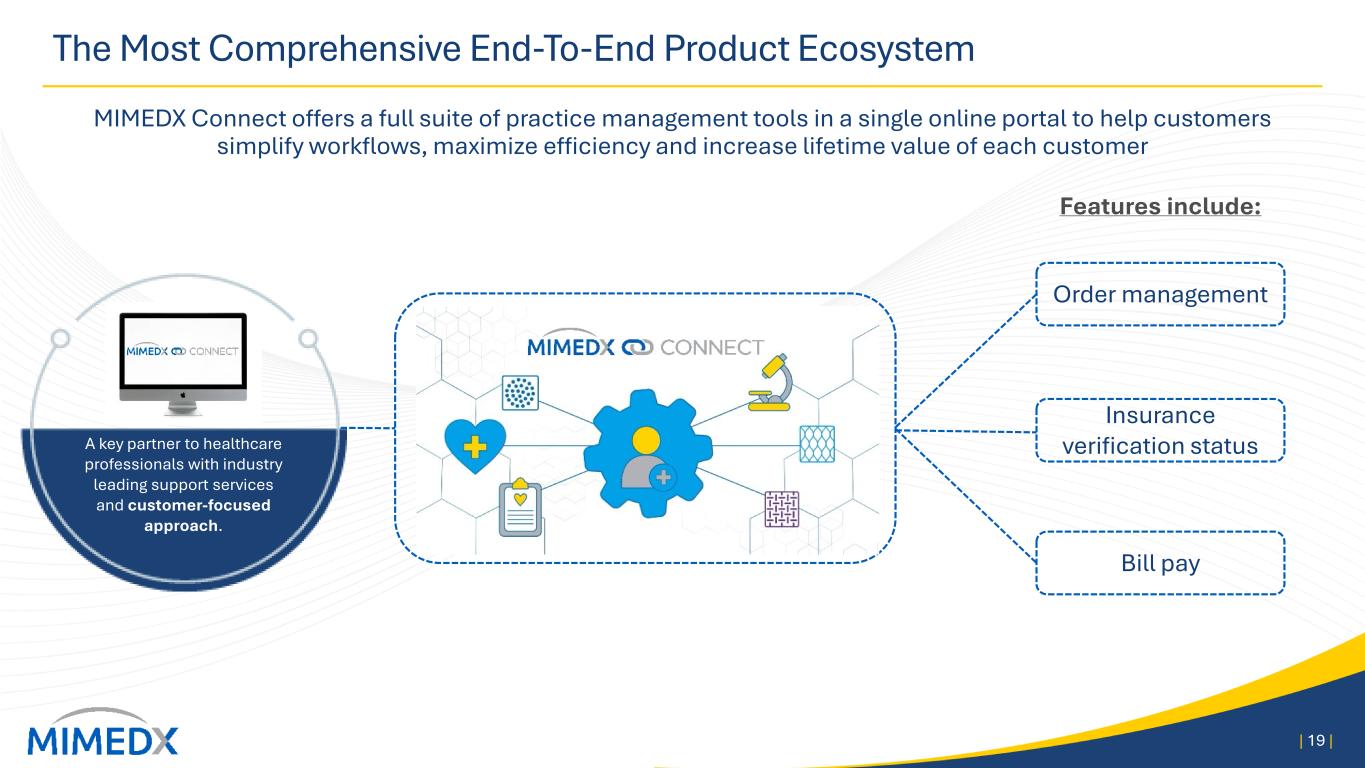
The Most Comprehensive End-To-End Product Ecosystem MIMEDX Connect offers a full suite of practice management tools in a single online portal to help customers simplify workflows, maximize efficiency and increase lifetime value of each customer | 19 | A key partner to healthcare professionals with industry leading support services and customer-focused approach. Order management Insurance verification status Bill pay Features include:
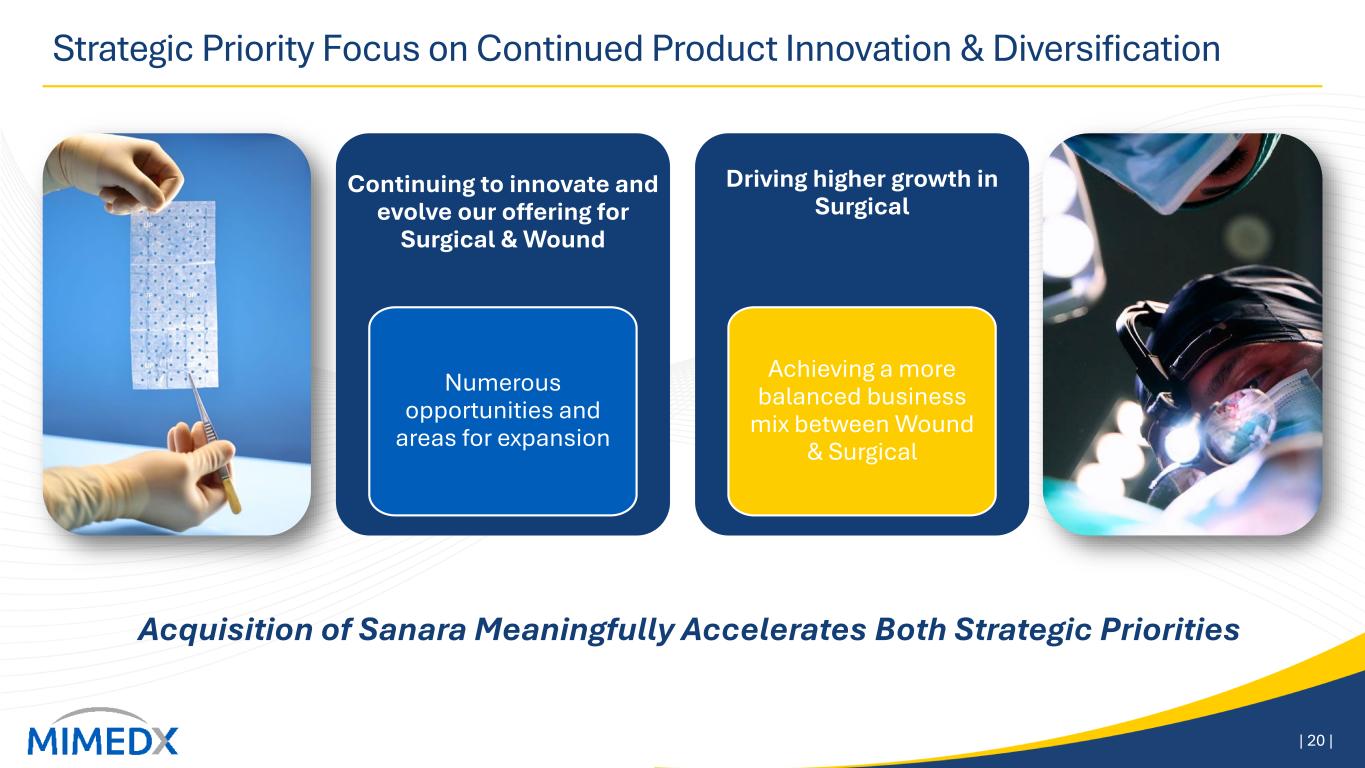
Strategic Priority Focus on Continued Product Innovation & Diversification | 20 | Continuing to innovate and evolve our offering for Surgical & Wound Numerous opportunities and areas for expansion Driving higher growth in Surgical Achieving a more balanced business mix between Wound & Surgical Acquisition of Sanara Meaningfully Accelerates Both Strategic Priorities
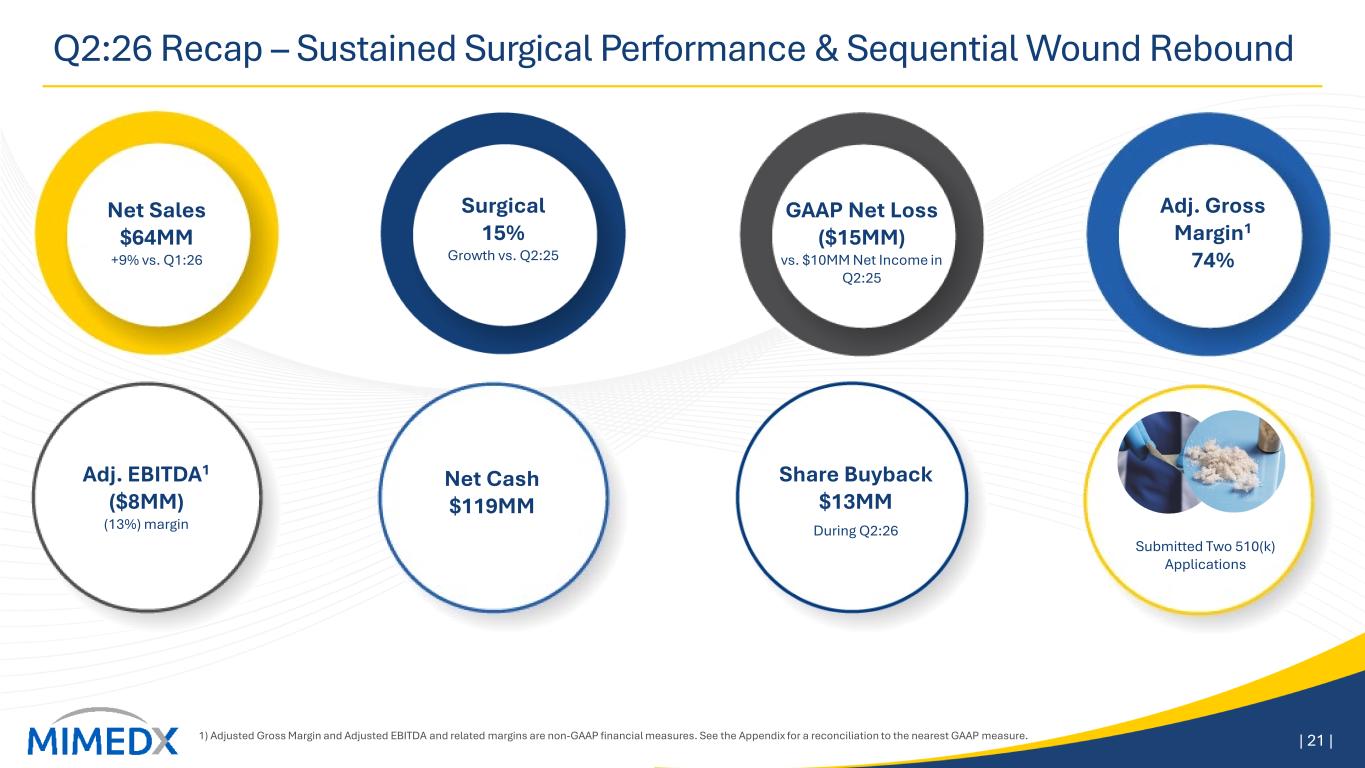
Q2:26 Recap – Sustained Surgical Performance & Sequential Wound Rebound 1) Adjusted Gross Margin and Adjusted EBITDA and related margins are non-GAAP financial measures. See the Appendix for a reconciliation to the nearest GAAP measure. | 21 | Surgical 15% Growth vs. Q2:25 Adj. Gross Margin1 74% GAAP Net Loss ($15MM) vs. $10MM Net Income in Q2:25 Net Sales $64MM +9% vs. Q1:26 Adj. EBITDA1 ($8MM) (13%) margin Net Cash $119MM During Q2:26 Share Buyback $13MM Submitted Two 510(k) Applications
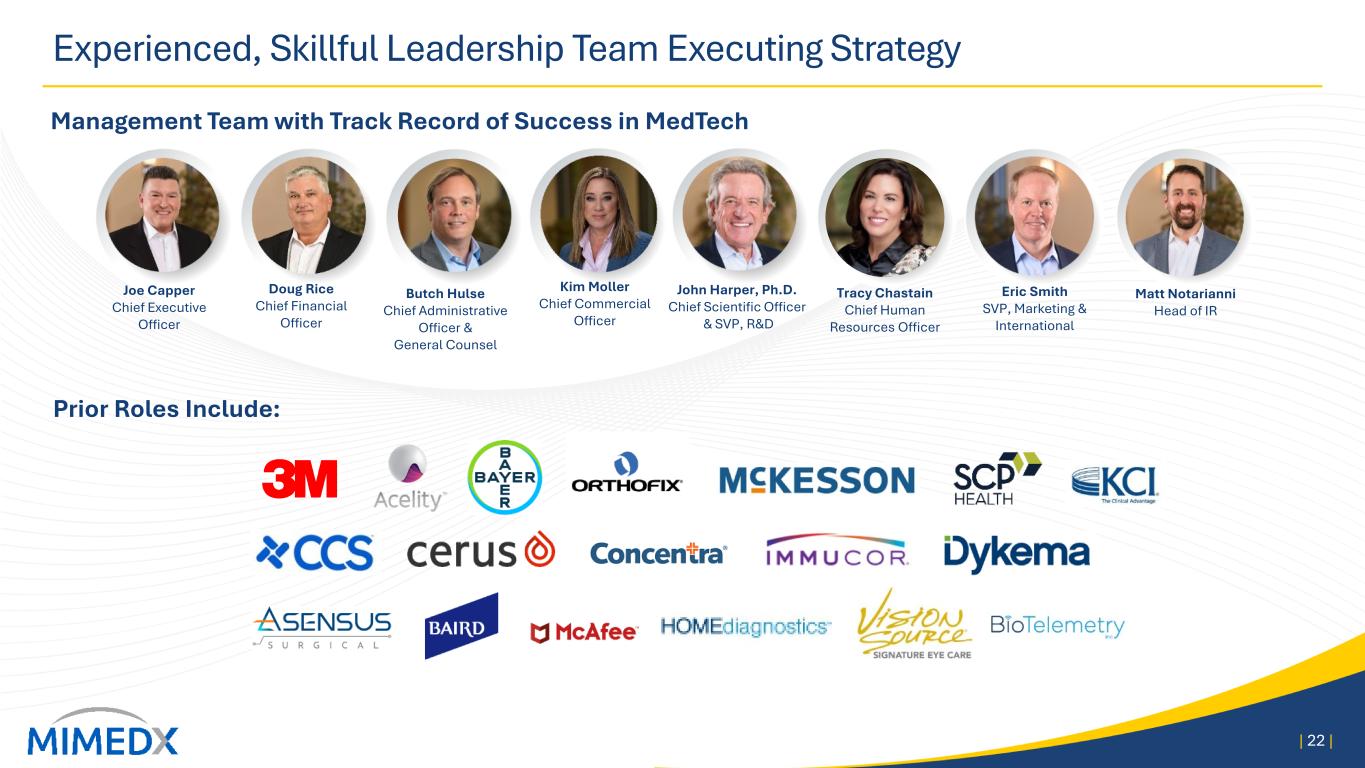
Experienced, Skillful Leadership Team Executing Strategy Prior Roles Include: Management Team with Track Record of Success in MedTech Joe Capper Chief Executive Officer Doug Rice Chief Financial Officer Butch Hulse Chief Administrative Officer & General Counsel Kim Moller Chief Commercial Officer John Harper, Ph.D. Chief Scientific Officer & SVP, R&D Matt Notarianni Head of IR 22| | Tracy Chastain Chief Human Resources Officer Eric Smith SVP, Marketing & International
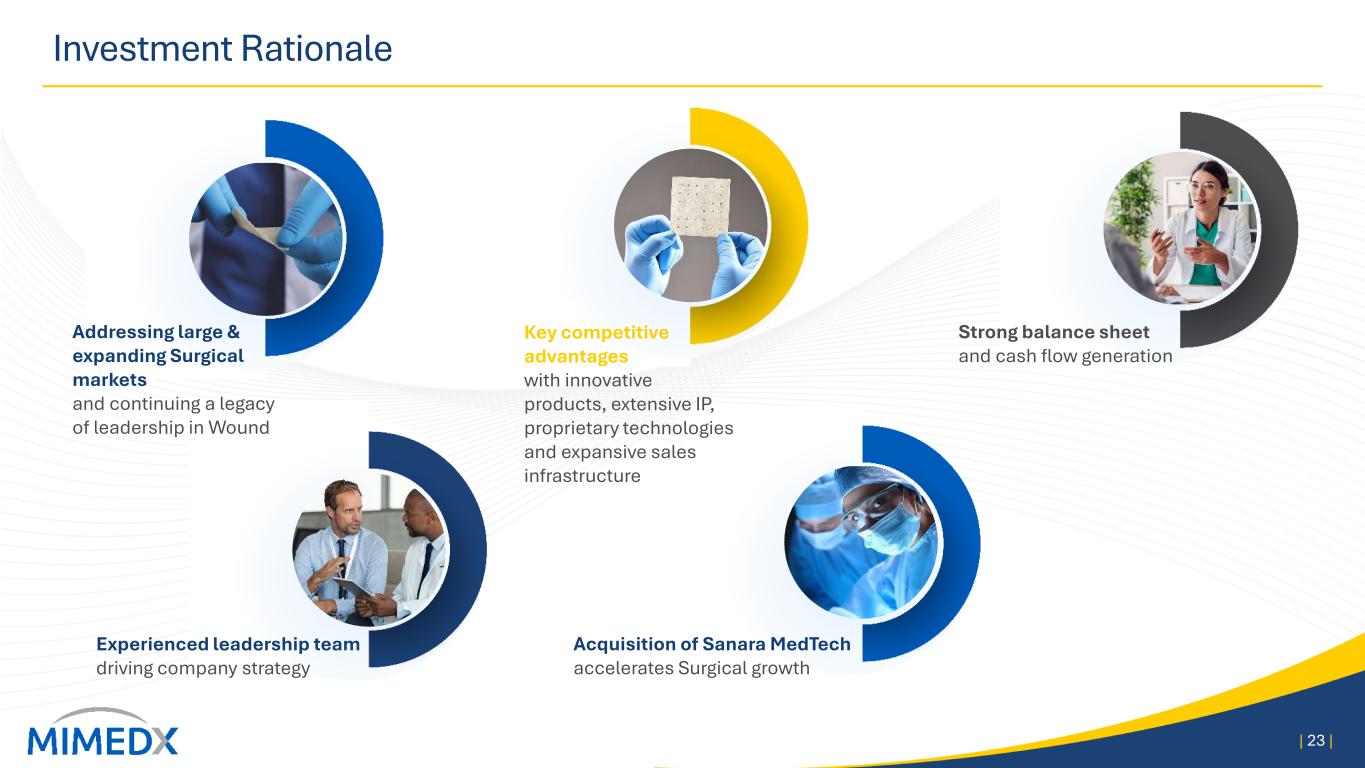
Investment Rationale | 23 | Addressing large & expanding Surgical markets and continuing a legacy of leadership in Wound Acquisition of Sanara MedTech accelerates Surgical growth Key competitive advantages with innovative products, extensive IP, proprietary technologies and expansive sales infrastructure Strong balance sheet and cash flow generation Experienced leadership team driving company strategy
THANK YOU MIMEDX 1775 West Oak Commons Ct. Marietta, GA 30062 888.543.1917 | 770.651.9100 | 24 |
Appendix | 25 |
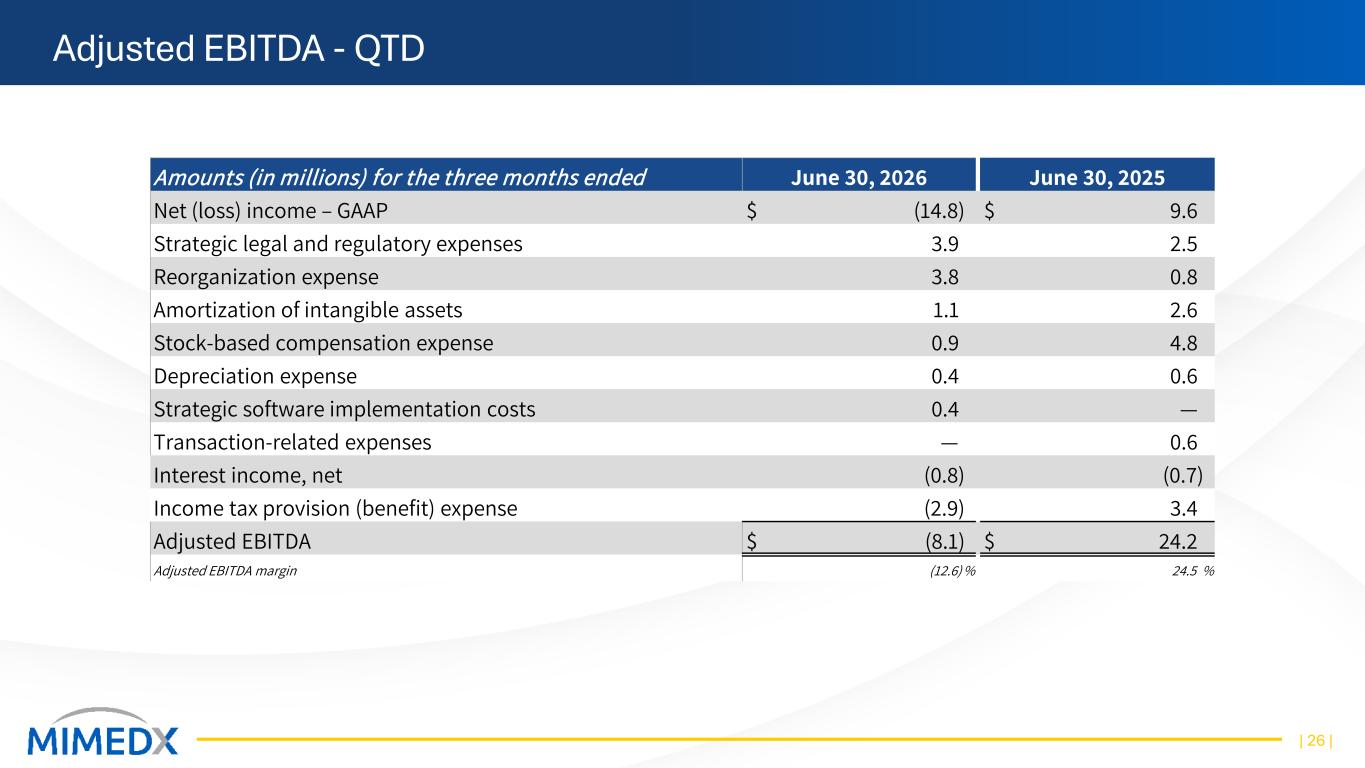
Adjusted EBITDA - QTD | 26 | Amounts (in millions) for the three months ended June 30, 2026 June 30, 2025 Net (loss) income – GAAP $ (14.8) $ 9.6 Strategic legal and regulatory expenses 3.9 2.5 Reorganization expense 3.8 0.8 Amortization of intangible assets 1.1 2.6 Stock-based compensation expense 0.9 4.8 Depreciation expense 0.4 0.6 Strategic software implementation costs 0.4 — Transaction-related expenses — 0.6 Interest income, net (0.8) (0.7) Income tax provision (benefit) expense (2.9) 3.4 Adjusted EBITDA $ (8.1) $ 24.2 Adjusted EBITDA margin (12.6) % 24.5 %
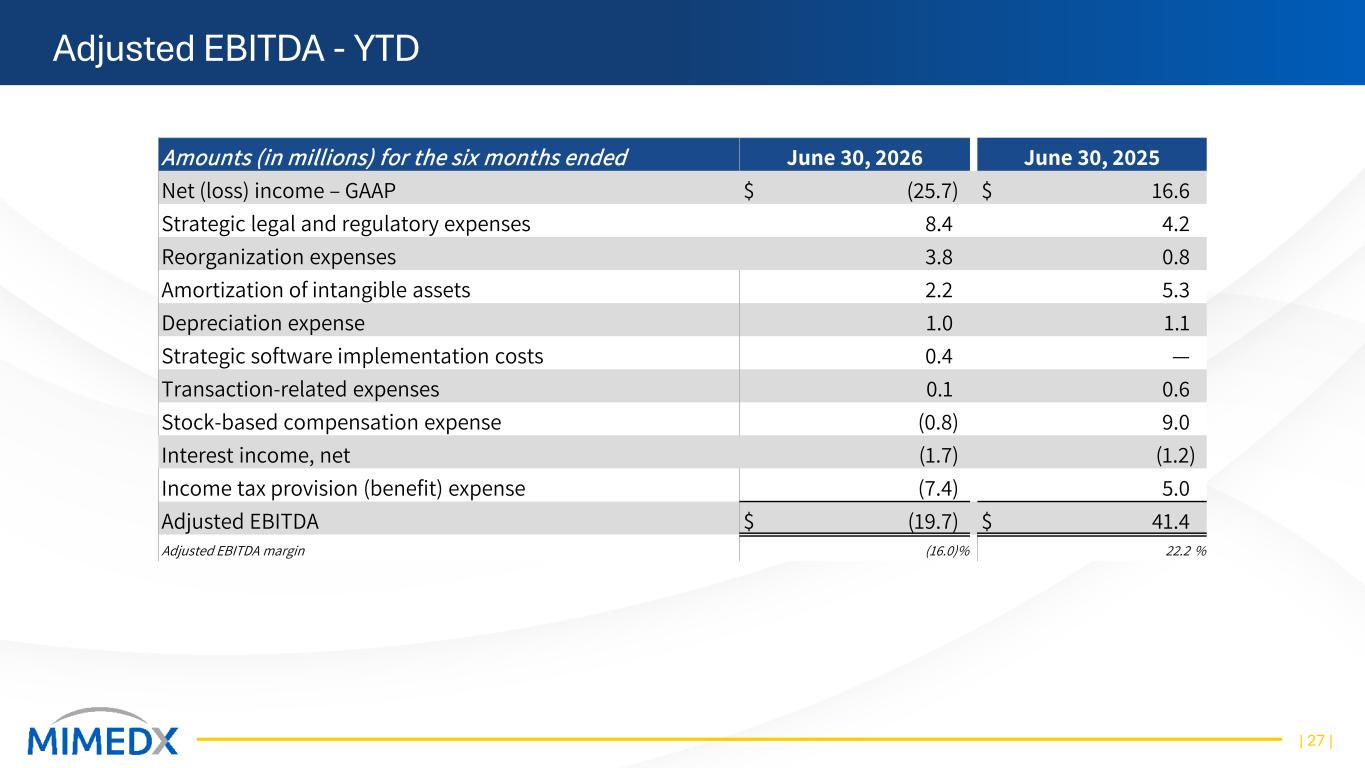
Adjusted EBITDA - YTD | 27 | Amounts (in millions) for the six months ended June 30, 2026 June 30, 2025 Net (loss) income – GAAP $ (25.7) $ 16.6 Strategic legal and regulatory expenses 8.4 4.2 Reorganization expenses 3.8 0.8 Amortization of intangible assets 2.2 5.3 Depreciation expense 1.0 1.1 Strategic software implementation costs 0.4 — Transaction-related expenses 0.1 0.6 Stock-based compensation expense (0.8) 9.0 Interest income, net (1.7) (1.2) Income tax provision (benefit) expense (7.4) 5.0 Adjusted EBITDA $ (19.7) $ 41.4 Adjusted EBITDA margin (16.0)% 22.2 %
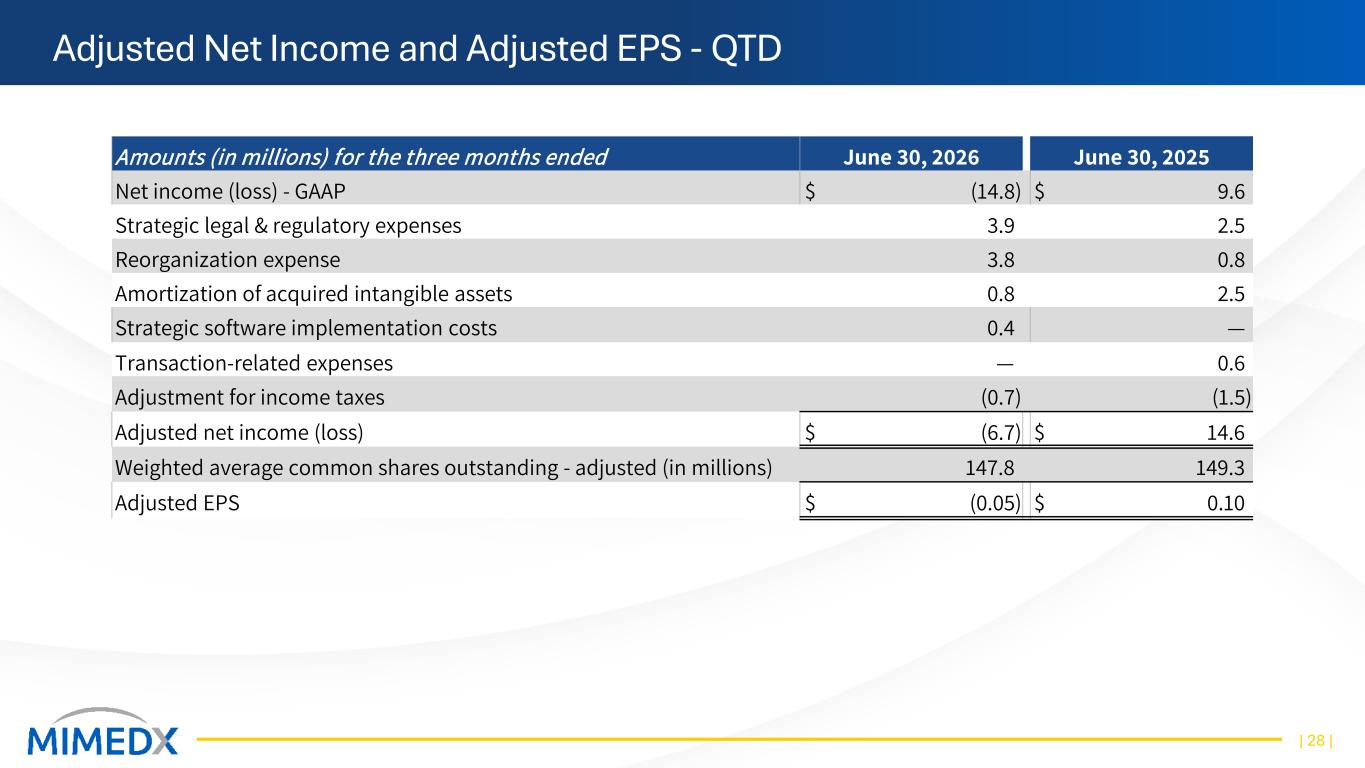
Adjusted Net Income and Adjusted EPS - QTD | 28 | Amounts (in millions) for the three months ended June 30, 2026 June 30, 2025 Net income (loss) - GAAP $ (14.8) $ 9.6 Strategic legal & regulatory expenses 3.9 2.5 Reorganization expense 3.8 0.8 Amortization of acquired intangible assets 0.8 2.5 Strategic software implementation costs 0.4 — Transaction-related expenses — 0.6 Adjustment for income taxes (0.7) (1.5) Adjusted net income (loss) $ (6.7) $ 14.6 Weighted average common shares outstanding - adjusted (in millions) 147.8 149.3 Adjusted EPS $ (0.05) $ 0.10
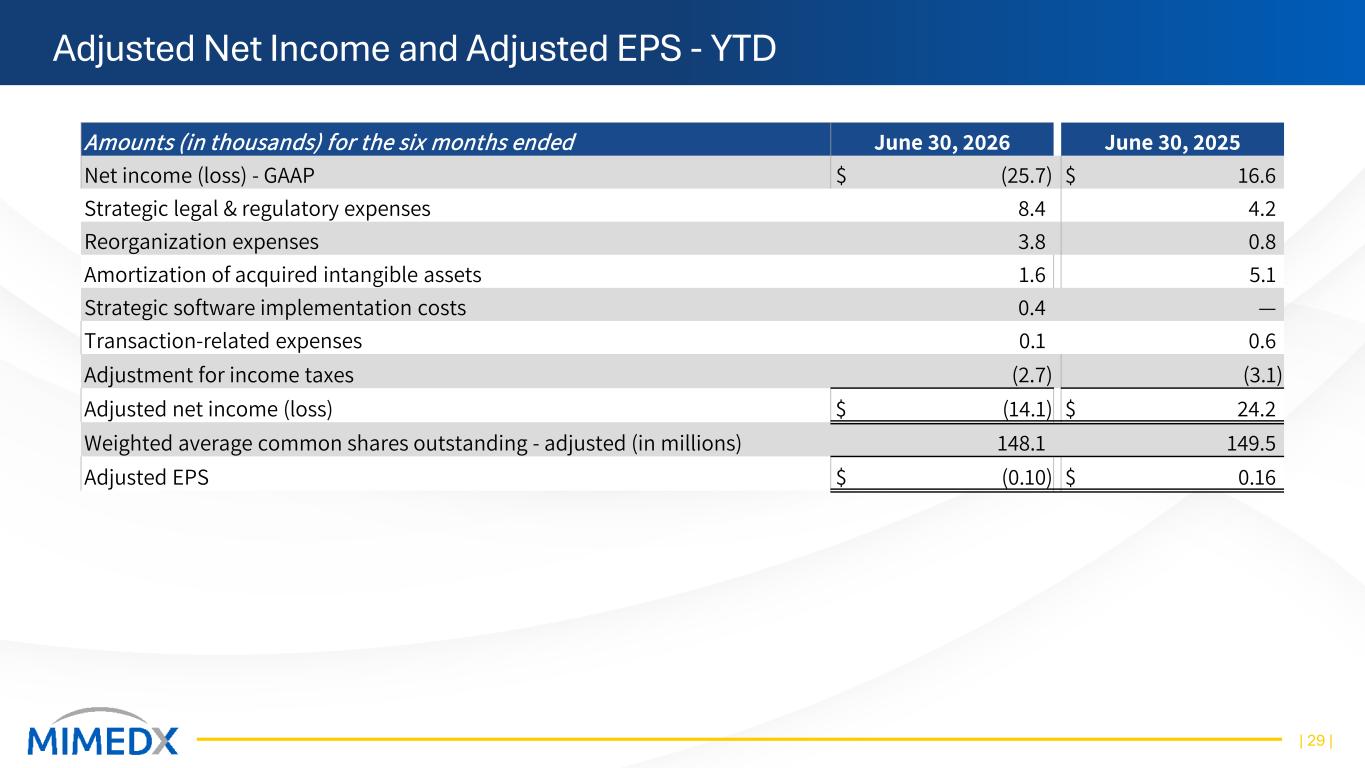
Adjusted Net Income and Adjusted EPS - YTD | 29 | Amounts (in thousands) for the six months ended June 30, 2026 June 30, 2025 Net income (loss) - GAAP $ (25.7) $ 16.6 Strategic legal & regulatory expenses 8.4 4.2 Reorganization expenses 3.8 0.8 Amortization of acquired intangible assets 1.6 5.1 Strategic software implementation costs 0.4 — Transaction-related expenses 0.1 0.6 Adjustment for income taxes (2.7) (3.1) Adjusted net income (loss) $ (14.1) $ 24.2 Weighted average common shares outstanding - adjusted (in millions) 148.1 149.5 Adjusted EPS $ (0.10) $ 0.16
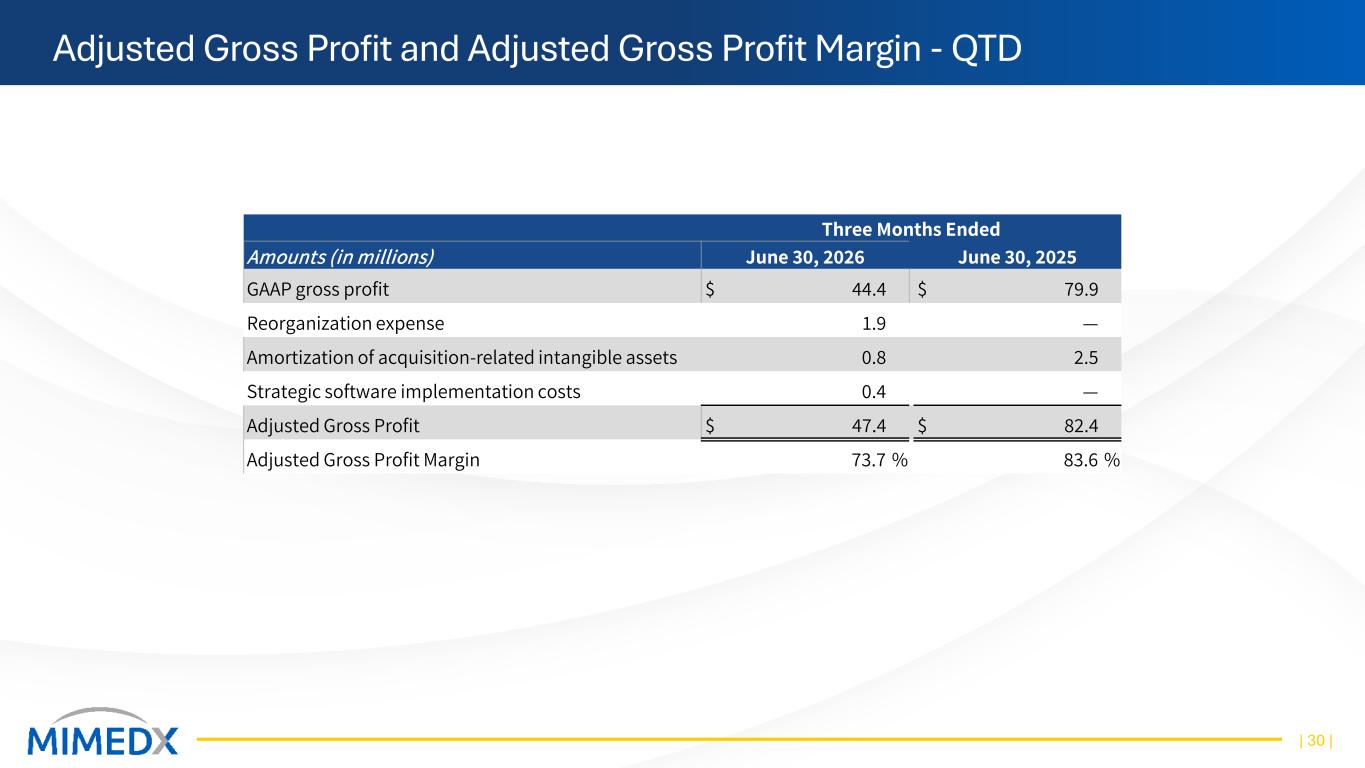
Adjusted Gross Profit and Adjusted Gross Profit Margin - QTD | 30 | Three Months Ended Amounts (in millions) June 30, 2026 June 30, 2025 GAAP gross profit $ 44.4 $ 79.9 Reorganization expense 1.9 — Amortization of acquisition-related intangible assets 0.8 2.5 Strategic software implementation costs 0.4 — Adjusted Gross Profit $ 47.4 $ 82.4 Adjusted Gross Profit Margin 73.7 % 83.6 %
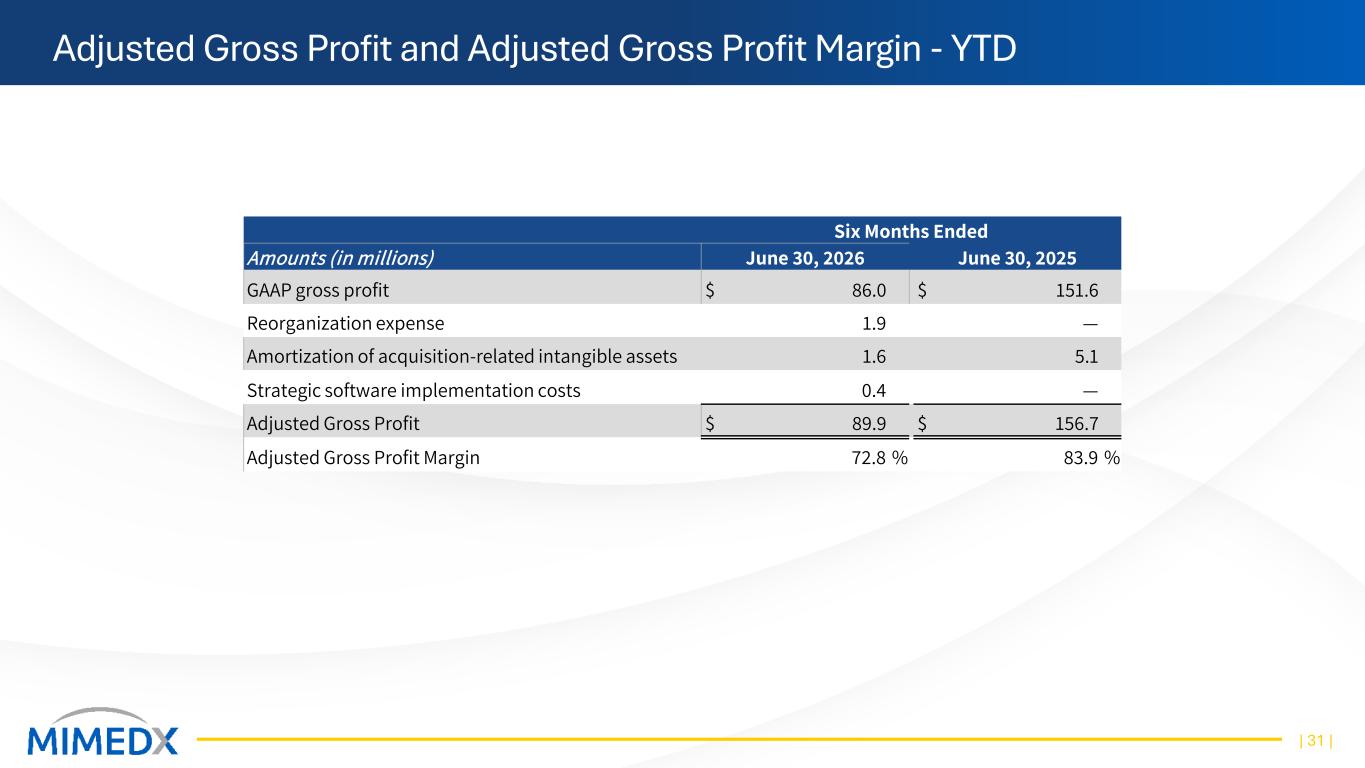
Adjusted Gross Profit and Adjusted Gross Profit Margin - YTD | 31 | Six Months Ended Amounts (in millions) June 30, 2026 June 30, 2025 GAAP gross profit $ 86.0 $ 151.6 Reorganization expense 1.9 — Amortization of acquisition-related intangible assets 1.6 5.1 Strategic software implementation costs 0.4 — Adjusted Gross Profit $ 89.9 $ 156.7 Adjusted Gross Profit Margin 72.8 % 83.9 %