2 The financial results in this document reflect preliminary, unaudited results, which are not final until the Company’s Annual Report on Form 10-K is filed. With the exception of historical information, certain statements contained or incorporated by reference herein may contain forward-looking statements within the meaning of Section 27A of the Securities Act of 1933, as amended (the “Securities Act”), and Section 21E of the Securities Exchange Act of 1934, as amended (the “Exchange Act”), such as those pertaining to our guidance, our capital resources and liquidity, our pursuit of growth opportunities, the timing of transaction closings and investment spending, our ongoing negotiations to exit from certain joint ventures or the ultimate terms of any such exit, our expected cash flows, the performance of our customers, our expected cash collections and our results of operations and financial condition. Forward-looking statements involve numerous risks and uncertainties, and you should not rely on them as predictions of actual events. There is no assurance that the events or circumstances reflected in the forward-looking statements will occur. You can identify forward-looking statements by use of words such as “will be,” “intend,” “continue,” “believe,” “may,” “expect,” “hope,” “anticipate,” “goal,” “forecast,” “pipeline,” “estimates,” “offers,” “plans,” “would” or other similar expressions or other comparable terms or discussions of strategy, plans or intentions contained or incorporated by reference herein. Forward-looking statements necessarily are dependent on assumptions, data or methods that may be incorrect or imprecise. These forward-looking statements represent our intentions, plans, expectations and beliefs and are subject to numerous assumptions, risks and uncertainties. Many of the factors that will determine these items are beyond our ability to control or predict. For further discussion of these factors see “Item 1A. Risk Factors” in our most recent Annual Report on Form 10-K and, to the extent applicable, our Quarterly Reports on Form 10-Q. For these statements, we claim the protection of the safe harbor for forward-looking statements contained in the Private Securities Litigation Reform Act of 1995. You are cautioned not to place undue reliance on our forward-looking statements, which speak only as of the date hereof or the date of any document incorporated by reference herein. All subsequent written and oral forward-looking statements attributable to us or any person acting on our behalf are expressly qualified in their entirety by the cautionary statements contained or referred to in this section. Except as required by law, we do not undertake any obligation to release publicly any revisions to our forward-looking statements to reflect events or circumstances after the date hereof. DISCLAIMER
INTRODUCTORY COMMENTS
4 QUARTERLY HIGHLIGHTS Executing Growth Strategy • Q2 revenue increased 10.1% & FFO as adjusted per share increased 12.7% • Set new post-COVID high for investment activity in single quarter of over $440M; reflects depth of opportunity & disciplined approach • Added Netflix as new partner through our acquisition of Netflix House Philadelphia; transforming popular digital intellectual property into physical, immersive experiences Portfolio Fundamentals Remain Resilient • Coverage held at 2.0x Balance Sheet Further Strengthened • New $1.6B credit agreement addresses near-term debt maturities & ensures balance sheet continues to be a source of strength to support growth Raising Guidance • Increasing 2026 investment spending and earnings guidance

PORTFOLIO
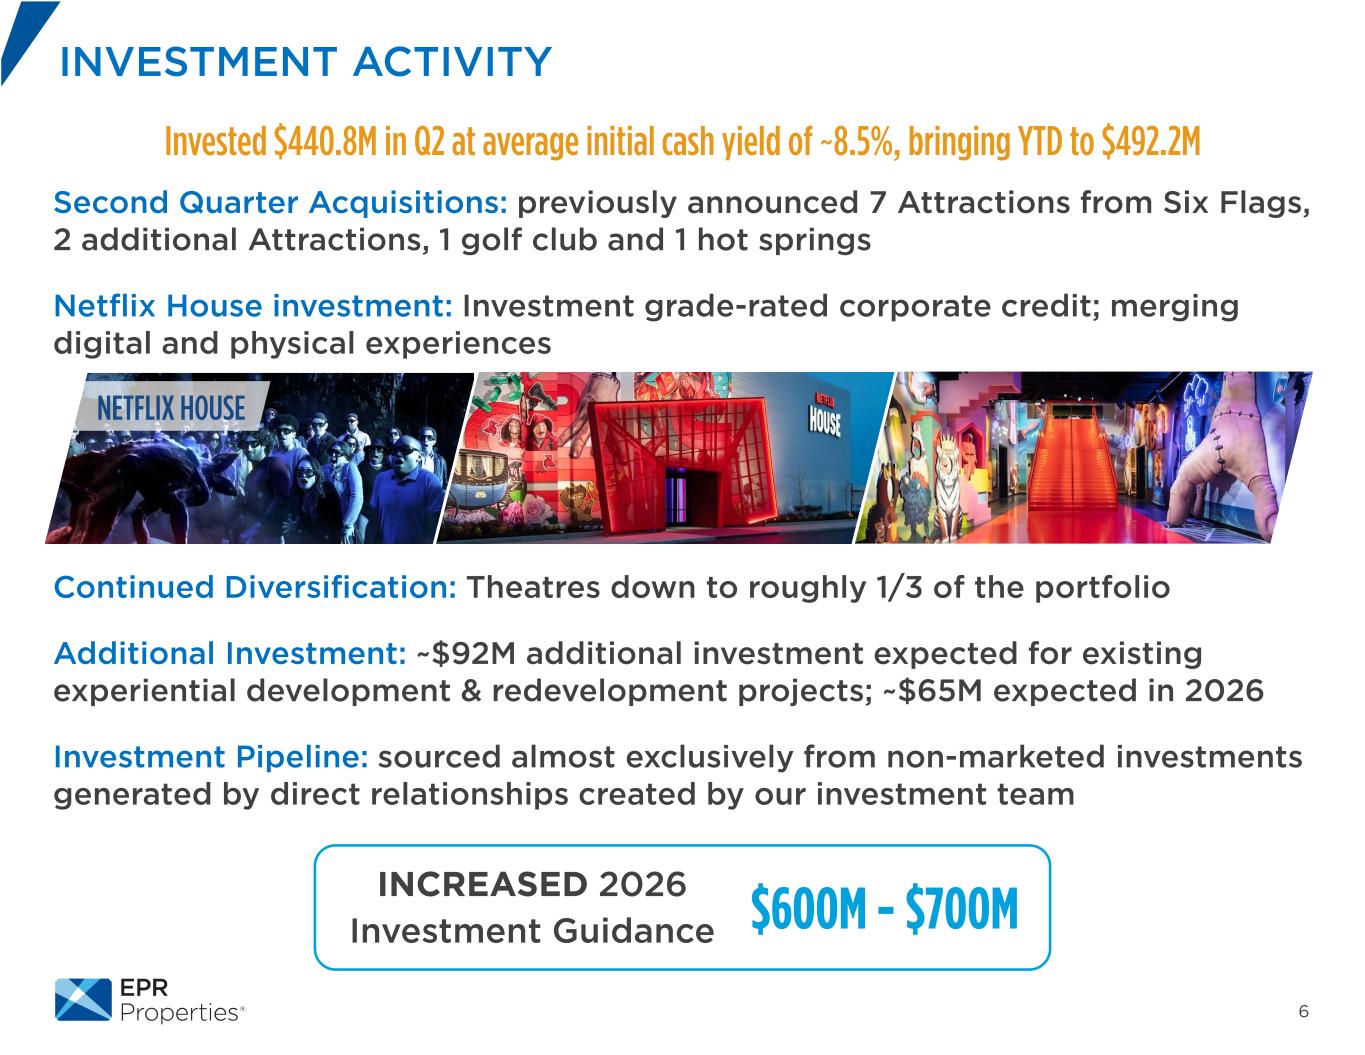
6 Second Quarter Acquisitions: previously announced 7 Attractions from Six Flags, 2 additional Attractions, 1 golf club and 1 hot springs Netflix House investment: Investment grade-rated corporate credit; merging digital and physical experiences Continued Diversification: Theatres down to roughly 1/3 of the portfolio Additional Investment: ~$92M additional investment expected for existing experiential development & redevelopment projects; ~$65M expected in 2026 Investment Pipeline: sourced almost exclusively from non-marketed investments generated by direct relationships created by our investment team INVESTMENT ACTIVITY Invested $440.8M in Q2 at average initial cash yield of ~8.5%, bringing YTD to $492.2M NETFLIX HOUSE INCREASED 2026 Investment Guidance $600M - $700M
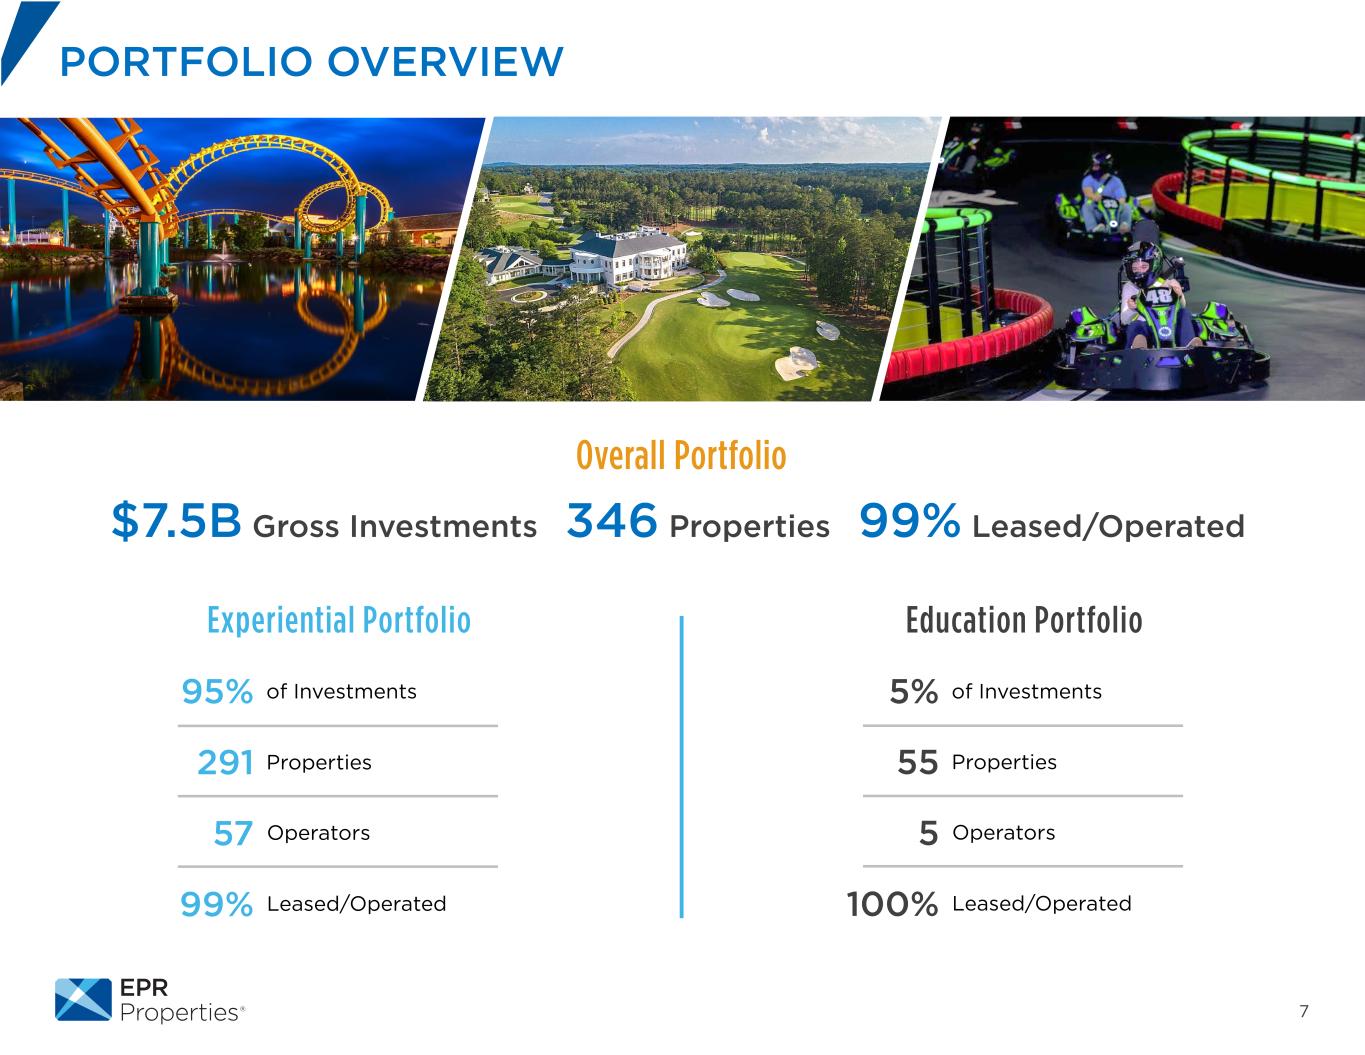
7 PORTFOLIO OVERVIEW Experiential Portfolio Education Portfolio Overall Portfolio $7.5B Gross Investments 346 Properties 99% Leased/Operated 95% of Investments 291 Properties 57 Operators 99% Leased/Operated 5% of Investments 55 Properties 5 Operators 100% Leased/Operated
8*BoxOfficeMojo **Variety “Gen Z Goes to the Movies! Younger Audiences Are Driving the Box Office, Study Shows” April 8, 2026 PORTFOLIO UPDATE Portfolio Demonstrates Resilience with Portfolio Coverage of 2.0x Theatres: continuation of outperformance in Q2; ticket sales ~10% above 2025* • Younger demographic fueling comeback: 87% of Gen Zers & 82% of Millennials saw at least one movie in a cinema during the past 12 months** Eat & Play: rent coverage stable with positive trends emerging at Topgolf from early operational enhancements post-separation from Callaway Attractions: delivered strong performance in Q2 Fitness & Wellness: continues to deliver solid performance; stabilizing trends at some of our recently renovated and expanded properties Education: continues to remain healthy despite industry-wide labor headwinds Dispositions: focus on opportunistic sales vs. defensive sales is reflective of the general health of portfolio & outstanding work done by the Asset Management team reducing legacy vacancies • Maintained disposition guidance of $50M - $100M
FINANCIAL REVIEW
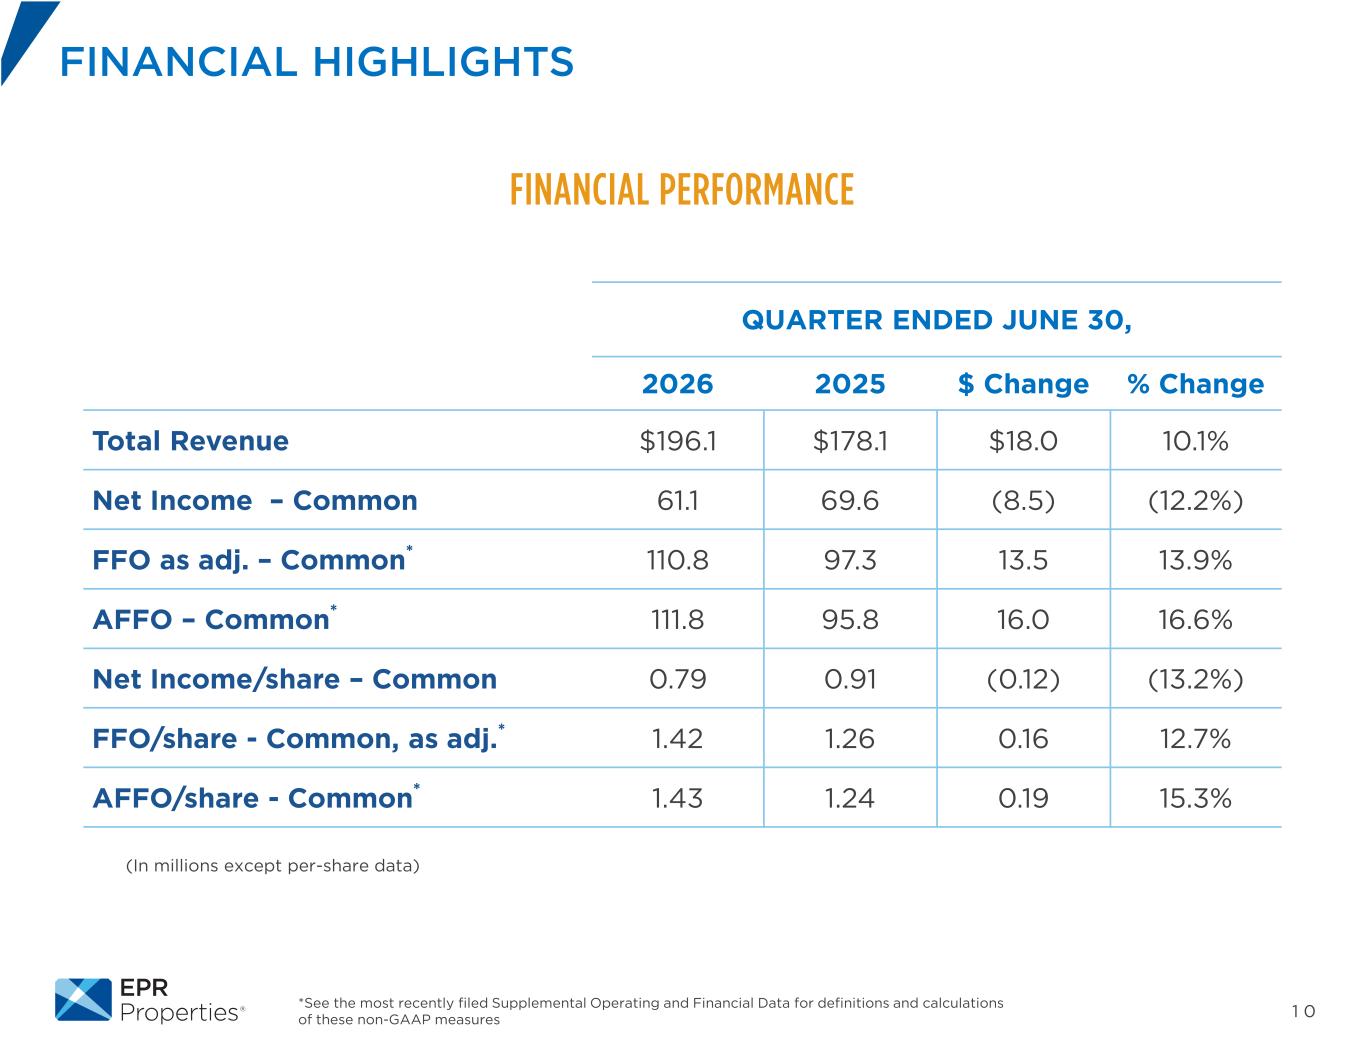
1 0*See the most recently filed Supplemental Operating and Financial Data for definitions and calculations of these non-GAAP measures FINANCIAL HIGHLIGHTS FINANCIAL PERFORMANCE QUARTER ENDED JUNE 30, 2026 2025 $ Change % Change Total Revenue $196.1 $178.1 $18.0 10.1% Net Income – Common 61.1 69.6 (8.5) (12.2%) FFO as adj. – Common* 110.8 97.3 13.5 13.9% AFFO – Common* 111.8 95.8 16.0 16.6% Net Income/share – Common 0.79 0.91 (0.12) (13.2%) FFO/share - Common, as adj.* 1.42 1.26 0.16 12.7% AFFO/share - Common* 1.43 1.24 0.19 15.3% (In millions except per-share data)
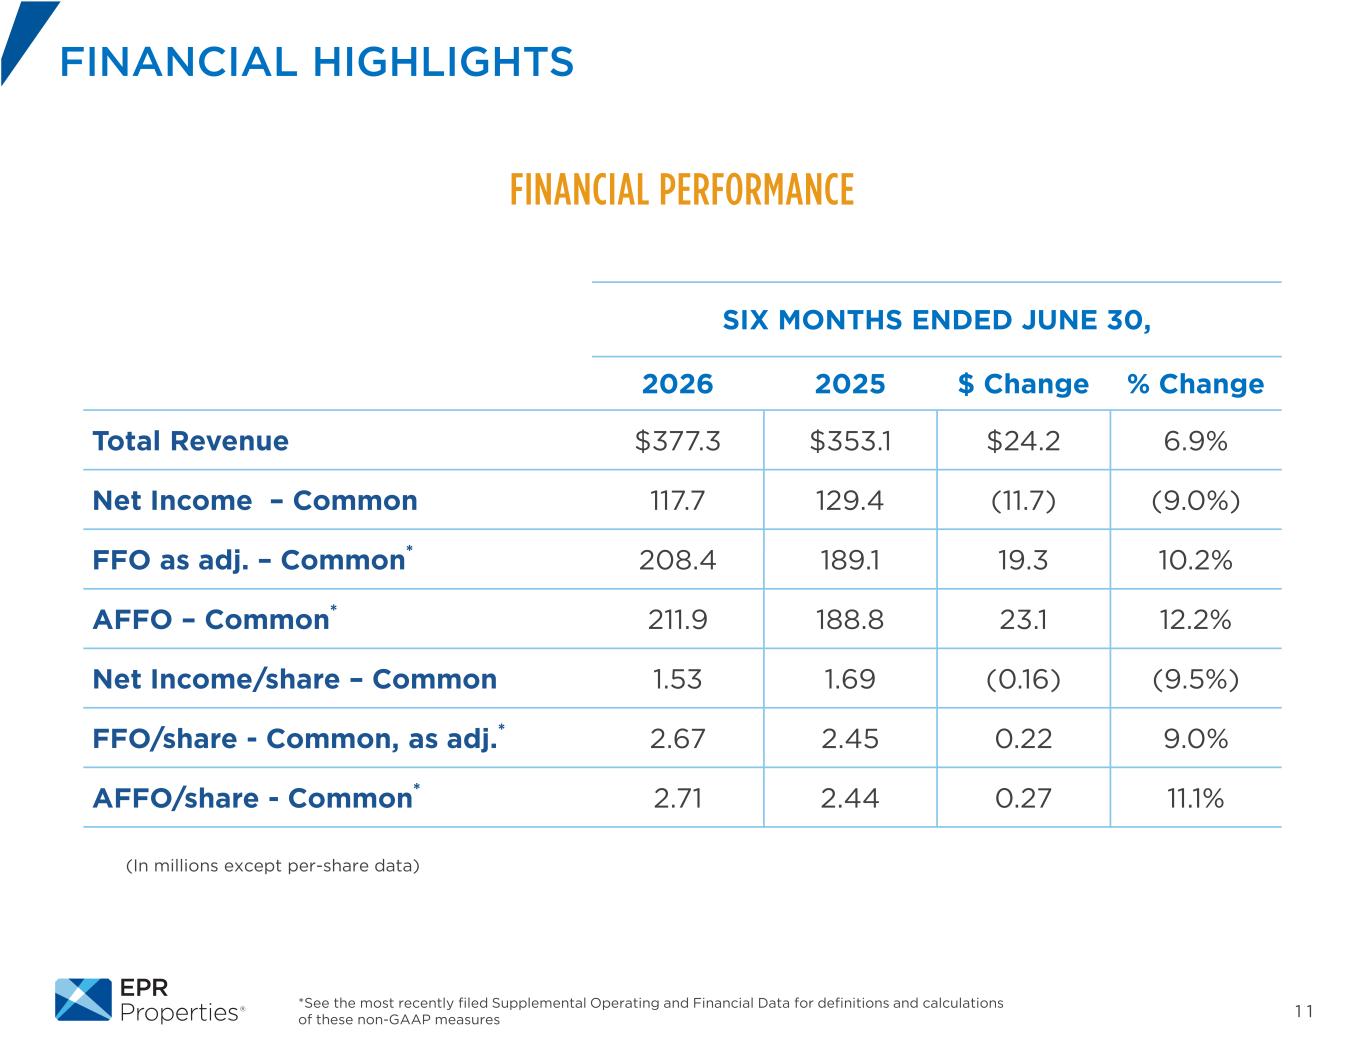
1 1*See the most recently filed Supplemental Operating and Financial Data for definitions and calculations of these non-GAAP measures FINANCIAL HIGHLIGHTS FINANCIAL PERFORMANCE SIX MONTHS ENDED JUNE 30, 2026 2025 $ Change % Change Total Revenue $377.3 $353.1 $24.2 6.9% Net Income – Common 117.7 129.4 (11.7) (9.0%) FFO as adj. – Common* 208.4 189.1 19.3 10.2% AFFO – Common* 211.9 188.8 23.1 12.2% Net Income/share – Common 1.53 1.69 (0.16) (9.5%) FFO/share - Common, as adj.* 2.67 2.45 0.22 9.0% AFFO/share - Common* 2.71 2.44 0.27 11.1% (In millions except per-share data)
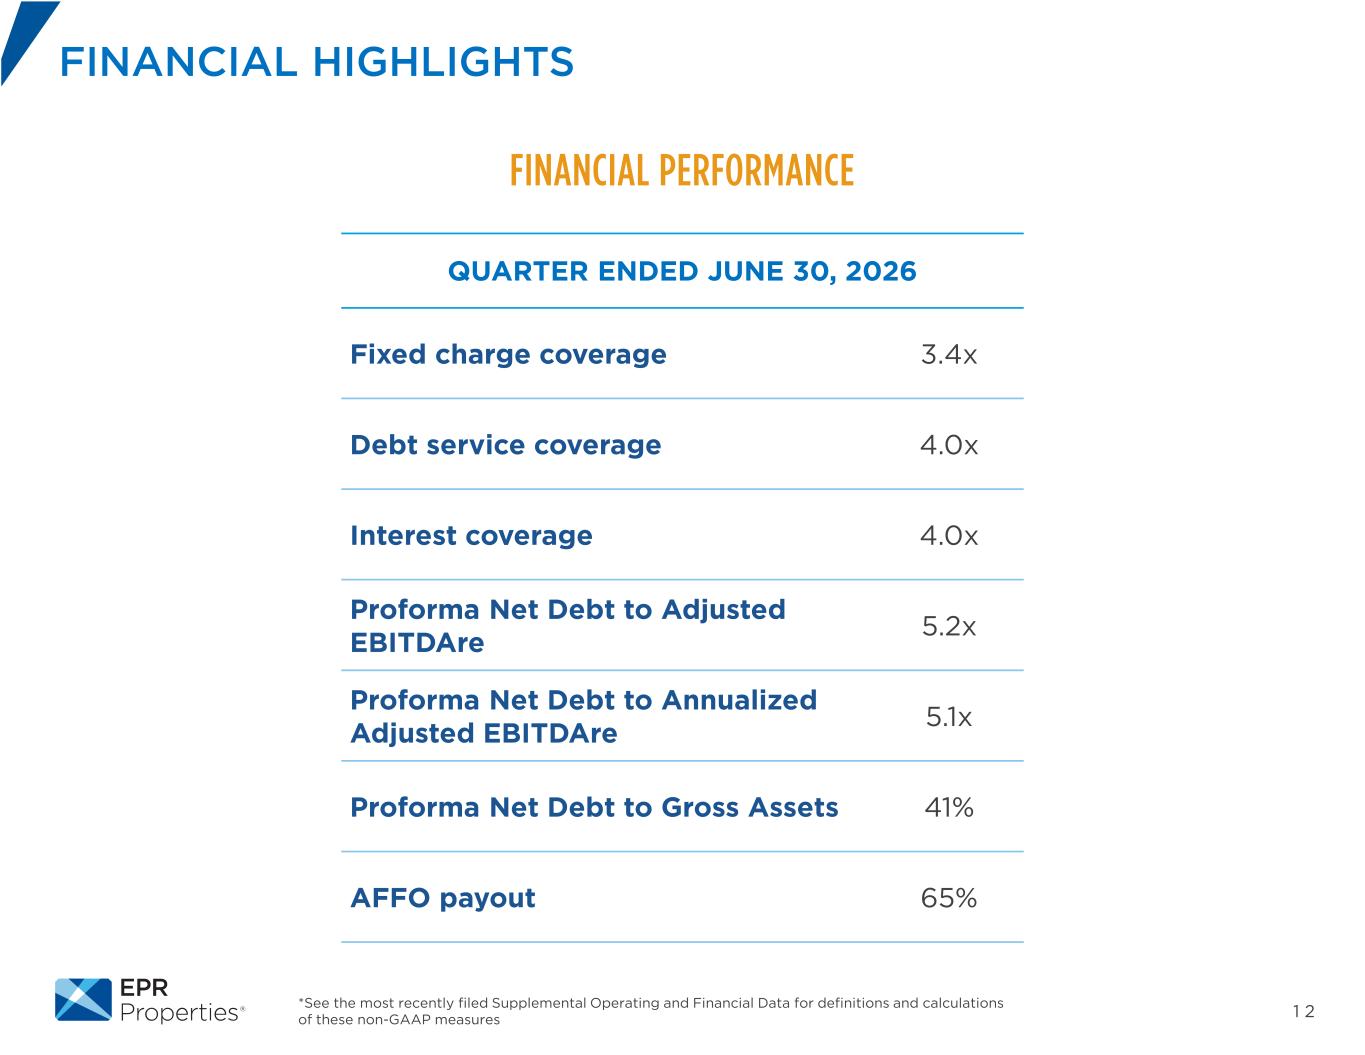
1 2*See the most recently filed Supplemental Operating and Financial Data for definitions and calculations of these non-GAAP measures FINANCIAL HIGHLIGHTS FINANCIAL PERFORMANCE QUARTER ENDED JUNE 30, 2026 Fixed charge coverage 3.4x Debt service coverage 4.0x Interest coverage 4.0x Proforma Net Debt to Adjusted EBITDAre 5.2x Proforma Net Debt to Annualized Adjusted EBITDAre 5.1x Proforma Net Debt to Gross Assets 41% AFFO payout 65%
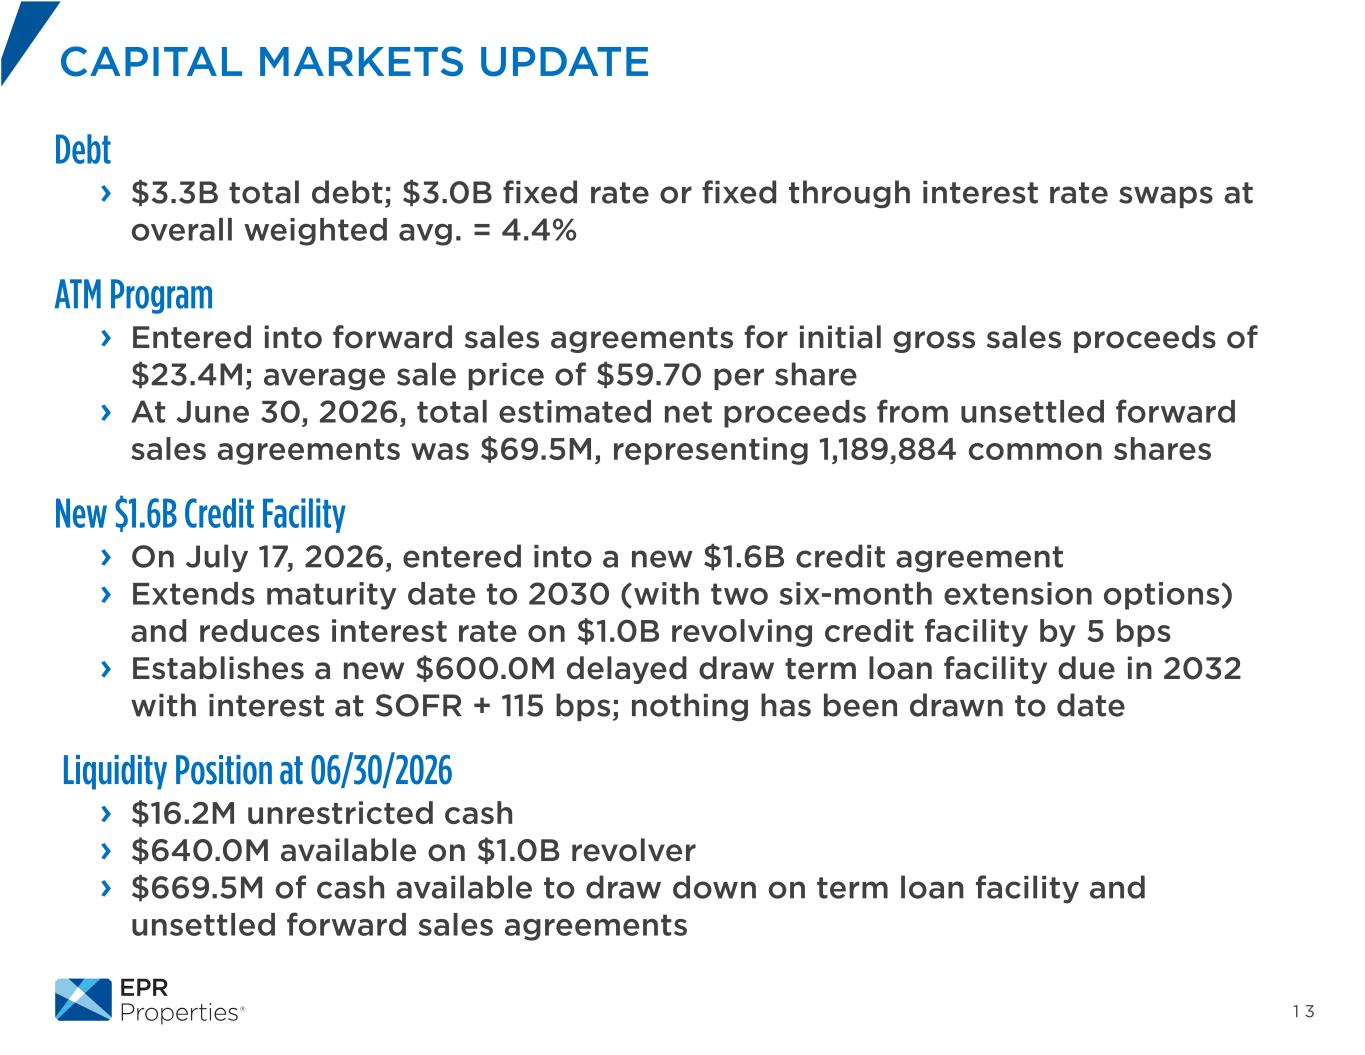
1 3 Debt › $3.3B total debt; $3.0B fixed rate or fixed through interest rate swaps at overall weighted avg. = 4.4% ATM Program › Entered into forward sales agreements for initial gross sales proceeds of $23.4M; average sale price of $59.70 per share › At June 30, 2026, total estimated net proceeds from unsettled forward sales agreements was $69.5M, representing 1,189,884 common shares New $1.6B Credit Facility › On July 17, 2026, entered into a new $1.6B credit agreement › Extends maturity date to 2030 (with two six-month extension options) and reduces interest rate on $1.0B revolving credit facility by 5 bps › Establishes a new $600.0M delayed draw term loan facility due in 2032 with interest at SOFR + 115 bps; nothing has been drawn to date Liquidity Position at 06/30/2026 › $16.2M unrestricted cash › $640.0M available on $1.0B revolver › $669.5M of cash available to draw down on term loan facility and unsettled forward sales agreements CAPITAL MARKETS UPDATE
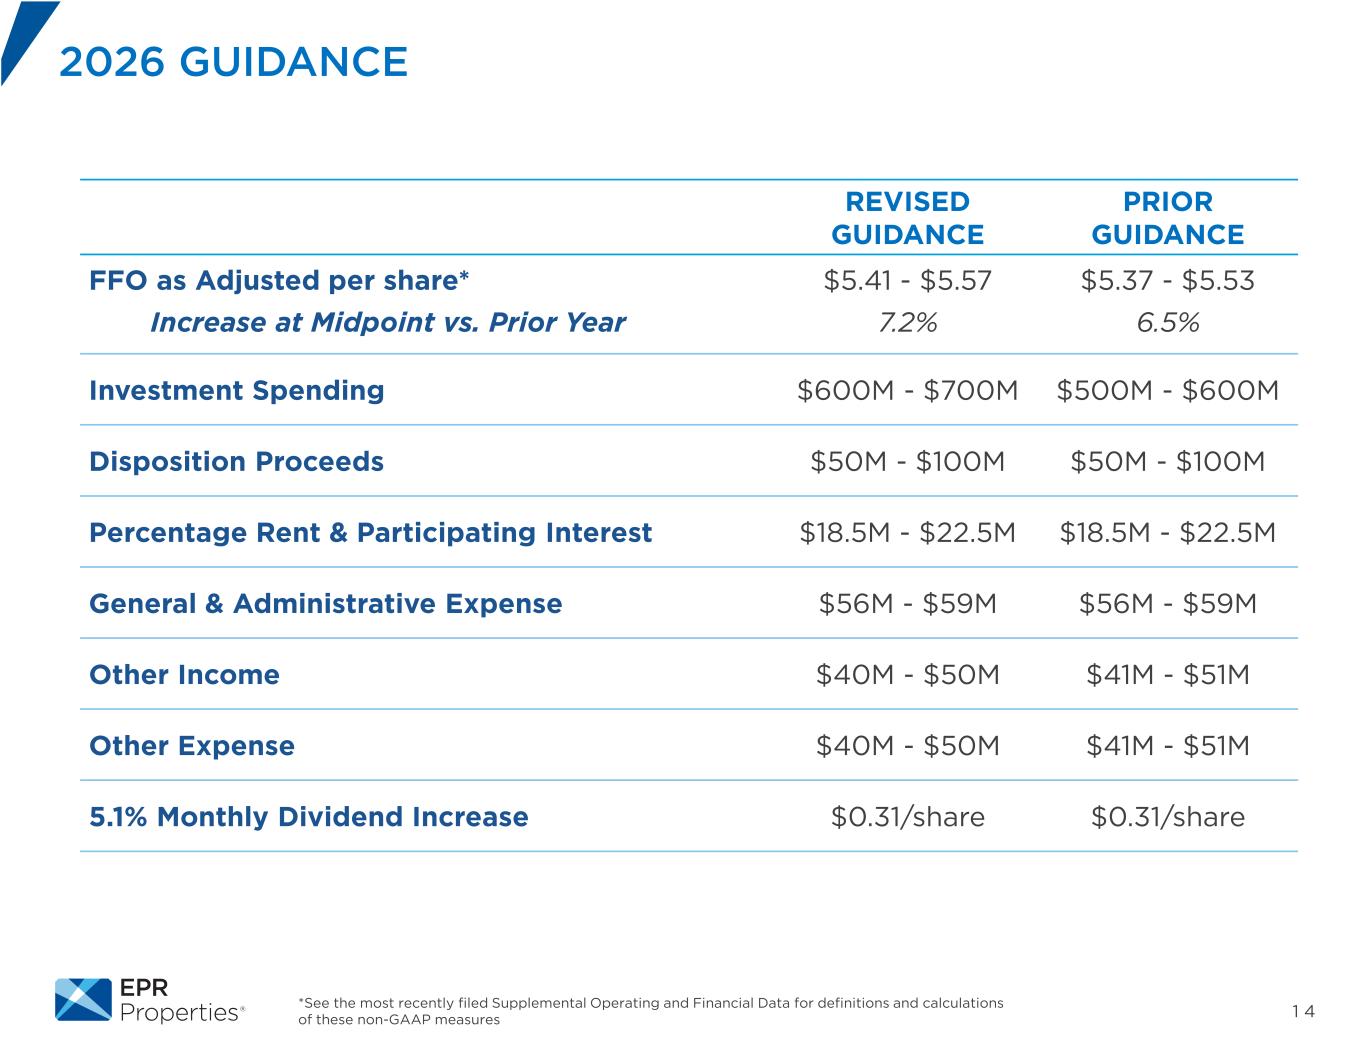
1 4*See the most recently filed Supplemental Operating and Financial Data for definitions and calculations of these non-GAAP measures 2026 GUIDANCE REVISED GUIDANCE PRIOR GUIDANCE FFO as Adjusted per share* $5.41 - $5.57 $5.37 - $5.53 Increase at Midpoint vs. Prior Year 7.2% 6.5% Investment Spending $600M - $700M $500M - $600M Disposition Proceeds $50M - $100M $50M - $100M Percentage Rent & Participating Interest $18.5M - $22.5M $18.5M - $22.5M General & Administrative Expense $56M - $59M $56M - $59M Other Income $40M - $50M $41M - $51M Other Expense $40M - $50M $41M - $51M 5.1% Monthly Dividend Increase $0.31/share $0.31/share
CLOSING COMMENTS

QUESTIONS