v3.26.1
Pay vs Performance Disclosure - USD ($)
12 Months Ended
Dec. 31, 2025
Dec. 31, 2024
Dec. 31, 2023
Pay vs Performance Disclosure      
Pay vs Performance Disclosure, Table

Pay Versus Performance

As required by Section 953(a) of the Dodd-Frank Wall Street Reform and Consumer Protection Act of 2010, and Item 402(v) of Regulation S-K, which was adopted by the SEC in 2022, the Company is providing the following information regarding the relationship between “compensation actually paid” (“CAP”) to our principal executive officer (“PEO”) and non-PEO named executive officers (“NEOs”) and certain financial performance of the Company for the fiscal years listed below.


Ronald Glibbery – PEO


Non-PEO NEOs


Value of Initial
Fixed $100
Investment
Based on Total
Shareholder
Return
(“TSR”)(5)


Net Loss
(thousands)(6)

Year


Summary
Compensation
Table Total for
PEO
(1)


Compensation
Actually Paid
to PEO
(2)


Average
Summary
Compensation
Table Total
for Non-PEO

NEOs(3)


Average
Compensation
Actually Paid
to Non-PEO
NEOs
(4)


2025


$

499,000


$

499,000


$

389,000


$

384,628


$

(97.02

)


$

(4,753

)

2024


$

400,000


$

356,170


$

285,000


$

250,459


$

(96.03

)


$

(10,728

)

2023


$

400,000


$

305,875


$

290,000


$

354,460


$

(61.70

)


$

(16,795

)

____________

(1)      Represent the amounts of total compensation reported for our PEO, Ronald Glibbery, during each corresponding year in the “Total” column of the Summary Compensation Table below.

(2)      Represents the amount of “compensation actually paid” to our PEO, as computed in accordance with Item 402(v) of Regulation S-K, with the following adjustments:

Year


Summary
Compensation
Table Total for
Ronald
Glibbery


Reported
Value of
Equity
Awards
for Ronald
Glibbery


Fair Value
as of
Year-End
for
Awards
Granted
During
the Year


Fair Value
Year-over-Year
increase or
decrease in
Unvested
Awards
Granted in
Prior Years


Fair Value
of Awards
Granted
and Vested
During the
Year


Fair Value
Increase or
Decrease
from Prior
Year End
for Awards
that Vested
During the
Year


Compensation
Actually Paid
to Ronald
Glibbery

2025


$

499,000


$


$


$


$

499,000

2024


$

400,000


$

(18,670

)


$

2,177


$

(27,337

)


$

356,170

2023


$

400,000


$

(78,663

)


$

29,514


$

(44,976

)


$

305,875

3)      Represents the average of the amounts reported for our NEOs as a group (excluding our PEO) in each applicable year in the “Total” column of the Summary Compensation Table below. For 2025, this consisted of James Sullivan and Bradley Lynch, for 2024, this consisted of James Sullivan, Bradley Lynch and Mark Lunsford, for 2023, this consisted of James Sullivan and Bradley Lynch (the “Non-PEO NEOs”).

(4)      Represents the average amount of “compensation actually paid” to the Non-PEO NEOs, as computed in accordance with Item 402(v) of Regulation S-K. The dollar amounts do not reflect the actual average compensation earned or paid to the Non-PEO NEOs during the applicable year. In accordance with the requirements of Item 402(v) of Regulation S-K, the following adjustments were made to average total compensation for the Non-PEO NEOs for each year:

Year


Summary
Compensation
Table Total
for Non-PEO
NEOs


Reported
Value of
Equity
Awards for
Non-PEO
NEOs


Fair Value
as of
Year-End
for
Awards
Granted
During
the Year


Fair Value
Year-over-Year
Increase or
Decrease in
Unvested Awards
Granted in
Prior Years


Fair Value
of Awards
Granted
and Vested
During the
Year


Fair Value
Increase or
Decrease
from Prior
Year End
for Awards
that Vested
During the
Year


Average
Compensation
Actually Paid
to Non-PEO
NEOs

2025


$

389,000


$

(1,112

)


$


$

(3,260

)


$

384,628

2024


$

285,000


$

(15,228

)


$

3,260


$

(22,573

)


$

250,459

2023


$

290,000


$

16,341


$

25,833


$

22,286


$

354,460

(5)      TSR is cumulative for the measurement periods beginning on December 31, 2022 and ending on December 31 of each of 2025, 2024 and 2023, respectively, calculated by dividing the difference between our share price at the end and the beginning of the measurement period by our share price at the end of the measurement period. No dividends were paid in 2025, 2024 or 2023.

(6)      The dollar amounts reported represent the amount of net loss reflected in our consolidated audited financial statements for the applicable years.

   
PEO Total Compensation Amount [1] $ 499,000 $ 400,000 $ 400,000
PEO Actually Paid Compensation Amount [2] $ 499,000 356,170 305,875
Adjustment To PEO Compensation, Footnote Represents the amount of “compensation actually paid” to our PEO, as computed in accordance with Item 402(v) of Regulation S-K, with the following adjustments:

Year


Summary
Compensation
Table Total for
Ronald
Glibbery


Reported
Value of
Equity
Awards
for Ronald
Glibbery


Fair Value
as of
Year-End
for
Awards
Granted
During
the Year


Fair Value
Year-over-Year
increase or
decrease in
Unvested
Awards
Granted in
Prior Years


Fair Value
of Awards
Granted
and Vested
During the
Year


Fair Value
Increase or
Decrease
from Prior
Year End
for Awards
that Vested
During the
Year


Compensation
Actually Paid
to Ronald
Glibbery

2025


$

499,000


$


$


$


$

499,000

2024


$

400,000


$

(18,670

)


$

2,177


$

(27,337

)


$

356,170

2023


$

400,000


$

(78,663

)


$

29,514


$

(44,976

)


$

305,875

   
Non-PEO NEO Average Total Compensation Amount [3] $ 389,000 285,000 290,000
Non-PEO NEO Average Compensation Actually Paid Amount [4] $ 384,628 250,459 354,460
Adjustment to Non-PEO NEO Compensation Footnote Represents the average amount of “compensation actually paid” to the Non-PEO NEOs, as computed in accordance with Item 402(v) of Regulation S-K. The dollar amounts do not reflect the actual average compensation earned or paid to the Non-PEO NEOs during the applicable year. In accordance with the requirements of Item 402(v) of Regulation S-K, the following adjustments were made to average total compensation for the Non-PEO NEOs for each year:

Year


Summary
Compensation
Table Total
for Non-PEO
NEOs


Reported
Value of
Equity
Awards for
Non-PEO
NEOs


Fair Value
as of
Year-End
for
Awards
Granted
During
the Year


Fair Value
Year-over-Year
Increase or
Decrease in
Unvested Awards
Granted in
Prior Years


Fair Value
of Awards
Granted
and Vested
During the
Year


Fair Value
Increase or
Decrease
from Prior
Year End
for Awards
that Vested
During the
Year


Average
Compensation
Actually Paid
to Non-PEO
NEOs

2025


$

389,000


$

(1,112

)


$


$

(3,260

)


$

384,628

2024


$

285,000


$

(15,228

)


$

3,260


$

(22,573

)


$

250,459

2023


$

290,000


$

16,341


$

25,833


$

22,286


$

354,460

   
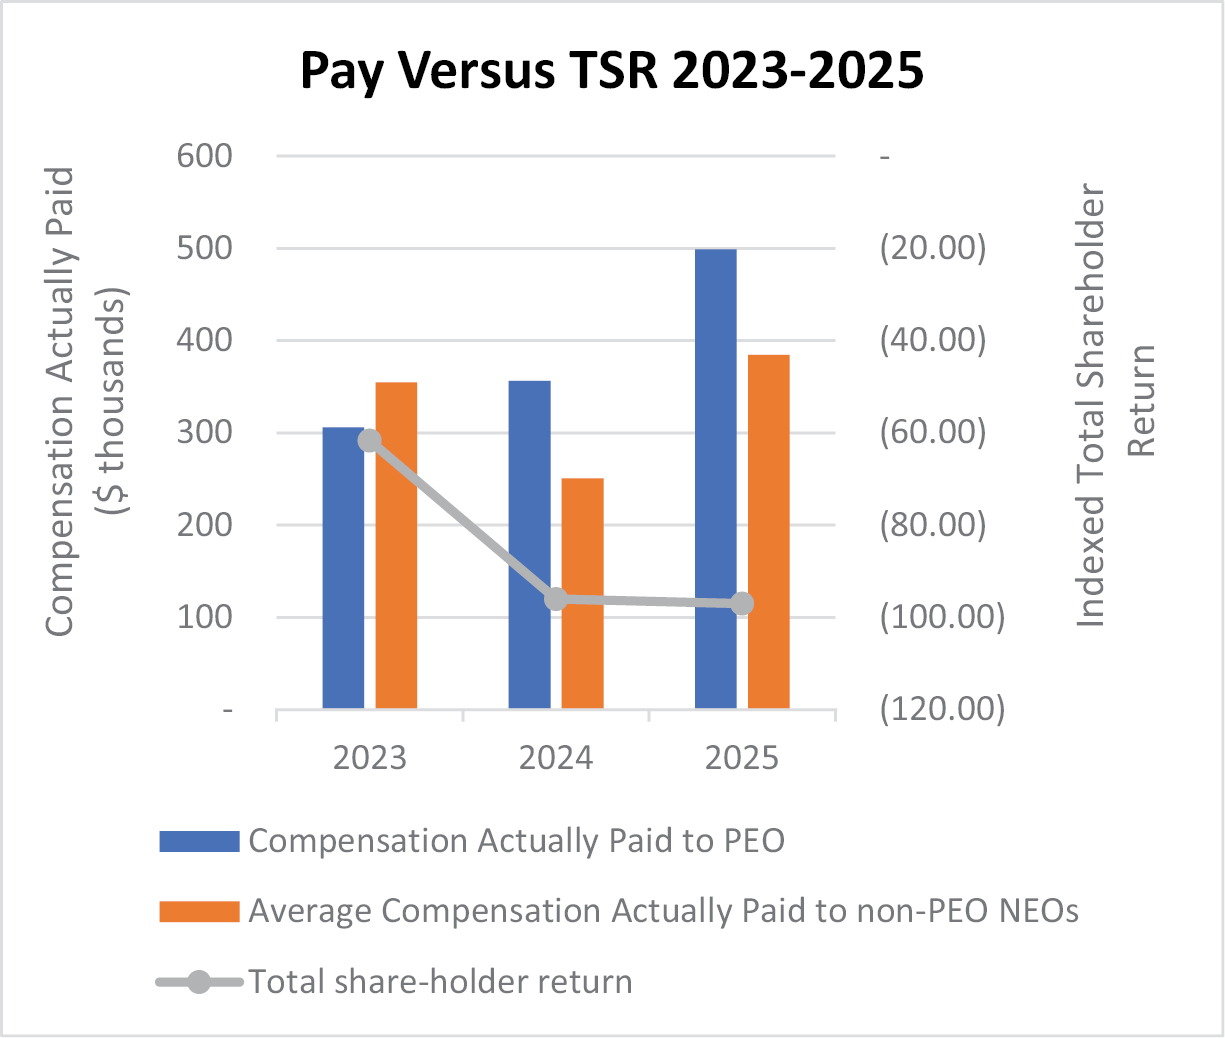
Compensation Actually Paid vs. Total Shareholder Return

   
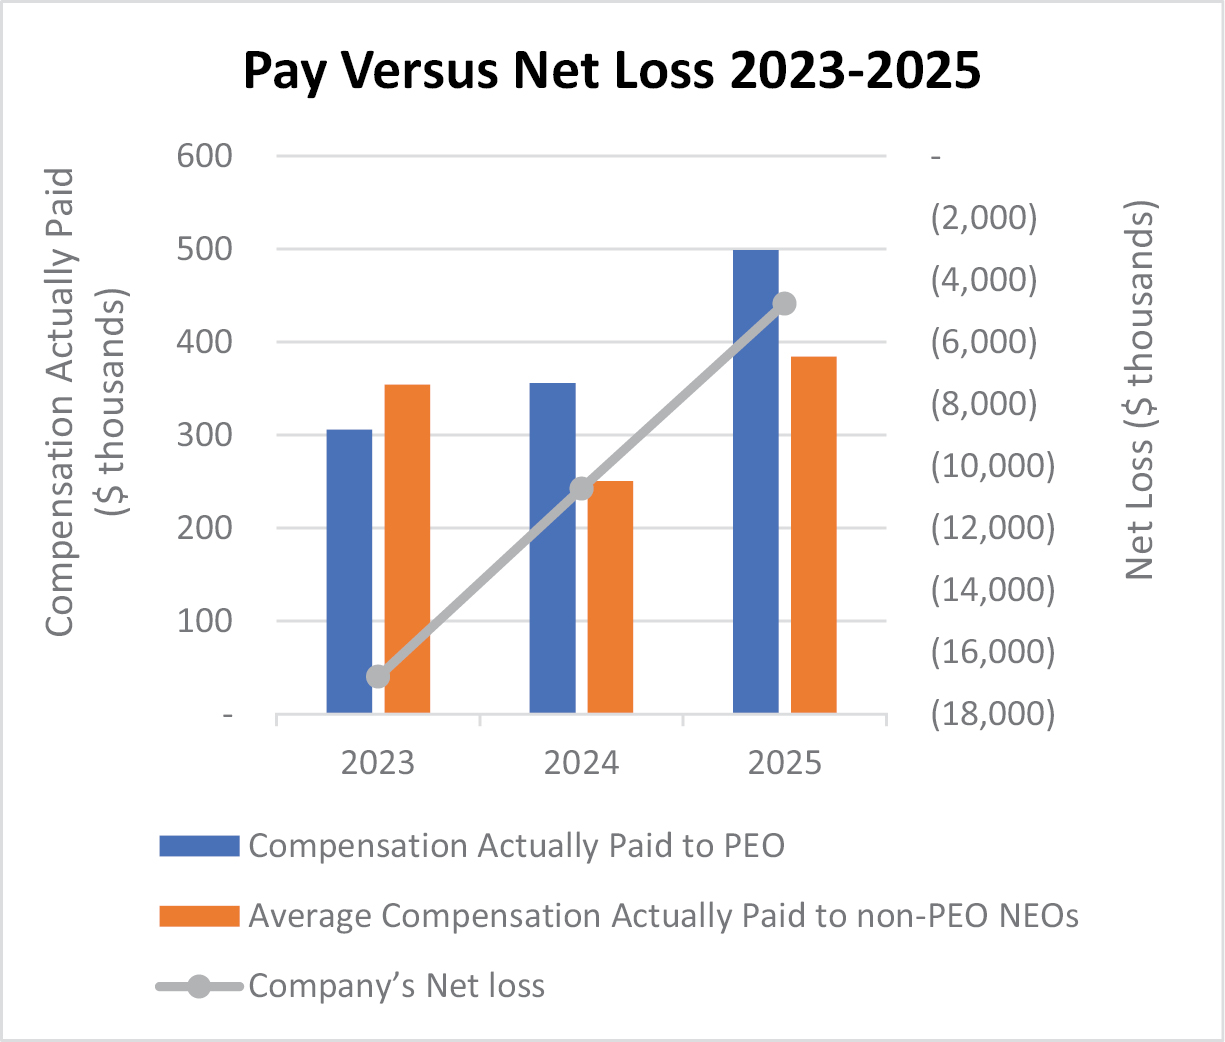
Compensation Actually Paid vs. Net Income

   
Total Shareholder Return Amount [5] $ (97.02) (96.03) (61.7)
Net Income (Loss) [6] $ (4,753) $ (10,728) $ (16,795)
PEO Name Ronald Glibbery Ronald Glibbery Ronald Glibbery
Reported Value of Equity Awards for Ronald Glibbery [Member]      
Pay vs Performance Disclosure      
Adjustment to Compensation, Amount
Non-PEO NEO | Fair Value as of Year-End for Awards Granted During the Year [Member]      
Pay vs Performance Disclosure      
Adjustment to Compensation, Amount
Non-PEO NEO | Fair Value Year-over-Year increase or decrease in Unvested Awards Granted in Prior Years [Member]      
Pay vs Performance Disclosure      
Adjustment to Compensation, Amount (1,112) (15,228) 16,341
Non-PEO NEO | Fair Value of Awards Granted and Vested During the Year [Member]      
Pay vs Performance Disclosure      
Adjustment to Compensation, Amount 3,260 25,833
Non-PEO NEO | Fair Value Increase or Decrease from Prior Year End for Awards that Vested During the Year [Member]      
Pay vs Performance Disclosure      
Adjustment to Compensation, Amount (3,260) (22,573) 22,286
Non-PEO NEO | Reported Value of Equity Awards for Non-PEO NEOs [Member]      
Pay vs Performance Disclosure      
Adjustment to Compensation, Amount
Ronald Glibbery [Member] | Fair Value as of Year-End for Awards Granted During the Year [Member]      
Pay vs Performance Disclosure      
Adjustment to Compensation, Amount
Ronald Glibbery [Member] | Fair Value Year-over-Year increase or decrease in Unvested Awards Granted in Prior Years [Member]      
Pay vs Performance Disclosure      
Adjustment to Compensation, Amount (18,670) (78,663)
Ronald Glibbery [Member] | Fair Value of Awards Granted and Vested During the Year [Member]      
Pay vs Performance Disclosure      
Adjustment to Compensation, Amount 2,177 29,514
Ronald Glibbery [Member] | Fair Value Increase or Decrease from Prior Year End for Awards that Vested During the Year [Member]      
Pay vs Performance Disclosure      
Adjustment to Compensation, Amount $ (27,337) $ (44,976)
[1] Represent the amounts of total compensation reported for our PEO, Ronald Glibbery, during each corresponding year in the “Total” column of the Summary Compensation Table below.
[2] Represents the amount of “compensation actually paid” to our PEO, as computed in accordance with Item 402(v) of Regulation S-K, with the following adjustments:

Year


Summary
Compensation
Table Total for
Ronald
Glibbery


Reported
Value of
Equity
Awards
for Ronald
Glibbery


Fair Value
as of
Year-End
for
Awards
Granted
During
the Year


Fair Value
Year-over-Year
increase or
decrease in
Unvested
Awards
Granted in
Prior Years


Fair Value
of Awards
Granted
and Vested
During the
Year


Fair Value
Increase or
Decrease
from Prior
Year End
for Awards
that Vested
During the
Year


Compensation
Actually Paid
to Ronald
Glibbery

2025


$

499,000


$


$


$


$

499,000

2024


$

400,000


$

(18,670

)


$

2,177


$

(27,337

)


$

356,170

2023


$

400,000


$

(78,663

)


$

29,514


$

(44,976

)


$

305,875

[3] Represents the average of the amounts reported for our NEOs as a group (excluding our PEO) in each applicable year in the “Total” column of the Summary Compensation Table below. For 2025, this consisted of James Sullivan and Bradley Lynch, for 2024, this consisted of James Sullivan, Bradley Lynch and Mark Lunsford, for 2023, this consisted of James Sullivan and Bradley Lynch (the “Non-PEO NEOs”).
[4] Represents the average amount of “compensation actually paid” to the Non-PEO NEOs, as computed in accordance with Item 402(v) of Regulation S-K. The dollar amounts do not reflect the actual average compensation earned or paid to the Non-PEO NEOs during the applicable year. In accordance with the requirements of Item 402(v) of Regulation S-K, the following adjustments were made to average total compensation for the Non-PEO NEOs for each year:

Year


Summary
Compensation
Table Total
for Non-PEO
NEOs


Reported
Value of
Equity
Awards for
Non-PEO
NEOs


Fair Value
as of
Year-End
for
Awards
Granted
During
the Year


Fair Value
Year-over-Year
Increase or
Decrease in
Unvested Awards
Granted in
Prior Years


Fair Value
of Awards
Granted
and Vested
During the
Year


Fair Value
Increase or
Decrease
from Prior
Year End
for Awards
that Vested
During the
Year


Average
Compensation
Actually Paid
to Non-PEO
NEOs

2025


$

389,000


$

(1,112

)


$


$

(3,260

)


$

384,628

2024


$

285,000


$

(15,228

)


$

3,260


$

(22,573

)


$

250,459

2023


$

290,000


$

16,341


$

25,833


$

22,286


$

354,460

[5] TSR is cumulative for the measurement periods beginning on December 31, 2022 and ending on December 31 of each of 2025, 2024 and 2023, respectively, calculated by dividing the difference between our share price at the end and the beginning of the measurement period by our share price at the end of the measurement period. No dividends were paid in 2025, 2024 or 2023.
[6] The dollar amounts reported represent the amount of net loss reflected in our consolidated audited financial statements for the applicable years.