Performance Management - Optimum Fund Trust Classes A, C, Institutional
Mar. 31, 2026
The bar chart and table below provide some indication of the risks of investing in the Fund. The bar chart shows changes in the Fund’s performance from year to year and the table shows how the Fund’s average annual total returns for the 1-, 5-, and 10-year periods compare with those of a broad measure of market performance and an additional index with characteristics relevant to the Fund. The Fund’s past performance (before and after taxes) is not necessarily an indication of how the Fund will perform in the future. The returns reflect any expense caps in effect during these periods.
The returns would be lower without the expense caps. Applicable sales charges are reflected in the average annual return table below. You may obtain the Fund’s most recently available month-end performance by calling 800 914-0278 or by visiting our website at optimummutualfunds.com/performance.
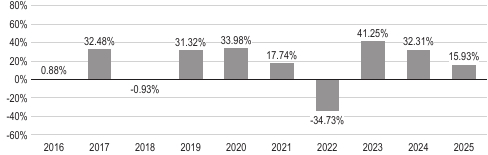
As of June 30, 2026, the Fund’s Institutional Class shares had a calendar year-to-date return of 6.19%. During the periods illustrated in this bar chart, the Institutional Class’s highest quarterly return was 26.94% for the quarter ended June 30, 2020, and its lowest quarterly return was -24.17% for the quarter ended June 30, 2022.
|
|
1 year
|
5 years
|
10 years
|
|
Institutional Class return before taxes..........................................
|
15.93%
|
10.73%
|
14.52%
|
|
Institutional Class return after taxes on distributions................................
|
12.28%
|
8.05%
|
11.97%
|
|
Institutional Class return after taxes on distributions and sale of Fund shares..............
|
11.59%
|
7.93%
|
11.33%
|
|
Class A return before taxes..................................................
|
9.03%
|
9.16%
|
13.56%
|
|
Class C return before taxes.................................................
|
13.92%
|
9.62%
|
13.37%
|
|
Russell 1000 Index (reflects no deduction for fees, expenses, or taxes)..................
|
17.37%
|
13.59%
|
14.59%
|
|
Russell 1000 Growth Index (reflects no deduction for fees, expenses, or taxes)............
|
18.56%
|
15.32%
|
18.13%
|
After-tax performance is presented only for Institutional Class shares of the Fund. The after-tax returns for other Fund classes may vary. Actual after-tax returns depend on the investor’s individual tax situation and may differ from the returns shown. After-tax returns are not relevant for shares held in tax-advantaged investment vehicles such as employer-sponsored 401(k) plans and individual retirement accounts (IRAs). The after-tax returns shown are calculated using the highest individual federal marginal income tax rates in effect during the periods presented and do not reflect the impact of state and local taxes.
The bar chart and table below provide some indication of the risks of investing in the Fund. The bar chart shows changes in the Fund’s performance from year to year and the table shows how the Fund’s average annual total returns for the 1-, 5-, and 10-year periods compare with those of a broad measure of market performance and an additional index with characteristics relevant to the Fund. The Fund’s past performance (before and after taxes) is not necessarily an indication of how the Fund will perform in the future. The returns reflect any expense caps in effect during these periods. The returns would be lower without the expense caps. Applicable sales charges are reflected in the average annual return table below. You may obtain the Fund’s most recently available month-end performance by calling 800 914-0278 or by visiting our website at optimummutualfunds.com/performance.
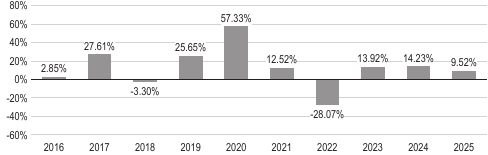
As of June 30, 2026, the Fund’s Institutional Class shares had a calendar year-to-date return of 20.90%. During the periods illustrated in this bar chart, the Institutional Class’s highest quarterly return was 36.53% for the quarter ended June 30, 2020, and its lowest quarterly return was -21.65% for the quarter ended December 31, 2018.
|
|
1 year
|
5 years
|
10 years
|
|
Institutional Class return before taxes..........................................
|
9.52%
|
2.89%
|
11.21%
|
|
Institutional Class return after taxes on distributions................................
|
8.86%
|
0.78%
|
8.73%
|
|
Institutional Class return after taxes on distributions and sale of Fund shares..............
|
6.13%
|
1.78%
|
8.51%
|
|
Class A return before taxes..................................................
|
2.91%
|
1.43%
|
10.27%
|
|
Class C return before taxes.................................................
|
7.41%
|
1.88%
|
10.10%
|
|
Russell 3000 Index (reflects no deduction for fees, expenses, or taxes)..................
|
17.15%
|
13.15%
|
14.29%
|
|
Russell 2500 Growth Index (reflects no deduction for fees, expenses, or taxes)............
|
10.31%
|
2.98%
|
10.55%
|
After-tax performance is presented only for Institutional Class shares of the Fund. The after-tax returns for other Fund classes may vary. Actual after-tax returns depend on the investor’s individual tax situation and may differ from the returns shown. After-tax returns are not relevant for shares held in tax-advantaged investment vehicles such as employer-sponsored 401(k) plans and individual retirement accounts (IRAs). The after-tax returns shown are calculated using the highest individual federal marginal income tax rates in effect during the periods presented and do not reflect the impact of state and local taxes.
The bar chart and table below provide some indication of the risks of investing in the Fund. The bar chart shows changes in the Fund’s performance from year to year and the table shows how the Fund’s average annual total returns for the 1-, 5-, and 10-year periods compare with those of a broad measure of market performance and an additional index with characteristics relevant to the Fund. The Fund’s past performance (before and after taxes) is not necessarily an indication of how the Fund will perform in the future. The returns reflect any expense caps in effect during these periods. The returns would be lower without the expense caps. Applicable sales charges are reflected in the average annual return table below. You may obtain the Fund’s most recently available month-end performance by calling 800 914-0278 or by visiting our website at optimummutualfunds.com/performance.
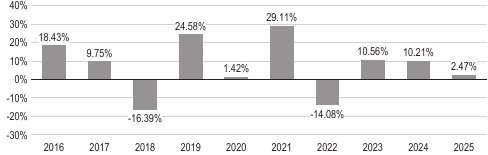
As of June 30, 2026, the Fund’s Institutional Class shares had a calendar year-to-date return of 19.47%. During the periods illustrated in this bar chart, the Institutional Class’s highest quarterly return was 26.62% for the quarter ended December 31, 2020, and its lowest quarterly return was -35.83% for the quarter ended March 31, 2020.
|
|
1 year
|
5 years
|
10 years
|
|
Institutional Class return before taxes..........................................
|
2.47%
|
6.73%
|
6.64%
|
|
Institutional Class return after taxes on distributions................................
|
0.38%
|
4.98%
|
5.24%
|
|
Institutional Class return after taxes on distributions and sale of Fund shares..............
|
1.94%
|
4.93%
|
5.04%
|
|
Class A return before taxes..................................................
|
-3.56%
|
5.22%
|
5.75%
|
|
Class C return before taxes.................................................
|
0.58%
|
5.66%
|
5.57%
|
|
Russell 3000 Index (reflects no deduction for fees, expenses, or taxes)..................
|
17.15%
|
13.15%
|
14.29%
|
|
Russell 2500 Value Index (reflects no deduction for fees, expenses, or taxes)..............
|
12.73%
|
10.02%
|
9.72%
|
After-tax performance is presented only for Institutional Class shares of the Fund. The after-tax returns for other Fund classes may vary. Actual after-tax returns depend on the investor’s individual tax situation and may differ from the returns shown. After-tax returns are not relevant for shares held in tax-advantaged investment vehicles such as employer-sponsored 401(k) plans and individual retirement accounts (IRAs). The after-tax returns shown are calculated using the highest individual federal marginal income tax rates in effect during the periods presented and do not reflect the impact of state and local taxes.
The bar chart and table below provide some indication of the risks of investing in the Fund. The bar chart shows changes in the Fund’s performance from year to year and the table shows how the Fund’s average annual total returns for the 1-, 5-, and 10-year periods compare with those of a broad measure of market performance. The Fund’s past performance (before and after taxes) is not necessarily an indication of how the Fund will perform in the future. The returns reflect any expense caps in effect during these periods. The returns would be lower without the expense caps. Applicable sales charges are reflected in the average annual return table below. You may obtain the Fund’s most recently available month-end performance by calling 800 914-0278 or by visiting our website at optimummutualfunds.com/performance.
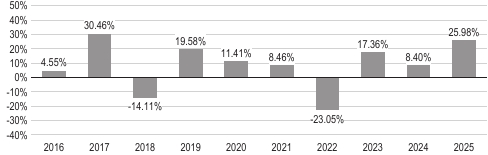
As of June 30, 2026, the Fund’s Institutional Class shares had a calendar year-to-date return of 15.56%. During the periods illustrated in this bar chart, the Institutional Class’s highest quarterly return was 23.13% for the quarter ended December 31, 2020, and its lowest quarterly return was -25.58% for the quarter ended March 31, 2020.
|
|
1 year
|
5 years
|
10 years
|
|
Institutional Class return before taxes..........................................
|
25.98%
|
5.99%
|
7.64%
|
|
Institutional Class return after taxes on distributions................................
|
25.26%
|
4.93%
|
6.77%
|
|
Institutional Class return after taxes on distributions and sale of Fund shares..............
|
15.37%
|
4.50%
|
6.06%
|
|
Class A return before taxes..................................................
|
18.32%
|
4.47%
|
6.72%
|
|
Class C return before taxes.................................................
|
23.66%
|
4.91%
|
6.56%
|
|
MSCI ACWI (All Country World Index) ex USA Index (net) (reflects no deduction for fees or
expenses but reflects the deduction of foreign withholding taxes on dividends)............ |
22.34%
|
11.19%
|
11.72%
|
|
MSCI ACWI (All Country World Index) ex USA Index (gross) (reflects no deduction for fees,
expenses, or foreign withholding taxes on dividends).............................. |
22.87%
|
11.70%
|
12.28%
|
After-tax performance is presented only for Institutional Class shares of the Fund. The after-tax returns for other Fund classes may vary. Actual after-tax returns depend on the investor’s individual tax situation and may differ from the returns shown. After-tax returns are not relevant for shares held in tax-advantaged investment vehicles such as employer-sponsored 401(k) plans and individual retirement accounts (IRAs). The after-tax returns shown are calculated using the highest individual federal marginal income tax rates in effect during the periods presented and do not reflect the impact of state and local taxes.
The bar chart and table below provide some indication of the risks of investing in the Fund. The bar chart shows changes in the Fund’s performance from year to year and the table shows how the Fund’s average annual total returns for the 1-, 5-, and 10-year periods compare with those of a broad measure of market performance. The Fund’s past performance (before and after taxes) is not necessarily an indication of how the Fund will perform in the future. The returns reflect any expense caps in effect during these periods. The returns would be lower without the expense caps. Applicable sales charges are reflected in the average annual return table below. You may obtain the Fund’s most recently available month-end performance by calling 800 914-0278 or by visiting our website at optimummutualfunds.com/performance.
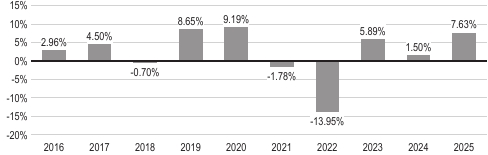
As of June 30, 2026, the Fund’s Institutional Class shares had a calendar year-to-date return of 0.60%. During the periods illustrated in this bar chart, the Institutional Class’s highest quarterly return was 7.10% for the quarter ended December 31, 2023, and its lowest quarterly return was -6.20% for the quarter ended June 30, 2022.
|
|
1 year
|
5 years
|
10 years
|
|
Institutional Class return before taxes..........................................
|
7.63%
|
-0.45%
|
2.17%
|
|
Institutional Class return after taxes on distributions................................
|
6.00%
|
-1.75%
|
0.87%
|
|
Institutional Class return after taxes on distributions and sale of Fund shares..............
|
4.52%
|
-0.89%
|
1.11%
|
|
Class A return before taxes..................................................
|
2.45%
|
-1.61%
|
1.45%
|
|
Class C return before taxes.................................................
|
5.47%
|
-1.46%
|
1.15%
|
|
Bloomberg US Aggregate Index (reflects no deduction for fees, expenses, or taxes).........
|
7.30%
|
-0.36%
|
2.01%
|
After-tax performance is presented only for Institutional Class shares of the Fund. The after-tax returns for other Fund classes may vary. Actual after-tax returns depend on the investor’s individual tax situation and may differ from the returns shown. After-tax returns are not relevant for shares held in tax-advantaged investment vehicles such as employer-sponsored 401(k) plans and individual retirement accounts (IRAs). The after-tax returns shown are calculated using the highest individual federal marginal income tax rates in effect during the periods presented and do not reflect the impact of state and local taxes.
The bar chart and table below provide some indication of the risks of investing in the Fund. The bar chart shows changes in the Fund’s performance from year to year and the table shows how the Fund’s average annual total returns for the 1-, 5-, and 10-year periods compare with those of a broad measure of market performance and an additional index with characteristics relevant to the Fund. The Fund’s past performance (before and after taxes) is not necessarily an indication of how the Fund will perform in the future. The returns reflect any expense caps in effect during these periods. The returns would be lower without the expense caps. Applicable sales charges are reflected in the average annual return table below. You may obtain the Fund’s most recently available month-end performance by calling 800 914-0278 or by visiting our website at optimummutualfunds.com/performance.
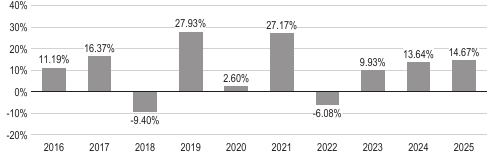
As of June 30, 2026, the Fund’s Institutional Class shares had a calendar year-to-date return of 8.57%. During the periods illustrated in this bar chart, the Institutional Class’s highest quarterly return was 13.66% for the quarter ended June 30, 2020, and its lowest quarterly return was -24.93% for the quarter ended March 31, 2020.
|
|
1 year
|
5 years
|
10 years
|
|
Institutional Class return before taxes..........................................
|
14.67%
|
11.34%
|
10.17%
|
|
Institutional Class return after taxes on distributions................................
|
12.42%
|
9.07%
|
8.38%
|
|
Institutional Class return after taxes on distributions and sale of Fund shares..............
|
9.81%
|
8.63%
|
7.90%
|
|
Class A return before taxes..................................................
|
7.90%
|
9.75%
|
9.24%
|
|
Class C return before taxes.................................................
|
12.61%
|
10.22%
|
9.07%
|
|
Russell 1000 Index (reflects no deduction for fees, expenses, or taxes)..................
|
17.37%
|
13.59%
|
14.59%
|
|
Russell 1000 Value Index (reflects no deduction for fees, expenses, or taxes)..............
|
15.91%
|
11.33%
|
10.53%
|
After-tax performance is presented only for Institutional Class shares of the Fund. The after-tax returns for other Fund classes may vary. Actual after-tax returns depend on the investor’s individual tax situation and may differ from the returns shown. After-tax returns are not relevant for shares held in tax-advantaged investment vehicles such as employer-sponsored 401(k) plans and individual retirement accounts (IRAs). The after-tax returns shown are calculated using the highest individual federal marginal income tax rates in effect during the periods presented and do not reflect the impact of state and local taxes.