Second Quarter 2026 Earnings Call July 29, 2026
Forward-Looking Statements Certain statements contained in this presentation constitute forward-looking statements within the meaning of the Private Securities Litigation Reform Act of 1995. This presentation contains “forward-looking statements” with respect to our business, results of operations and financial condition, including, among others, statements regarding anticipated macroeconomic, end-market and industry environments, our areas of execution focus, and earnings guidance. You can identify forward-looking statements because they contain words such as, but not limited to, “anticipates,” “approximately,” “believes,” “continue,” “could,” “estimates,” “expects,” “intends,” “likely,” “may,” “plans,” “should,” “targets,” “will,” “would,” and similar expressions (or the negative of these terminologies or expressions). All forward-looking statements involve risks and uncertainties and are based on underlying assumptions that may prove incorrect. Many risks and uncertainties are inherent in our industry and markets, while others are more specific to our business and operations. These risks and uncertainties include, but are not limited to: market competition; global or regional economic downturns or industry specific conditions, including the impacts of tax and tariff programs, inflation, foreign currency exchange, and industry consolidation; disruption to business operations; natural disasters including severe flooding and other weather-related events; geopolitical tensions and conflicts, including the ongoing conflict between Russia and Ukraine and the ongoing conflict involving the United States, Israel and Iran; the inability to meet customer demand and quality requirements; the loss of key customers, suppliers or other business relationships; supply disruptions; excessive inflation; the capacity and effectiveness of our hedging policy activities; the loss of key employees; levels of indebtedness which could limit our operating flexibility and opportunities; and other risk factors set forth under the heading “Risk Factors” in our Annual Report on Form 10-K, and as described from time to time in subsequent reports filed with the U.S. Securities and Exchange Commission. The occurrence of the events described and the achievement of the expected results depend on many events, some or all of which are not predictable or within our control. Consequently, actual results may differ materially from the forward-looking statements contained in this presentation. We undertake no obligation to update or revise any forward-looking statement as a result of new information, future events or otherwise, except as required by law. Second Quarter 2026 - Earnings Call - 2
Non-GAAP Measures This presentation includes information regarding certain non-GAAP financial measures, including Adjusted EBITDA, Free Cash Flow and Net debt. These measures are presented because management uses this information to monitor and evaluate financial results and trends and believes this information to also be useful for investors. Adjusted EBITDA measures are frequently used by securities analysts, investors and other interested parties in their evaluation of Constellium. Adjusted EBITDA, Free Cash Flow and Net debt are not presentations made in accordance with U.S. GAAP and may not be comparable to similarly titled measures of other companies. These non-GAAP financial measures supplement our GAAP disclosures and should not be considered an alternative to the GAAP measures. This presentation provides a reconciliation of non-GAAP financial measures to the most directly comparable GAAP financial measures. For the definitions of Adjusted EBITDA, Free Cash Flow and Net debt, please refer to our accompanying press release. We are not able to provide a reconciliation of Adjusted EBITDA guidance to net income, the comparable GAAP measure, because certain items that are excluded from Adjusted EBITDA cannot be reasonably predicted or are not in our control. In particular, we are unable to forecast the timing or magnitude of realized and unrealized gains and losses on derivative instruments, metal price lag, impairment or restructuring charges, or taxes without unreasonable efforts, and these items could significantly impact, either individually or in the aggregate, our net income in the future. Second Quarter 2026 - Earnings Call - 3

Ingrid Joerg Chief Executive Officer
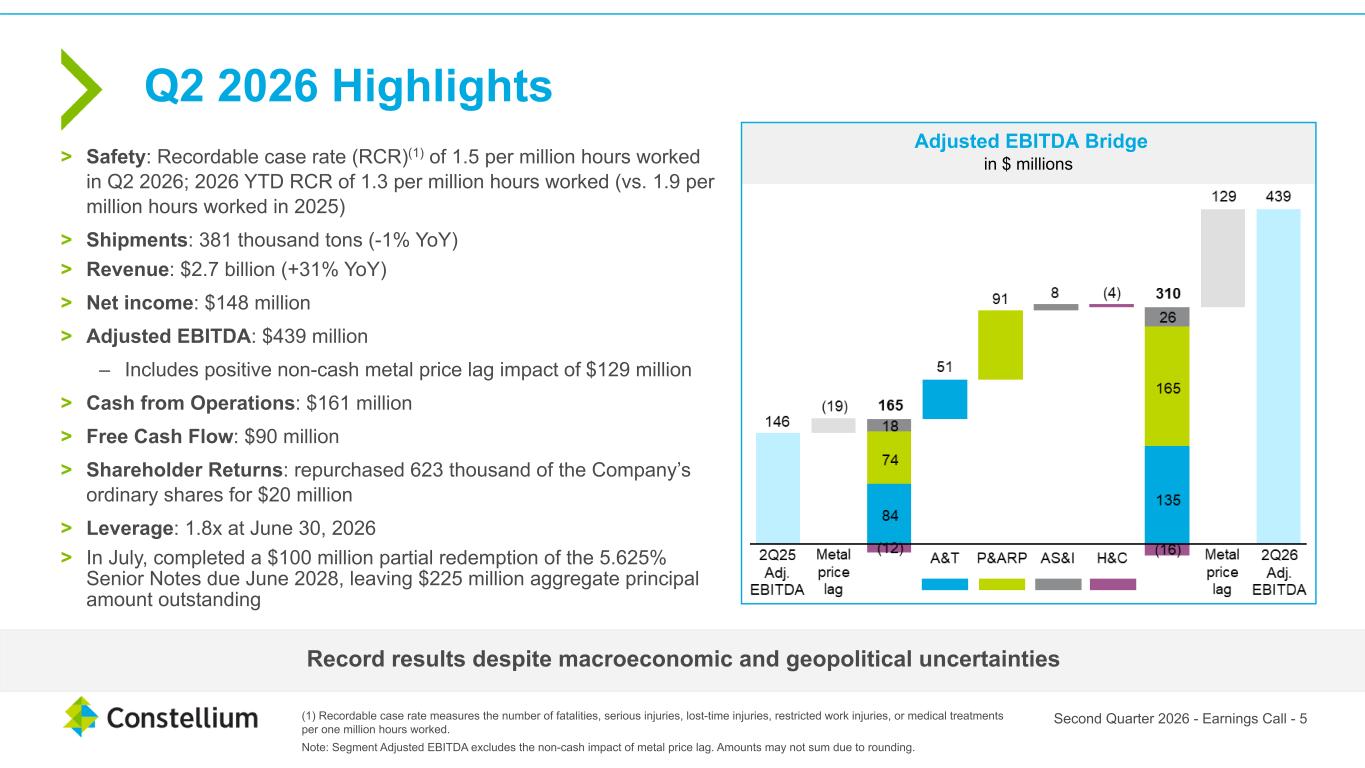
Q2 2026 Highlights > Safety: Recordable case rate (RCR)(1) of 1.5 per million hours worked in Q2 2026; 2026 YTD RCR of 1.3 per million hours worked (vs. 1.9 per million hours worked in 2025) > Shipments: 381 thousand tons (-1% YoY) > Revenue: $2.7 billion (+31% YoY) > Net income: $148 million > Adjusted EBITDA: $439 million – Includes positive non-cash metal price lag impact of $129 million > Cash from Operations: $161 million > Free Cash Flow: $90 million > Shareholder Returns: repurchased 623 thousand of the Company’s ordinary shares for $20 million > Leverage: 1.8x at June 30, 2026 > In July, completed a $100 million partial redemption of the 5.625% Senior Notes due June 2028, leaving $225 million aggregate principal amount outstanding (1) Recordable case rate measures the number of fatalities, serious injuries, lost-time injuries, restricted work injuries, or medical treatments per one million hours worked. Note: Segment Adjusted EBITDA excludes the non-cash impact of metal price lag. Amounts may not sum due to rounding. Record results despite macroeconomic and geopolitical uncertainties Second Quarter 2026 - Earnings Call - 5 Adjusted EBITDA Bridge in $ millions

Jack Guo Chief Financial Officer
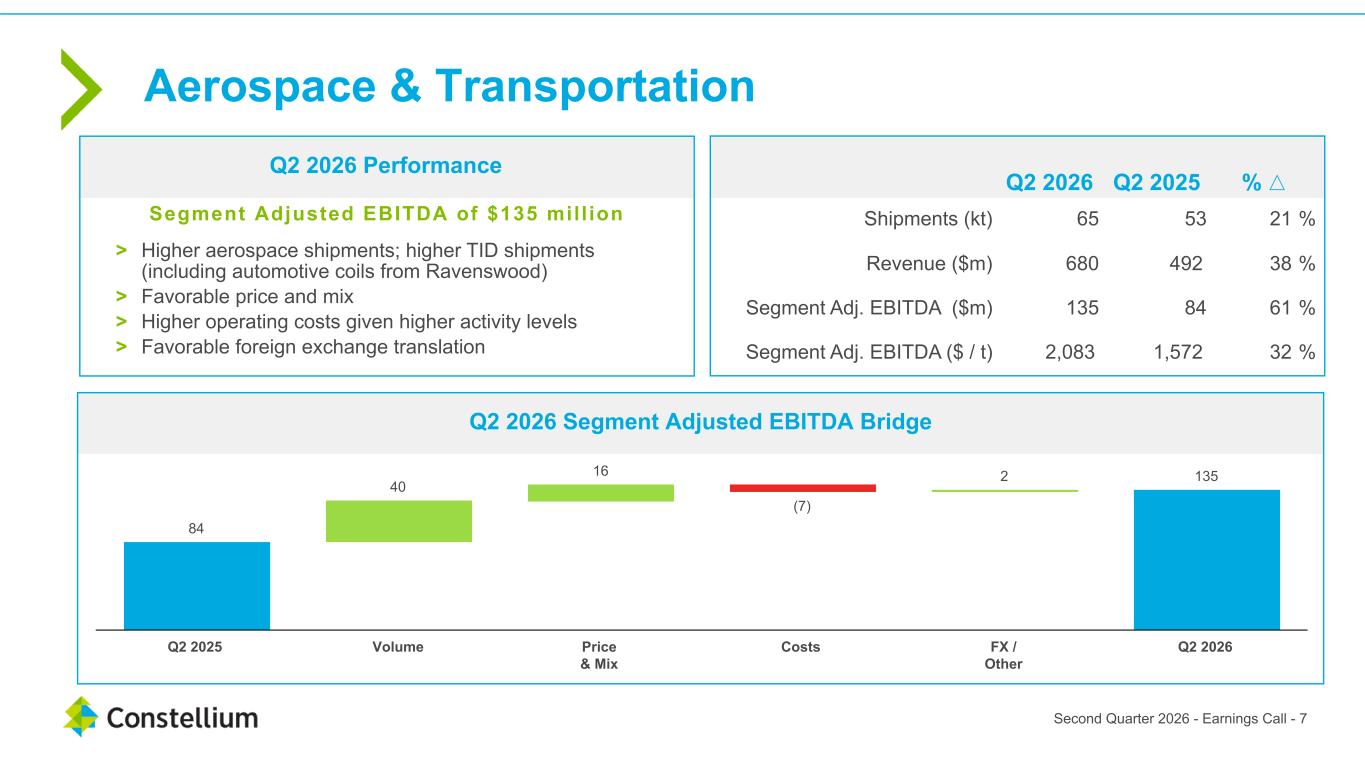
84 40 16 (7) 2 135 Q2 2025 Volume Price & Mix Costs FX / Other Q2 2026 Q2 2026 Q2 2025 % △ Shipments (kt) 65 53 21 % Revenue ($m) 680 492 38 % Segment Adj. EBITDA ($m) 135 84 61 % Segment Adj. EBITDA ($ / t) 2,083 1,572 32 % Aerospace & Transportation Q2 2026 Segment Adjusted EBITDA Bridge Q2 2026 Performance Second Quarter 2026 - Earnings Call - 7 Segment Adjusted EBITDA of $135 mil l ion > Higher aerospace shipments; higher TID shipments (including automotive coils from Ravenswood) > Favorable price and mix > Higher operating costs given higher activity levels > Favorable foreign exchange translation
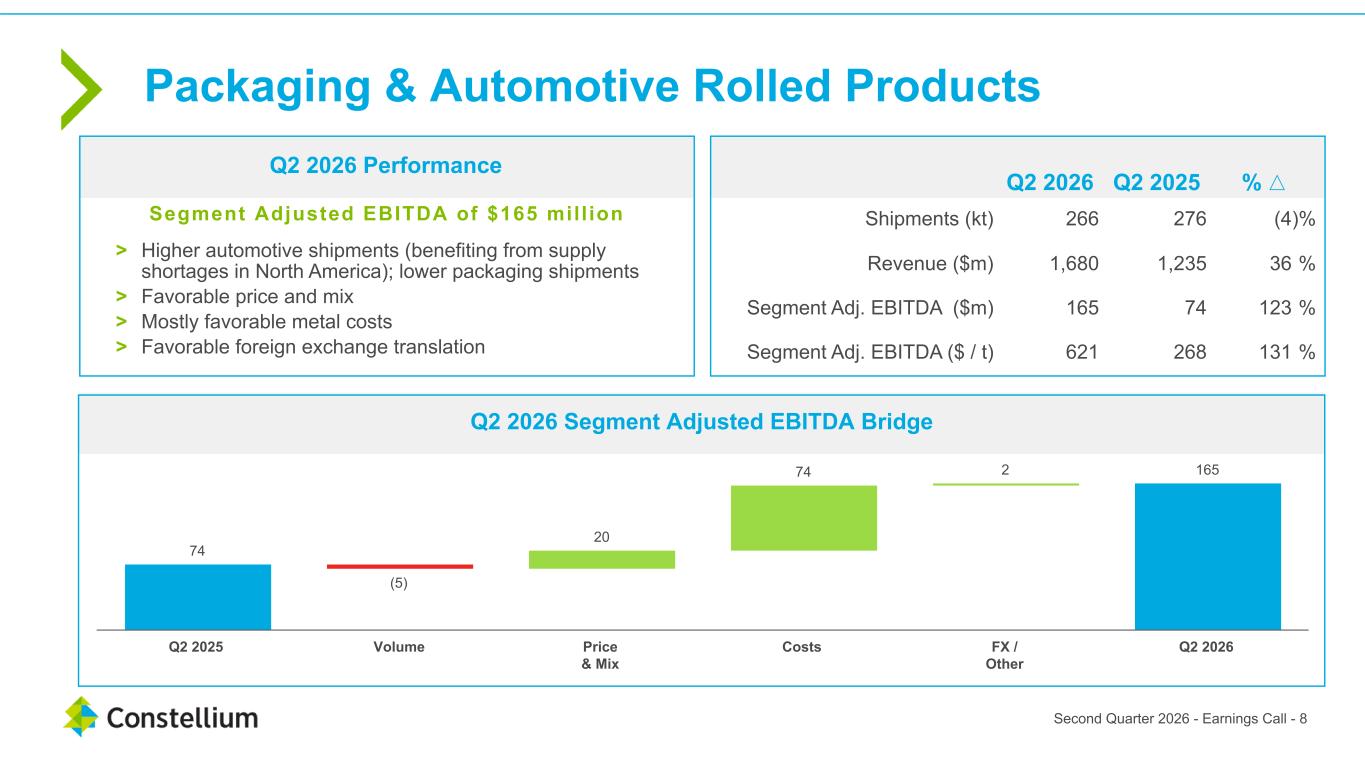
74 (5) 20 74 2 165 Q2 2025 Volume Price & Mix Costs FX / Other Q2 2026 Q2 2026 Q2 2025 % △ Shipments (kt) 266 276 (4) % Revenue ($m) 1,680 1,235 36 % Segment Adj. EBITDA ($m) 165 74 123 % Segment Adj. EBITDA ($ / t) 621 268 131 % Packaging & Automotive Rolled Products Q2 2026 Segment Adjusted EBITDA Bridge Q2 2026 Performance Second Quarter 2026 - Earnings Call - 8 Segment Adjusted EBITDA of $165 mil l ion > Higher automotive shipments (benefiting from supply shortages in North America); lower packaging shipments > Favorable price and mix > Mostly favorable metal costs > Favorable foreign exchange translation
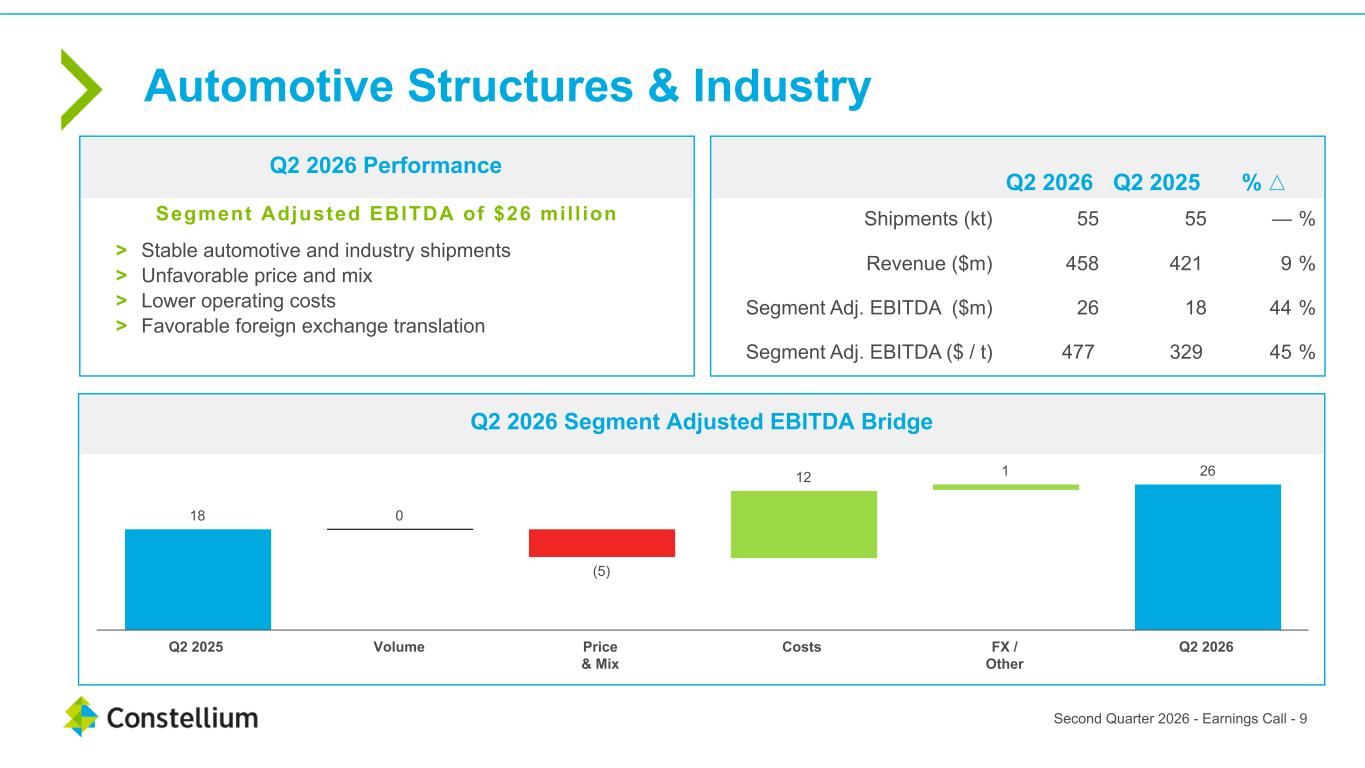
18 0 (5) 12 1 26 Q2 2025 Volume Price & Mix Costs FX / Other Q2 2026 Q2 2026 Q2 2025 % △ Shipments (kt) 55 55 — % Revenue ($m) 458 421 9 % Segment Adj. EBITDA ($m) 26 18 44 % Segment Adj. EBITDA ($ / t) 477 329 45 % Automotive Structures & Industry Q2 2026 Segment Adjusted EBITDA Bridge Q2 2026 Performance Second Quarter 2026 - Earnings Call - 9 Segment Adjusted EBITDA of $26 mil l ion > Stable automotive and industry shipments > Unfavorable price and mix > Lower operating costs > Favorable foreign exchange translation
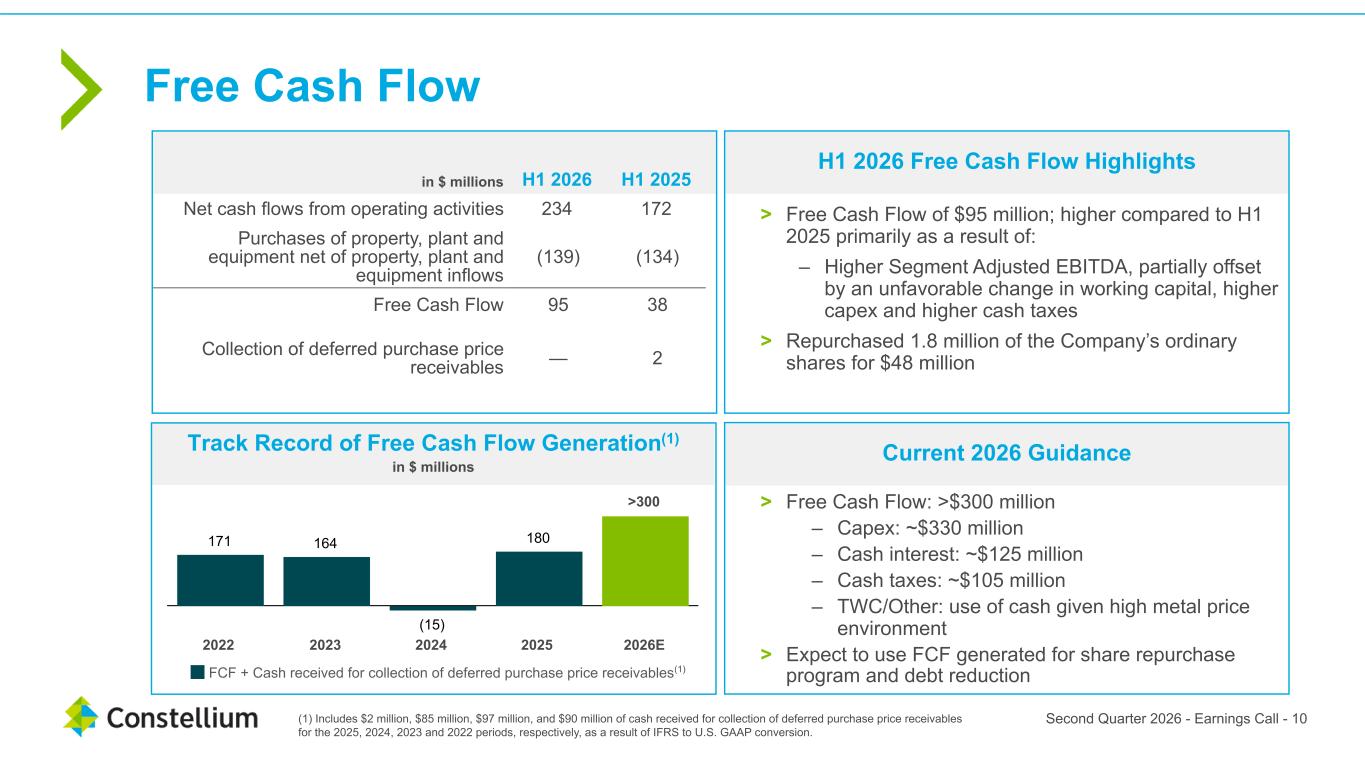
171 164 (15) 180 FCF + Cash received for collection of deferred purchase price receivables 2022 2023 2024 2025 2026E > Free Cash Flow of $95 million; higher compared to H1 2025 primarily as a result of: – Higher Segment Adjusted EBITDA, partially offset by an unfavorable change in working capital, higher capex and higher cash taxes > Repurchased 1.8 million of the Company’s ordinary shares for $48 million > Free Cash Flow: >$300 million – Capex: ~$330 million – Cash interest: ~$125 million – Cash taxes: ~$105 million – TWC/Other: use of cash given high metal price environment > Expect to use FCF generated for share repurchase program and debt reduction in $ millions H1 2026 H1 2025 Net cash flows from operating activities 234 172 Purchases of property, plant and equipment net of property, plant and equipment inflows (139) (134) Free Cash Flow 95 38 Collection of deferred purchase price receivables — 2 Track Record of Free Cash Flow Generation(1) in $ millions H1 2026 Free Cash Flow Highlights Current 2026 Guidance Second Quarter 2026 - Earnings Call - 10(1) Includes $2 million, $85 million, $97 million, and $90 million of cash received for collection of deferred purchase price receivables for the 2025, 2024, 2023 and 2022 periods, respectively, as a result of IFRS to U.S. GAAP conversion. >300 Free Cash Flow (1)
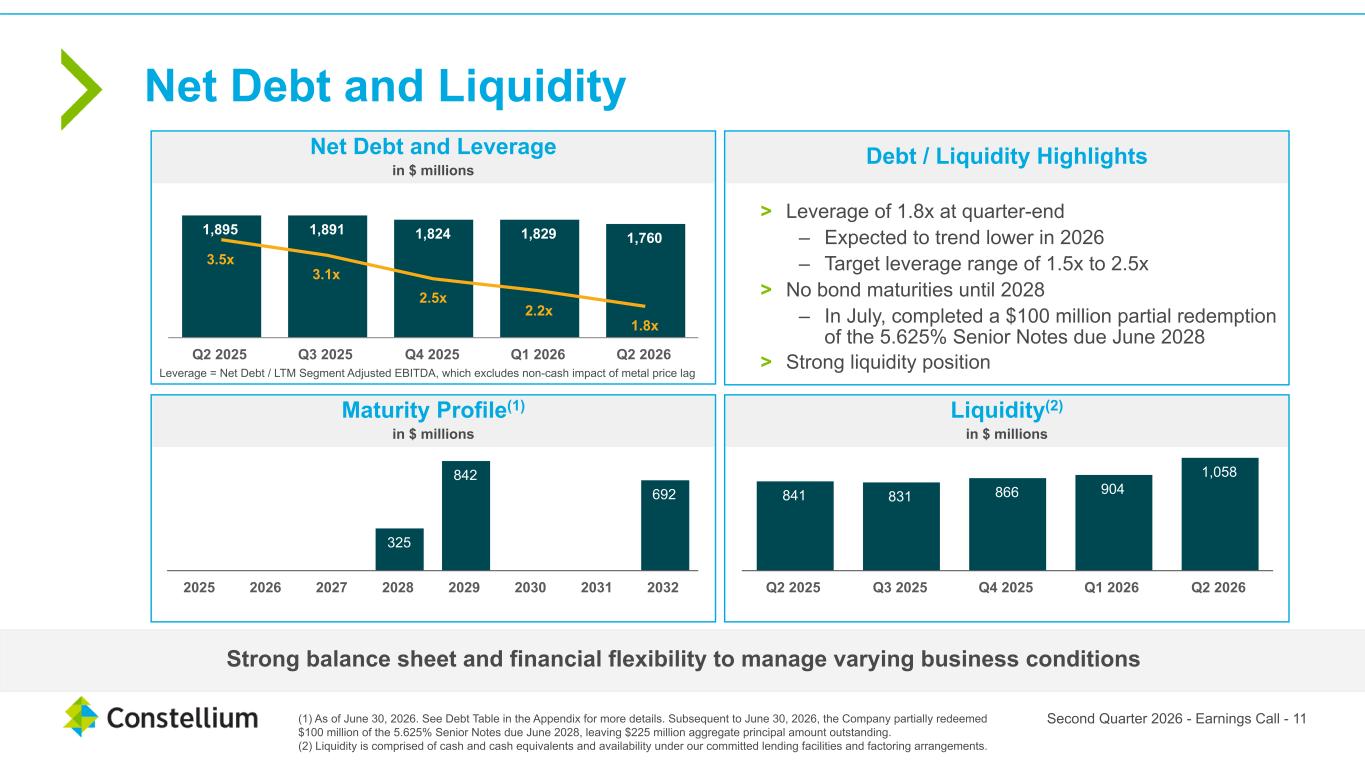
> Leverage of 1.8x at quarter-end – Expected to trend lower in 2026 – Target leverage range of 1.5x to 2.5x > No bond maturities until 2028 – In July, completed a $100 million partial redemption of the 5.625% Senior Notes due June 2028 > Strong liquidity position Debt / Liquidity Highlights Net Debt and Liquidity Maturity Profile(1) in $ millions Liquidity(2) in $ millions 0 0 0 325 842 0 0 692 2025 2026 2027 2028 2029 2030 2031 2032 Net Debt and Leverage in $ millions 841 831 866 904 1,058 Q2 2025 Q3 2025 Q4 2025 Q1 2026 Q2 2026 Strong balance sheet and financial flexibility to manage varying business conditions Leverage = Net Debt / LTM Segment Adjusted EBITDA, which excludes non-cash impact of metal price lag Second Quarter 2026 - Earnings Call - 11(1) As of June 30, 2026. See Debt Table in the Appendix for more details. Subsequent to June 30, 2026, the Company partially redeemed $100 million of the 5.625% Senior Notes due June 2028, leaving $225 million aggregate principal amount outstanding. (2) Liquidity is comprised of cash and cash equivalents and availability under our committed lending facilities and factoring arrangements. 1,895 1,891 1,824 1,829 1,760 3.5x 3.1x 2.5x 2.2x 1.8x Q2 2025 Q3 2025 Q4 2025 Q1 2026 Q2 2026

Ingrid Joerg Chief Executive Officer
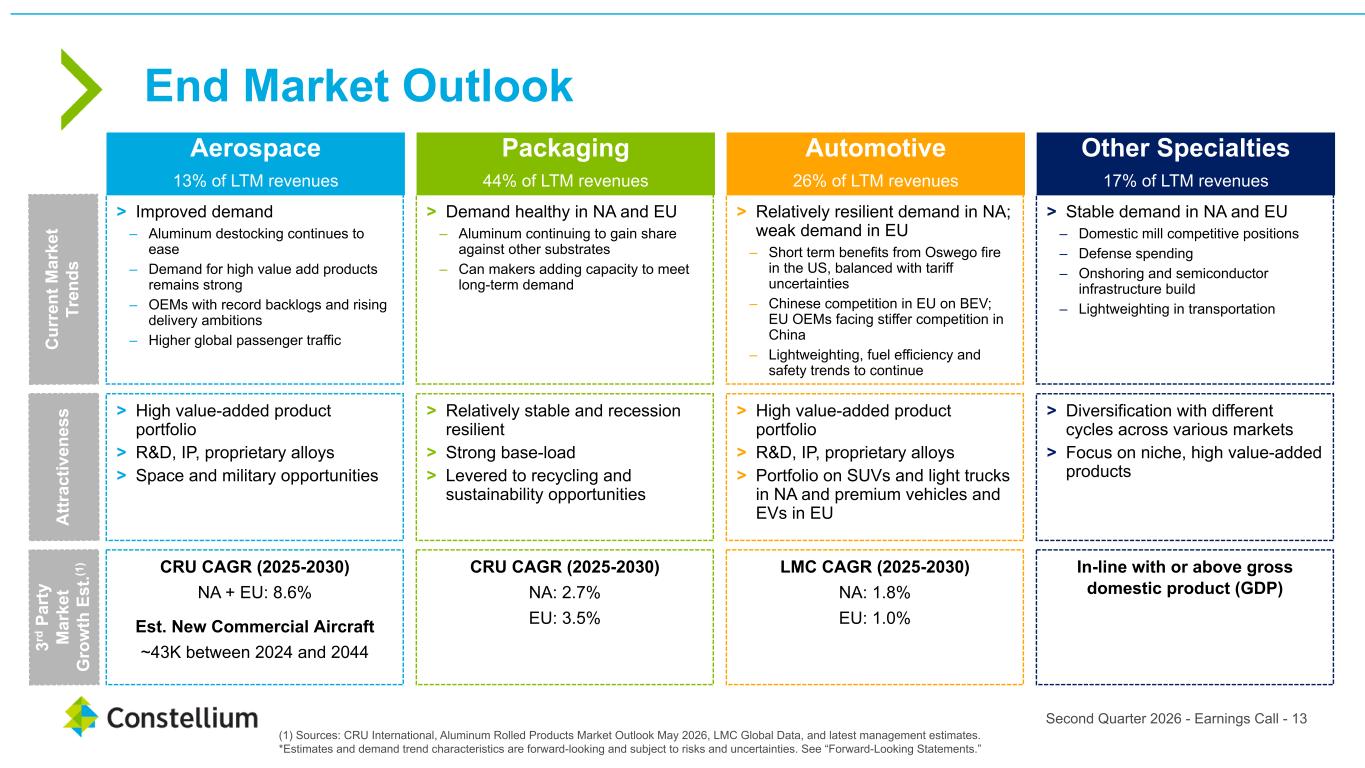
End Market Outlook Second Quarter 2026 - Earnings Call - 13 (1) Sources: CRU International, Aluminum Rolled Products Market Outlook May 2026, LMC Global Data, and latest management estimates. *Estimates and demand trend characteristics are forward-looking and subject to risks and uncertainties. See “Forward-Looking Statements.” Aerospace 13% of LTM revenues Packaging 44% of LTM revenues Automotive 26% of LTM revenues Other Specialties 17% of LTM revenues > Relatively resilient demand in NA; weak demand in EU – Short term benefits from Oswego fire in the US, balanced with tariff uncertainties – Chinese competition in EU on BEV; EU OEMs facing stiffer competition in China – Lightweighting, fuel efficiency and safety trends to continue > Stable demand in NA and EU – Domestic mill competitive positions – Defense spending – Onshoring and semiconductor infrastructure build – Lightweighting in transportation > Demand healthy in NA and EU – Aluminum continuing to gain share against other substrates – Can makers adding capacity to meet long-term demand > Improved demand – Aluminum destocking continues to ease – Demand for high value add products remains strong – OEMs with record backlogs and rising delivery ambitions – Higher global passenger traffic > High value-added product portfolio > R&D, IP, proprietary alloys > Portfolio on SUVs and light trucks in NA and premium vehicles and EVs in EU > Diversification with different cycles across various markets > Focus on niche, high value-added products > Relatively stable and recession resilient > Strong base-load > Levered to recycling and sustainability opportunities > High value-added product portfolio > R&D, IP, proprietary alloys > Space and military opportunities CRU CAGR (2025-2030) NA: 2.7% EU: 3.5% CRU CAGR (2025-2030) NA + EU: 8.6% Est. New Commercial Aircraft ~43K between 2024 and 2044 LMC CAGR (2025-2030) NA: 1.8% EU: 1.0% In-line with or above gross domestic product (GDP) C ur re nt M ar ke t Tr en ds A ttr ac tiv en es s 3rd P ar ty M ar ke t G ro w th E st .(1 )
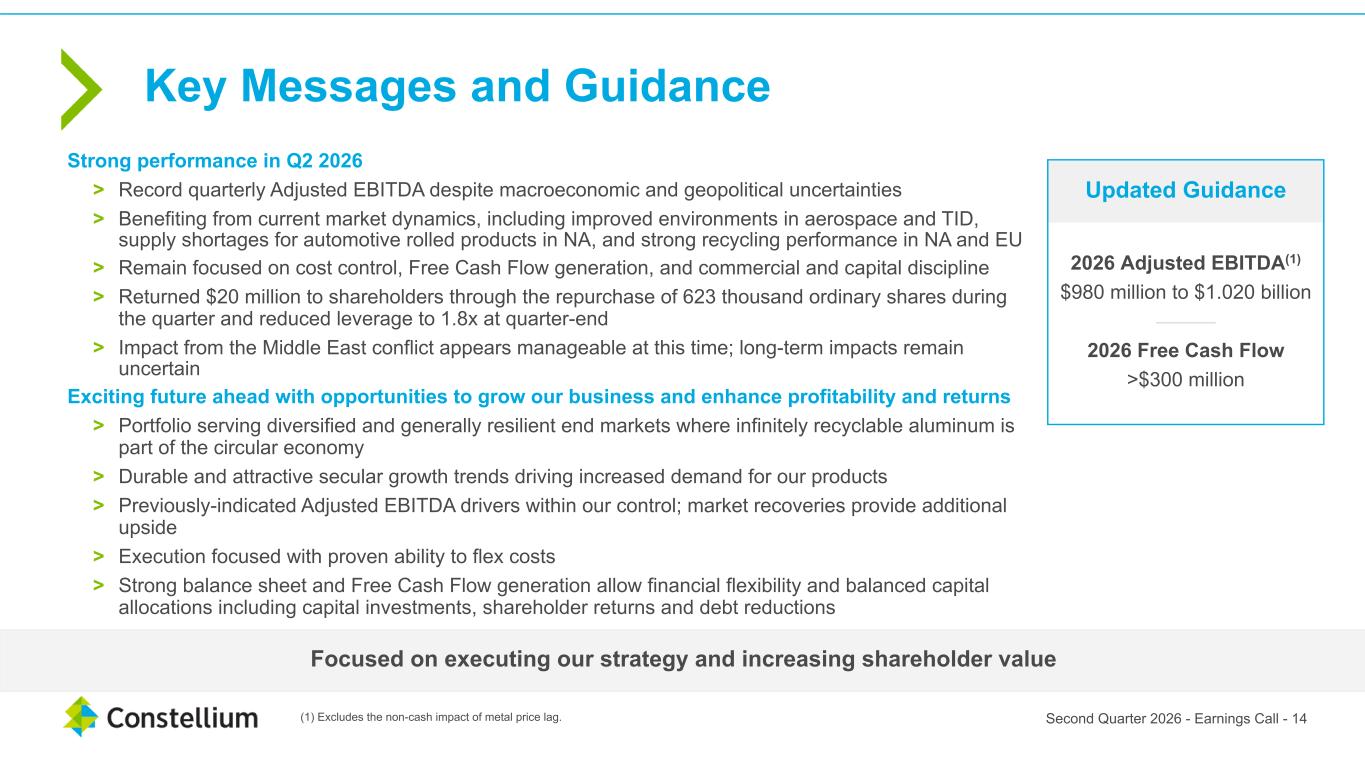
Strong performance in Q2 2026 > Record quarterly Adjusted EBITDA despite macroeconomic and geopolitical uncertainties > Benefiting from current market dynamics, including improved environments in aerospace and TID, supply shortages for automotive rolled products in NA, and strong recycling performance in NA and EU > Remain focused on cost control, Free Cash Flow generation, and commercial and capital discipline > Returned $20 million to shareholders through the repurchase of 623 thousand ordinary shares during the quarter and reduced leverage to 1.8x at quarter-end > Impact from the Middle East conflict appears manageable at this time; long-term impacts remain uncertain Exciting future ahead with opportunities to grow our business and enhance profitability and returns > Portfolio serving diversified and generally resilient end markets where infinitely recyclable aluminum is part of the circular economy > Durable and attractive secular growth trends driving increased demand for our products > Previously-indicated Adjusted EBITDA drivers within our control; market recoveries provide additional upside > Execution focused with proven ability to flex costs > Strong balance sheet and Free Cash Flow generation allow financial flexibility and balanced capital allocations including capital investments, shareholder returns and debt reductions Key Messages and Guidance Focused on executing our strategy and increasing shareholder value Updated Guidance (1) Excludes the non-cash impact of metal price lag. Second Quarter 2026 - Earnings Call - 14 2026 Adjusted EBITDA(1) $980 million to $1.020 billion ——— 2026 Free Cash Flow >$300 million
Appendix
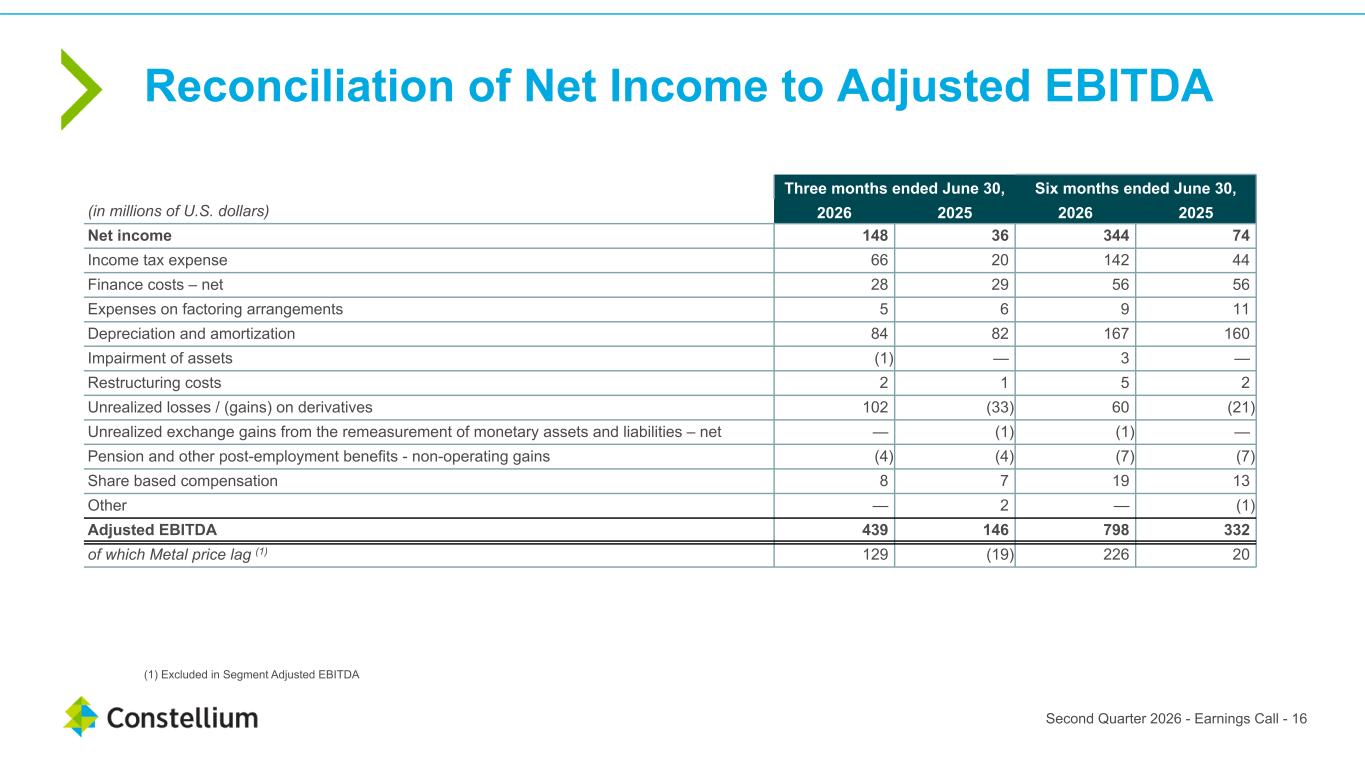
Reconciliation of Net Income to Adjusted EBITDA ≥130 Three months ended June 30, Six months ended June 30, (in millions of U.S. dollars) 2026 2025 2026 2025 Net income 148 36 344 74 Income tax expense 66 20 142 44 Finance costs – net 28 29 56 56 Expenses on factoring arrangements 5 6 9 11 Depreciation and amortization 84 82 167 160 Impairment of assets (1) — 3 — Restructuring costs 2 1 5 2 Unrealized losses / (gains) on derivatives 102 (33) 60 (21) Unrealized exchange gains from the remeasurement of monetary assets and liabilities – net — (1) (1) — Pension and other post-employment benefits - non-operating gains (4) (4) (7) (7) Share based compensation 8 7 19 13 Other — 2 — (1) Adjusted EBITDA 439 146 798 332 of which Metal price lag (1) 129 (19) 226 20 Second Quarter 2026 - Earnings Call - 16 (1) Excluded in Segment Adjusted EBITDA
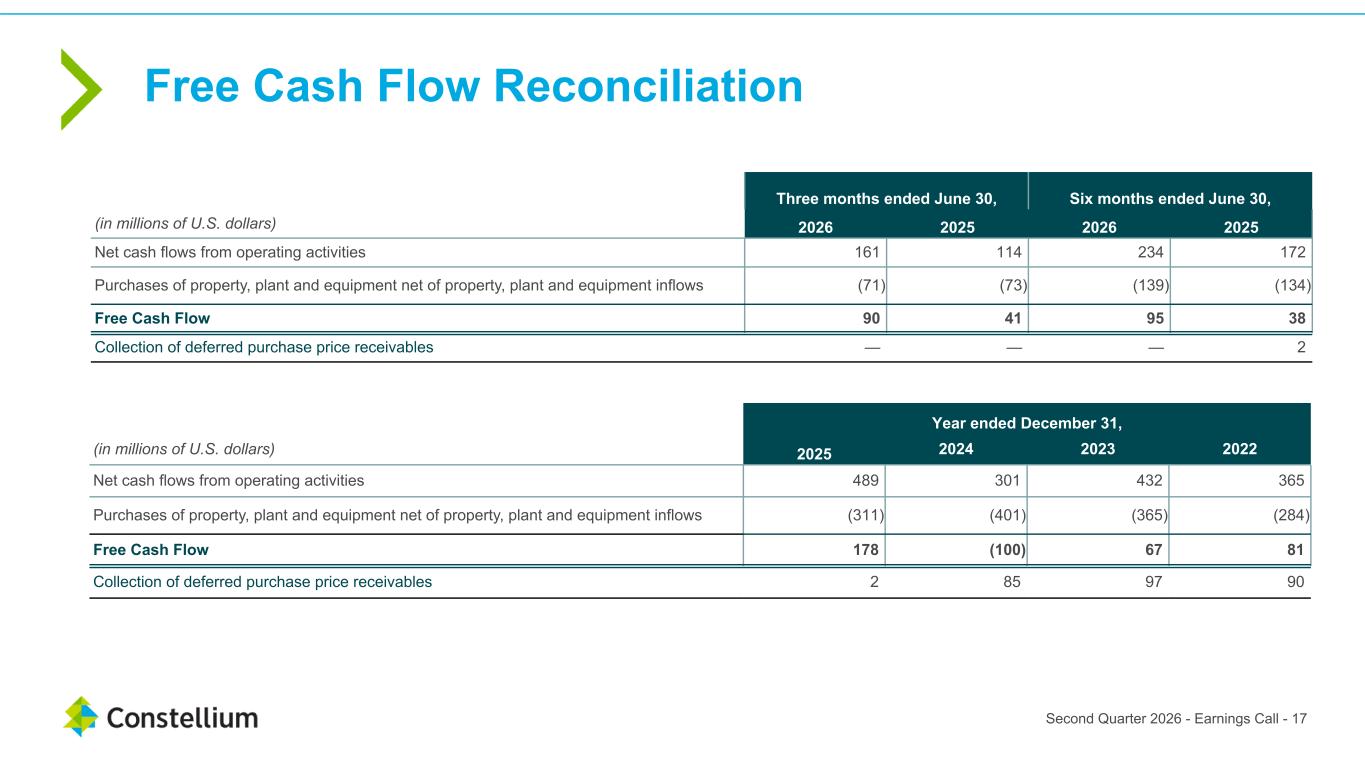
Three months ended June 30, Six months ended June 30, (in millions of U.S. dollars) 2026 2025 2026 2025 Net cash flows from operating activities 161 114 234 172 Purchases of property, plant and equipment net of property, plant and equipment inflows (71) (73) (139) (134) Free Cash Flow 90 41 95 38 Collection of deferred purchase price receivables — — — 2 Year ended December 31, (in millions of U.S. dollars) 2025 2024 2023 2022 Net cash flows from operating activities 489 301 432 365 Purchases of property, plant and equipment net of property, plant and equipment inflows (311) (401) (365) (284) Free Cash Flow 178 (100) 67 81 Collection of deferred purchase price receivables 2 85 97 90 Second Quarter 2026 - Earnings Call - 17 Free Cash Flow Reconciliation
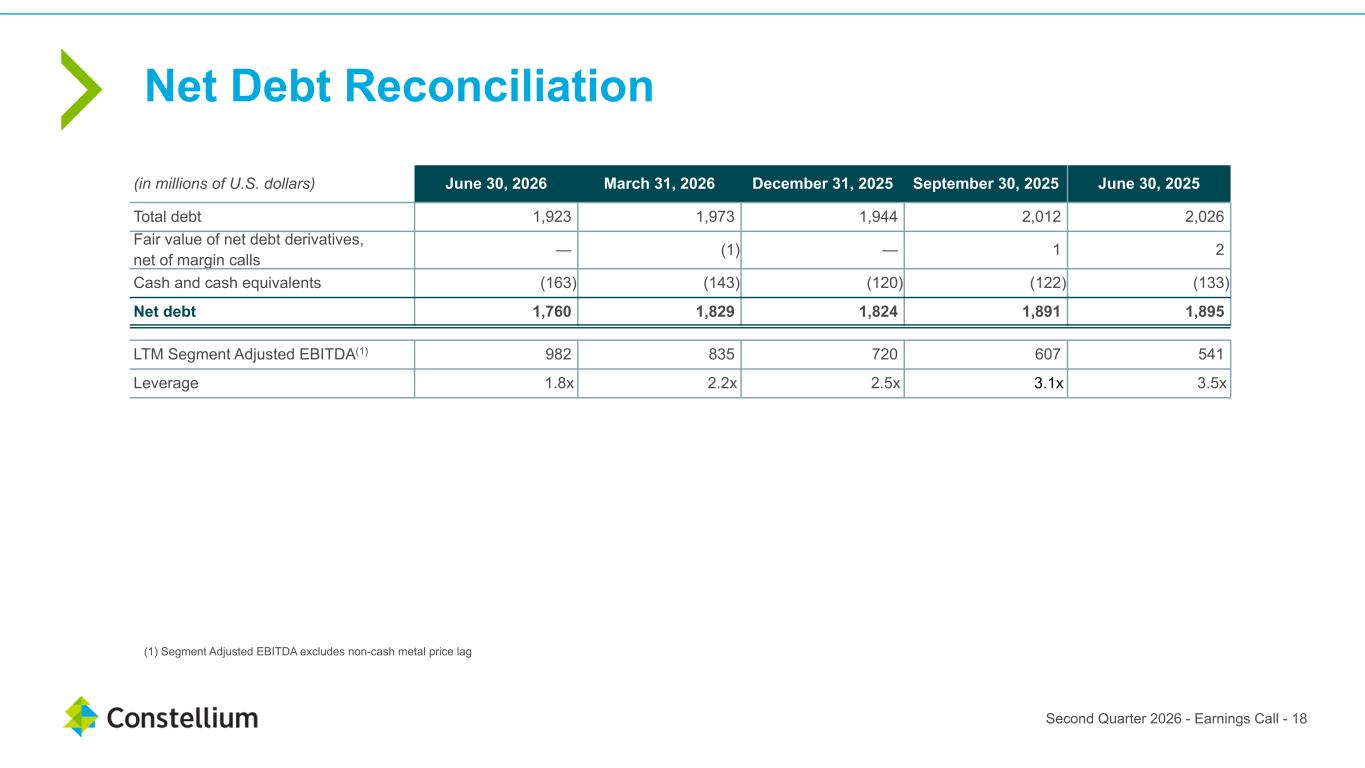
Net Debt Reconciliation ≥130 (in millions of U.S. dollars) June 30, 2026 March 31, 2026 December 31, 2025 September 30, 2025 June 30, 2025 Total debt 1,923 1,973 1,944 2,012 2,026 Fair value of net debt derivatives, net of margin calls — (1) — 1 2 Cash and cash equivalents (163) (143) (120) (122) (133) Net debt 1,760 1,829 1,824 1,891 1,895 LTM Segment Adjusted EBITDA(1) 982 835 720 607 541 Leverage 1.8x 2.2x 2.5x 3.1x 3.5x (1) Segment Adjusted EBITDA excludes non-cash metal price lag Second Quarter 2026 - Earnings Call - 18
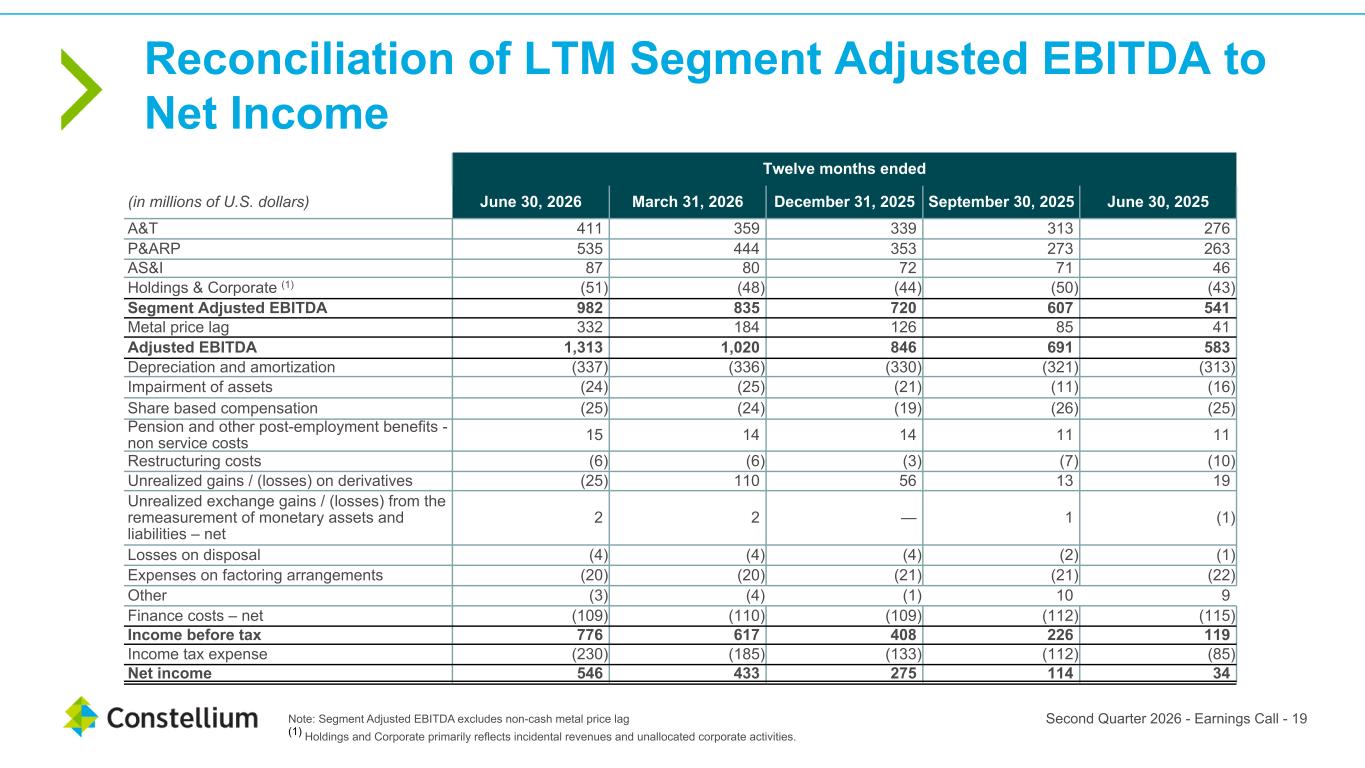
Reconciliation of LTM Segment Adjusted EBITDA to Net Income ≥130 Twelve months ended (in millions of U.S. dollars) June 30, 2026 March 31, 2026 December 31, 2025 September 30, 2025 June 30, 2025 A&T 411 359 339 313 276 P&ARP 535 444 353 273 263 AS&I 87 80 72 71 46 Holdings & Corporate (1) (51) (48) (44) (50) (43) Segment Adjusted EBITDA 982 835 720 607 541 Metal price lag 332 184 126 85 41 Adjusted EBITDA 1,313 1,020 846 691 583 Depreciation and amortization (337) (336) (330) (321) (313) Impairment of assets (24) (25) (21) (11) (16) Share based compensation (25) (24) (19) (26) (25) Pension and other post-employment benefits - non service costs 15 14 14 11 11 Restructuring costs (6) (6) (3) (7) (10) Unrealized gains / (losses) on derivatives (25) 110 56 13 19 Unrealized exchange gains / (losses) from the remeasurement of monetary assets and liabilities – net 2 2 — 1 (1) Losses on disposal (4) (4) (4) (2) (1) Expenses on factoring arrangements (20) (20) (21) (21) (22) Other (3) (4) (1) 10 9 Finance costs – net (109) (110) (109) (112) (115) Income before tax 776 617 408 226 119 Income tax expense (230) (185) (133) (112) (85) Net income 546 433 275 114 34 Note: Segment Adjusted EBITDA excludes non-cash metal price lag (1) Holdings and Corporate primarily reflects incidental revenues and unallocated corporate activities. Second Quarter 2026 - Earnings Call - 19
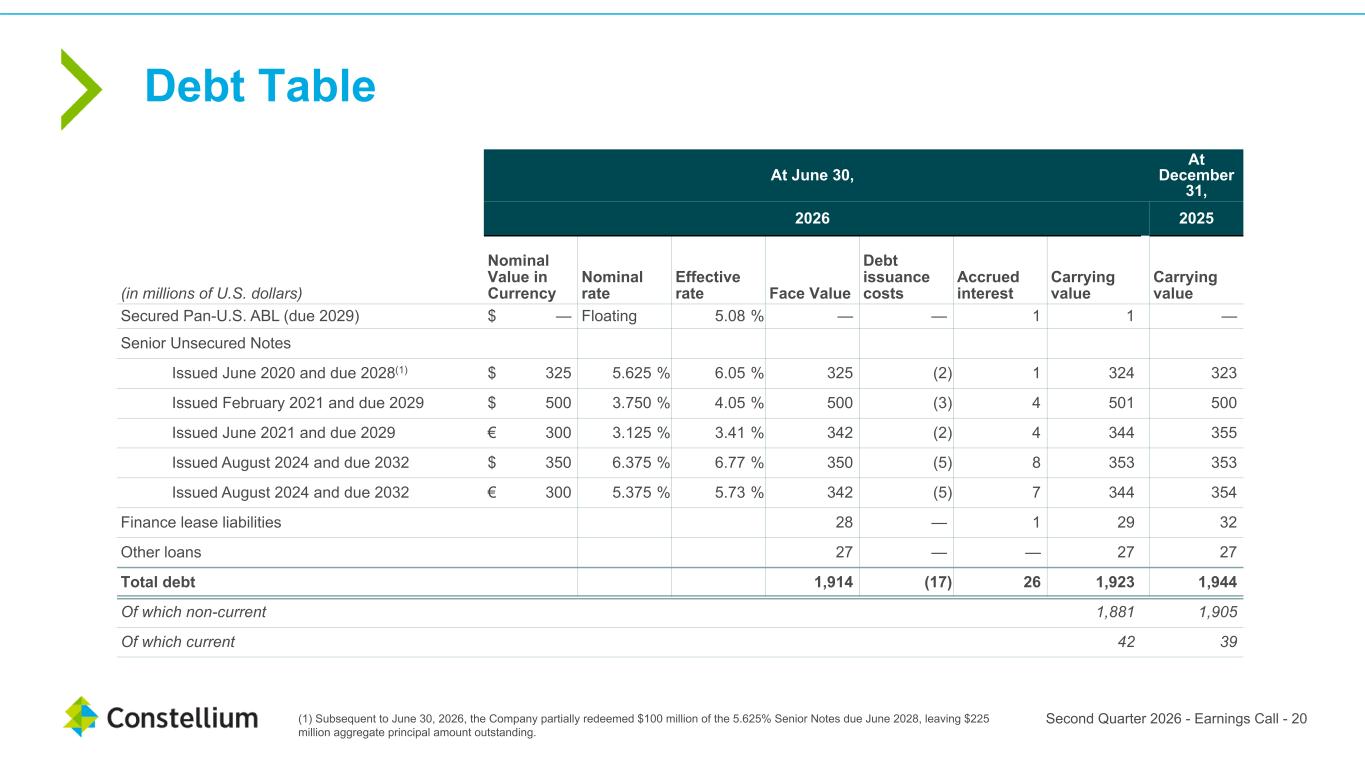
Debt Table ≥130 Second Quarter 2026 - Earnings Call - 20 At June 30, At December 31, 2026 2025 (in millions of U.S. dollars) Nominal Value in Currency Nominal rate Effective rate Face Value Debt issuance costs Accrued interest Carrying value Carrying value Secured Pan-U.S. ABL (due 2029) $ — Floating 5.08 % — — 1 1 — Senior Unsecured Notes Issued June 2020 and due 2028(1) $ 325 5.625 % 6.05 % 325 (2) 1 324 323 Issued February 2021 and due 2029 $ 500 3.750 % 4.05 % 500 (3) 4 501 500 Issued June 2021 and due 2029 € 300 3.125 % 3.41 % 342 (2) 4 344 355 Issued August 2024 and due 2032 $ 350 6.375 % 6.77 % 350 (5) 8 353 353 Issued August 2024 and due 2032 € 300 5.375 % 5.73 % 342 (5) 7 344 354 Finance lease liabilities 28 — 1 29 32 Other loans 27 — — 27 27 Total debt 1,914 (17) 26 1,923 1,944 Of which non-current 1,881 1,905 Of which current 42 39 (1) Subsequent to June 30, 2026, the Company partially redeemed $100 million of the 5.625% Senior Notes due June 2028, leaving $225 million aggregate principal amount outstanding.