v3.26.1
Performance Management
Jul. 29, 2026
DEFENSIVE STRATEGY FUND - Class F Prospectus | SAAT DEFENSIVE STRATEGY FUND  
Prospectus [Line Items]  
Bar Chart and Performance Table [Heading] Performance Information
Performance Narrative [Text Block]

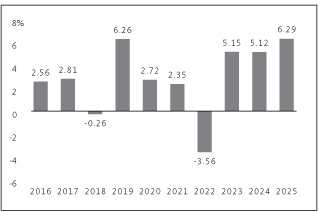
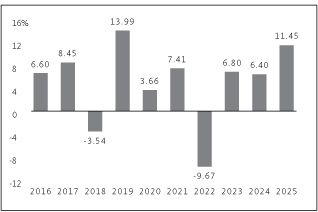
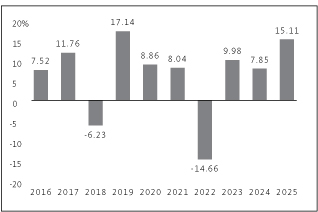
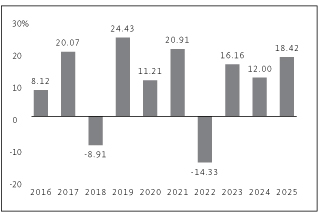
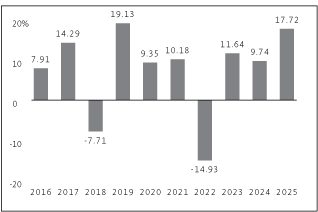
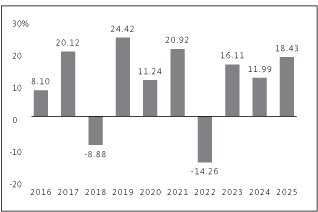
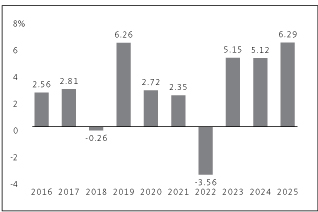
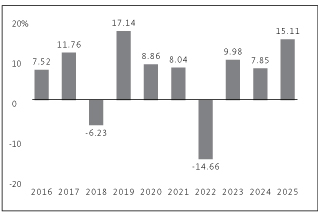
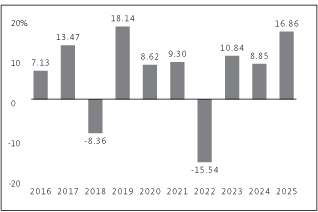
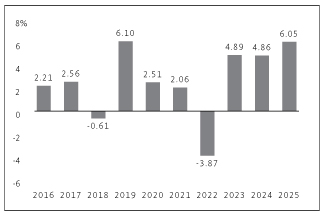
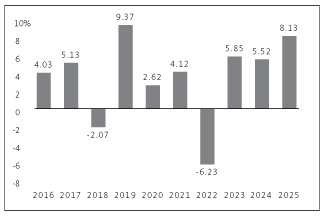
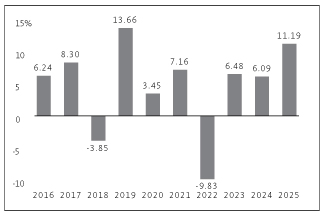
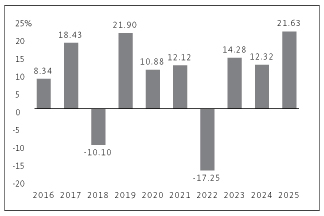
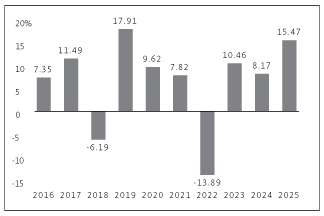
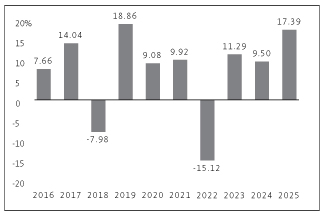
The bar chart and the performance table below provide some indication of the risks of investing in the Fund by showing changes in the Fund's performance from year to year for the past ten calendar years and by showing how the Fund's average annual returns for 1, 5 and 10 years, and since the Fund's inception, compared with those of a broad measure of market performance. The Fund's past performance (before and after taxes) is not necessarily an indication of how the Fund will perform in the future. For current performance information, please call 1-800-DIAL-SEI.

Performance Past Does Not Indicate Future [Text] The Fund's past performance (before and after taxes) is not necessarily an indication of how the Fund will perform in the future.
Performance Information Illustrates Variability of Returns [Text] The bar chart and the performance table below provide some indication of the risks of investing in the Fund by showing changes in the Fund's performance from year to year for the past ten calendar years and by showing how the Fund's average annual returns for 1, 5 and 10 years, and since the Fund's inception, compared with those of a broad measure of market performance.
Performance Additional Market Index [Text] This table compares the Fund's average annual total returns for Class F Shares to those of the Bloomberg U.S. Aggregate Bond Index (a broad-based securities market index) and an additional index with characteristics relevant to the Fund's investment strategy. The Fund's additional index is the Fund's blended benchmark that is composed of the Bloomberg 1-3 Year Government/Credit Index, the Bloomberg 1-3 Month Treasury Bill Index, the Russell 3000 Index and the MSCI ACWI ex-USA Index, weighted 70%/20%/5%/5%.
Bar Chart [Table]

  Best Quarter: 3.24% (12/31/2023)
Worst Quarter: -2.70% (3/31/2020)
The Fund's Class F total return (pre-tax) from January 1, 2026 to June 30, 2026 was 1.86%.


Bar Chart Closing [Text Block]
Best Quarter: 3.24% (12/31/2023)
Worst Quarter: -2.70% (3/31/2020)
The Fund's Class F total return (pre-tax) from January 1, 2026 to June 30, 2026 was 1.86%.
Year to Date Return, Label [Optional Text] Class F total return (pre-tax)
Bar Chart, Year to Date Return 1.86%
Bar Chart, Year to Date Return, Date Jun. 30, 2026
Highest Quarterly Return, Label [Optional Text] Best Quarter:
Highest Quarterly Return 3.24%
Highest Quarterly Return, Date Dec. 31, 2023
Lowest Quarterly Return, Label [Optional Text] Worst Quarter:
Lowest Quarterly Return (2.70%)
Lowest Quarterly Return, Date Mar. 31, 2020
Performance Table Heading Average Annual Total Returns (for the periods ended December 31, 2025)
Performance Table Narrative

This table compares the Fund's average annual total returns for Class F Shares to those of the Bloomberg U.S. Aggregate Bond Index (a broad-based securities market index) and an additional index with characteristics relevant to the Fund's investment strategy. The Fund's additional index is the Fund's blended benchmark that is composed of the Bloomberg 1-3 Year Government/Credit Index, the Bloomberg 1-3 Month Treasury Bill Index, the Russell 3000 Index and the MSCI ACWI ex-USA Index, weighted 70%/20%/5%/5%.

After-tax returns are calculated using the historical highest individual federal marginal income tax rates and do not reflect the impact of state and local taxes. Your actual after-tax returns will depend on your tax situation and may differ from those shown. After-tax returns shown are not relevant to investors who hold their Fund shares through tax-deferred arrangements, such as 401(k) plans or individual retirement accounts.

Performance Table Uses Highest Federal Rate After-tax returns are calculated using the historical highest individual federal marginal income tax rates and do not reflect the impact of state and local taxes.
Performance Table Not Relevant to Tax Deferred Your actual after-tax returns will depend on your tax situation and may differ from those shown. After-tax returns shown are not relevant to investors who hold their Fund shares through tax-deferred arrangements, such as 401(k) plans or individual retirement accounts.
Performance [Table]

Defensive Strategy Fund — Class F


1 Year


5 Years


10 Years

  Since
Inception
(11/17/2003)
 

Return Before Taxes


6.29

%


3.01

%


2.90

%


2.49

%


Return After Taxes on Distributions


4.97

%


1.61

%


1.83

%


1.54

%


Return After Taxes on Distributions and Sale of Fund Shares


3.76

%


1.74

%


1.80

%


1.56

%

 
Bloomberg U.S. Aggregate Bond Index Return (reflects no deduction
for fees, expenses or taxes)
   

7.30

%


-0.36

%


2.01

%


3.27

%


Blended Benchmark Return (reflects no deduction for fees, expenses or taxes)


6.96

%


3.14

%


3.10

%


2.98

%

 
Index No Deduction for Fees, Expenses, or Taxes [Text] (reflects no deduction for fees, expenses or taxes)
Performance Availability Phone [Text] 1-800-DIAL-SEI
DEFENSIVE STRATEGY ALLOCATION FUND - Class F Prospectus | SAAT DEFENSIVE STRATEGY ALLOCATION FUND  
Prospectus [Line Items]  
Bar Chart and Performance Table [Heading] Performance Information
Performance Narrative [Text Block]

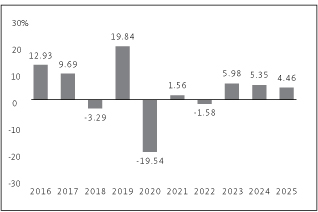
The bar chart and the performance table below provide some indication of the risks of investing in the Fund by showing changes in the Fund's performance from year to year for the past ten calendar years and by showing how the Fund's average annual returns for 1, 5 and 10 years, and since the Fund's inception, compared with those of a broad measure of market performance. The Fund's past performance (before and after taxes) is not necessarily an indication of how the Fund will perform in the future. For current performance information, please call 1-800-DIAL-SEI.

Performance Past Does Not Indicate Future [Text] The Fund's past performance (before and after taxes) is not necessarily an indication of how the Fund will perform in the future.
Performance Information Illustrates Variability of Returns [Text] The bar chart and the performance table below provide some indication of the risks of investing in the Fund by showing changes in the Fund's performance from year to year for the past ten calendar years and by showing how the Fund's average annual returns for 1, 5 and 10 years, and since the Fund's inception, compared with those of a broad measure of market performance.
Performance Additional Market Index [Text] This table compares the Fund's average annual total returns for Class F Shares to those of the S&P 500 Index (a broad-based securities market index) and an additional index with characteristics relevant to the Fund's investment strategy. The Fund's additional index is the Fund's blended benchmark that is composed of the ICE BofA US 3-Month Treasury Bill Index (USD) and the ICE BofA US High Yield Constrained Index (USD), weighted 80%/20%
Bar Chart [Table]

  Best Quarter: 10.12% (3/31/2019)
Worst Quarter: -22.83% (3/31/2020)
The Fund's Class F total return (pre-tax) from January 1, 2026 to June 30, 2026 was 1.66%.


Bar Chart Closing [Text Block]

Best Quarter: 10.12% (3/31/2019)
Worst Quarter: -22.83% (3/31/2020)
The Fund's Class F total return (pre-tax) from January 1, 2026 to June 30, 2026 was 1.66%.

Year to Date Return, Label [Optional Text] Class F total return (pre-tax)
Bar Chart, Year to Date Return 1.66%
Bar Chart, Year to Date Return, Date Jun. 30, 2026
Highest Quarterly Return, Label [Optional Text] Best Quarter:
Highest Quarterly Return 10.12%
Highest Quarterly Return, Date Mar. 31, 2019
Lowest Quarterly Return, Label [Optional Text] Worst Quarter:
Lowest Quarterly Return (22.83%)
Lowest Quarterly Return, Date Mar. 31, 2020
Performance Table Heading Average Annual Total Returns (for the periods ended December 31, 2025)
Performance Table Narrative

This table compares the Fund's average annual total returns for Class F Shares to those of the S&P 500 Index (a broad-based securities market index) and an additional index with characteristics relevant to the Fund's investment strategy. The Fund's additional index is the Fund's blended benchmark that is composed of the ICE BofA US 3-Month Treasury Bill Index (USD) and the ICE BofA US High Yield Constrained Index (USD), weighted 80%/20%.

After-tax returns are calculated using the historical highest individual federal marginal income tax rates and do not reflect the impact of state and local taxes. Your actual after-tax returns will depend on your tax situation and may differ from those shown. After-tax returns shown are not relevant to investors who hold their Fund shares through tax-deferred arrangements, such as 401(k) plans or individual retirement accounts.

Performance Table Uses Highest Federal Rate After-tax returns are calculated using the historical highest individual federal marginal income tax rates and do not reflect the impact of state and local taxes.
Performance Table Not Relevant to Tax Deferred Your actual after-tax returns will depend on your tax situation and may differ from those shown. After-tax returns shown are not relevant to investors who hold their Fund shares through tax-deferred arrangements, such as 401(k) plans or individual retirement accounts.
Performance [Table]

Defensive Strategy Allocation Fund — Class F


1 Year


5 Years


10 Years

  Since
Inception
(11/17/2003)
 

Return Before Taxes


4.46

%


3.12

%


3.02

%


5.15

%


Return After Taxes on Distributions


2.59

%


1.46

%


1.16

%


3.39

%


Return After Taxes on Distributions and Sale of Fund Shares


2.63

%


1.66

%


1.68

%


3.45

%


S&P 500 Index Return (reflects no deduction for fees, expenses or taxes)


17.88

%


14.42

%


14.82

%


10.97

%


Blended Benchmark Return (reflects no deduction for fees, expenses or taxes)


5.04

%


3.47

%


3.06

%


2.79

%

 
Index No Deduction for Fees, Expenses, or Taxes [Text] (reflects no deduction for fees, expenses or taxes)
Performance Availability Phone [Text] 1-800-DIAL-SEI
CONSERVATIVE STRATEGY FUND - Class F Prospectus | SAAT CONSERVATIVE STRATEGY FUND  
Prospectus [Line Items]  
Bar Chart and Performance Table [Heading] Performance Information
Performance Narrative [Text Block]

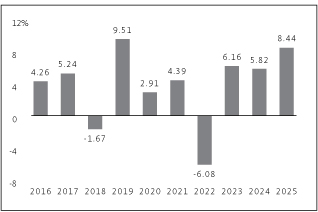
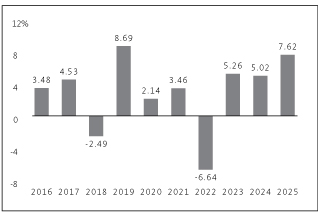
The bar chart and the performance table below provide some indication of the risks of investing in the Fund by showing changes in the Fund's performance from year to year for the past ten calendar years and by showing how the Fund's average annual returns for 1, 5 and 10 years, and since the Fund's inception, compared with those of a broad measure of market performance. The Fund's past performance (before and after taxes) is not necessarily an indication of how the Fund will perform in the future. For current performance information, please call 1-800-DIAL-SEI.

Performance Past Does Not Indicate Future [Text] The Fund's past performance (before and after taxes) is not necessarily an indication of how the Fund will perform in the future.
Performance Information Illustrates Variability of Returns [Text] The bar chart and the performance table below provide some indication of the risks of investing in the Fund by showing changes in the Fund's performance from year to year for the past ten calendar years and by showing how the Fund's average annual returns for 1, 5 and 10 years, and since the Fund's inception, compared with those of a broad measure of market performance.
Performance Additional Market Index [Text] This table compares the Fund's average annual total returns for Class F Shares to those of the Bloomberg U.S. Aggregate Bond Index (a broad-based securities market index) and an additional index with characteristics relevant to the Fund's investment strategy. The Fund's additional index is the Fund's blended benchmark that is composed of the Bloomberg 1-3 Year Government/Credit Index, the Bloomberg U.S. Aggregate Bond Index, the Russell 3000 Index and the MSCI ACWI ex-USA Index weighted 70%/10%/10%/10%.
Bar Chart [Table]

  Best Quarter: 4.98% (6/30/2020)
Worst Quarter: -6.54% (3/31/2020)
The Fund's Class F total return (pre-tax) from January 1, 2026 to June 30, 2026 was 2.41%.


Bar Chart Closing [Text Block]

Best Quarter: 4.98% (6/30/2020)
Worst Quarter: -6.54% (3/31/2020)
The Fund's Class F total return (pre-tax) from January 1, 2026 to June 30, 2026 was 2.41%.

Year to Date Return, Label [Optional Text] Class F total return (pre-tax)
Bar Chart, Year to Date Return 2.41%
Bar Chart, Year to Date Return, Date Jun. 30, 2026
Highest Quarterly Return, Label [Optional Text] Best Quarter:
Highest Quarterly Return 4.98%
Highest Quarterly Return, Date Jun. 30, 2020
Lowest Quarterly Return, Label [Optional Text] Worst Quarter:
Lowest Quarterly Return (6.54%)
Lowest Quarterly Return, Date Mar. 31, 2020
Performance Table Heading Average Annual Total Returns (for the periods ended December 31, 2025)
Performance Table Narrative

This table compares the Fund's average annual total returns for Class F Shares to those of the Bloomberg U.S. Aggregate Bond Index (a broad-based securities market index) and an additional index with characteristics relevant to the Fund's investment strategy. The Fund's additional index is the Fund's blended benchmark that is composed of the Bloomberg 1-3 Year Government/Credit Index, the Bloomberg U.S. Aggregate Bond Index, the Russell 3000 Index and the MSCI ACWI ex-USA Index weighted 70%/10%/10%/10%.

After-tax returns are calculated using the historical highest individual federal marginal income tax rates and do not reflect the impact of state and local taxes. Your actual after-tax returns will depend on your tax situation and may differ from those shown. After-tax returns shown are not relevant to investors who hold their Fund shares through tax-deferred arrangements, such as 401(k) plans or individual retirement accounts.

Performance Table Uses Highest Federal Rate After-tax returns are calculated using the historical highest individual federal marginal income tax rates and do not reflect the impact of state and local taxes.
Performance Table Not Relevant to Tax Deferred Your actual after-tax returns will depend on your tax situation and may differ from those shown. After-tax returns shown are not relevant to investors who hold their Fund shares through tax-deferred arrangements, such as 401(k) plans or individual retirement accounts.
Performance [Table]

Conservative Strategy Fund — Class F


1 Year


5 Years


10 Years

  Since
Inception
(11/17/2003)
 

Return Before Taxes


8.44

%


3.62

%


3.80

%


3.44

%


Return After Taxes on Distributions


7.12

%


2.15

%


2.62

%


2.32

%


Return After Taxes on Distributions and Sale of Fund Shares


5.07

%


2.21

%


2.48

%


2.26

%

 
Bloomberg U.S. Aggregate Bond Index Return (reflects no deduction
for fees, expenses or taxes)
   

7.30

%


-0.36

%


2.01

%


3.27

%


Blended Benchmark Return (reflects no deduction for fees, expenses or taxes)


9.23

%


3.54

%


4.05

%


3.95

%

 
Index No Deduction for Fees, Expenses, or Taxes [Text] (reflects no deduction for fees, expenses or taxes)
Performance Availability Phone [Text] 1-800-DIAL-SEI
CONSERVATIVE STRATEGY ALLOCATION FUND - Class F Prospectus | SAAT CONSERVATIVE STRATEGY ALLOCATION FUND  
Prospectus [Line Items]  
Bar Chart and Performance Table [Heading] Performance Information
Performance Narrative [Text Block]

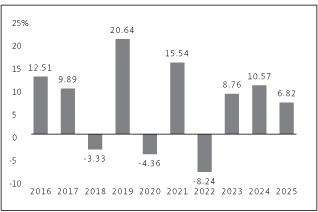
The bar chart and the performance table below provide some indication of the risks of investing in the Fund by showing changes in the Fund's performance from year to year for the past ten calendar years and by showing how the Fund's average annual returns for 1, 5 and 10 years, and since the Fund's inception, compared with those of a broad measure of market performance. The Fund's past performance (before and after taxes) is not necessarily an indication of how the Fund will perform in the future. For current performance information, please call 1-800-DIAL-SEI.

Performance Past Does Not Indicate Future [Text] The Fund's past performance (before and after taxes) is not necessarily an indication of how the Fund will perform in the future.
Performance Information Illustrates Variability of Returns [Text] The bar chart and the performance table below provide some indication of the risks of investing in the Fund by showing changes in the Fund's performance from year to year for the past ten calendar years and by showing how the Fund's average annual returns for 1, 5 and 10 years, and since the Fund's inception, compared with those of a broad measure of market performance.
Performance Additional Market Index [Text] This table compares the Fund's average annual total returns for Class F Shares to those of the S&P 500 Index (a broad-based securities market index) and an additional index with characteristics relevant to the Fund's investment strategy. The Fund's additional index is the Fund's blended benchmark that is composed of the ICE BofA US 3-Month Treasury Bill Index (USD), the ICE BofA US High Yield Constrained Index (USD) and the S&P 500 Index, weighted 20%/30%/50%.
Bar Chart [Table]

  Best Quarter: 10.54% (3/31/2019)
Worst Quarter: -20.70% (3/31/2020)
The Fund's Class F total return (pre-tax) from January 1, 2026 to June 30, 2026 was 4.36%.


Bar Chart Closing [Text Block]

Best Quarter: 10.54% (3/31/2019)
Worst Quarter: -20.70% (3/31/2020)
The Fund's Class F total return (pre-tax) from January 1, 2026 to June 30, 2026 was 4.36%.

Year to Date Return, Label [Optional Text] Class F total return (pre-tax)
Bar Chart, Year to Date Return 4.36%
Bar Chart, Year to Date Return, Date Jun. 30, 2026
Highest Quarterly Return, Label [Optional Text] Best Quarter:
Highest Quarterly Return 10.54%
Highest Quarterly Return, Date Mar. 31, 2019
Lowest Quarterly Return, Label [Optional Text] Worst Quarter:
Lowest Quarterly Return (20.70%)
Lowest Quarterly Return, Date Mar. 31, 2020
Performance Table Heading Average Annual Total Returns (for the periods ended December 31, 2025)
Performance Table Narrative

This table compares the Fund's average annual total returns for Class F Shares to those of the S&P 500 Index (a broad-based securities market index) and an additional index with characteristics relevant to the Fund's investment strategy. The Fund's additional index is the Fund's blended benchmark that is composed of the ICE BofA US 3-Month Treasury Bill Index (USD), the ICE BofA US High Yield Constrained Index (USD) and the S&P 500 Index, weighted 20%/30%/50%.

After-tax returns are calculated using the historical highest individual federal marginal income tax rates and do not reflect the impact of state and local taxes. Your actual after-tax returns will depend on your tax situation and may differ from those shown. After-tax returns shown are not relevant to investors who hold their Fund shares through tax-deferred arrangements, such as 401(k) plans or individual retirement accounts.

Performance Table Uses Highest Federal Rate After-tax returns are calculated using the historical highest individual federal marginal income tax rates and do not reflect the impact of state and local taxes.
Performance Table Not Relevant to Tax Deferred Your actual after-tax returns will depend on your tax situation and may differ from those shown. After-tax returns shown are not relevant to investors who hold their Fund shares through tax-deferred arrangements, such as 401(k) plans or individual retirement accounts.
Performance [Table]

Conservative Strategy Allocation Fund — Class F


1 Year


5 Years


10 Years

  Since
Inception
(11/17/2003)
 

Return Before Taxes


6.82

%


6.37

%


6.51

%


7.13

%


Return After Taxes on Distributions


4.06

%


3.87

%


3.96

%


5.14

%


Return After Taxes on Distributions and Sale of Fund Shares


4.83

%


4.06

%


4.24

%


5.07

%


S&P 500 Index Return (reflects no deduction for fees, expenses or taxes)


17.88

%


14.42

%


14.82

%


10.97

%


Blended Benchmark Return (reflects no deduction for fees, expenses or taxes)


12.31

%


9.30

%


9.89

%


8.02

%

 
Index No Deduction for Fees, Expenses, or Taxes [Text] (reflects no deduction for fees, expenses or taxes)
Performance Availability Phone [Text] 1-800-DIAL-SEI
MODERATE STRATEGY FUND - Class F Prospectus | SAAT MODERATE STRATEGY FUND  
Prospectus [Line Items]  
Bar Chart and Performance Table [Heading] Performance Information
Performance Narrative [Text Block]

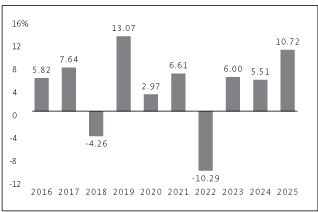
The bar chart and the performance table below provide some indication of the risks of investing in the Fund by showing changes in the Fund's performance from year to year for the past ten calendar years and by showing how the Fund's average annual returns for 1, 5 and 10 years, and since the Fund's inception, compared with those of a broad measure of market performance. The Fund's past performance (before and after taxes) is not necessarily an indication of how the Fund will perform in the future. For current performance information, please call 1-800-DIAL-SEI.

Performance Past Does Not Indicate Future [Text] The Fund's past performance (before and after taxes) is not necessarily an indication of how the Fund will perform in the future.
Performance Information Illustrates Variability of Returns [Text] The bar chart and the performance table below provide some indication of the risks of investing in the Fund by showing changes in the Fund's performance from year to year for the past ten calendar years and by showing how the Fund's average annual returns for 1, 5 and 10 years, and since the Fund's inception, compared with those of a broad measure of market performance.
Performance Additional Market Index [Text] This table compares the Fund's average annual total returns for Class F Shares to those of the Bloomberg U.S. Aggregate Bond Index (a broad-based securities market index) and an additional index with characteristics relevant to the Fund's investment strategy. The Fund's additional index is the Fund's blended benchmark that is composed of the Bloomberg 1-3 Year Government/Credit Index, the Bloomberg U.S. Aggregate Bond Index, the Russell 3000 Index and the MSCI ACWI ex-USA Index, weighted 35%/30%/20%/15%.
Bar Chart [Table]

  Best Quarter: 7.10% (6/30/2020)
Worst Quarter: -10.05% (3/31/2020)
The Fund's Class F total return (pre-tax) from January 1, 2026 to June 30, 2026 was 4.15%.


Bar Chart Closing [Text Block]
Best Quarter: 7.10% (6/30/2020)
Worst Quarter: -10.05% (3/31/2020)
The Fund's Class F total return (pre-tax) from January 1, 2026 to June 30, 2026 was 4.15%.
Year to Date Return, Label [Optional Text] Class F total return (pre-tax)
Bar Chart, Year to Date Return 4.15%
Bar Chart, Year to Date Return, Date Jun. 30, 2026
Highest Quarterly Return, Label [Optional Text] Best Quarter:
Highest Quarterly Return 7.10%
Highest Quarterly Return, Date Jun. 30, 2020
Lowest Quarterly Return, Label [Optional Text] Worst Quarter:
Lowest Quarterly Return (10.05%)
Lowest Quarterly Return, Date Mar. 31, 2020
Performance Table Heading Average Annual Total Returns (for the periods ended December 31, 2025)
Performance Table Narrative

This table compares the Fund's average annual total returns for Class F Shares to those of the Bloomberg U.S. Aggregate Bond Index (a broad-based securities market index) and an additional index with characteristics relevant to the Fund's investment strategy. The Fund's additional index is the Fund's blended benchmark that is composed of the Bloomberg 1-3 Year Government/Credit Index, the Bloomberg U.S. Aggregate Bond Index, the Russell 3000 Index and the MSCI ACWI ex-USA Index, weighted 35%/30%/20%/15%.

After-tax returns are calculated using the historical highest individual federal marginal income tax rates and do not reflect the impact of state and local taxes. Your actual after-tax returns will depend on your tax situation and may differ from those shown. After-tax returns shown are not relevant to investors who hold their Fund shares through tax-deferred arrangements, such as 401(k) plans or individual retirement accounts.

Performance Table Uses Highest Federal Rate After-tax returns are calculated using the historical highest individual federal marginal income tax rates and do not reflect the impact of state and local taxes.
Performance Table Not Relevant to Tax Deferred Your actual after-tax returns will depend on your tax situation and may differ from those shown. After-tax returns shown are not relevant to investors who hold their Fund shares through tax-deferred arrangements, such as 401(k) plans or individual retirement accounts.
Performance [Table]

Moderate Strategy Fund — Class F


1 Year


5 Years


10 Years

  Since
Inception
(11/17/2003)
 

Return Before Taxes


11.45

%


4.20

%


4.93

%


4.65

%


Return After Taxes on Distributions


10.15

%


2.52

%


3.58

%


3.38

%


Return After Taxes on Distributions and Sale of Fund Shares


6.90

%


2.62

%


3.35

%


3.22

%

 
Bloomberg U.S. Aggregate Bond Index Return (reflects no deduction
for fees, expenses or taxes)
   

7.30

%


-0.36

%


2.01

%


3.27

%


Blended Benchmark Return (reflects no deduction for fees, expenses or taxes)


12.13

%


4.50

%


5.62

%


5.30

%

 
Index No Deduction for Fees, Expenses, or Taxes [Text] (reflects no deduction for fees, expenses or taxes)
Performance Availability Phone [Text] 1-800-DIAL-SEI
MODERATE STRATEGY ALLOCATION FUND - Class F Prospectus | SAAT MODERATE STRATEGY ALLOCATION FUND  
Prospectus [Line Items]  
Bar Chart and Performance Table [Heading] Performance Information
Performance Narrative [Text Block]

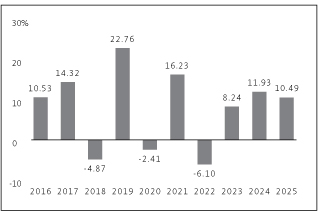
The bar chart and the performance table below provide some indication of the risks of investing in the Fund by showing changes in the Fund's performance from year to year for the past ten calendar years and by showing how the Fund's average annual returns for 1, 5 and 10 years, and since the Fund's inception, compared with those of a broad measure of market performance. The Fund's past performance (before and after taxes) is not necessarily an indication of how the Fund will perform in the future. For current performance information, please call 1-800-DIAL-SEI.

Performance Past Does Not Indicate Future [Text] The Fund's past performance (before and after taxes) is not necessarily an indication of how the Fund will perform in the future.
Performance Information Illustrates Variability of Returns [Text] The bar chart and the performance table below provide some indication of the risks of investing in the Fund by showing changes in the Fund's performance from year to year for the past ten calendar years and by showing how the Fund's average annual returns for 1, 5 and 10 years, and since the Fund's inception, compared with those of a broad measure of market performance.
Performance Additional Market Index [Text] This table compares the Fund's average annual total returns for Class F Shares to those of the S&P 500 Index (a broad-based securities market index) and an additional index with characteristics relevant to the Fund's investment strategy. The Fund's additional index is the Fund's blended benchmark that is composed of the ICE BofA US 3-Month Treasury Bill Index (USD), the ICE BofA US High Yield Constrained Index (USD), the S&P 500 Index and the MSCI EAFE Index, weighted 15%/20%/60%/5%.
Bar Chart [Table]

  Best Quarter: 11.20% (6/30/2020)
Worst Quarter: -22.05% (3/31/2020)
The Fund's Class F total return (pre-tax) from January 1, 2026 to June 30, 2026 was 4.41%.


Bar Chart Closing [Text Block]

Best Quarter: 11.20% (6/30/2020)
Worst Quarter: -22.05% (3/31/2020)
The Fund's Class F total return (pre-tax) from January 1, 2026 to June 30, 2026 was 4.41%.

Year to Date Return, Label [Optional Text] Class F total return (pre-tax)
Bar Chart, Year to Date Return 4.41%
Bar Chart, Year to Date Return, Date Jun. 30, 2026
Highest Quarterly Return, Label [Optional Text] Best Quarter:
Highest Quarterly Return 11.20%
Highest Quarterly Return, Date Jun. 30, 2020
Lowest Quarterly Return, Label [Optional Text] Worst Quarter:
Lowest Quarterly Return (22.05%)
Lowest Quarterly Return, Date Mar. 31, 2020
Performance Table Heading Average Annual Total Returns (for the periods ended December 31, 2025)
Performance Table Narrative

This table compares the Fund's average annual total returns for Class F Shares to those of the S&P 500 Index (a broad-based securities market index) and an additional index with characteristics relevant to the Fund's investment strategy. The Fund's additional index is the Fund's blended benchmark that is composed of the ICE BofA US 3-Month Treasury Bill Index (USD), the ICE BofA US High Yield Constrained Index (USD), the S&P 500 Index and the MSCI EAFE Index, weighted 15%/20%/60%/5%.

After-tax returns are calculated using the historical highest individual federal marginal income tax rates and do not reflect the impact of state and local taxes. Your actual after-tax returns will depend on your tax situation and may differ from those shown. After-tax returns shown are not relevant to investors who hold their Fund shares through tax-deferred arrangements, such as 401(k) plans or individual retirement accounts.

Performance Table Uses Highest Federal Rate After-tax returns are calculated using the historical highest individual federal marginal income tax rates and do not reflect the impact of state and local taxes.
Performance Table Not Relevant to Tax Deferred Your actual after-tax returns will depend on your tax situation and may differ from those shown. After-tax returns shown are not relevant to investors who hold their Fund shares through tax-deferred arrangements, such as 401(k) plans or individual retirement accounts.
Performance [Table]

Moderate Strategy Allocation Fund — Class F


1 Year


5 Years


10 Years

  Since
Inception
(11/17/2003)
 

Return Before Taxes


10.49

%


7.88

%


7.72

%


7.51

%


Return After Taxes on Distributions


6.42

%


4.72

%


5.09

%


5.78

%


Return After Taxes on Distributions and Sale of Fund Shares


8.23

%


5.41

%


5.45

%


5.70

%


S&P 500 Index Return (reflects no deduction for fees, expenses or taxes)


17.88

%


14.42

%


14.82

%


10.97

%


Blended Benchmark Return (reflects no deduction for fees, expenses or taxes)


14.57

%


10.58

%


11.03

%


8.70

%

 
Index No Deduction for Fees, Expenses, or Taxes [Text] (reflects no deduction for fees, expenses or taxes)
Performance Availability Phone [Text] 1-800-DIAL-SEI
AGGRESSIVE STRATEGY FUND - Class F Prospectus | SAAT AGGRESSIVE STRATEGY FUND  
Prospectus [Line Items]  
Bar Chart and Performance Table [Heading] Performance Information
Performance Narrative [Text Block]

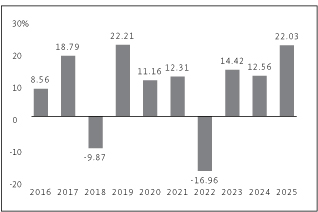
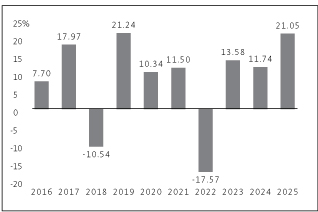
The bar chart and the performance table below provide some indication of the risks of investing in the Fund by showing changes in the Fund's performance from year to year for the past ten calendar years and by showing how the Fund's average annual returns for 1, 5 and 10 years, and since the Fund's inception, compared with those of a broad measure of market performance. The Fund's past performance (before and after taxes) is not necessarily an indication of how the Fund will perform in the future. For current performance information, please call 1-800-DIAL-SEI.

Performance Past Does Not Indicate Future [Text] The Fund's past performance (before and after taxes) is not necessarily an indication of how the Fund will perform in the future.
Performance Information Illustrates Variability of Returns [Text] The bar chart and the performance table below provide some indication of the risks of investing in the Fund by showing changes in the Fund's performance from year to year for the past ten calendar years and by showing how the Fund's average annual returns for 1, 5 and 10 years, and since the Fund's inception, compared with those of a broad measure of market performance.
Performance Additional Market Index [Text] This table compares the Fund's average annual total returns for Class F Shares to those of the S&P 500 Index (a broad-based securities market index) and an additional index with characteristics relevant to the Fund's investment strategy. The Fund's additional index is the Fund's blended benchmark that is composed of the Russell 3000 Index, the MSCI ACWI ex-USA Index and the Bloomberg U.S. Aggregate Bond Index, weighted 50%/30%/20%.
Bar Chart [Table]

  Best Quarter: 15.83% (6/30/2020)
Worst Quarter: -19.73% (3/31/2020)
The Fund's Class F total return (pre-tax) from January 1, 2026 to June 30, 2026 was 11.01%.


Bar Chart Closing [Text Block]
Best Quarter: 15.83% (6/30/2020)
Worst Quarter: -19.73% (3/31/2020)
The Fund's Class F total return (pre-tax) from January 1, 2026 to June 30, 2026 was 11.01%.
Year to Date Return, Label [Optional Text] Class F total return (pre-tax)
Bar Chart, Year to Date Return 11.01%
Bar Chart, Year to Date Return, Date Jun. 30, 2026
Highest Quarterly Return, Label [Optional Text] Best Quarter:
Highest Quarterly Return 15.83%
Highest Quarterly Return, Date Jun. 30, 2020
Lowest Quarterly Return, Label [Optional Text] Worst Quarter:
Lowest Quarterly Return (19.73%)
Lowest Quarterly Return, Date Mar. 31, 2020
Performance Table Heading Average Annual Total Returns (for the periods ended December 31, 2025)
Performance Table Narrative

This table compares the Fund's average annual total returns for Class F Shares to those of the S&P 500 Index (a broad-based securities market index) and an additional index with characteristics relevant to the Fund's investment strategy. The Fund's additional index is the Fund's blended benchmark that is composed of the Russell 3000 Index, the MSCI ACWI ex-USA Index and the Bloomberg U.S. Aggregate Bond Index, weighted 50%/30%/20%.

After-tax returns are calculated using the historical highest individual federal marginal income tax rates and do not reflect the impact of state and local taxes. Your actual after-tax returns will depend on your tax situation and may differ from those shown. After-tax returns shown are not relevant to investors who hold their Fund shares through tax-deferred arrangements, such as 401(k) plans or individual retirement accounts.

Performance Table Uses Highest Federal Rate After-tax returns are calculated using the historical highest individual federal marginal income tax rates and do not reflect the impact of state and local taxes.
Performance Table Not Relevant to Tax Deferred Your actual after-tax returns will depend on your tax situation and may differ from those shown. After-tax returns shown are not relevant to investors who hold their Fund shares through tax-deferred arrangements, such as 401(k) plans or individual retirement accounts.
Performance [Table]

Aggressive Strategy Fund — Class F


1 Year


5 Years


10 Years

  Since
Inception
(11/17/2003)
 

Return Before Taxes


22.03

%


7.95

%


8.75

%


6.91

%


Return After Taxes on Distributions


19.39

%


5.60

%


7.04

%


5.58

%


Return After Taxes on Distributions and Sale of Fund Shares


14.40

%


5.50

%


6.51

%


5.24

%


S&P 500 Index Return (reflects no deduction for fees, expenses or taxes)


17.88

%


14.42

%


14.82

%


10.97

%


Blended Benchmark Return (reflects no deduction for fees, expenses or taxes)


19.59

%


8.94

%


10.20

%


8.45

%

 
Index No Deduction for Fees, Expenses, or Taxes [Text] (reflects no deduction for fees, expenses or taxes)
Performance Availability Phone [Text] 1-800-DIAL-SEI
TAX-MANAGED AGGRESSIVE STRATEGY FUND - Class F Prospectus | SAAT TAX-MANAGED AGGRESSIVE STRATEGY FUND  
Prospectus [Line Items]  
Bar Chart and Performance Table [Heading] Performance Information
Performance Narrative [Text Block]

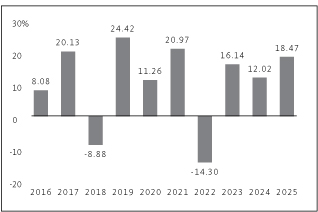
The bar chart and the performance table below provide some indication of the risks of investing in the Fund by showing changes in the Fund's performance from year to year for the past ten calendar years and by showing how the Fund's average annual returns for 1, 5 and 10 years, and since the Fund's inception, compared with those of a broad measure of market performance. The Fund's past performance (before and after taxes) is not necessarily an indication of how the Fund will perform in the future. For current performance information, please call 1-800-DIAL-SEI.

Performance Past Does Not Indicate Future [Text] The Fund's past performance (before and after taxes) is not necessarily an indication of how the Fund will perform in the future.
Performance Information Illustrates Variability of Returns [Text] The bar chart and the performance table below provide some indication of the risks of investing in the Fund by showing changes in the Fund's performance from year to year for the past ten calendar years and by showing how the Fund's average annual returns for 1, 5 and 10 years, and since the Fund's inception, compared with those of a broad measure of market performance.
Performance Additional Market Index [Text] This table compares the Fund's average annual total returns for Class F Shares to those of the S&P 500 Index (a broad-based securities market index) and an additional index with characteristics relevant to the Fund's investment strategy. The Fund's additional index is the Fund's blended benchmark that is composed of the ICE BofA US High Yield Constrained Index (USD), the S&P 500 Index and the MSCI EAFE Index, weighted 5%/80%/15%.
Bar Chart [Table]

  Best Quarter: 18.35% (6/30/2020)
Worst Quarter: -22.88% (3/31/2020)
The Fund's Class F total return (pre-tax) from January 1, 2026 to June 30, 2026 was 9.27%.


Bar Chart Closing [Text Block]
Best Quarter: 18.35% (6/30/2020)
Worst Quarter: -22.88% (3/31/2020)
The Fund's Class F total return (pre-tax) from January 1, 2026 to June 30, 2026 was 9.27%.
Year to Date Return, Label [Optional Text] Class F total return (pre-tax)
Bar Chart, Year to Date Return 9.27%
Bar Chart, Year to Date Return, Date Jun. 30, 2026
Highest Quarterly Return, Label [Optional Text] Best Quarter:
Highest Quarterly Return 18.35%
Highest Quarterly Return, Date Jun. 30, 2020
Lowest Quarterly Return, Label [Optional Text] Worst Quarter:
Lowest Quarterly Return (22.88%)
Lowest Quarterly Return, Date Mar. 31, 2020
Performance Table Heading Average Annual Total Returns (for the periods ended December 31, 2025)
Performance Table Narrative

This table compares the Fund's average annual total returns for Class F Shares to those of the S&P 500 Index (a broad-based securities market index) and an additional index with characteristics relevant to the Fund's investment strategy. The Fund's additional index is the Fund's blended benchmark that is composed of the ICE BofA US High Yield Constrained Index (USD), the S&P 500 Index and the MSCI EAFE Index, weighted 5%/80%/15%.

After-tax returns are calculated using the historical highest individual federal marginal income tax rates and do not reflect the impact of state and local taxes. Your actual after-tax returns will depend on your tax situation and may differ from those shown. After-tax returns shown are not relevant to investors who hold their Fund shares through tax-deferred arrangements, such as 401(k) plans or individual retirement accounts.

Performance Table Uses Highest Federal Rate After-tax returns are calculated using the historical highest individual federal marginal income tax rates and do not reflect the impact of state and local taxes.
Performance Table Not Relevant to Tax Deferred Your actual after-tax returns will depend on your tax situation and may differ from those shown. After-tax returns shown are not relevant to investors who hold their Fund shares through tax-deferred arrangements, such as 401(k) plans or individual retirement accounts.
Performance [Table]

Tax-Managed Aggressive Strategy Fund — Class F


1 Year


5 Years


10 Years

  Since
Inception
(11/17/2003)
 

Return Before Taxes


18.47

%


9.83

%


10.10

%


8.15

%


Return After Taxes on Distributions


15.50

%


7.87

%


8.70

%


7.23

%


Return After Taxes on Distributions and Sale of Fund Shares


12.58

%


7.32

%


7.91

%


6.66

%


S&P 500 Index Return (reflects no deduction for fees, expenses or taxes)


17.88

%


14.42

%


14.82

%


10.97

%


Blended Benchmark Return (reflects no deduction for fees, expenses or taxes)


19.40

%


13.16

%


13.45

%


10.22

%

 
Index No Deduction for Fees, Expenses, or Taxes [Text] (reflects no deduction for fees, expenses or taxes)
Performance Availability Phone [Text] 1-800-DIAL-SEI
CORE MARKET STRATEGY FUND - Class F Prospectus | SAAT CORE MARKET STRATEGY FUND  
Prospectus [Line Items]  
Bar Chart and Performance Table [Heading] Performance Information
Performance Narrative [Text Block]

The bar chart and the performance table below provide some indication of the risks of investing in the Fund by showing changes in the Fund's performance from year to year for the past ten calendar years and by showing how the Fund's average annual returns for 1, 5 and 10 years, and since the Fund's inception, compared with those of a broad measure of market performance. The Fund's past performance (before and after taxes) is not necessarily an indication of how the Fund will perform in the future. For current performance information, please call 1-800-DIAL-SEI.

Performance Past Does Not Indicate Future [Text] The Fund's past performance (before and after taxes) is not necessarily an indication of how the Fund will perform in the future.
Performance Information Illustrates Variability of Returns [Text] The bar chart and the performance table below provide some indication of the risks of investing in the Fund by showing changes in the Fund's performance from year to year for the past ten calendar years and by showing how the Fund's average annual returns for 1, 5 and 10 years, and since the Fund's inception, compared with those of a broad measure of market performance.
Performance Additional Market Index [Text] This table compares the Fund's average annual total returns for Class F Shares to those of the Bloomberg U.S. Aggregate Bond Index (a broad-based securities market index) and an additional index with characteristics relevant to the Fund's investment strategy. The Fund's additional index is the Fund's blended benchmark that is composed of the Bloomberg U.S. Aggregate Bond Index, the Russell 3000 Index and the MSCI ACWI ex-USA Index, weighted 50%/30%/20%.
Bar Chart [Table]

  Best Quarter: 11.01% (6/30/2020)
Worst Quarter: -13.12% (3/31/2020)
The Fund's Class F total return (pre-tax) from January 1, 2026 to June 30, 2026 was 7.00%.


Bar Chart Closing [Text Block]
Best Quarter: 11.01% (6/30/2020)
Worst Quarter: -13.12% (3/31/2020)
The Fund's Class F total return (pre-tax) from January 1, 2026 to June 30, 2026 was 7.00%.
Year to Date Return, Label [Optional Text] Class F total return (pre-tax)
Bar Chart, Year to Date Return 7.00%
Bar Chart, Year to Date Return, Date Jun. 30, 2026
Highest Quarterly Return, Label [Optional Text] Best Quarter:
Highest Quarterly Return 11.01%
Highest Quarterly Return, Date Jun. 30, 2020
Lowest Quarterly Return, Label [Optional Text] Worst Quarter:
Lowest Quarterly Return (13.12%)
Lowest Quarterly Return, Date Mar. 31, 2020
Performance Table Heading Average Annual Total Returns (for the periods ended December 31, 2025)
Performance Table Narrative

This table compares the Fund's average annual total returns for Class F Shares to those of the Bloomberg U.S. Aggregate Bond Index (a broad-based securities market index) and an additional index with characteristics relevant to the Fund's investment strategy. The Fund's additional index is the Fund's blended benchmark that is composed of the Bloomberg U.S. Aggregate Bond Index, the Russell 3000 Index and the MSCI ACWI ex-USA Index, weighted 50%/30%/20%.

After-tax returns are calculated using the historical highest individual federal marginal income tax rates and do not reflect the impact of state and local taxes. Your actual after-tax returns will depend on your tax situation and may differ from those shown. After-tax returns shown are not relevant to investors who hold their Fund shares through tax-deferred arrangements, such as 401(k) plans or individual retirement accounts.

Performance Table Uses Highest Federal Rate After-tax returns are calculated using the historical highest individual federal marginal income tax rates and do not reflect the impact of state and local taxes.
Performance Table Not Relevant to Tax Deferred Your actual after-tax returns will depend on your tax situation and may differ from those shown. After-tax returns shown are not relevant to investors who hold their Fund shares through tax-deferred arrangements, such as 401(k) plans or individual retirement accounts.
Performance [Table]

Core Market Strategy Fund — Class F


1 Year


5 Years


10 Years

  Since
Inception
(11/17/2003)
 

Return Before Taxes


15.11

%


4.71

%


6.11

%


5.31

%


Return After Taxes on Distributions


13.81

%


2.74

%


4.37

%


3.80

%


Return After Taxes on Distributions and Sale of Fund Shares


9.06

%


2.93

%


4.19

%


3.68

%

 
Bloomberg U.S. Aggregate Bond Index Return (reflects no deduction
for fees, expenses or taxes)
   

7.30

%


-0.36

%


2.01

%


3.27

%


Blended Benchmark Return (reflects no deduction for fees, expenses or taxes)


15.08

%


5.39

%


7.13

%


6.61

%

 
Index No Deduction for Fees, Expenses, or Taxes [Text] (reflects no deduction for fees, expenses or taxes)
Performance Availability Phone [Text] 1-800-DIAL-SEI
CORE MARKET STRATEGY ALLOCATION FUND - Class F Prospectus | SAAT CORE MARKET STRATEGY ALLOCATION FUND  
Prospectus [Line Items]  
Bar Chart and Performance Table [Heading] Performance Information
Performance Narrative [Text Block]

The bar chart and the performance table below provide some indication of the risks of investing in the Fund by showing changes in the Fund's performance from year to year for the past ten calendar years and by showing how the Fund's average annual returns for 1, 5 and 10 years, and since the Fund's inception, compared with those of a broad measure of market performance. The Fund's past performance (before and after taxes) is not necessarily an indication of how the Fund will perform in the future. For current performance information, please call 1-800-DIAL-SEI.

Performance Past Does Not Indicate Future [Text] The Fund's past performance (before and after taxes) is not necessarily an indication of how the Fund will perform in the future.
Performance Information Illustrates Variability of Returns [Text] The bar chart and the performance table below provide some indication of the risks of investing in the Fund by showing changes in the Fund's performance from year to year for the past ten calendar years and by showing how the Fund's average annual returns for 1, 5 and 10 years, and since the Fund's inception, compared with those of a broad measure of market performance.
Performance Additional Market Index [Text] This table compares the Fund's average annual total returns for Class F Shares to those of the S&P 500 Index (a broad-based securities market index) and an additional index with characteristics relevant to the Fund's investment strategy. The Fund's additional index is the Fund's blended benchmark that is composed of the ICE BofA US High Yield Constrained Index (USD), the S&P 500 Index and the MSCI EAFE Index, weighted 10%/75%/15%.
Bar Chart [Table]

  Best Quarter: 18.33% (6/30/2020)
Worst Quarter: -22.91% (3/31/2020)
The Fund's Class F total return (pre-tax) from January 1, 2026 to June 30, 2026 was 9.30%.


Bar Chart Closing [Text Block]

Best Quarter: 18.33% (6/30/2020)
Worst Quarter: -22.91% (3/31/2020)
The Fund's Class F total return (pre-tax) from January 1, 2026 to June 30, 2026 was 9.30%.

Year to Date Return, Label [Optional Text] Class F total return (pre-tax)
Bar Chart, Year to Date Return 9.30%
Bar Chart, Year to Date Return, Date Jun. 30, 2026
Highest Quarterly Return, Label [Optional Text] Best Quarter:
Highest Quarterly Return 18.33%
Highest Quarterly Return, Date Jun. 30, 2020
Lowest Quarterly Return, Label [Optional Text] Worst Quarter:
Lowest Quarterly Return (22.91%)
Lowest Quarterly Return, Date Mar. 31, 2020
Performance Table Heading Average Annual Total Returns (for the periods ended December 31, 2025)
Performance Table Narrative

This table compares the Fund's average annual total returns for Class F Shares to those of the S&P 500 Index (a broad-based securities market index) and an additional index with characteristics relevant to the Fund's investment strategy. The Fund's additional index is the Fund's blended benchmark that is composed of the ICE BofA US High Yield Constrained Index (USD), the S&P 500 Index and the MSCI EAFE Index, weighted 10%/75%/15%.

After-tax returns are calculated using the historical highest individual federal marginal income tax rates and do not reflect the impact of state and local taxes. Your actual after-tax returns will depend on your tax situation and may differ from those shown. After-tax returns shown are not relevant to investors who hold their Fund shares through tax-deferred arrangements, such as 401(k) plans or individual retirement accounts.

Performance Table Uses Highest Federal Rate After-tax returns are calculated using the historical highest individual federal marginal income tax rates and do not reflect the impact of state and local taxes.
Performance Table Not Relevant to Tax Deferred Your actual after-tax returns will depend on your tax situation and may differ from those shown. After-tax returns shown are not relevant to investors who hold their Fund shares through tax-deferred arrangements, such as 401(k) plans or individual retirement accounts.
Performance [Table]

Core Market Strategy Allocation Fund — Class F


1 Year


5 Years


10 Years

  Since
Inception
(11/17/2003)
 

Return Before Taxes


18.42

%


9.80

%


10.07

%


7.77

%


Return After Taxes on Distributions


13.98

%


7.01

%


8.12

%


6.55

%


Return After Taxes on Distributions and Sale of Fund Shares


13.64

%


7.22

%


7.80

%


6.24

%


S&P 500 Index Return (reflects no deduction for fees, expenses or taxes)


17.88

%


14.42

%


14.82

%


10.97

%


Blended Benchmark Return (reflects no deduction for fees, expenses or taxes)


18.92

%


12.67

%


13.04

%


10.03

%

 
Index No Deduction for Fees, Expenses, or Taxes [Text] (reflects no deduction for fees, expenses or taxes)
Performance Availability Phone [Text] 1-800-DIAL-SEI
MARKET GROWTH STRATEGY FUND - Class F Prospectus | SAAT MARKET GROWTH STRATEGY FUND  
Prospectus [Line Items]  
Bar Chart and Performance Table [Heading] Performance Information
Performance Narrative [Text Block]

The bar chart and the performance table below provide some indication of the risks of investing in the Fund by showing changes in the Fund's performance from year to year for the past ten calendar years and by showing how the Fund's average annual returns for 1, 5 and 10 years, and since the Fund's inception, compared with those of a broad measure of market performance. The Fund's past performance (before and after taxes) is not necessarily an indication of how the Fund will perform in the future. For current performance information, please call 1-800-DIAL-SEI.

Performance Past Does Not Indicate Future [Text] The Fund's past performance (before and after taxes) is not necessarily an indication of how the Fund will perform in the future.
Performance Information Illustrates Variability of Returns [Text] The bar chart and the performance table below provide some indication of the risks of investing in the Fund by showing changes in the Fund's performance from year to year for the past ten calendar years and by showing how the Fund's average annual returns for 1, 5 and 10 years, and since the Fund's inception, compared with those of a broad measure of market performance.
Performance Additional Market Index [Text] This table compares the Fund's average annual total returns for Class F Shares to those of the S&P 500 Index (a broad-based securities market index) and an additional index with characteristics relevant to the Fund's investment strategy. The Fund's additional index is the Fund's blended benchmark that is composed of the Bloomberg U.S. Aggregate Bond Index, the Russell 3000 Index and the MSCI ACWI ex-USA Index, weighted 40%/35%/25%.
Bar Chart [Table]

  Best Quarter: 12.89% (6/30/2020)
Worst Quarter: -15.97% (3/31/2020)
The Fund's Class F total return (pre-tax) from January 1, 2026 to June 30, 2026 was 8.58%.


Bar Chart Closing [Text Block]

Best Quarter: 12.89% (6/30/2020)
Worst Quarter: -15.97% (3/31/2020)
The Fund's Class F total return (pre-tax) from January 1, 2026 to June 30, 2026 was 8.58%.

Year to Date Return, Label [Optional Text] Class F total return (pre-tax)
Bar Chart, Year to Date Return 8.58%
Bar Chart, Year to Date Return, Date Jun. 30, 2026
Highest Quarterly Return, Label [Optional Text] Best Quarter:
Highest Quarterly Return 12.89%
Highest Quarterly Return, Date Jun. 30, 2020
Lowest Quarterly Return, Label [Optional Text] Worst Quarter:
Lowest Quarterly Return (15.97%)
Lowest Quarterly Return, Date Mar. 31, 2020
Performance Table Heading Average Annual Total Returns (for the periods ended December 31, 2025)
Performance Table Narrative

This table compares the Fund's average annual total returns for Class F Shares to those of the S&P 500 Index (a broad-based securities market index) and an additional index with characteristics relevant to the Fund's investment strategy. The Fund's additional index is the Fund's blended benchmark that is composed of the Bloomberg U.S. Aggregate Bond Index, the Russell 3000 Index and the MSCI ACWI ex-USA Index, weighted 40%/35%/25%.

After-tax returns are calculated using the historical highest individual federal marginal income tax rates and do not reflect the impact of state and local taxes. Your actual after-tax returns will depend on your tax situation and may differ from those shown. After-tax returns shown are not relevant to investors who hold their Fund shares through tax-deferred arrangements, such as 401(k) plans or individual retirement accounts.

Performance Table Uses Highest Federal Rate After-tax returns are calculated using the historical highest individual federal marginal income tax rates and do not reflect the impact of state and local taxes.
Performance Table Not Relevant to Tax Deferred Your actual after-tax returns will depend on your tax situation and may differ from those shown. After-tax returns shown are not relevant to investors who hold their Fund shares through tax-deferred arrangements, such as 401(k) plans or individual retirement accounts.
Performance [Table]

Market Growth Strategy Fund — Class F


1 Year


5 Years


10 Years

  Since
Inception
(11/17/2003)
 

Return Before Taxes


17.72

%


6.21

%


7.20

%


5.88

%


Return After Taxes on Distributions


15.89

%


4.01

%


5.55

%


4.49

%


Return After Taxes on Distributions and Sale of Fund Shares


10.92

%


4.08

%


5.15

%


4.26

%


S&P 500 Index Return (reflects no deduction for fees, expenses or taxes)


17.88

%


14.42

%


14.82

%


10.97

%


Blended Benchmark Return (reflects no deduction for fees, expenses or taxes)


16.81

%


6.49

%


8.07

%


7.19

%

 
Index No Deduction for Fees, Expenses, or Taxes [Text] (reflects no deduction for fees, expenses or taxes)
Performance Availability Phone [Text] 1-800-DIAL-SEI
MARKET GROWTH STRATEGY ALLOCATION FUND -Class F Prospectus | SAAT MARKET GROWTH STRATEGY ALLOCATION FUND  
Prospectus [Line Items]  
Bar Chart and Performance Table [Heading] Performance Information
Performance Narrative [Text Block]

The bar chart and the performance table below provide some indication of the risks of investing in the Fund by showing changes in the Fund's performance from year to year for the past ten calendar years and by showing how the Fund's average annual returns for 1, 5 and 10 years, and since the Fund's inception, compared with those of a broad measure of market performance. The Fund's past performance (before and after taxes) is not necessarily an indication of how the Fund will perform in the future. For current performance information, please call 1-800-DIAL-SEI.

Performance Past Does Not Indicate Future [Text] The Fund's past performance (before and after taxes) is not necessarily an indication of how the Fund will perform in the future.
Performance Information Illustrates Variability of Returns [Text] The bar chart and the performance table below provide some indication of the risks of investing in the Fund by showing changes in the Fund's performance from year to year for the past ten calendar years and by showing how the Fund's average annual returns for 1, 5 and 10 years, and since the Fund's inception, compared with those of a broad measure of market performance.
Performance Additional Market Index [Text] This table compares the Fund's average annual total returns for Class F Shares to those of the S&P 500 Index (a broad-based securities market index) and an additional index with characteristics relevant to the Fund's investment strategy. The Fund's additional index is the Fund's blended benchmark that is composed of the ICE BofA US High Yield Constrained Index, the S&P 500 Index and the MSCI EAFE Index, weighted 10%/75%/15%.
Bar Chart [Table]

  Best Quarter: 18.33% (6/30/2020)
Worst Quarter: -22.92% (3/31/2020)
The Fund's Class F total return (pre-tax) from January 1, 2026 to June 30, 2026 was 9.30%.


Bar Chart Closing [Text Block]

Best Quarter: 18.33% (6/30/2020)
Worst Quarter: -22.92% (3/31/2020)
The Fund's Class F total return (pre-tax) from January 1, 2026 to June 30, 2026 was 9.30%.

Year to Date Return, Label [Optional Text] Class F total return (pre-tax)
Bar Chart, Year to Date Return 9.30%
Bar Chart, Year to Date Return, Date Jun. 30, 2026
Highest Quarterly Return, Label [Optional Text] Best Quarter:
Highest Quarterly Return 18.33%
Highest Quarterly Return, Date Jun. 30, 2020
Lowest Quarterly Return, Label [Optional Text] Worst Quarter:
Lowest Quarterly Return (22.92%)
Lowest Quarterly Return, Date Mar. 31, 2020
Performance Table Heading Average Annual Total Returns (for the periods ended December 31, 2025)
Performance Table Narrative

This table compares the Fund's average annual total returns for Class F Shares to those of the S&P 500 Index (a broad-based securities market index) and an additional index with characteristics relevant to the Fund's investment strategy. The Fund's additional index is the Fund's blended benchmark that is composed of the ICE BofA US High Yield Constrained Index, the S&P 500 Index and the MSCI EAFE Index, weighted 10%/75%/15%.

After-tax returns are calculated using the historical highest individual federal marginal income tax rates and do not reflect the impact of state and local taxes. Your actual after-tax returns will depend on your tax situation and may differ from those shown. After-tax returns shown are not relevant to investors who hold their Fund shares through tax-deferred arrangements, such as 401(k) plans or individual retirement accounts.

Performance Table Uses Highest Federal Rate After-tax returns are calculated using the historical highest individual federal marginal income tax rates and do not reflect the impact of state and local taxes.
Performance Table Not Relevant to Tax Deferred Your actual after-tax returns will depend on your tax situation and may differ from those shown. After-tax returns shown are not relevant to investors who hold their Fund shares through tax-deferred arrangements, such as 401(k) plans or individual retirement accounts.
Performance [Table]

Market Growth Strategy Allocation Fund — Class F


1 Year


5 Years


10 Years

  Since
Inception
(11/17/2003)
 

Return Before Taxes


18.43

%


9.81

%


10.09

%


7.96

%


Return After Taxes on Distributions


15.21

%


7.66

%


8.62

%


6.98

%


Return After Taxes on Distributions and Sale of Fund Shares


12.73

%


7.30

%


7.91

%


6.47

%


S&P 500 Index Return (reflects no deduction for fees, expenses or taxes)


17.88

%


14.42

%


14.82

%


10.97

%


Blended Benchmark Return (reflects no deduction for fees, expenses or taxes)


18.92

%


12.67

%


13.04

%


10.03

%

 
Index No Deduction for Fees, Expenses, or Taxes [Text] (reflects no deduction for fees, expenses or taxes)
Performance Availability Phone [Text] 1-800-DIAL-SEI
DEFENSIVE STRATEGY FUND - Class D Prospectus | SAAT DEFENSIVE STRATEGY FUND  
Prospectus [Line Items]  
Bar Chart and Performance Table [Heading] Performance Information
Performance Narrative [Text Block]

As of July 31, 2025, the Class D Shares of the Fund had not commenced operations. The bar chart and the performance table below provide some indication of the risks of investing in the Class D Shares of the Fund by showing changes in the Fund's Class F Shares performance from year to year for the past ten calendar years and by showing how the Fund's Class F Shares average annual returns for 1, 5 and 10 years, and since the Fund's Class F Shares inception, compared with those of a broad measure of market performance. Since Class D Shares are invested in the same portfolio of securities, returns for Class D Shares will be substantially similar to those of Class F Shares, shown here, and will differ only to the extent that Class D Shares have higher expenses. The Fund's past performance (before and after taxes) is not necessarily an indication of how the Fund will perform in the future. For current performance information, please call 1-800-DIAL-SEI.

Performance Past Does Not Indicate Future [Text] The Fund's past performance (before and after taxes) is not necessarily an indication of how the Fund will perform in the future.
Performance Information Illustrates Variability of Returns [Text] The bar chart and the performance table below provide some indication of the risks of investing in the Class D Shares of the Fund by showing changes in the Fund's Class F Shares performance from year to year for the past ten calendar years and by showing how the Fund's Class F Shares average annual returns for 1, 5 and 10 years, and since the Fund's Class F Shares inception, compared with those of a broad measure of market performance.
Performance One Year or Less [Text] As of July 31, 2025, the Class D Shares of the Fund had not commenced operations.
Performance Additional Market Index [Text] This table compares the Fund's average annual total returns for Class F Shares to those of the Bloomberg U.S. Aggregate Bond Index (a broad-based securities market index) and an additional index with characteristics relevant to the Fund's investment strategy. The Fund's additional index is the Fund's blended benchmark that is composed of the Bloomberg 1-3 Year Government/Credit Index, the Bloomberg 1-3 Month Treasury Bill Index, the Russell 3000 Index and the MSCI ACWI ex-USA Index, weighted 70%/20%/5%/5%.
Bar Chart, Returns for Class Not Offered in Prospectus [Text] Since Class D Shares are invested in the same portfolio of securities, returns for Class D Shares will be substantially similar to those of Class F Shares, shown here, and will differ only to the extent that Class D Shares have higher expenses.
Bar Chart [Table]

  Best Quarter: 3.24% (12/31/2023)
Worst Quarter: -2.70% (3/31/2020)
The Fund's Class F total return (pre-tax) from January 1, 2026 to June 30, 2026 was 1.86%.


Bar Chart Closing [Text Block]
Best Quarter: 3.24% (12/31/2023)
Worst Quarter: -2.70% (3/31/2020)
The Fund's Class F total return (pre-tax) from January 1, 2026 to June 30, 2026 was 1.86%.
Year to Date Return, Label [Optional Text] Class F total return (pre-tax)
Bar Chart, Year to Date Return 1.86%
Bar Chart, Year to Date Return, Date Jun. 30, 2026
Highest Quarterly Return, Label [Optional Text] Best Quarter:
Highest Quarterly Return 3.24%
Highest Quarterly Return, Date Dec. 31, 2023
Lowest Quarterly Return, Label [Optional Text] Worst Quarter:
Lowest Quarterly Return (2.70%)
Lowest Quarterly Return, Date Mar. 31, 2020
Performance Table Heading Average Annual Total Returns (for the periods ended December 31, 2025)
Performance Table Narrative

This table compares the Fund's average annual total returns for Class F Shares to those of the Bloomberg U.S. Aggregate Bond Index (a broad-based securities market index) and an additional index with characteristics relevant to the Fund's investment strategy. The Fund's additional index is the Fund's blended benchmark that is composed of the Bloomberg 1-3 Year Government/Credit Index, the Bloomberg 1-3 Month Treasury Bill Index, the Russell 3000 Index and the MSCI ACWI ex-USA Index, weighted 70%/20%/5%/5%.

After-tax returns are calculated using the historical highest individual federal marginal income tax rates and do not reflect the impact of state and local taxes. Your actual after-tax returns will depend on your tax situation and may differ from those shown. After-tax returns shown are not relevant to investors who hold their Fund shares through tax-deferred arrangements, such as 401(k) plans or individual retirement accounts.

Performance Table Uses Highest Federal Rate After-tax returns are calculated using the historical highest individual federal marginal income tax rates and do not reflect the impact of state and local taxes.
Performance Table Not Relevant to Tax Deferred Your actual after-tax returns will depend on your tax situation and may differ from those shown. After-tax returns shown are not relevant to investors who hold their Fund shares through tax-deferred arrangements, such as 401(k) plans or individual retirement accounts.
Performance [Table]

Defensive Strategy Fund — Class F


1 Year


5 Years


10 Years

  Since
Inception
(11/17/2003)
 

Return Before Taxes


6.29

%


3.01

%


2.90

%


2.49

%


Return After Taxes on Distributions


4.97

%


1.61

%


1.83

%


1.54

%


Return After Taxes on Distributions and Sale of Fund Shares


3.76

%


1.74

%


1.80

%


1.56

%

 
Bloomberg U.S. Aggregate Bond Index Return (reflects no deduction
for fees, expenses or taxes)
   

7.30

%


-0.36

%


2.01

%


3.27

%

 
Blended Benchmark Return (reflects no deduction for fees, expenses
or taxes)
   

6.96

%


3.14

%


3.10

%


2.98

%

 
Index No Deduction for Fees, Expenses, or Taxes [Text] (reflects no deduction for fees, expenses or taxes)
Performance Availability Phone [Text] 1-800-DIAL-SEI
CONSERVATIVE STRATEGY FUND - Class D Prospectus | SAAT CONSERVATIVE STRATEGY FUND  
Prospectus [Line Items]  
Bar Chart and Performance Table [Heading] Performance Information
Performance Narrative [Text Block]

The bar chart and the performance table below provide some indication of the risks of investing in the Fund by showing changes in the Fund's performance from year to year for the past ten calendar years and by showing how the Fund's average annual returns for 1, 5 and 10 years, and since the Fund's inception, compared with those of a broad measure of market performance. The Fund's past performance (before and after taxes) is not necessarily an indication of how the Fund will perform in the future. For current performance information, please call 1-800-DIAL-SEI.

Performance Past Does Not Indicate Future [Text] The Fund's past performance (before and after taxes) is not necessarily an indication of how the Fund will perform in the future.
Performance Information Illustrates Variability of Returns [Text] The bar chart and the performance table below provide some indication of the risks of investing in the Fund by showing changes in the Fund's performance from year to year for the past ten calendar years and by showing how the Fund's average annual returns for 1, 5 and 10 years, and since the Fund's inception, compared with those of a broad measure of market performance.
Performance Additional Market Index [Text] This table compares the Fund's average annual total returns to those of the Bloomberg U.S. Aggregate Bond Index (a broad-based securities market index) and an additional index with characteristics relevant to the Fund's investment strategy. The Fund's additional index is the Fund's blended benchmark that is composed of the Bloomberg 1-3 Year Government/Credit Index, the Bloomberg U.S. Aggregate Bond Index, the Russell 3000 Index and the MSCI ACWI ex-USA Index weighted 70%/10%/10%/10%.
Bar Chart [Table]

  Best Quarter: 4.88% (6/30/2020)
Worst Quarter: -6.72% (3/31/2020)
The Fund's Class D total return (pre-tax) from January 1, 2026 to June 30, 2026 was 2.02%.


Bar Chart Closing [Text Block]

Best Quarter: 4.88% (6/30/2020)
Worst Quarter: -6.72% (3/31/2020)
The Fund's Class D total return (pre-tax) from January 1, 2026 to June 30, 2026 was 2.02%.

Year to Date Return, Label [Optional Text] Class D total return (pre-tax)
Bar Chart, Year to Date Return 2.02%
Bar Chart, Year to Date Return, Date Jun. 30, 2026
Highest Quarterly Return, Label [Optional Text] Best Quarter:
Highest Quarterly Return 4.88%
Highest Quarterly Return, Date Jun. 30, 2020
Lowest Quarterly Return, Label [Optional Text] Worst Quarter:
Lowest Quarterly Return (6.72%)
Lowest Quarterly Return, Date Mar. 31, 2020
Performance Table Heading Average Annual Total Returns (for the periods ended December 31, 2025)
Performance Table Narrative

This table compares the Fund's average annual total returns to those of the Bloomberg U.S. Aggregate Bond Index (a broad-based securities market index) and an additional index with characteristics relevant to the Fund's investment strategy. The Fund's additional index is the Fund's blended benchmark that is composed of the Bloomberg 1-3 Year Government/Credit Index, the Bloomberg U.S. Aggregate Bond Index, the Russell 3000 Index and the MSCI ACWI ex-USA Index weighted 70%/10%/10%/10%.

After-tax returns are calculated using the historical highest individual federal marginal income tax rates and do not reflect the impact of state and local taxes. Your actual after-tax returns will depend on your tax situation and may differ from those shown. After-tax returns shown are not relevant to investors who hold their Fund shares through tax-deferred arrangements, such as 401(k) plans or individual retirement accounts.

Performance Table Uses Highest Federal Rate After-tax returns are calculated using the historical highest individual federal marginal income tax rates and do not reflect the impact of state and local taxes.
Performance Table Not Relevant to Tax Deferred Your actual after-tax returns will depend on your tax situation and may differ from those shown. After-tax returns shown are not relevant to investors who hold their Fund shares through tax-deferred arrangements, such as 401(k) plans or individual retirement accounts.
Performance [Table]

Conservative Strategy Fund*


1 Year


5 Years


10 Years

  Since
Inception
(11/17/2003)
 

Return Before Taxes


7.62

%


2.82

%


3.01

%


2.46

%


Return After Taxes on Distributions


6.62

%


1.66

%


2.14

%


1.55

%


Return After Taxes on Distributions and Sale of Fund Shares


4.57

%


1.73

%


2.00

%


1.56

%

 
Bloomberg U.S. Aggregate Bond Index Return (reflects no deduction
for fees, expenses or taxes)
   

7.30

%


-0.36

%


2.01

%


3.27

%

 
Blended Benchmark Return (reflects no deduction for fees, expenses
or taxes)
   

9.23

%


3.54

%


4.05

%


3.95

%


* The Fund's Class D Shares commenced operations on March 25, 2011. For periods prior to March 25, 2011, the performance of the Fund's Class F Shares, adjusted for the higher total annual fund operating expenses of the Class D Shares has been used. Returns for Class D Shares would have been substantially similar to those of Class F Shares and would have differed only to the extent that Class D Shares have higher total annual fund operating expenses than Class F Shares.

Index No Deduction for Fees, Expenses, or Taxes [Text] (reflects no deduction for fees, expenses or taxes)
Performance Availability Phone [Text] 1-800-DIAL-SEI
MODERATE STRATEGY FUND - Class D Prospectus | SAAT MODERATE STRATEGY FUND  
Prospectus [Line Items]  
Bar Chart and Performance Table [Heading] Performance Information
Performance Narrative [Text Block]

The bar chart and the performance table below provide some indication of the risks of investing in the Fund by showing changes in the Fund's performance from year to year for the past ten calendar years and by showing how the Fund's average annual returns for 1, 5 and 10 years, and since the Fund's inception, compared with those of a broad measure of market performance. The Fund's past performance (before and after taxes) is not necessarily an indication of how the Fund will perform in the future. For current performance information, please call 1-800-DIAL-SEI.

Performance Past Does Not Indicate Future [Text] The Fund's past performance (before and after taxes) is not necessarily an indication of how the Fund will perform in the future.
Performance Information Illustrates Variability of Returns [Text] The bar chart and the performance table below provide some indication of the risks of investing in the Fund by showing changes in the Fund's performance from year to year for the past ten calendar years and by showing how the Fund's average annual returns for 1, 5 and 10 years, and since the Fund's inception, compared with those of a broad measure of market performance.
Performance Additional Market Index [Text] This table compares the Fund's average annual total returns to those of the Bloomberg U.S. Aggregate Bond Index (a broad-based securities market index) and an additional index with characteristics relevant to the Fund's investment strategy. The Fund's additional index is the Fund's blended benchmark that is composed of the Bloomberg 1-3 Year Government/Credit Index, the Bloomberg U.S. Aggregate Bond Index, the Russell 3000 Index and the MSCI ACWI ex-USA Index, weighted 35%/30%/20%/15%.
Bar Chart [Table]

  Best Quarter: 6.89% (6/30/2020)
Worst Quarter: -10.14% (3/31/2020)
The Fund's Class D total return (pre-tax) from January 1, 2026 to June 30, 2026 was 3.77%.


Bar Chart Closing [Text Block]

Best Quarter: 6.89% (6/30/2020)
Worst Quarter: -10.14% (3/31/2020)
The Fund's Class D total return (pre-tax) from January 1, 2026 to June 30, 2026 was 3.77%.

Year to Date Return, Label [Optional Text] Class D total return (pre-tax)
Bar Chart, Year to Date Return 3.77%
Bar Chart, Year to Date Return, Date Jun. 30, 2026
Highest Quarterly Return, Label [Optional Text] Best Quarter:
Highest Quarterly Return 6.89%
Highest Quarterly Return, Date Jun. 30, 2020
Lowest Quarterly Return, Label [Optional Text] Worst Quarter:
Lowest Quarterly Return (10.14%)
Lowest Quarterly Return, Date Mar. 31, 2020
Performance Table Heading Average Annual Total Returns (for the periods ended December 31, 2025)
Performance Table Narrative

This table compares the Fund's average annual total returns to those of the Bloomberg U.S. Aggregate Bond Index (a broad-based securities market index) and an additional index with characteristics relevant to the Fund's investment strategy. The Fund's additional index is the Fund's blended benchmark that is composed of the Bloomberg 1-3 Year Government/Credit Index, the Bloomberg U.S. Aggregate Bond Index, the Russell 3000 Index and the MSCI ACWI ex-USA Index, weighted 35%/30%/20%/15%.

After-tax returns are calculated using the historical highest individual federal marginal income tax rates and do not reflect the impact of state and local taxes. Your actual after-tax returns will depend on your tax situation and may differ from those shown. After-tax returns shown are not relevant to investors who hold their Fund shares through tax-deferred arrangements, such as 401(k) plans or individual retirement accounts.

Performance Table Uses Highest Federal Rate After-tax returns are calculated using the historical highest individual federal marginal income tax rates and do not reflect the impact of state and local taxes.
Performance Table Not Relevant to Tax Deferred Your actual after-tax returns will depend on your tax situation and may differ from those shown. After-tax returns shown are not relevant to investors who hold their Fund shares through tax-deferred arrangements, such as 401(k) plans or individual retirement accounts.
Performance [Table]

Moderate Strategy Fund*


1 Year


5 Years


10 Years

  Since
Inception
(11/17/2003)
 

Return Before Taxes


10.72

%


3.44

%


4.16

%


3.68

%


Return After Taxes on Distributions


9.72

%


2.07

%


3.12

%


2.60

%


Return After Taxes on Distributions and Sale of Fund Shares


6.44

%


2.16

%


2.87

%


2.49

%

 
Bloomberg U.S. Aggregate Bond Index Return (reflects no deduction
for fees, expenses or taxes)
   

7.30

%


-0.36

%


2.01

%


3.27

%

 
Blended Benchmark Return (reflects no deduction for fees, expenses
or taxes)
   

12.13

%


4.50

%


5.62

%


5.30

%


* The Fund's Class D Shares commenced operations on March 25, 2011. For periods prior to March 25, 2011, the performance of the Fund's Class F Shares, adjusted for the higher total annual fund operating expenses of the Class D Shares has been used. Returns for Class D Shares would have been substantially similar to those of Class F Shares and would have differed only to the extent that Class D Shares have higher total annual fund operating expenses than Class F Shares.

Index No Deduction for Fees, Expenses, or Taxes [Text] (reflects no deduction for fees, expenses or taxes)
Performance Availability Phone [Text] 1-800-DIAL-SEI
AGGRESSIVE STRATEGY FUND - Class D Prospectus | SAAT AGGRESSIVE STRATEGY FUND  
Prospectus [Line Items]  
Bar Chart and Performance Table [Heading] Performance Information
Performance Narrative [Text Block]

The bar chart and the performance table below provide some indication of the risks of investing in the Fund by showing changes in the Fund's performance from year to year for the past ten calendar years and by showing how the Fund's average annual returns for 1, 5 and 10 years, and since the Fund's inception, compared with those of a broad measure of market performance. The Fund's past performance (before and after taxes) is not necessarily an indication of how the Fund will perform in the future. For current performance information, please call 1-800-DIAL-SEI.

Performance Past Does Not Indicate Future [Text] The Fund's past performance (before and after taxes) is not necessarily an indication of how the Fund will perform in the future.
Performance Information Illustrates Variability of Returns [Text] The bar chart and the performance table below provide some indication of the risks of investing in the Fund by showing changes in the Fund's performance from year to year for the past ten calendar years and by showing how the Fund's average annual returns for 1, 5 and 10 years, and since the Fund's inception, compared with those of a broad measure of market performance.
Performance Additional Market Index [Text] This table compares the Fund's average annual total returns to those of the S&P 500 Index (a broad-based securities market index) and an additional index with characteristics relevant to the Fund's investment strategy. The Fund's additional index is the Fund's blended benchmark that is composed of the Russell 3000 Index, the MSCI ACWI ex-USA Index and the Bloomberg U.S. Aggregate Bond Index, weighted 50%/30%/20%
Bar Chart [Table]

  Best Quarter: 15.59% (6/30/2020)
Worst Quarter: -19.83% (3/31/2020)
The Fund's Class D total return (pre-tax) from January 1, 2026 to June 30, 2026 was 10.67%.


Bar Chart Closing [Text Block]
Best Quarter: 15.59% (6/30/2020)
Worst Quarter: -19.83% (3/31/2020)
The Fund's Class D total return (pre-tax) from January 1, 2026 to June 30, 2026 was 10.67%.
Year to Date Return, Label [Optional Text] Class D total return (pre-tax)
Bar Chart, Year to Date Return 10.67%
Bar Chart, Year to Date Return, Date Jun. 30, 2026
Highest Quarterly Return, Label [Optional Text] Best Quarter:
Highest Quarterly Return 15.59%
Highest Quarterly Return, Date Jun. 30, 2020
Lowest Quarterly Return, Label [Optional Text] Worst Quarter:
Lowest Quarterly Return (19.83%)
Lowest Quarterly Return, Date Mar. 31, 2020
Performance Table Heading Average Annual Total Returns (for the periods ended December 31, 2025)
Performance Table Narrative

This table compares the Fund's average annual total returns to those of the S&P 500 Index (a broad-based securities market index) and an additional index with characteristics relevant to the Fund's investment strategy. The Fund's additional index is the Fund's blended benchmark that is composed of the Russell 3000 Index, the MSCI ACWI ex-USA Index and the Bloomberg U.S. Aggregate Bond Index, weighted 50%/30%/20%.

After-tax returns are calculated using the historical highest individual federal marginal income tax rates and do not reflect the impact of state and local taxes. Your actual after-tax returns will depend on your tax situation and may differ from those shown. After-tax returns shown are not relevant to investors who hold their Fund shares through tax-deferred arrangements, such as 401(k) plans or individual retirement accounts.

Performance Table Uses Highest Federal Rate After-tax returns are calculated using the historical highest individual federal marginal income tax rates and do not reflect the impact of state and local taxes.
Performance Table Not Relevant to Tax Deferred Your actual after-tax returns will depend on your tax situation and may differ from those shown. After-tax returns shown are not relevant to investors who hold their Fund shares through tax-deferred arrangements, such as 401(k) plans or individual retirement accounts.
Performance [Table]

Aggressive Strategy Fund*


1 Year


5 Years


10 Years

  Since
Inception
(11/17/2003)
 

Return Before Taxes


21.05

%


7.14

%


7.94

%


5.92

%


Return After Taxes on Distributions


18.65

%


4.99

%


6.43

%


4.68

%


Return After Taxes on Distributions and Sale of Fund Shares


13.80

%


4.96

%


5.94

%


4.40

%


S&P 500 Index Return (reflects no deduction for fees, expenses or taxes)


17.88

%


14.42

%


14.82

%


10.97

%

 
Blended Benchmark Return (reflects no deduction for fees, expenses
or taxes)
   

19.59

%


8.94

%


10.20

%


8.45

%


* The Fund's Class D Shares commenced operations on March 25, 2011. For periods prior to March 25, 2011, the performance of the Fund's Class F Shares, adjusted for the higher total annual fund operating expenses of the Class D Shares has been used. Returns for Class D Shares would have been substantially similar to those of Class F Shares and would have differed only to the extent that Class D Shares have higher total annual fund operating expenses than Class F Shares.

Index No Deduction for Fees, Expenses, or Taxes [Text] (reflects no deduction for fees, expenses or taxes)
Performance Availability Phone [Text] 1-800-DIAL-SEI
CORE MARKET STRATEGY FUND - Class D Prospectus | SAAT CORE MARKET STRATEGY FUND  
Prospectus [Line Items]  
Bar Chart and Performance Table [Heading] Performance Information
Performance Narrative [Text Block]

As of July 31, 2025, the Class D Shares of the Fund had not commenced operations. The bar chart and the performance table below provide some indication of the risks of investing in the Fund by showing changes in the Fund's Class F Shares performance from year to year for the past ten calendar years and by showing how the Fund's Class F Shares average annual returns for 1, 5 and 10 years, and since the Fund's Class F Shares inception, compared with those of a broad measure of market performance. Since Class D Shares are invested in the same portfolio of securities, returns for Class D Shares will be substantially similar to those of Class F Shares, shown here, and will differ only to the extent that Class D Shares have higher expenses. The Fund's past performance (before and after taxes) is not necessarily an indication of how the Fund will perform in the future. For current performance information, please call 1-800-DIAL-SEI.

Performance Past Does Not Indicate Future [Text] The Fund's past performance (before and after taxes) is not necessarily an indication of how the Fund will perform in the future.
Performance Information Illustrates Variability of Returns [Text] The bar chart and the performance table below provide some indication of the risks of investing in the Fund by showing changes in the Fund's Class F Shares performance from year to year for the past ten calendar years and by showing how the Fund's Class F Shares average annual returns for 1, 5 and 10 years, and since the Fund's Class F Shares inception, compared with those of a broad measure of market performance.
Performance One Year or Less [Text] As of July 31, 2025, the Class D Shares of the Fund had not commenced operations.
Performance Additional Market Index [Text] This table compares the Fund's average annual total returns for Class F Shares to those of the Bloomberg U.S. Aggregate Bond Index (a broad-based securities market index) and an additional index with characteristics relevant to the Fund's investment strategy. The Fund's additional index is the Fund's blended benchmark that is composed of the Bloomberg U.S. Aggregate Bond Index, the Russell 3000 Index and the MSCI ACWI ex-USA Index, weighted 50%/30%/20%.
Bar Chart, Returns for Class Not Offered in Prospectus [Text] Since Class D Shares are invested in the same portfolio of securities, returns for Class D Shares will be substantially similar to those of Class F Shares, shown here, and will differ only to the extent that Class D Shares have higher expenses.
Bar Chart [Table]

  Best Quarter: 11.01% (6/30/2020)
Worst Quarter: -13.12% (3/31/2020)
The Fund's Class F total return (pre-tax) from January 1, 2026 to June 30, 2026 was 7.00%.


Bar Chart Closing [Text Block]
Best Quarter: 11.01% (6/30/2020)
Worst Quarter: -13.12% (3/31/2020)
The Fund's Class F total return (pre-tax) from January 1, 2026 to June 30, 2026 was 7.00%.
Year to Date Return, Label [Optional Text] Class F total return (pre-tax)
Bar Chart, Year to Date Return 7.00%
Bar Chart, Year to Date Return, Date Jun. 30, 2026
Highest Quarterly Return, Label [Optional Text] Best Quarter:
Highest Quarterly Return 11.01%
Highest Quarterly Return, Date Jun. 30, 2020
Lowest Quarterly Return, Label [Optional Text] Worst Quarter:
Lowest Quarterly Return (13.12%)
Lowest Quarterly Return, Date Mar. 31, 2020
Performance Table Heading Average Annual Total Returns (for the periods ended December 31, 2025)
Performance Table Narrative

This table compares the Fund's average annual total returns for Class F Shares to those of the Bloomberg U.S. Aggregate Bond Index (a broad-based securities market index) and an additional index with characteristics relevant to the Fund's investment strategy. The Fund's additional index is the Fund's blended benchmark that is composed of the Bloomberg U.S. Aggregate Bond Index, the Russell 3000 Index and the MSCI ACWI ex-USA Index, weighted 50%/30%/20%.

After-tax returns are calculated using the historical highest individual federal marginal income tax rates and do not reflect the impact of state and local taxes. Your actual after-tax returns will depend on your tax situation and may differ from those shown. After-tax returns shown are not relevant to investors who hold their Fund shares through tax-deferred arrangements, such as 401(k) plans or individual retirement accounts.

Performance Table Uses Highest Federal Rate After-tax returns are calculated using the historical highest individual federal marginal income tax rates and do not reflect the impact of state and local taxes.
Performance Table Not Relevant to Tax Deferred Your actual after-tax returns will depend on your tax situation and may differ from those shown. After-tax returns shown are not relevant to investors who hold their Fund shares through tax-deferred arrangements, such as 401(k) plans or individual retirement accounts.
Performance [Table]

Core Market Strategy Fund — Class F


1 Year


5 Years


10 Years

  Since
Inception
(11/17/2003)
 

Return Before Taxes


15.11

%


4.71

%


6.11

%


5.31

%


Return After Taxes on Distributions


13.81

%


2.74

%


4.37

%


3.80

%


Return After Taxes on Distributions and Sale of Fund Shares


9.06

%


2.93

%


4.19

%


3.68

%

 
Bloomberg U.S. Aggregate Bond Index Return (reflects no deduction
for fees, expenses or taxes)
   

7.30

%


-0.36

%


2.01

%


3.27

%

 
Blended Benchmark Return (reflects no deduction for fees, expenses
or taxes)
   

15.08

%


5.39

%


7.13

%


6.61

%

 
Index No Deduction for Fees, Expenses, or Taxes [Text] (reflects no deduction for fees, expenses or taxes)
Performance Availability Phone [Text] 1-800-DIAL-SEI
MARKET GROWTH STRATEGY FUND - Class D Prospectus | SAAT MARKET GROWTH STRATEGY FUND  
Prospectus [Line Items]  
Bar Chart and Performance Table [Heading] Performance Information
Performance Narrative [Text Block]

The bar chart and the performance table below provide some indication of the risks of investing in the Fund by showing changes in the Fund's performance from year to year for the past ten calendar years and by showing how the Fund's average annual returns for 1, 5 and 10 years, and since the Fund's inception, compared with those of a broad measure of market performance. The Fund's past performance (before and after taxes) is not necessarily an indication of how the Fund will perform in the future. For current performance information, please call 1-800-DIAL-SEI.

Performance Past Does Not Indicate Future [Text] The Fund's past performance (before and after taxes) is not necessarily an indication of how the Fund will perform in the future.
Performance Information Illustrates Variability of Returns [Text] The bar chart and the performance table below provide some indication of the risks of investing in the Fund by showing changes in the Fund's performance from year to year for the past ten calendar years and by showing how the Fund's average annual returns for 1, 5 and 10 years, and since the Fund's inception, compared with those of a broad measure of market performance.
Performance Additional Market Index [Text] This table compares the Fund's average annual total returns to those of the S&P 500 Index (a broad-based securities market index) and an additional index with characteristics relevant to the Fund's investment strategy. The Fund's additional index is the Fund's blended benchmark that is composed of the Bloomberg U.S. Aggregate Bond Index, the Russell 3000 Index and the MSCI ACWI ex-USA Index, weighted 40%/35%/25%.
Bar Chart [Table]

  Best Quarter: 12.62% (6/30/2020)
Worst Quarter: -16.04% (3/31/2020)
The Fund's Class D total return (pre-tax) from January 1, 2026 to June 30, 2026 was 8.22%.


Bar Chart Closing [Text Block]

Best Quarter: 12.62% (6/30/2020)
Worst Quarter: -16.04% (3/31/2020)
The Fund's Class D total return (pre-tax) from January 1, 2026 to June 30, 2026 was 8.22%.

Year to Date Return, Label [Optional Text] Class D total return (pre-tax)
Bar Chart, Year to Date Return 8.22%
Bar Chart, Year to Date Return, Date Jun. 30, 2026
Highest Quarterly Return, Label [Optional Text] Best Quarter:
Highest Quarterly Return 12.62%
Highest Quarterly Return, Date Jun. 30, 2020
Lowest Quarterly Return, Label [Optional Text] Worst Quarter:
Lowest Quarterly Return (16.04%)
Lowest Quarterly Return, Date Mar. 31, 2020
Performance Table Heading Average Annual Total Returns (for the periods ended December 31, 2025)
Performance Table Narrative

This table compares the Fund's average annual total returns to those of the S&P 500 Index (a broad-based securities market index) and an additional index with characteristics relevant to the Fund's investment strategy. The Fund's additional index is the Fund's blended benchmark that is composed of the Bloomberg U.S. Aggregate Bond Index, the Russell 3000 Index and the MSCI ACWI ex-USA Index, weighted 40%/35%/25%.

After-tax returns are calculated using the historical highest individual federal marginal income tax rates and do not reflect the impact of state and local taxes. Your actual after-tax returns will depend on your tax situation and may differ from those shown. After-tax returns shown are not relevant to investors who hold their Fund shares through tax-deferred arrangements, such as 401(k) plans or individual retirement accounts.

Performance Table Uses Highest Federal Rate After-tax returns are calculated using the historical highest individual federal marginal income tax rates and do not reflect the impact of state and local taxes.
Performance Table Not Relevant to Tax Deferred Your actual after-tax returns will depend on your tax situation and may differ from those shown. After-tax returns shown are not relevant to investors who hold their Fund shares through tax-deferred arrangements, such as 401(k) plans or individual retirement accounts.
Performance [Table]

Market Growth Strategy Fund*


1 Year


5 Years


10 Years

  Since
Inception
(11/17/2003)
 

Return Before Taxes


16.86

%


5.41

%


6.41

%


4.89

%


Return After Taxes on Distributions


15.35

%


3.51

%


5.04

%


3.67

%


Return After Taxes on Distributions and Sale of Fund Shares


10.39

%


3.59

%


4.64

%


3.48

%


S&P 500 Index Return (reflects no deduction for fees, expenses or taxes)


17.88

%


14.42

%


14.82

%


10.97

%

 
Blended Benchmark Return (reflects no deduction for fees, expenses
or taxes)
   

16.81

%


6.49

%


8.07

%


7.19

%


* The Fund's Class D Shares commenced operations on March 25, 2011. For periods prior to March 25, 2011, the performance of the Fund's Class F Shares, adjusted for the higher total annual fund operating expenses of the Class D Shares has been used. Returns for Class D Shares would have been substantially similar to those of Class F Shares and would have differed only to the extent that Class D Shares have higher total annual fund operating expenses than Class F Shares.

Index No Deduction for Fees, Expenses, or Taxes [Text] (reflects no deduction for fees, expenses or taxes)
Performance Availability Phone [Text] 1-800-DIAL-SEI
DEFENSIVE STRATEGY FUND - Class I Prospectus | SAAT DEFENSIVE STRATEGY FUND  
Prospectus [Line Items]  
Bar Chart and Performance Table [Heading] Performance Information
Performance Narrative [Text Block]

The bar chart and the performance table below provide some indication of the risks of investing in the Fund by showing changes in the Fund's performance from year to year for the past ten calendar years and by showing how the Fund's average annual returns for 1, 5 and 10 years, and since the Fund's inception, compared with those of a broad measure of market performance. The Fund's past performance (before and after taxes) is not necessarily an indication of how the Fund will perform in the future. For current performance information, please call 1-800-DIAL-SEI.

Performance Past Does Not Indicate Future [Text] The Fund's past performance (before and after taxes) is not necessarily an indication of how the Fund will perform in the future.
Performance Information Illustrates Variability of Returns [Text] The bar chart and the performance table below provide some indication of the risks of investing in the Fund by showing changes in the Fund's performance from year to year for the past ten calendar years and by showing how the Fund's average annual returns for 1, 5 and 10 years, and since the Fund's inception, compared with those of a broad measure of market performance.
Performance Additional Market Index [Text] This table compares the Fund's average annual total returns for Class I Shares to those of the Bloomberg U.S. Aggregate Bond Index (a broad-based securities market index) and an additional index with characteristics relevant to the Fund's investment strategy. The Fund's additional index is the Fund's blended benchmark that is composed of the Bloomberg 1-3 Year Government/Credit Index, the Bloomberg 1-3 Month Treasury Bill Index, the Russell 3000 Index and the MSCI ACWI ex-USA Index, weighted 70%/20%/5%/5%.
Bar Chart [Table]

  Best Quarter: 3.17% (12/31/2023)
Worst Quarter: -2.85% (3/31/2020)
The Fund's Class I total return (pre-tax) from January 1, 2026 to June 30, 2026 was 1.73%.


Bar Chart Closing [Text Block]

Best Quarter: 3.17% (12/31/2023)
Worst Quarter: -2.85% (3/31/2020)
The Fund's Class I total return (pre-tax) from January 1, 2026 to June 30, 2026 was 1.73%.

Year to Date Return, Label [Optional Text] Class I total return (pre-tax)
Bar Chart, Year to Date Return 1.73%
Bar Chart, Year to Date Return, Date Jun. 30, 2026
Highest Quarterly Return, Label [Optional Text] Best Quarter:
Highest Quarterly Return 3.17%
Highest Quarterly Return, Date Dec. 31, 2023
Lowest Quarterly Return, Label [Optional Text] Worst Quarter:
Lowest Quarterly Return (2.85%)
Lowest Quarterly Return, Date Mar. 31, 2020
Performance Table Heading Average Annual Total Returns (for the periods ended December 31, 2025)
Performance Table Narrative

This table compares the Fund's average annual total returns for Class I Shares to those of the Bloomberg U.S. Aggregate Bond Index (a broad-based securities market index) and an additional index with characteristics relevant to the Fund's investment strategy. The Fund's additional index is the Fund's blended benchmark that is composed of the Bloomberg 1-3 Year Government/Credit Index, the Bloomberg 1-3 Month Treasury Bill Index, the Russell 3000 Index and the MSCI ACWI ex-USA Index, weighted 70%/20%/5%/5%.

After-tax returns are calculated using the historical highest individual federal marginal income tax rates and do not reflect the impact of state and local taxes. Your actual after-tax returns will depend on your tax situation and may differ from those shown. After-tax returns shown are not relevant to investors who hold their Fund shares through tax-deferred arrangements, such as 401(k) plans or individual retirement accounts.

Performance Table Uses Highest Federal Rate After-tax returns are calculated using the historical highest individual federal marginal income tax rates and do not reflect the impact of state and local taxes.
Performance Table Not Relevant to Tax Deferred Your actual after-tax returns will depend on your tax situation and may differ from those shown. After-tax returns shown are not relevant to investors who hold their Fund shares through tax-deferred arrangements, such as 401(k) plans or individual retirement accounts.
Performance [Table]

Defensive Strategy Fund — Class I


1 Year


5 Years


10 Years

  Since
Inception
(11/17/2003)
 

Return Before Taxes


6.05

%


2.73

%


2.63

%


2.24

%


Return After Taxes on Distributions


4.80

%


1.42

%


1.65

%


1.35

%


Return After Taxes on Distributions and Sale of Fund Shares


3.62

%


1.57

%


1.63

%


1.39

%

 
Bloomberg U.S. Aggregate Bond Index Return (reflects no deduction
for fees, expenses or taxes)
   

7.30

%


-0.36

%


2.01

%


3.27

%


Blended Benchmark Return (reflects no deduction for fees, expenses or taxes)


6.96

%


3.14

%


3.10

%


2.98

%

 
Index No Deduction for Fees, Expenses, or Taxes [Text] (reflects no deduction for fees, expenses or taxes)
Performance Availability Phone [Text] 1-800-DIAL-SEI
CONSERVATIVE STRATEGY FUND - Class I Prospectus | SAAT CONSERVATIVE STRATEGY FUND  
Prospectus [Line Items]  
Bar Chart and Performance Table [Heading] Performance Information
Performance Narrative [Text Block]

The bar chart and the performance table below provide some indication of the risks of investing in the Fund by showing changes in the Fund's performance from year to year for the past ten calendar years and by showing how the Fund's average annual returns for 1, 5 and 10 years, and since the Fund's inception, compared with those of a broad measure of market performance. The Fund's past performance (before and after taxes) is not necessarily an indication of how the Fund will perform in the future. For current performance information, please call 1-800-DIAL-SEI.

Performance Past Does Not Indicate Future [Text] The Fund's past performance (before and after taxes) is not necessarily an indication of how the Fund will perform in the future.
Performance Information Illustrates Variability of Returns [Text] The bar chart and the performance table below provide some indication of the risks of investing in the Fund by showing changes in the Fund's performance from year to year for the past ten calendar years and by showing how the Fund's average annual returns for 1, 5 and 10 years, and since the Fund's inception, compared with those of a broad measure of market performance.
Performance Additional Market Index [Text] This table compares the Fund's average annual total returns for Class I Shares to those of the Bloomberg U.S. Aggregate Bond Index (a broad-based securities market index) and an additional index with characteristics relevant to the Fund's investment strategy. The Fund's additional index is the Fund's blended benchmark that is composed of the Bloomberg 1-3 Year Government/Credit Index, the Bloomberg U.S. Aggregate Bond Index, the Russell 3000 Index and the MSCI ACWI ex-USA Index weighted 70%/10%/10%/10%.
Bar Chart [Table]

  Best Quarter: 4.91% (6/30/2020)
Worst Quarter: -6.59% (3/31/2020)
The Fund's Class I total return (pre-tax) from January 1, 2026 to June 30, 2026 was 2.28%.


Bar Chart Closing [Text Block]

Best Quarter: 4.91% (6/30/2020)
Worst Quarter: -6.59% (3/31/2020)
The Fund's Class I total return (pre-tax) from January 1, 2026 to June 30, 2026 was 2.28%.

Year to Date Return, Label [Optional Text] Class I total return (pre-tax)
Bar Chart, Year to Date Return 2.28%
Bar Chart, Year to Date Return, Date Jun. 30, 2026
Highest Quarterly Return, Label [Optional Text] Best Quarter:
Highest Quarterly Return 4.91%
Highest Quarterly Return, Date Jun. 30, 2020
Lowest Quarterly Return, Label [Optional Text] Worst Quarter:
Lowest Quarterly Return (6.59%)
Lowest Quarterly Return, Date Mar. 31, 2020
Performance Table Heading Average Annual Total Returns (for the periods ended December 31, 2025)
Performance Table Narrative

This table compares the Fund's average annual total returns for Class I Shares to those of the Bloomberg U.S. Aggregate Bond Index (a broad-based securities market index) and an additional index with characteristics relevant to the Fund's investment strategy. The Fund's additional index is the Fund's blended benchmark that is composed of the Bloomberg 1-3 Year Government/Credit Index, the Bloomberg U.S. Aggregate Bond Index, the Russell 3000 Index and the MSCI ACWI ex-USA Index weighted 70%/10%/10%/10%.

After-tax returns are calculated using the historical highest individual federal marginal income tax rates and do not reflect the impact of state and local taxes. Your actual after-tax returns will depend on your tax situation and may differ from those shown. After-tax returns shown are not relevant to investors who hold their Fund shares through tax-deferred arrangements, such as 401(k) plans or individual retirement accounts.

Performance Table Uses Highest Federal Rate After-tax returns are calculated using the historical highest individual federal marginal income tax rates and do not reflect the impact of state and local taxes.
Performance Table Not Relevant to Tax Deferred Your actual after-tax returns will depend on your tax situation and may differ from those shown. After-tax returns shown are not relevant to investors who hold their Fund shares through tax-deferred arrangements, such as 401(k) plans or individual retirement accounts.
Performance [Table]

Conservative Strategy Fund — Class I


1 Year


5 Years


10 Years

  Since
Inception
(11/17/2003)
 

Return Before Taxes


8.13

%


3.35

%


3.55

%


3.27

%


Return After Taxes on Distributions


6.96

%


2.02

%


2.50

%


2.25

%


Return After Taxes on Distributions and Sale of Fund Shares


4.88

%


2.06

%


2.35

%


2.17

%

 
Bloomberg U.S. Aggregate Bond Index Return (reflects no deduction
for fees, expenses or taxes)
   

7.30

%


-0.36

%


2.01

%


3.27

%


Blended Benchmark Return (reflects no deduction for fees, expenses or taxes)


9.23

%


3.54

%


4.05

%


3.95

%

 
Index No Deduction for Fees, Expenses, or Taxes [Text] (reflects no deduction for fees, expenses or taxes)
Performance Availability Phone [Text] 1-800-DIAL-SEI
MODERATE STRATEGY FUND - Class I Prospectus | SAAT MODERATE STRATEGY FUND  
Prospectus [Line Items]  
Bar Chart and Performance Table [Heading] Performance Information
Performance Narrative [Text Block]

The bar chart and the performance table below provide some indication of the risks of investing in the Fund by showing changes in the Fund's performance from year to year for the past ten calendar years and by showing how the Fund's average annual returns for 1, 5 and 10 years, and since the Fund's inception, compared with those of a broad measure of market performance. The Fund's past performance (before and after taxes) is not necessarily an indication of how the Fund will perform in the future. For current performance information, please call 1-800-DIAL-SEI.

Performance Past Does Not Indicate Future [Text] The Fund's past performance (before and after taxes) is not necessarily an indication of how the Fund will perform in the future.
Performance Information Illustrates Variability of Returns [Text] The bar chart and the performance table below provide some indication of the risks of investing in the Fund by showing changes in the Fund's performance from year to year for the past ten calendar years and by showing how the Fund's average annual returns for 1, 5 and 10 years, and since the Fund's inception, compared with those of a broad measure of market performance.
Performance Additional Market Index [Text] This table compares the Fund's average annual total returns for Class I Shares to those of the Bloomberg U.S. Aggregate Bond Index (a broad-based securities market index) and an additional index with characteristics relevant to the Fund's investment strategy. The Fund's additional index is the Fund's blended benchmark that is composed of the Bloomberg 1-3 Year Government/Credit Index, the Bloomberg U.S. Aggregate Bond Index, the Russell 3000 Index and the MSCI ACWI ex-USA Index, weighted 35%/30%/20%/15%.
Bar Chart [Table]

  Best Quarter: 6.99% (6/30/2020)
Worst Quarter: -10.00% (3/31/2020)
The Fund's Class I total return (pre-tax) from January 1, 2026 to June 30, 2026 was 4.01%.


Bar Chart Closing [Text Block]

Best Quarter: 6.99% (6/30/2020)
Worst Quarter: -10.00% (3/31/2020)
The Fund's Class I total return (pre-tax) from January 1, 2026 to June 30, 2026 was 4.01%.

Year to Date Return, Label [Optional Text] Class I total return (pre-tax)
Bar Chart, Year to Date Return 4.01%
Bar Chart, Year to Date Return, Date Jun. 30, 2026
Highest Quarterly Return, Label [Optional Text] Best Quarter:
Highest Quarterly Return 6.99%
Highest Quarterly Return, Date Jun. 30, 2020
Lowest Quarterly Return, Label [Optional Text] Worst Quarter:
Lowest Quarterly Return (10.00%)
Lowest Quarterly Return, Date Mar. 31, 2020
Performance Table Heading Average Annual Total Returns (for the periods ended December 31, 2025)
Performance Table Narrative

This table compares the Fund's average annual total returns for Class I Shares to those of the Bloomberg U.S. Aggregate Bond Index (a broad-based securities market index) and an additional index with characteristics relevant to the Fund's investment strategy. The Fund's additional index is the Fund's blended benchmark that is composed of the Bloomberg 1-3 Year Government/Credit Index, the Bloomberg U.S. Aggregate Bond Index, the Russell 3000 Index and the MSCI ACWI ex-USA Index, weighted 35%/30%/20%/15%.

After-tax returns are calculated using the historical highest individual federal marginal income tax rates and do not reflect the impact of state and local taxes. Your actual after-tax returns will depend on your tax situation and may differ from those shown. After-tax returns shown are not relevant to investors who hold their Fund shares through tax-deferred arrangements, such as 401(k) plans or individual retirement accounts.

Performance Table Uses Highest Federal Rate After-tax returns are calculated using the historical highest individual federal marginal income tax rates and do not reflect the impact of state and local taxes.
Performance Table Not Relevant to Tax Deferred Your actual after-tax returns will depend on your tax situation and may differ from those shown. After-tax returns shown are not relevant to investors who hold their Fund shares through tax-deferred arrangements, such as 401(k) plans or individual retirement accounts.
Performance [Table]

Moderate Strategy Fund — Class I


1 Year


5 Years


10 Years

  Since
Inception
(11/17/2003)
 

Return Before Taxes


11.19

%


3.95

%


4.67

%


4.51

%


Return After Taxes on Distributions


10.04

%


2.42

%


3.46

%


3.35

%


Return After Taxes on Distributions and Sale of Fund Shares


6.73

%


2.48

%


3.20

%


3.16

%

 
Bloomberg U.S. Aggregate Bond Index Return (reflects no deduction
for fees, expenses or taxes)
   

7.30

%


-0.36

%


2.01

%


3.27

%


Blended Benchmark Return (reflects no deduction for fees, expenses or taxes)


12.13

%


4.50

%


5.62

%


5.30

%

 
Index No Deduction for Fees, Expenses, or Taxes [Text] (reflects no deduction for fees, expenses or taxes)
Performance Availability Phone [Text] 1-800-DIAL-SEI
AGGRESSIVE STRATEGY FUND - Class I Prospectus | SAAT AGGRESSIVE STRATEGY FUND  
Prospectus [Line Items]  
Bar Chart and Performance Table [Heading] Performance Information
Performance Narrative [Text Block]

The bar chart and the performance table below provide some indication of the risks of investing in the Fund by showing changes in the Fund's performance from year to year for the past ten calendar years and by showing how the Fund's average annual returns for 1, 5 and 10 years, and since the Fund's inception, compared with those of a broad measure of market performance. The Fund's past performance (before and after taxes) is not necessarily an indication of how the Fund will perform in the future. For current performance information, please call 1-800-DIAL-SEI.

Performance Past Does Not Indicate Future [Text] The Fund's past performance (before and after taxes) is not necessarily an indication of how the Fund will perform in the future.
Performance Information Illustrates Variability of Returns [Text] The bar chart and the performance table below provide some indication of the risks of investing in the Fund by showing changes in the Fund's performance from year to year for the past ten calendar years and by showing how the Fund's average annual returns for 1, 5 and 10 years, and since the Fund's inception, compared with those of a broad measure of market performance.
Performance Additional Market Index [Text] This table compares the Fund's average annual total returns for Class I Shares to those of the S&P 500 Index (a broad-based securities market index) and an additional index with characteristics relevant to the Fund's investment strategy. The Fund's additional index is the Fund's blended benchmark that is composed of the Russell 3000 Index, the MSCI ACWI ex-USA Index and the Bloomberg U.S. Aggregate Bond Index, weighted 50%/30%/20%.
Bar Chart [Table]

  Best Quarter: 15.81% (6/30/2020)
Worst Quarter: -19.77% (3/31/2020)
The Fund's Class I total return (pre-tax) from January 1, 2026 to June 30, 2026 was 10.93%.


Bar Chart Closing [Text Block]

Best Quarter: 15.81% (6/30/2020)
Worst Quarter: -19.77% (3/31/2020)
The Fund's Class I total return (pre-tax) from January 1, 2026 to June 30, 2026 was 10.93%.

Year to Date Return, Label [Optional Text] Class I total return (pre-tax)
Bar Chart, Year to Date Return 10.93%
Bar Chart, Year to Date Return, Date Jun. 30, 2026
Highest Quarterly Return, Label [Optional Text] Best Quarter:
Highest Quarterly Return 15.81%
Highest Quarterly Return, Date Jun. 30, 2020
Lowest Quarterly Return, Label [Optional Text] Worst Quarter:
Lowest Quarterly Return (19.77%)
Lowest Quarterly Return, Date Mar. 31, 2020
Performance Table Heading Average Annual Total Returns (for the periods ended December 31, 2025)
Performance Table Narrative

This table compares the Fund's average annual total returns for Class I Shares to those of the S&P 500 Index (a broad-based securities market index) and an additional index with characteristics relevant to the Fund's investment strategy. The Fund's additional index is the Fund's blended benchmark that is composed of the Russell 3000 Index, the MSCI ACWI ex-USA Index and the Bloomberg U.S. Aggregate Bond Index, weighted 50%/30%/20%.

After-tax returns are calculated using the historical highest individual federal marginal income tax rates and do not reflect the impact of state and local taxes. Your actual after-tax returns will depend on your tax situation and may differ from those shown. After-tax returns shown are not relevant to investors who hold their Fund shares through tax-deferred arrangements, such as 401(k) plans or individual retirement accounts.

Performance Table Uses Highest Federal Rate After-tax returns are calculated using the historical highest individual federal marginal income tax rates and do not reflect the impact of state and local taxes.
Performance Table Not Relevant to Tax Deferred Your actual after-tax returns will depend on your tax situation and may differ from those shown. After-tax returns shown are not relevant to investors who hold their Fund shares through tax-deferred arrangements, such as 401(k) plans or individual retirement accounts.
Performance [Table]

Aggressive Strategy Fund — Class I


1 Year


5 Years


10 Years

  Since
Inception
(11/17/2003)
 

Return Before Taxes


21.63

%


7.69

%


8.49

%


6.60

%


Return After Taxes on Distributions


18.98

%


5.35

%


6.81

%


5.31

%


Return After Taxes on Distributions and Sale of Fund Shares


14.20

%


5.31

%


6.31

%


5.00

%


S&P 500 Index Return (reflects no deduction for fees, expenses or taxes)


17.88

%


14.42

%


14.82

%


10.97

%


Blended Benchmark Return (reflects no deduction for fees, expenses or taxes)


19.59

%


8.94

%


10.20

%


8.45

%

 
Index No Deduction for Fees, Expenses, or Taxes [Text] (reflects no deduction for fees, expenses or taxes)
Performance Availability Phone [Text] 1-800-DIAL-SEI
CORE MARKET STRATEGY FUND - Class I Prospectus | SAAT CORE MARKET STRATEGY FUND  
Prospectus [Line Items]  
Bar Chart and Performance Table [Heading] Performance Information
Performance Narrative [Text Block]

The bar chart and the performance table below provide some indication of the risks of investing in the Fund by showing changes in the Fund's performance from year to year for the past ten calendar years and by showing how the Fund's average annual returns for 1, 5 and 10 years, and since the Fund's inception, compared with those of a broad measure of market performance. The Fund's past performance (before and after taxes) is not necessarily an indication of how the Fund will perform in the future. For current performance information, please call 1-800-DIAL-SEI.

Performance Past Does Not Indicate Future [Text] The Fund's past performance (before and after taxes) is not necessarily an indication of how the Fund will perform in the future.
Performance Information Illustrates Variability of Returns [Text] The bar chart and the performance table below provide some indication of the risks of investing in the Fund by showing changes in the Fund's performance from year to year for the past ten calendar years and by showing how the Fund's average annual returns for 1, 5 and 10 years, and since the Fund's inception, compared with those of a broad measure of market performance.
Performance Additional Market Index [Text] This table compares the Fund's average annual total returns for Class I Shares to those of the Bloomberg U.S. Aggregate Bond Index (a broad-based securities market index) and an additional index with characteristics relevant to the Fund's investment strategy. The Fund's additional index is the Fund's blended benchmark that is composed of the Bloomberg U.S. Aggregate Bond Index, the Russell 3000 Index and the MSCI ACWI ex-USA Index, weighted 50%/30%/20%.
Bar Chart [Table]

  Best Quarter: 11.33% (6/30/2020)
Worst Quarter: -13.06% (3/31/2020)
The Fund's Class I total return (pre-tax) from January 1, 2026 to June 30, 2026 was 7.09%.


Bar Chart Closing [Text Block]

Best Quarter: 11.33% (6/30/2020)
Worst Quarter: -13.06% (3/31/2020)
The Fund's Class I total return (pre-tax) from January 1, 2026 to June 30, 2026 was 7.09%.

Year to Date Return, Label [Optional Text] Class I total return (pre-tax)
Bar Chart, Year to Date Return 7.09%
Bar Chart, Year to Date Return, Date Jun. 30, 2026
Highest Quarterly Return, Label [Optional Text] Best Quarter:
Highest Quarterly Return 11.33%
Highest Quarterly Return, Date Jun. 30, 2020
Lowest Quarterly Return, Label [Optional Text] Worst Quarter:
Lowest Quarterly Return (13.06%)
Lowest Quarterly Return, Date Mar. 31, 2020
Performance Table Heading Average Annual Total Returns (for the periods ended December 31, 2025)
Performance Table Narrative

This table compares the Fund's average annual total returns for Class I Shares to those of the Bloomberg U.S. Aggregate Bond Index (a broad-based securities market index) and an additional index with characteristics relevant to the Fund's investment strategy. The Fund's additional index is the Fund's blended benchmark that is composed of the Bloomberg U.S. Aggregate Bond Index, the Russell 3000 Index and the MSCI ACWI ex-USA Index, weighted 50%/30%/20%.

After-tax returns are calculated using the historical highest individual federal marginal income tax rates and do not reflect the impact of state and local taxes. Your actual after-tax returns will depend on your tax situation and may differ from those shown. After-tax returns shown are not relevant to investors who hold their Fund shares through tax-deferred arrangements, such as 401(k) plans or individual retirement accounts.

Performance Table Uses Highest Federal Rate After-tax returns are calculated using the historical highest individual federal marginal income tax rates and do not reflect the impact of state and local taxes.
Performance Table Not Relevant to Tax Deferred Your actual after-tax returns will depend on your tax situation and may differ from those shown. After-tax returns shown are not relevant to investors who hold their Fund shares through tax-deferred arrangements, such as 401(k) plans or individual retirement accounts.
Performance [Table]

Core Market Strategy Fund — Class I


1 Year


5 Years


10 Years

  Since
Inception
(11/17/2003)
 

Return Before Taxes


15.47

%


5.08

%


6.40

%


5.61

%


Return After Taxes on Distributions


14.39

%


3.40

%


4.91

%


4.29

%


Return After Taxes on Distributions and Sale of Fund Shares


9.25

%


3.32

%


4.53

%


4.03

%

 
Bloomberg U.S. Aggregate Bond Index Return (reflects no deduction
for fees, expenses or taxes)
   

7.30

%


-0.36

%


2.01

%


3.27

%


Blended Benchmark Return (reflects no deduction for fees, expenses or taxes)


15.08

%


5.39

%


7.13

%


6.61

%

 
Index No Deduction for Fees, Expenses, or Taxes [Text] (reflects no deduction for fees, expenses or taxes)
Performance Availability Phone [Text] 1-800-DIAL-SEI
MARKET GROWTH STRATEGY FUND - Class I Prospectus | SAAT MARKET GROWTH STRATEGY FUND  
Prospectus [Line Items]  
Bar Chart and Performance Table [Heading] Performance Information
Performance Narrative [Text Block]

The bar chart and the performance table below provide some indication of the risks of investing in the Fund by showing changes in the Fund's performance from year to year for the past ten calendar years and by showing how the Fund's average annual returns for 1, 5 and 10 years, and since the Fund's inception, compared with those of a broad measure of market performance. The Fund's past performance (before and after taxes) is not necessarily an indication of how the Fund will perform in the future. For current performance information, please call 1-800-DIAL-SEI.

Performance Past Does Not Indicate Future [Text] The Fund's past performance (before and after taxes) is not necessarily an indication of how the Fund will perform in the future.
Performance Information Illustrates Variability of Returns [Text] The bar chart and the performance table below provide some indication of the risks of investing in the Fund by showing changes in the Fund's performance from year to year for the past ten calendar years and by showing how the Fund's average annual returns for 1, 5 and 10 years, and since the Fund's inception, compared with those of a broad measure of market performance.
Performance Additional Market Index [Text] This table compares the Fund's average annual total returns for Class I Shares to those of the S&P 500 Index (a broad-based securities market index) and an additional index with characteristics relevant to the Fund's investment strategy. The Fund's additional index is the Fund's blended benchmark that is composed of the Bloomberg U.S. Aggregate Bond Index, the Russell 3000 Index and the MSCI ACWI ex-USA Index, weighted 40%/35%/25%.
Bar Chart [Table]

  Best Quarter: 12.74% (6/30/2020)
Worst Quarter: -15.99% (3/31/2020)
The Fund's Class I total return (pre-tax) from January 1, 2026 to June 30, 2026 was 8.56%.


Bar Chart Closing [Text Block]

Best Quarter: 12.74% (6/30/2020)
Worst Quarter: -15.99% (3/31/2020)
The Fund's Class I total return (pre-tax) from January 1, 2026 to June 30, 2026 was 8.56%.

Year to Date Return, Label [Optional Text] Class I total return (pre-tax)
Bar Chart, Year to Date Return 8.56%
Bar Chart, Year to Date Return, Date Jun. 30, 2026
Highest Quarterly Return, Label [Optional Text] Best Quarter:
Highest Quarterly Return 12.74%
Highest Quarterly Return, Date Jun. 30, 2020
Lowest Quarterly Return, Label [Optional Text] Worst Quarter:
Lowest Quarterly Return (15.99%)
Lowest Quarterly Return, Date Mar. 31, 2020
Performance Table Heading Average Annual Total Returns (for the periods ended December 31, 2025)
Performance Table Narrative

This table compares the Fund's average annual total returns for Class I Shares to those of the S&P 500 Index (a broad-based securities market index) and an additional index with characteristics relevant to the Fund's investment strategy. The Fund's additional index is the Fund's blended benchmark that is composed of the Bloomberg U.S. Aggregate Bond Index, the Russell 3000 Index and the MSCI ACWI ex-USA Index, weighted 40%/35%/25%.

After-tax returns are calculated using the historical highest individual federal marginal income tax rates and do not reflect the impact of state and local taxes. Your actual after-tax returns will depend on your tax situation and may differ from those shown. After-tax returns shown are not relevant to investors who hold their Fund shares through tax-deferred arrangements, such as 401(k) plans or individual retirement accounts.

Performance Table Uses Highest Federal Rate After-tax returns are calculated using the historical highest individual federal marginal income tax rates and do not reflect the impact of state and local taxes.
Performance Table Not Relevant to Tax Deferred Your actual after-tax returns will depend on your tax situation and may differ from those shown. After-tax returns shown are not relevant to investors who hold their Fund shares through tax-deferred arrangements, such as 401(k) plans or individual retirement accounts.
Performance [Table]

Market Growth Strategy Fund — Class I


1 Year


5 Years


10 Years

  Since
Inception
(11/17/2003)
 

Return Before Taxes


17.39

%


5.94

%


6.93

%


5.61

%


Return After Taxes on Distributions


15.63

%


3.81

%


5.35

%


4.29

%


Return After Taxes on Distributions and Sale of Fund Shares


10.73

%


3.90

%


4.97

%


4.06

%


S&P 500 Index Return (reflects no deduction for fees, expenses or taxes)


17.88

%


14.42

%


14.82

%


10.97

%


Blended Benchmark Return (reflects no deduction for fees, expenses or taxes)


16.81

%


6.49

%


8.07

%


7.19

%

 
Index No Deduction for Fees, Expenses, or Taxes [Text] (reflects no deduction for fees, expenses or taxes)
Performance Availability Phone [Text] 1-800-DIAL-SEI