ProPetro Reports Financial Results for the Second Quarter of 2026 MIDLAND, Texas, July 29, 2026, (Business Wire) – ProPetro Holding Corp. ("ProPetro" or "the Company") (NYSE: PUMP) today announced financial and operational results for the second quarter of 2026. Second Quarter 2026 Results and Highlights • Total revenue of $306 million, which increased 13% as compared to $271 million for the prior quarter. • Net loss was $8 million ($0.07 loss per diluted share) as compared to a net loss of $4 million in the prior quarter ($0.03 loss per diluted share). • Adjusted EBITDA(1) of $45 million was 15% of revenue and increased 23% as compared to the prior quarter. • Capital expenditures paid were $61 million and capital expenditures incurred were $71 million. • Net cash provided by operating activities and net cash used in investing activities were $66 million and $58 million, respectively. • Free Cash Flow from Completions Business(2) was $51 million. Recent PROPWR® Highlights • Added approximately 110 megawatts of power generation capacity committed under contract across two separate projects: one supporting a leading integrated upstream operator in the Permian Basin, and another supporting a separate industrial customer. This brings total capacity committed under contract to approximately 350 megawatts. • Engaged in advanced contract negotiations for over 100 megawatts to support other oil and gas operations. • Continued advancing negotiations across multiple data center commercial opportunities, including a subset of several hundred megawatts in advanced discussions. • Assets successfully deployed and operating at a Midwest hyperscaler data center site, making PROPWR one of the first behind-the-meter power providers actively servicing a data center project at scale providing prime power. (1) Adjusted EBITDA is a non-GAAP financial measure and is described and reconciled to net income (loss) in the table under “Non-GAAP Financial Measures.” (2) Free Cash Flow for Completions Business is a non-GAAP financial measure and is described and reconciled to net cash from operating activities in the table under “Non-GAAP Financial Measures." Management Comments Sam Sledge, Chief Executive Officer, commented, “ProPetro’s second quarter results once again demonstrate the strength of our business model. While our results were negatively impacted by a few items during the quarter, including upfront costs associated with standing up our twelfth fleet, a temporary out-of-basin fleet deployment that experienced significant unexpected downtime, and severe weather interrupting our operations across the Permian Basin in June, the underlying performance of the business remained strong. Even with these impacts, our completions business generated resilient free cash flow, a clear demonstration that the industrialized model we have built is working. As we look ahead, we remain encouraged by what we are seeing across our completions business. While uncertainty remains around the broader macro environment and the subsequent impacts from the Iran War, the market continues to tighten as industry attrition has meaningfully reduced available frac capacity. Combined with disciplined capital allocation across the sector, these dynamics are creating a more constructive supply and demand environment and contributing to early pricing momentum. We are also seeing this momentum reflected in increased drilling activity, with the Permian Basin rig count up nearly EXHIBIT 99.1
10% off its first-quarter low, as operators respond to improving conditions, a leading indicator that supports the recovery we are seeing in completions. Our confidence in a more favorable operating environment going forward is also reflected in our decision to activate a thirteenth fleet, which we expect to begin contributing toward the end of the third quarter. PROPWR also continues to build meaningful momentum. Since our last earnings update, we have significantly increased our power generation capacity committed under contract to approximately 350 megawatts, while continuing to advance opportunities across the data center, oil and gas, and industrial markets. Importantly, we are no longer simply building a commercial pipeline, we now have assets successfully operating in the field and meeting performance obligations, strengthening our commercial position and providing customers with tangible examples of our execution capabilities. We believe ProPetro is well positioned with two complementary growth platforms: an increasingly constructive completions business and a rapidly expanding PROPWR platform. Supported by a strong balance sheet, disciplined capital allocation and an exceptional team, we remain confident in our ability to create long-term value for our shareholders.” Caleb Weatherl, Chief Financial Officer, commented, “ProPetro's financial strength remains a key competitive advantage and continues to support the disciplined execution of our long-term strategy. During the quarter, we generated meaningful free cash flow from our completions business while continuing investment in the growth of PROPWR, and we have since lowered our expected 2026 completions capital expenditures reflecting a slight shift in the timing of our planned FORCE® fleet buyouts. With a healthy balance sheet, strong liquidity and significant progress on the financing front, we are proud of the work we have done to position ProPetro's capital structure as we continue to scale PROPWR.” Second Quarter 2026 Financial Summary Revenue was $306 million, compared to $271 million for the first quarter of 2026. The 13% increase in revenue was primarily driven by increased utilization in the completions business and incremental deployments in the PROPWR business, partially offset by unforeseen operational disruptions during a temporary out-of-basin frac fleet deployment, along with severe weather across the Permian Basin in June. Cost of services for the second quarter of 2026 were $234 million, excluding approximately $41 million of depreciation and amortization expenses. General and administrative ("G&A") expense of $33 million increased from $27 million in the first quarter of 2026. G&A expense excluding nonrecurring and noncash items of $6 million (stock-based compensation, retention bonuses and severance expenses) was $27 million, or 9% of revenue, an increase of 20% as compared to the prior quarter, primarily due to costs associated with PROPWR's growth and related financing activities. Net loss totaled $8 million, or $0.07 loss per diluted share, compared to a net loss of $4 million, or $0.03 loss per diluted share, for the first quarter of 2026. Adjusted EBITDA increased to $45 million from $36 million in the first quarter of 2026, primarily due to higher revenues resulting from increased utilization in the completions business and incremental deployments in PROPWR. Net cash provided by operating activities was $66 million as compared to $3 million in the prior quarter. The increase is primarily attributable to higher Adjusted EBITDA and working capital tailwinds in the second quarter, which were an approximately $20 million source of cash and working capital headwinds in the prior quarter, which consumed approximately $32 million in cash. Liquidity and Capital Spending EXHIBIT 99.1
As of June 30, 2026, cash and cash equivalents were $784 million, including proceeds from the issuance of $690 million aggregate principal amount of convertible senior notes. Borrowings under the Company's financing agreement with Caterpillar Financial Services Corporation were $130 million. This financing agreement was recently upsized to $167 million held by Caterpillar, with any amounts they are able to syndicate to other lenders not counting against the $167 million cap. Total liquidity at the end of the second quarter of 2026 was $905 million, which included cash and cash equivalents and $121 million of available borrowing capacity under the ABL Credit Facility. The Company currently has no outstanding borrowings under the ABL Credit Facility. During the second quarter of 2026, capital expenditures paid were $61 million and capital expenditures incurred were $71 million, including approximately $24 million supporting the Company's completions business and approximately $47 million supporting its PROPWR orders. Notably, the difference between incurred and paid capital expenditures is primarily comprised of PROPWR-related capital expenditures that have been financed and paid directly by the financing partner and unpaid capital expenditures included in accounts payable and accrued liabilities. Net cash used in investing activities as shown on the statement of cash flows during the second quarter of 2026 was $58 million, which included capital expenditures paid of $61 million, offset by $3 million in proceeds from certain asset sales. PROPWR Update Mr. Sledge commented, “PROPWR continued to build meaningful momentum throughout the quarter, highlighted by significant recent commercial progress. Our team continues to execute on our commercial strategy, converting opportunities into contracted capacity. Since our last update, we have an incremental approximately 110 megawatts of power generation capacity committed under contract across two separate projects, one supporting a leading integrated upstream operator in the Permian Basin, and another supporting an industrial customer, bringing our total capacity committed under contract to approximately 350 megawatts. We are also engaged in advanced contract negotiations for over 100 megawatts in the oil and gas arena, and continue advancing negotiations across multiple data center commercial opportunities, including a subset of several hundred megawatts in advanced discussions. Our recently announced strategic framework agreement with Caterpillar remains an important part of our commercial strategy by securing long-term access to approximately 2.1 additional gigawatts of power generation capacity over the next five years, positioning PROPWR with up to approximately 2.6 gigawatts of power generation capacity planned to be delivered by year-end 2031. Importantly, we will continue to focus on execution as we operationalize and scale PROPWR with a focus on building a strong foundation that supports long-term growth and value creation. Our commercial progress across every end market is encouraging, and our confidence in the data center opportunity has never been stronger. With assets now deployed and operating on a data center site supporting a leading hyperscaler operator, and a robust pipeline, we remain confident in our expectation to deploy the majority of our future power capacity to data center customers. At the same time, our expanding presence in the oil and gas and industrial sectors complements those longer-term data center opportunities by providing attractive near-term returns, and we expect to secure additional contracts across all of these end markets as we extend and deepen relationships with both new and existing partners. Notably, while contract terms on these oil and gas and industrial agreements are generally shorter in duration than those PROPWR is pursuing in the data center arena, the pricing and expected annual returns are attractive and accretive to the overall return profile of the PROPWR business as it continues to scale. As we continue to deploy capital to grow PROPWR, we are proud of the work we have done to position ProPetro's capital structure to support that growth. From a financing perspective, we have now raised approximately $1.5 billion over the past eighteen months to help fund PROPWR's growth, including our highly successful offering of $690 million aggregate principal amount of convertible notes, completed in May, which resulted in 0% coupon notes with no dilution for shareholders until the stock price reaches $29.49 per share after taking the effect of the associated capped call transaction into account. Going forward, we will approach future capital decisions opportunistically as we continue expanding our commercial footprint and executing against our strategy." EXHIBIT 99.1
Guidance The Company anticipates full-year 2026 capital expenditures incurred to be between $525 million and $595 million, down from the $540 million to $610 million range highlighted in the Company's first quarter earnings report. Of this, the completions business is expected to account for approximately $125 million to $145 million, down from the prior $140 million to $160 million range. The reduction in expected completions capital expenditures is primarily attributable to the timing of the Company's planned FORCE® electric fleet buyouts. Prior guidance contemplated at least two fleet buyouts during 2026; the Company now expects to complete its first planned buyout this year, at a cost of between $15 million and $20 million, with the second shifting into early 2027. This timing change does not alter the Company's long- term capital allocation strategy or its intent to ultimately purchase all five FORCE® electric fleets. Also, as a reminder, the Completions business guidance range includes capital reserved for refurbishing a portion of the existing Tier IV DGB fleet, investments in fleet automation technology, as well as measured investments in direct drive gas frac units. The Company continues to see strong customer demand for its next-generation gas-burning fleet portfolio and believes these investments further strengthen its long-term competitive position. Additionally, the Company anticipates incurring capital expenditures of approximately $400 million to $450 million for its PROPWR business in 2026, consistent with prior guidance. This guidance includes equipment deliveries as well as down payments for equipment associated with the Company’s strategic framework agreement with Caterpillar. Notably, the Company's previous guidance of approximately $1.4 million to $1.5 million per megawatt inclusive of balance of plant remains unchanged. While these PROPWR capital expenditure estimates reflect the total cost of the equipment, they do not reflect the impact of financing arrangements, which have and are expected to continue reducing the near-term actual cash outflows required from the Company. The Company currently expects to activate its thirteenth active frac fleet later this quarter, reflecting increasing customer demand and improving fundamentals across the Permian completions market. Pertaining to PROPWR, the Company’s primary focus for the remainder of 2026 continues to be the successful deployment and scaling of PROPWR assets across its contracted customer base. By emphasizing disciplined execution and actively de-risking deployments during this period, the Company is positioning PROPWR for long-term growth. This strategic approach is expected to establish a strong operational foundation, enabling PROPWR to begin delivering positive and increasingly meaningful earnings in the second half of 2026 and into 2027. Outlook Mr. Sledge concluded, “We believe the outlook for our completions business continues to improve as market fundamentals tighten and pricing momentum builds. ProPetro is well positioned to capitalize on these dynamics as they develop. At the same time, PROPWR continues to build momentum through operational and commercial execution across the data center, oil and gas and industrial markets. Supported by a strong balance sheet and a disciplined strategy, we remain confident in our ability to create long-term value for our shareholders.” Conference Call Information The Company will host a conference call at 8:00 AM Central Time on Wednesday, July 29, 2026, to discuss financial and operating results for the second quarter of 2026. The call will also be webcast on ProPetro’s website at www.propetroservices.com. To access the conference call, U.S. callers may dial toll free 800-715-9871 and international callers may dial +1-646-307-1963. Please call ten minutes ahead of the scheduled start time to ensure a proper connection. A replay of the conference call will be available for one week following the call and may be accessed toll free by dialing +1-800-770-2030 for U.S. and EXHIBIT 99.1
Canada callers, as well as +1-609-800-9909 for international callers. The access code for the replay is 2048240. The Company has also posted the scripted remarks on its website. About ProPetro ProPetro Holding Corp. is a Midland, Texas based provider of premium completion services to upstream oil and gas companies engaged in the exploration and production of North American unconventional oil and natural gas resources. Through its PROPWR division, ProPetro also delivers reliable, adaptable power services through a modern, standardized fleet of gas-to-power solutions, serving data center, oil and gas, and industrial customers in the United States. ProPetro helps bring reliable energy to the world, enabling operational excellence and energy reliability for their customers. For more information, visit www.propetroservices.com. Forward-Looking Statements Except for historical information contained herein, the statements and information in this news release are forward-looking statements that are made pursuant to the Safe Harbor Provisions of the Private Securities Litigation Reform Act of 1995. Statements that are predictive in nature, that depend upon or refer to future events or conditions or that include the words “may,” “could,” "confident," “plan,” “project,” “budget,” "design," “predict,” “pursue,” “target,” “seek,” “objective,” “believe,” “expect,” “anticipate,” “intend,” “estimate,” “will,” “should,” "continue," and other expressions that are predictions of, or indicate, future events and trends or that do not relate to historical matters generally identify forward-looking statements. Our forward-looking statements include, among other matters, statements about the supply of and demand for hydrocarbons, industry trends and activity levels, our business strategy, projected financial results and future financial performance, the ability to obtain capital on attractive terms, expected fleet utilization, sustainability efforts, the future performance of newly improved technology, expected capital expenditures, the impact of such expenditures on our performance and capital programs, our fleet conversion strategy, our share repurchase program, and the anticipated growth prospects of PROPWR, including the demand for its services, types of customers and the ability to secure long-term contracts, the ability to obtain financing on attractive terms, the ability to procure additional equipment, timely receipt of such equipment and successful deployment and anticipated benefits of the PROPWR business line, including its expected financial contribution to our results of operations. A forward-looking statement may include a statement of the assumptions or bases underlying the forward-looking statement. We believe that we have chosen these assumptions or bases in good faith and that they are reasonable. Although forward-looking statements reflect our good faith beliefs at the time they are made, forward- looking statements are subject to a number of risks and uncertainties that may cause actual events and results to differ materially from the forward-looking statements. Such risks and uncertainties include the volatility of oil prices, changes in the supply of and demand for power generation, the risks associated with the establishment of a new service line, including delays, lack of customer acceptance and cost overruns, the global macroeconomic uncertainty related to conflict in the Middle East region, including the Iran War, the Russia-Ukraine war, and events in Venezuela, general economic conditions, including the impact of continued inflation, central bank policy actions, the risk of a global recession, U.S. and global trade policy, including the imposition of tariffs and retaliatory measures, and other factors described in the Company's Annual Report on Form 10-K and Quarterly Reports on Form 10-Q, particularly the “Risk Factors” sections of such filings, and other filings with the Securities and Exchange Commission (the “SEC”). In addition, the Company may be subject to currently unforeseen risks that may have a materially adverse impact on it. Accordingly, no assurances can be given that the actual events and results will not be materially different than the anticipated results described in the forward-looking statements. Readers are cautioned not to place undue reliance on such forward-looking statements and are urged to carefully review and consider the various disclosures made in the Company’s Annual Report on Form 10-K, Quarterly Reports on Form 10-Q and other filings made with the SEC from time to time that disclose risks and uncertainties that may affect the Company’s business. The forward-looking statements in this news release are made as of the date of this news release. ProPetro does not undertake, and expressly disclaims, any duty to publicly update these statements, whether as a result of new information, new developments or otherwise, except to the extent that disclosure is required by law. EXHIBIT 99.1

Investor Contacts: Matt Augustine Vice President, Finance and Investor Relations matt.augustine@propetroservices.com 432-219-7620 ### EXHIBIT 99.1
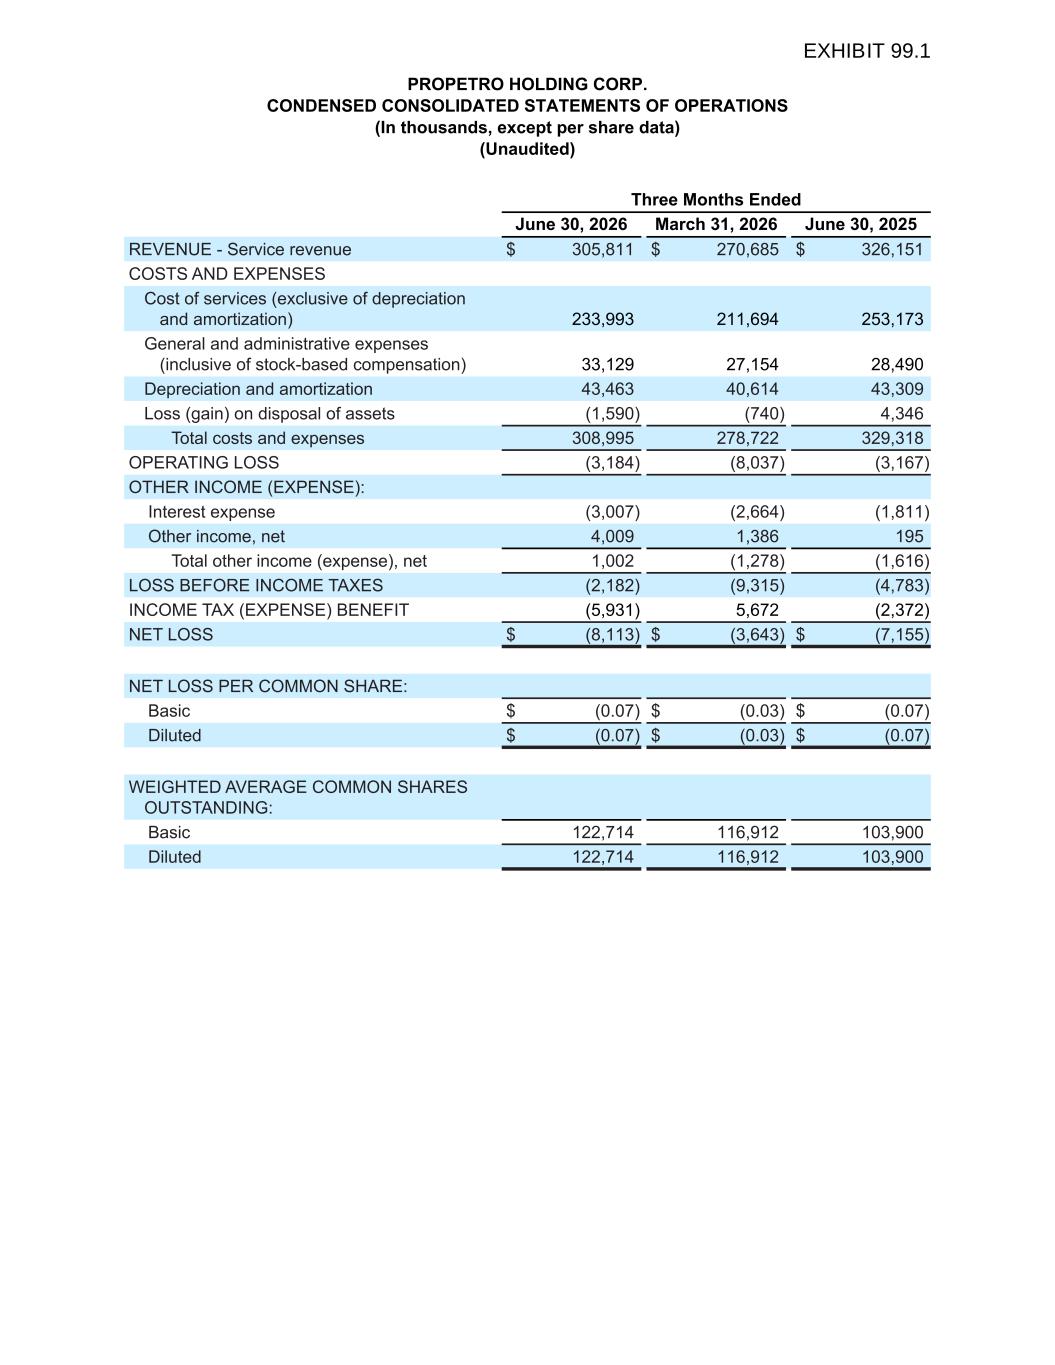
PROPETRO HOLDING CORP. CONDENSED CONSOLIDATED STATEMENTS OF OPERATIONS (In thousands, except per share data) (Unaudited) Three Months Ended June 30, 2026 March 31, 2026 June 30, 2025 REVENUE - Service revenue $ 305,811 $ 270,685 $ 326,151 COSTS AND EXPENSES Cost of services (exclusive of depreciation and amortization) 233,993 211,694 253,173 General and administrative expenses (inclusive of stock-based compensation) 33,129 27,154 28,490 Depreciation and amortization 43,463 40,614 43,309 Loss (gain) on disposal of assets (1,590) (740) 4,346 Total costs and expenses 308,995 278,722 329,318 OPERATING LOSS (3,184) (8,037) (3,167) OTHER INCOME (EXPENSE): Interest expense (3,007) (2,664) (1,811) Other income, net 4,009 1,386 195 Total other income (expense), net 1,002 (1,278) (1,616) LOSS BEFORE INCOME TAXES (2,182) (9,315) (4,783) INCOME TAX (EXPENSE) BENEFIT (5,931) 5,672 (2,372) NET LOSS $ (8,113) $ (3,643) $ (7,155) NET LOSS PER COMMON SHARE: Basic $ (0.07) $ (0.03) $ (0.07) Diluted $ (0.07) $ (0.03) $ (0.07) WEIGHTED AVERAGE COMMON SHARES OUTSTANDING: Basic 122,714 116,912 103,900 Diluted 122,714 116,912 103,900 EXHIBIT 99.1
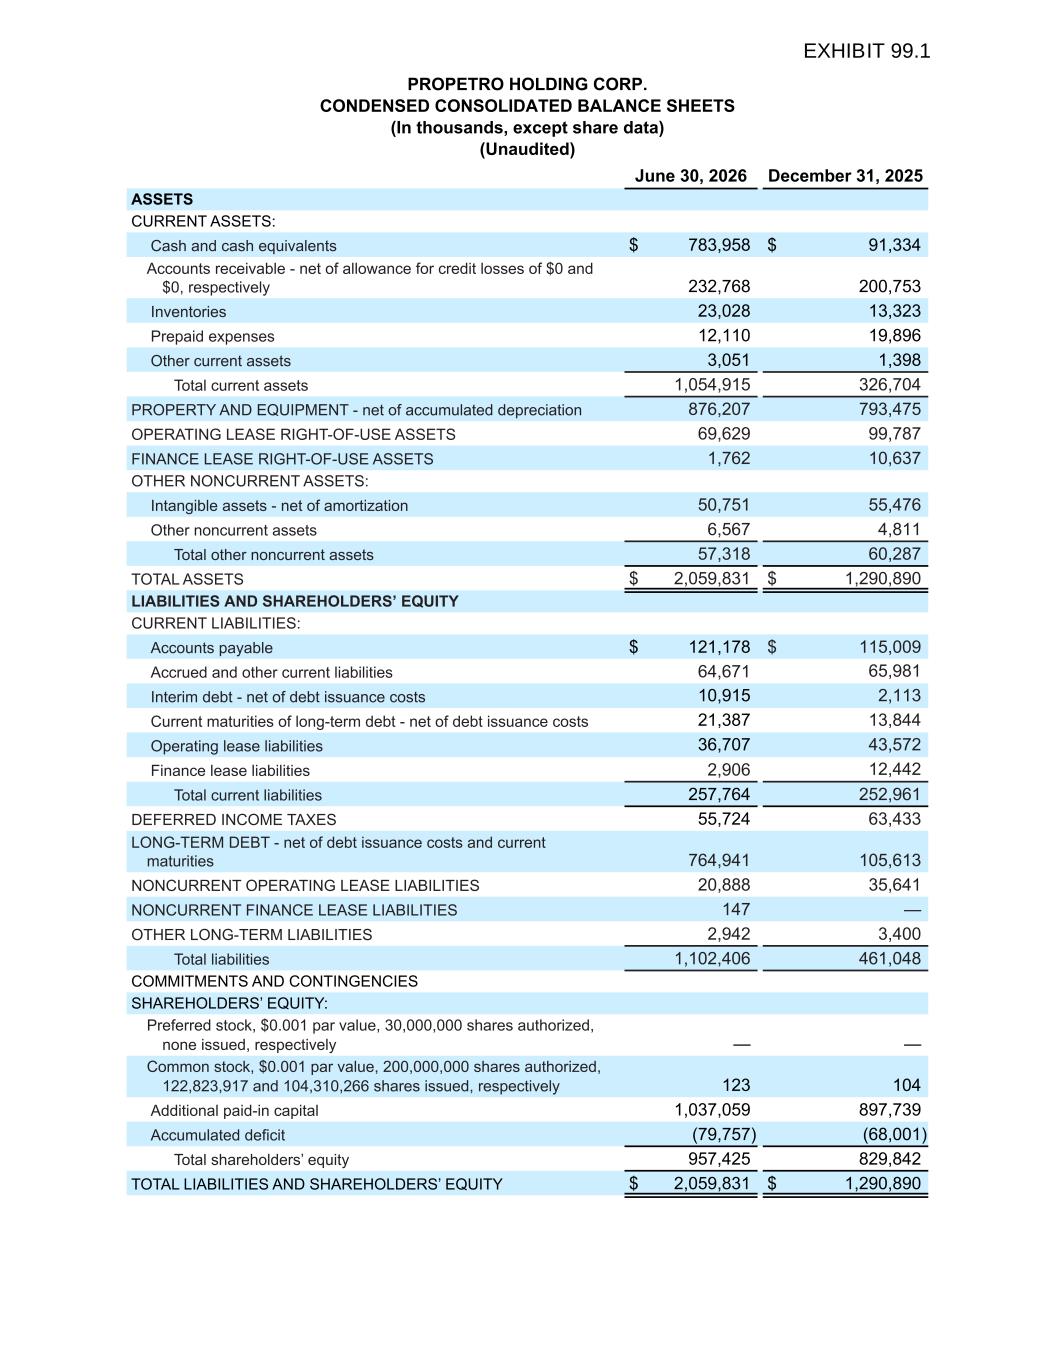
PROPETRO HOLDING CORP. CONDENSED CONSOLIDATED BALANCE SHEETS (In thousands, except share data) (Unaudited) June 30, 2026 December 31, 2025 ASSETS CURRENT ASSETS: Cash and cash equivalents $ 783,958 $ 91,334 Accounts receivable - net of allowance for credit losses of $0 and $0, respectively 232,768 200,753 Inventories 23,028 13,323 Prepaid expenses 12,110 19,896 Other current assets 3,051 1,398 Total current assets 1,054,915 326,704 PROPERTY AND EQUIPMENT - net of accumulated depreciation 876,207 793,475 OPERATING LEASE RIGHT-OF-USE ASSETS 69,629 99,787 FINANCE LEASE RIGHT-OF-USE ASSETS 1,762 10,637 OTHER NONCURRENT ASSETS: Intangible assets - net of amortization 50,751 55,476 Other noncurrent assets 6,567 4,811 Total other noncurrent assets 57,318 60,287 TOTAL ASSETS $ 2,059,831 $ 1,290,890 LIABILITIES AND SHAREHOLDERS’ EQUITY CURRENT LIABILITIES: Accounts payable $ 121,178 $ 115,009 Accrued and other current liabilities 64,671 65,981 Interim debt - net of debt issuance costs 10,915 2,113 Current maturities of long-term debt - net of debt issuance costs 21,387 13,844 Operating lease liabilities 36,707 43,572 Finance lease liabilities 2,906 12,442 Total current liabilities 257,764 252,961 DEFERRED INCOME TAXES 55,724 63,433 LONG-TERM DEBT - net of debt issuance costs and current maturities 764,941 105,613 NONCURRENT OPERATING LEASE LIABILITIES 20,888 35,641 NONCURRENT FINANCE LEASE LIABILITIES 147 — OTHER LONG-TERM LIABILITIES 2,942 3,400 Total liabilities 1,102,406 461,048 COMMITMENTS AND CONTINGENCIES SHAREHOLDERS’ EQUITY: Preferred stock, $0.001 par value, 30,000,000 shares authorized, none issued, respectively — — Common stock, $0.001 par value, 200,000,000 shares authorized, 122,823,917 and 104,310,266 shares issued, respectively 123 104 Additional paid-in capital 1,037,059 897,739 Accumulated deficit (79,757) (68,001) Total shareholders’ equity 957,425 829,842 TOTAL LIABILITIES AND SHAREHOLDERS’ EQUITY $ 2,059,831 $ 1,290,890 EXHIBIT 99.1
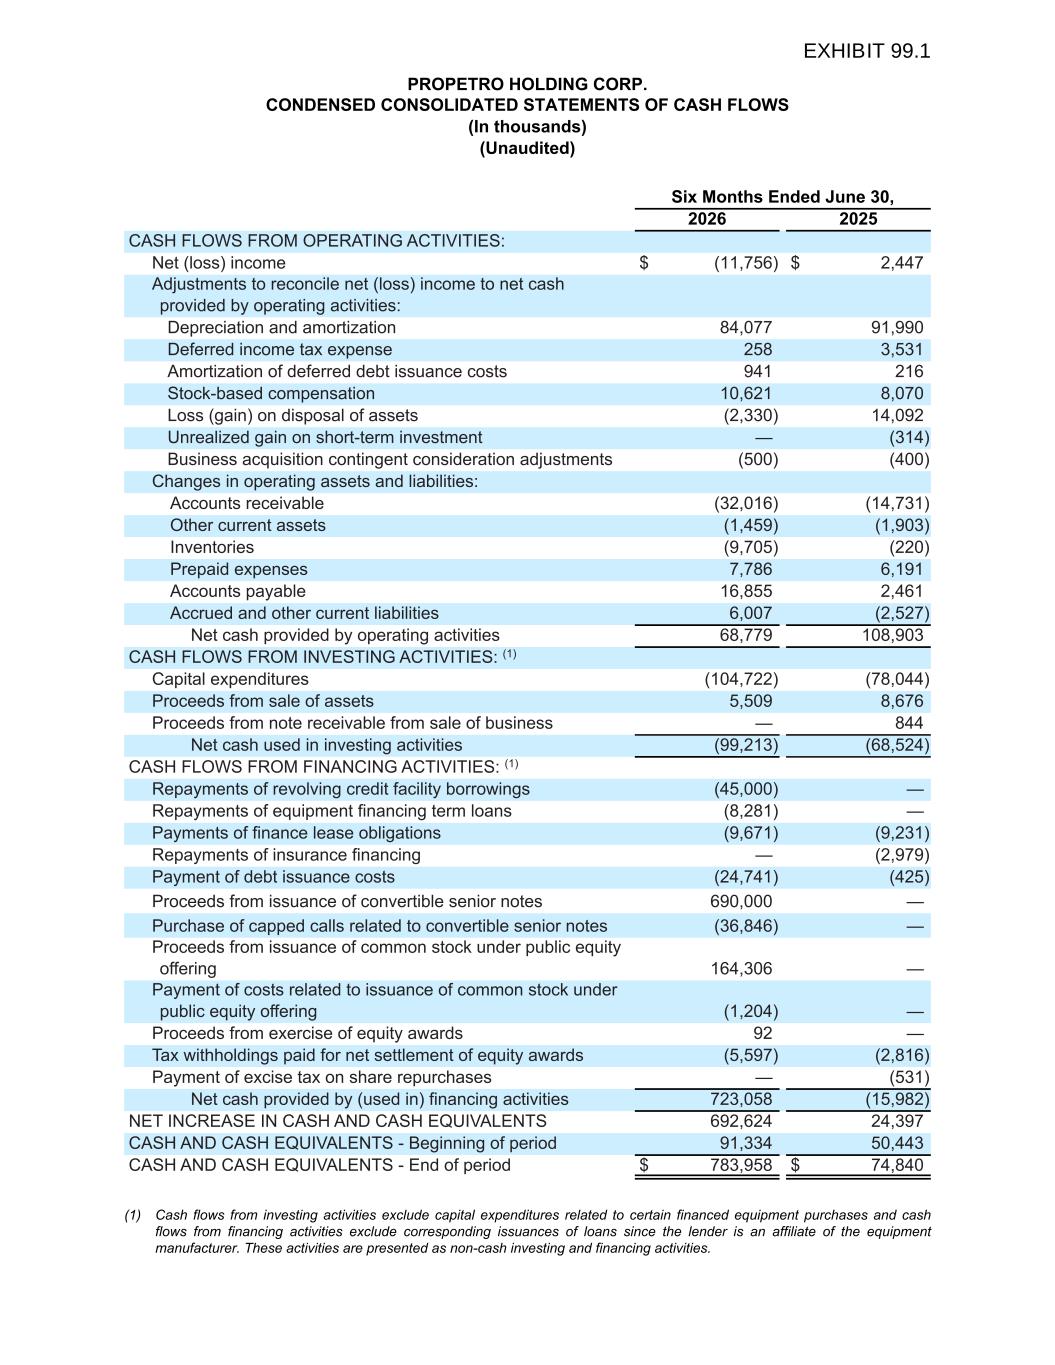
PROPETRO HOLDING CORP. CONDENSED CONSOLIDATED STATEMENTS OF CASH FLOWS (In thousands) (Unaudited) Six Months Ended June 30, 2026 2025 CASH FLOWS FROM OPERATING ACTIVITIES: Net (loss) income $ (11,756) $ 2,447 Adjustments to reconcile net (loss) income to net cash provided by operating activities: Depreciation and amortization 84,077 91,990 Deferred income tax expense 258 3,531 Amortization of deferred debt issuance costs 941 216 Stock-based compensation 10,621 8,070 Loss (gain) on disposal of assets (2,330) 14,092 Unrealized gain on short-term investment — (314) Business acquisition contingent consideration adjustments (500) (400) Changes in operating assets and liabilities: Accounts receivable (32,016) (14,731) Other current assets (1,459) (1,903) Inventories (9,705) (220) Prepaid expenses 7,786 6,191 Accounts payable 16,855 2,461 Accrued and other current liabilities 6,007 (2,527) Net cash provided by operating activities 68,779 108,903 CASH FLOWS FROM INVESTING ACTIVITIES: (1) Capital expenditures (104,722) (78,044) Proceeds from sale of assets 5,509 8,676 Proceeds from note receivable from sale of business — 844 Net cash used in investing activities (99,213) (68,524) CASH FLOWS FROM FINANCING ACTIVITIES: (1) Repayments of revolving credit facility borrowings (45,000) — Repayments of equipment financing term loans (8,281) — Payments of finance lease obligations (9,671) (9,231) Repayments of insurance financing — (2,979) Payment of debt issuance costs (24,741) (425) Proceeds from issuance of convertible senior notes 690,000 — Purchase of capped calls related to convertible senior notes (36,846) — Proceeds from issuance of common stock under public equity offering 164,306 — Payment of costs related to issuance of common stock under public equity offering (1,204) — Proceeds from exercise of equity awards 92 — Tax withholdings paid for net settlement of equity awards (5,597) (2,816) Payment of excise tax on share repurchases — (531) Net cash provided by (used in) financing activities 723,058 (15,982) NET INCREASE IN CASH AND CASH EQUIVALENTS 692,624 24,397 CASH AND CASH EQUIVALENTS - Beginning of period 91,334 50,443 CASH AND CASH EQUIVALENTS - End of period $ 783,958 $ 74,840 (1) Cash flows from investing activities exclude capital expenditures related to certain financed equipment purchases and cash flows from financing activities exclude corresponding issuances of loans since the lender is an affiliate of the equipment manufacturer. These activities are presented as non-cash investing and financing activities. EXHIBIT 99.1
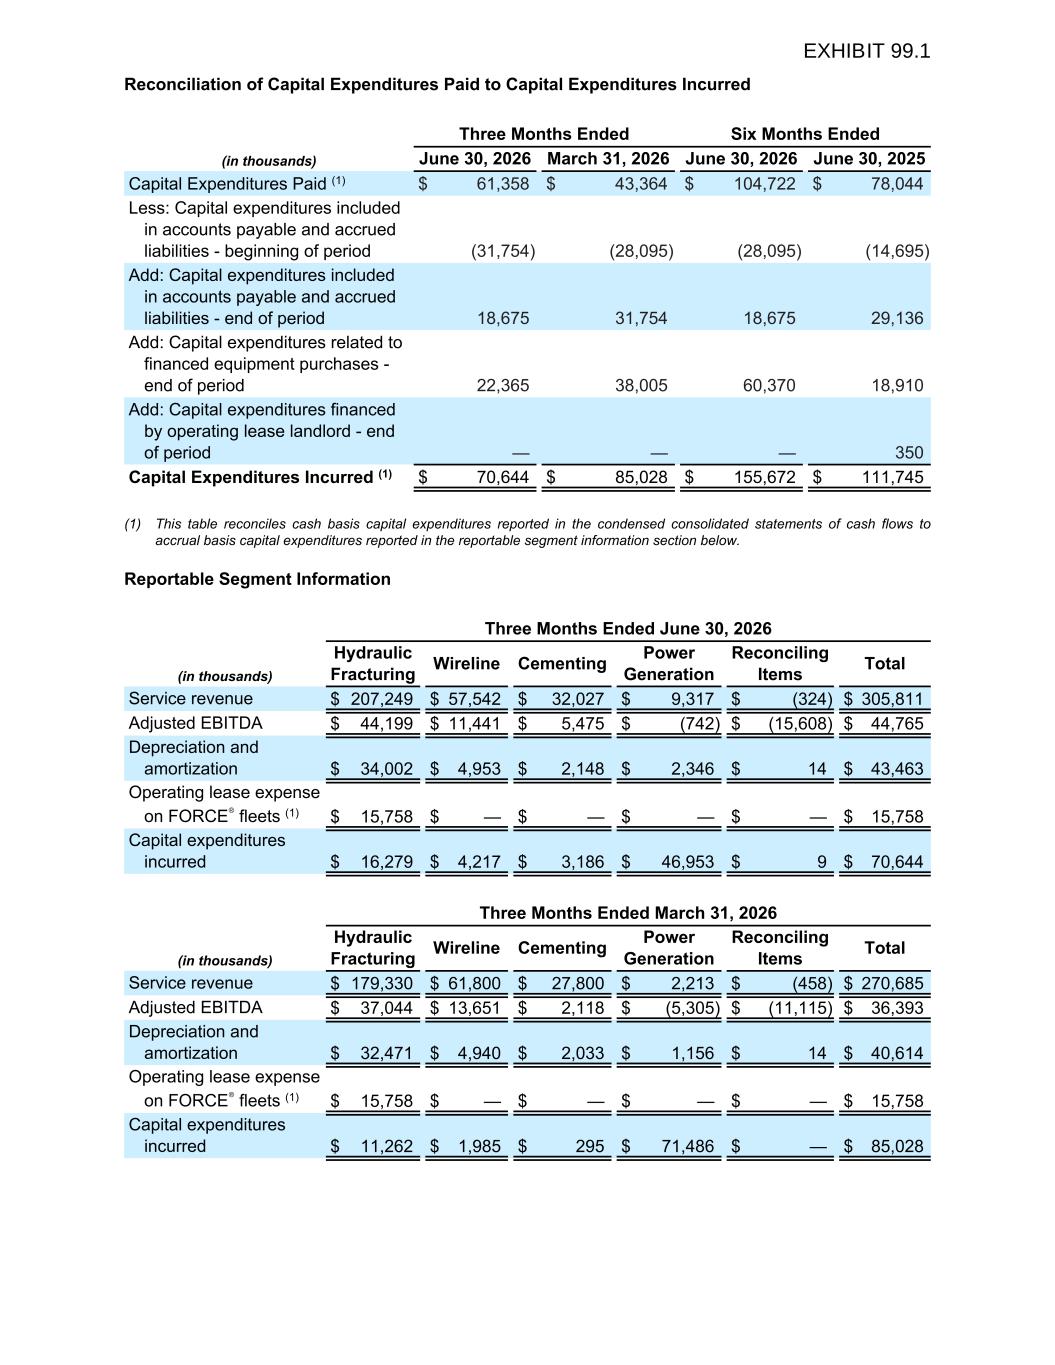
Reconciliation of Capital Expenditures Paid to Capital Expenditures Incurred Three Months Ended Six Months Ended (in thousands) June 30, 2026 March 31, 2026 June 30, 2026 June 30, 2025 Capital Expenditures Paid (1) $ 61,358 $ 43,364 $ 104,722 $ 78,044 Less: Capital expenditures included in accounts payable and accrued liabilities - beginning of period (31,754) (28,095) (28,095) (14,695) Add: Capital expenditures included in accounts payable and accrued liabilities - end of period 18,675 31,754 18,675 29,136 Add: Capital expenditures related to financed equipment purchases - end of period 22,365 38,005 60,370 18,910 Add: Capital expenditures financed by operating lease landlord - end of period — — — 350 Capital Expenditures Incurred (1) $ 70,644 $ 85,028 $ 155,672 $ 111,745 (1) This table reconciles cash basis capital expenditures reported in the condensed consolidated statements of cash flows to accrual basis capital expenditures reported in the reportable segment information section below. Reportable Segment Information Three Months Ended June 30, 2026 (in thousands) Hydraulic Fracturing Wireline Cementing Power Generation Reconciling Items Total Service revenue $ 207,249 $ 57,542 $ 32,027 $ 9,317 $ (324) $ 305,811 Adjusted EBITDA $ 44,199 $ 11,441 $ 5,475 $ (742) $ (15,608) $ 44,765 Depreciation and amortization $ 34,002 $ 4,953 $ 2,148 $ 2,346 $ 14 $ 43,463 Operating lease expense on FORCE® fleets (1) $ 15,758 $ — $ — $ — $ — $ 15,758 Capital expenditures incurred $ 16,279 $ 4,217 $ 3,186 $ 46,953 $ 9 $ 70,644 Three Months Ended March 31, 2026 (in thousands) Hydraulic Fracturing Wireline Cementing Power Generation Reconciling Items Total Service revenue $ 179,330 $ 61,800 $ 27,800 $ 2,213 $ (458) $ 270,685 Adjusted EBITDA $ 37,044 $ 13,651 $ 2,118 $ (5,305) $ (11,115) $ 36,393 Depreciation and amortization $ 32,471 $ 4,940 $ 2,033 $ 1,156 $ 14 $ 40,614 Operating lease expense on FORCE® fleets (1) $ 15,758 $ — $ — $ — $ — $ 15,758 Capital expenditures incurred $ 11,262 $ 1,985 $ 295 $ 71,486 $ — $ 85,028 EXHIBIT 99.1
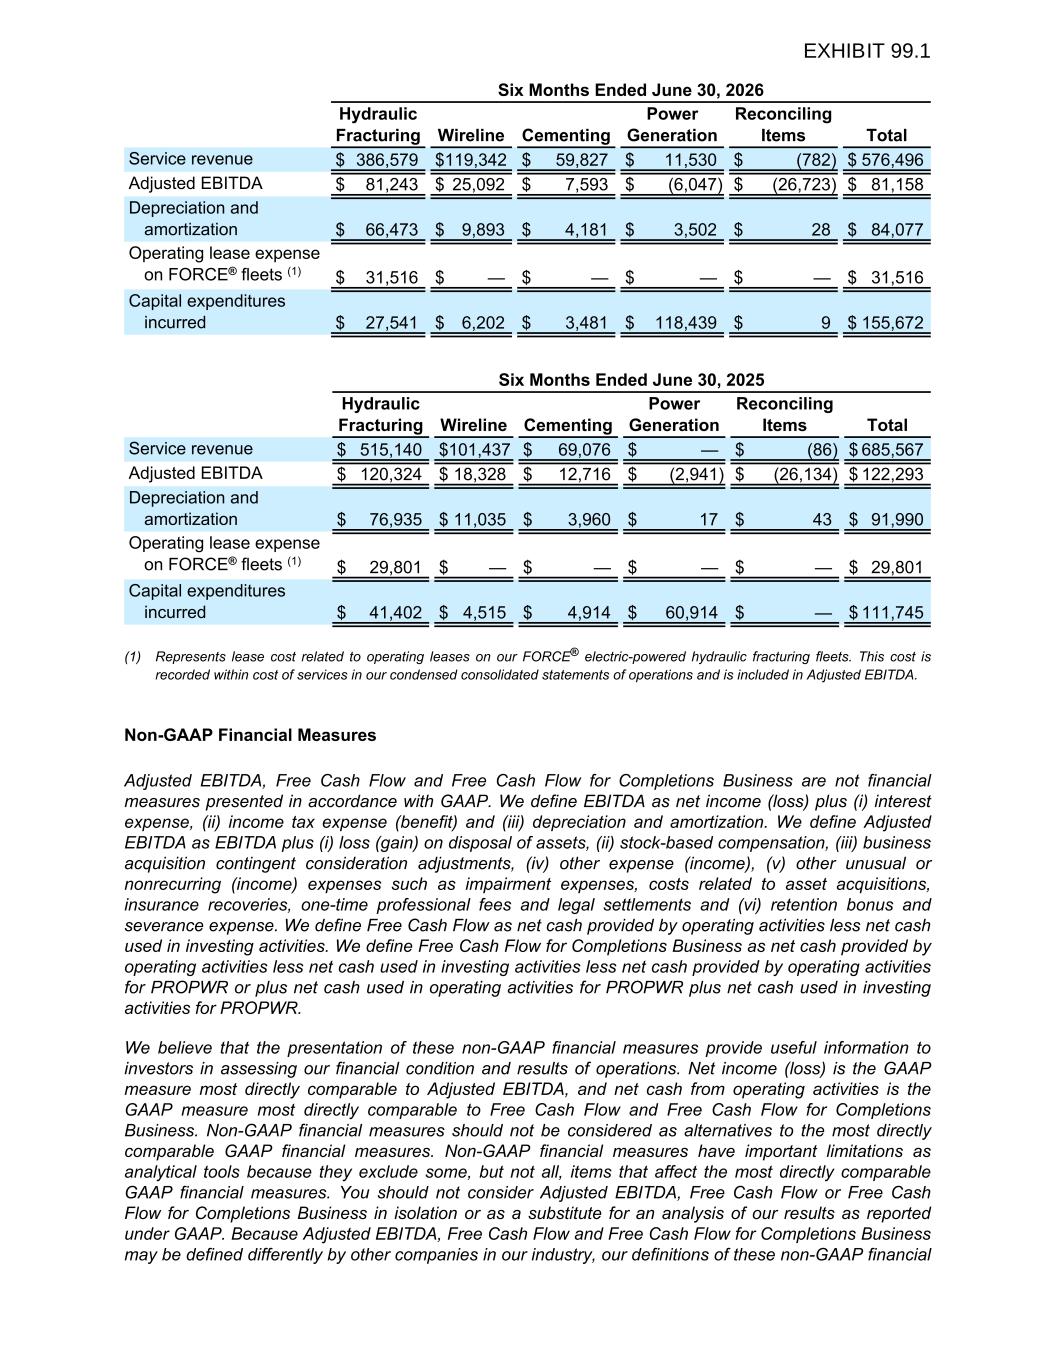
Six Months Ended June 30, 2026 Hydraulic Fracturing Wireline Cementing Power Generation Reconciling Items Total Service revenue $ 386,579 $ 119,342 $ 59,827 $ 11,530 $ (782) $ 576,496 Adjusted EBITDA $ 81,243 $ 25,092 $ 7,593 $ (6,047) $ (26,723) $ 81,158 Depreciation and amortization $ 66,473 $ 9,893 $ 4,181 $ 3,502 $ 28 $ 84,077 Operating lease expense on FORCE® fleets (1) $ 31,516 $ — $ — $ — $ — $ 31,516 Capital expenditures incurred $ 27,541 $ 6,202 $ 3,481 $ 118,439 $ 9 $ 155,672 Six Months Ended June 30, 2025 Hydraulic Fracturing Wireline Cementing Power Generation Reconciling Items Total Service revenue $ 515,140 $ 101,437 $ 69,076 $ — $ (86) $ 685,567 Adjusted EBITDA $ 120,324 $ 18,328 $ 12,716 $ (2,941) $ (26,134) $ 122,293 Depreciation and amortization $ 76,935 $ 11,035 $ 3,960 $ 17 $ 43 $ 91,990 Operating lease expense on FORCE® fleets (1) $ 29,801 $ — $ — $ — $ — $ 29,801 Capital expenditures incurred $ 41,402 $ 4,515 $ 4,914 $ 60,914 $ — $ 111,745 (1) Represents lease cost related to operating leases on our FORCE® electric-powered hydraulic fracturing fleets. This cost is recorded within cost of services in our condensed consolidated statements of operations and is included in Adjusted EBITDA. Non-GAAP Financial Measures Adjusted EBITDA, Free Cash Flow and Free Cash Flow for Completions Business are not financial measures presented in accordance with GAAP. We define EBITDA as net income (loss) plus (i) interest expense, (ii) income tax expense (benefit) and (iii) depreciation and amortization. We define Adjusted EBITDA as EBITDA plus (i) loss (gain) on disposal of assets, (ii) stock-based compensation, (iii) business acquisition contingent consideration adjustments, (iv) other expense (income), (v) other unusual or nonrecurring (income) expenses such as impairment expenses, costs related to asset acquisitions, insurance recoveries, one-time professional fees and legal settlements and (vi) retention bonus and severance expense. We define Free Cash Flow as net cash provided by operating activities less net cash used in investing activities. We define Free Cash Flow for Completions Business as net cash provided by operating activities less net cash used in investing activities less net cash provided by operating activities for PROPWR or plus net cash used in operating activities for PROPWR plus net cash used in investing activities for PROPWR. We believe that the presentation of these non-GAAP financial measures provide useful information to investors in assessing our financial condition and results of operations. Net income (loss) is the GAAP measure most directly comparable to Adjusted EBITDA, and net cash from operating activities is the GAAP measure most directly comparable to Free Cash Flow and Free Cash Flow for Completions Business. Non-GAAP financial measures should not be considered as alternatives to the most directly comparable GAAP financial measures. Non-GAAP financial measures have important limitations as analytical tools because they exclude some, but not all, items that affect the most directly comparable GAAP financial measures. You should not consider Adjusted EBITDA, Free Cash Flow or Free Cash Flow for Completions Business in isolation or as a substitute for an analysis of our results as reported under GAAP. Because Adjusted EBITDA, Free Cash Flow and Free Cash Flow for Completions Business may be defined differently by other companies in our industry, our definitions of these non-GAAP financial EXHIBIT 99.1
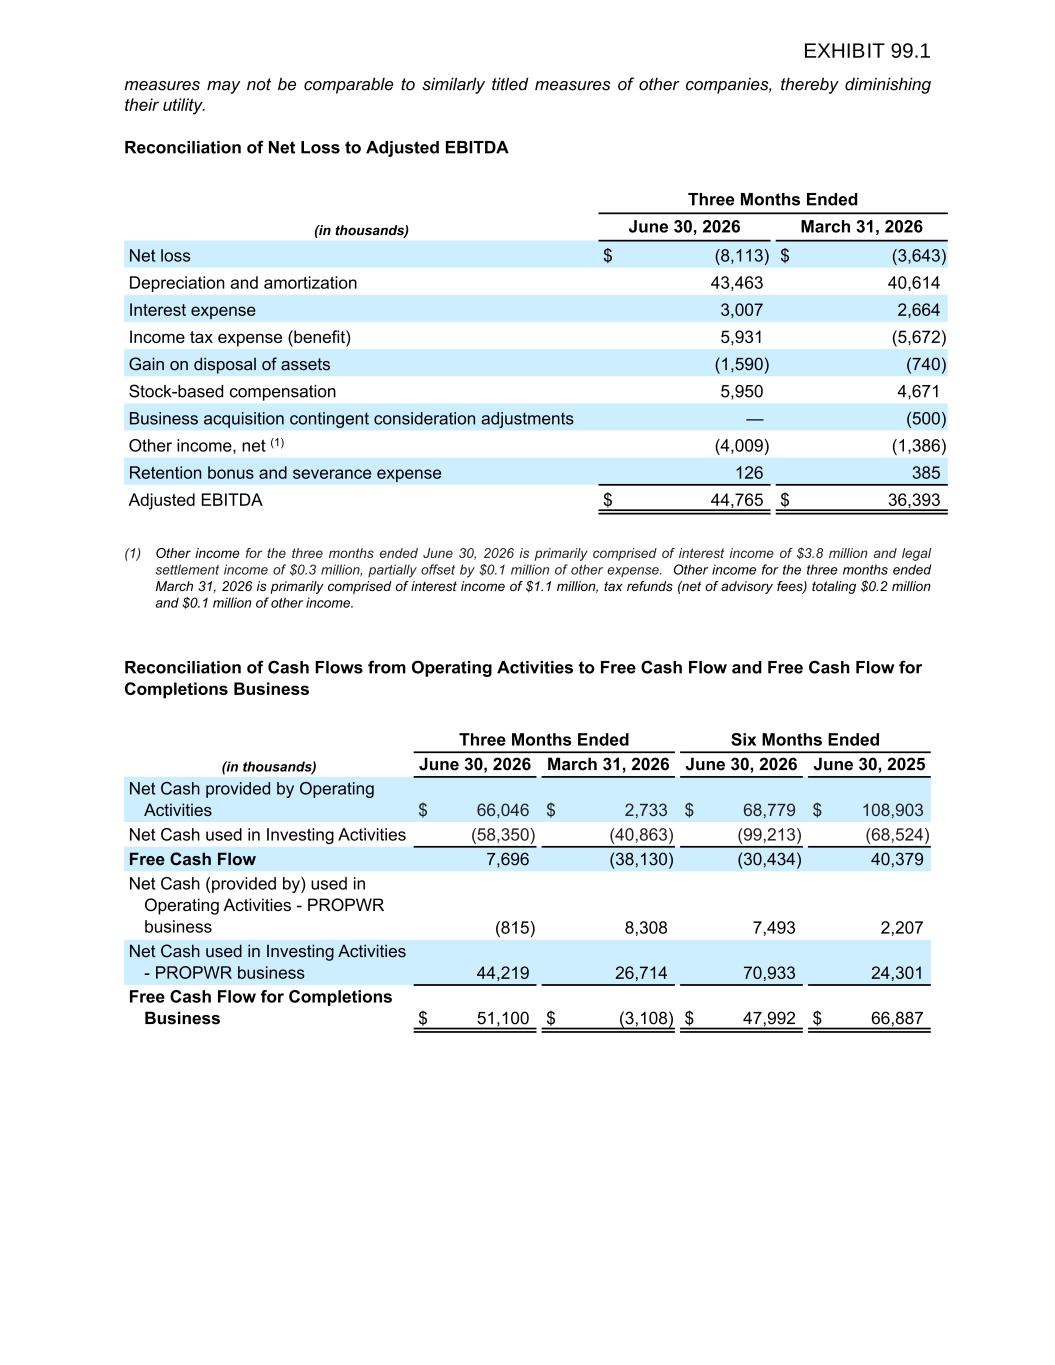
measures may not be comparable to similarly titled measures of other companies, thereby diminishing their utility. Reconciliation of Net Loss to Adjusted EBITDA Three Months Ended (in thousands) June 30, 2026 March 31, 2026 Net loss $ (8,113) $ (3,643) Depreciation and amortization 43,463 40,614 Interest expense 3,007 2,664 Income tax expense (benefit) 5,931 (5,672) Gain on disposal of assets (1,590) (740) Stock-based compensation 5,950 4,671 Business acquisition contingent consideration adjustments — (500) Other income, net (1) (4,009) (1,386) Retention bonus and severance expense 126 385 Adjusted EBITDA $ 44,765 $ 36,393 (1) Other income for the three months ended June 30, 2026 is primarily comprised of interest income of $3.8 million and legal settlement income of $0.3 million, partially offset by $0.1 million of other expense. Other income for the three months ended March 31, 2026 is primarily comprised of interest income of $1.1 million, tax refunds (net of advisory fees) totaling $0.2 million and $0.1 million of other income. Reconciliation of Cash Flows from Operating Activities to Free Cash Flow and Free Cash Flow for Completions Business Three Months Ended Six Months Ended (in thousands) June 30, 2026 March 31, 2026 June 30, 2026 June 30, 2025 Net Cash provided by Operating Activities $ 66,046 $ 2,733 $ 68,779 $ 108,903 Net Cash used in Investing Activities (58,350) (40,863) (99,213) (68,524) Free Cash Flow 7,696 (38,130) (30,434) 40,379 Net Cash (provided by) used in Operating Activities - PROPWR business (815) 8,308 7,493 2,207 Net Cash used in Investing Activities - PROPWR business 44,219 26,714 70,933 24,301 Free Cash Flow for Completions Business $ 51,100 $ (3,108) $ 47,992 $ 66,887 EXHIBIT 99.1