NOV Inc. Second Quarter 2026 Earnings Presentation July 29, 2026 Exhibit 99.2
Second Quarter 2026 Earnings Presentation – 07/29/2026 © 2026 NOV Inc. All rights reserved. This document contains, or has incorporated by reference, statements that are not historical facts, including estimates, projections, and statements relating to our business plans, objectives, and expected operating results that are “forward-looking statements” within the meaning of the Private Securities Litigation Reform Act of 1995. Such statements often contain words such as “may,” “can,” “likely,” “believe,” “plan,” “predict,” “potential,” “will,” “intend,” “think,” “should,” “expect,” “anticipate,” “estimate,” “forecast,” “expectation,” “goal,” “outlook,” “projected,” “projections,” “target,” and other similar words, although some such statements are expressed differently. Other oral or written statements we release to the public may also contain forward-looking statements. Forward-looking statements involve risk and uncertainties and reflect our best judgment based on current information. You should be aware that our actual results could differ materially from results anticipated in such forward-looking statements due to a number of factors, including but not limited to changes in oil and gas prices, customer demand for our products, challenges related to NOV’s operations in the Middle East, potential catastrophic events related to our operations, protection of intellectual property rights, compliance with laws, and worldwide economic activity, including matters related to recent Russian sanctions and changes in U.S. trade policies, including the imposition of tariffs and retaliatory tariffs and their related impacts on the economy. Given these uncertainties, current or prospective investors are cautioned not to place undue reliance on any such forward-looking statements. We undertake no obligation to update any such factors or forward-looking statements to reflect future events or developments. You should also consider carefully the statements under “Risk Factors,” as disclosed in our most recent Annual Report on Form 10-K, as updated in Part II, Item 1A of our most recent Quarterly Report on Form 10-Q, and “Management’s Discussion and Analysis of Financial Condition and Results of Operations” of our most recent Annual Report on Form 10-K, which address additional factors that could cause our actual results to differ from those set forth in the forward-looking statements, as well as additional disclosures we make in our press releases and other securities filings. We also suggest that you listen to our quarterly earnings release conference calls with financial analysts. This presentation contains certain forward-looking non-GAAP financial measures, including Adjusted EBITDA. The Company has not provided a reconciliation of projected Adjusted EBITDA. Management cannot predict with a reasonable degree of accuracy certain of the necessary components of net income, such as other income (expense), which includes fluctuations in foreign currencies. As such, a reconciliation of projected Adjusted EBITDA to projected net income is not available without unreasonable effort. The actual amount of other income (expense), provision (benefit) for income taxes, equity income (loss) in unconsolidated affiliates, depreciation and amortization, and other amounts excluded from Adjusted EBITDA could have a significant impact on net income. Safe Harbor / Forward Looking Statements / Non-GAAP Financial Measures
Second Quarter 2026 Earnings Presentation – 07/29/2026 © 2026 NOV Inc. All rights reserved. NOV delivers technology-driven solutions to empower the global energy industry. For more than 160 years, NOV has pioneered innovations that enable its customers to safely produce abundant energy while minimizing environmental impact. The energy industry depends on NOV’s deep expertise and technology to continually improve oilfield operations and assist in efforts to advance the energy transition towards a more sustainable future. NOV powers the industry that powers the world.
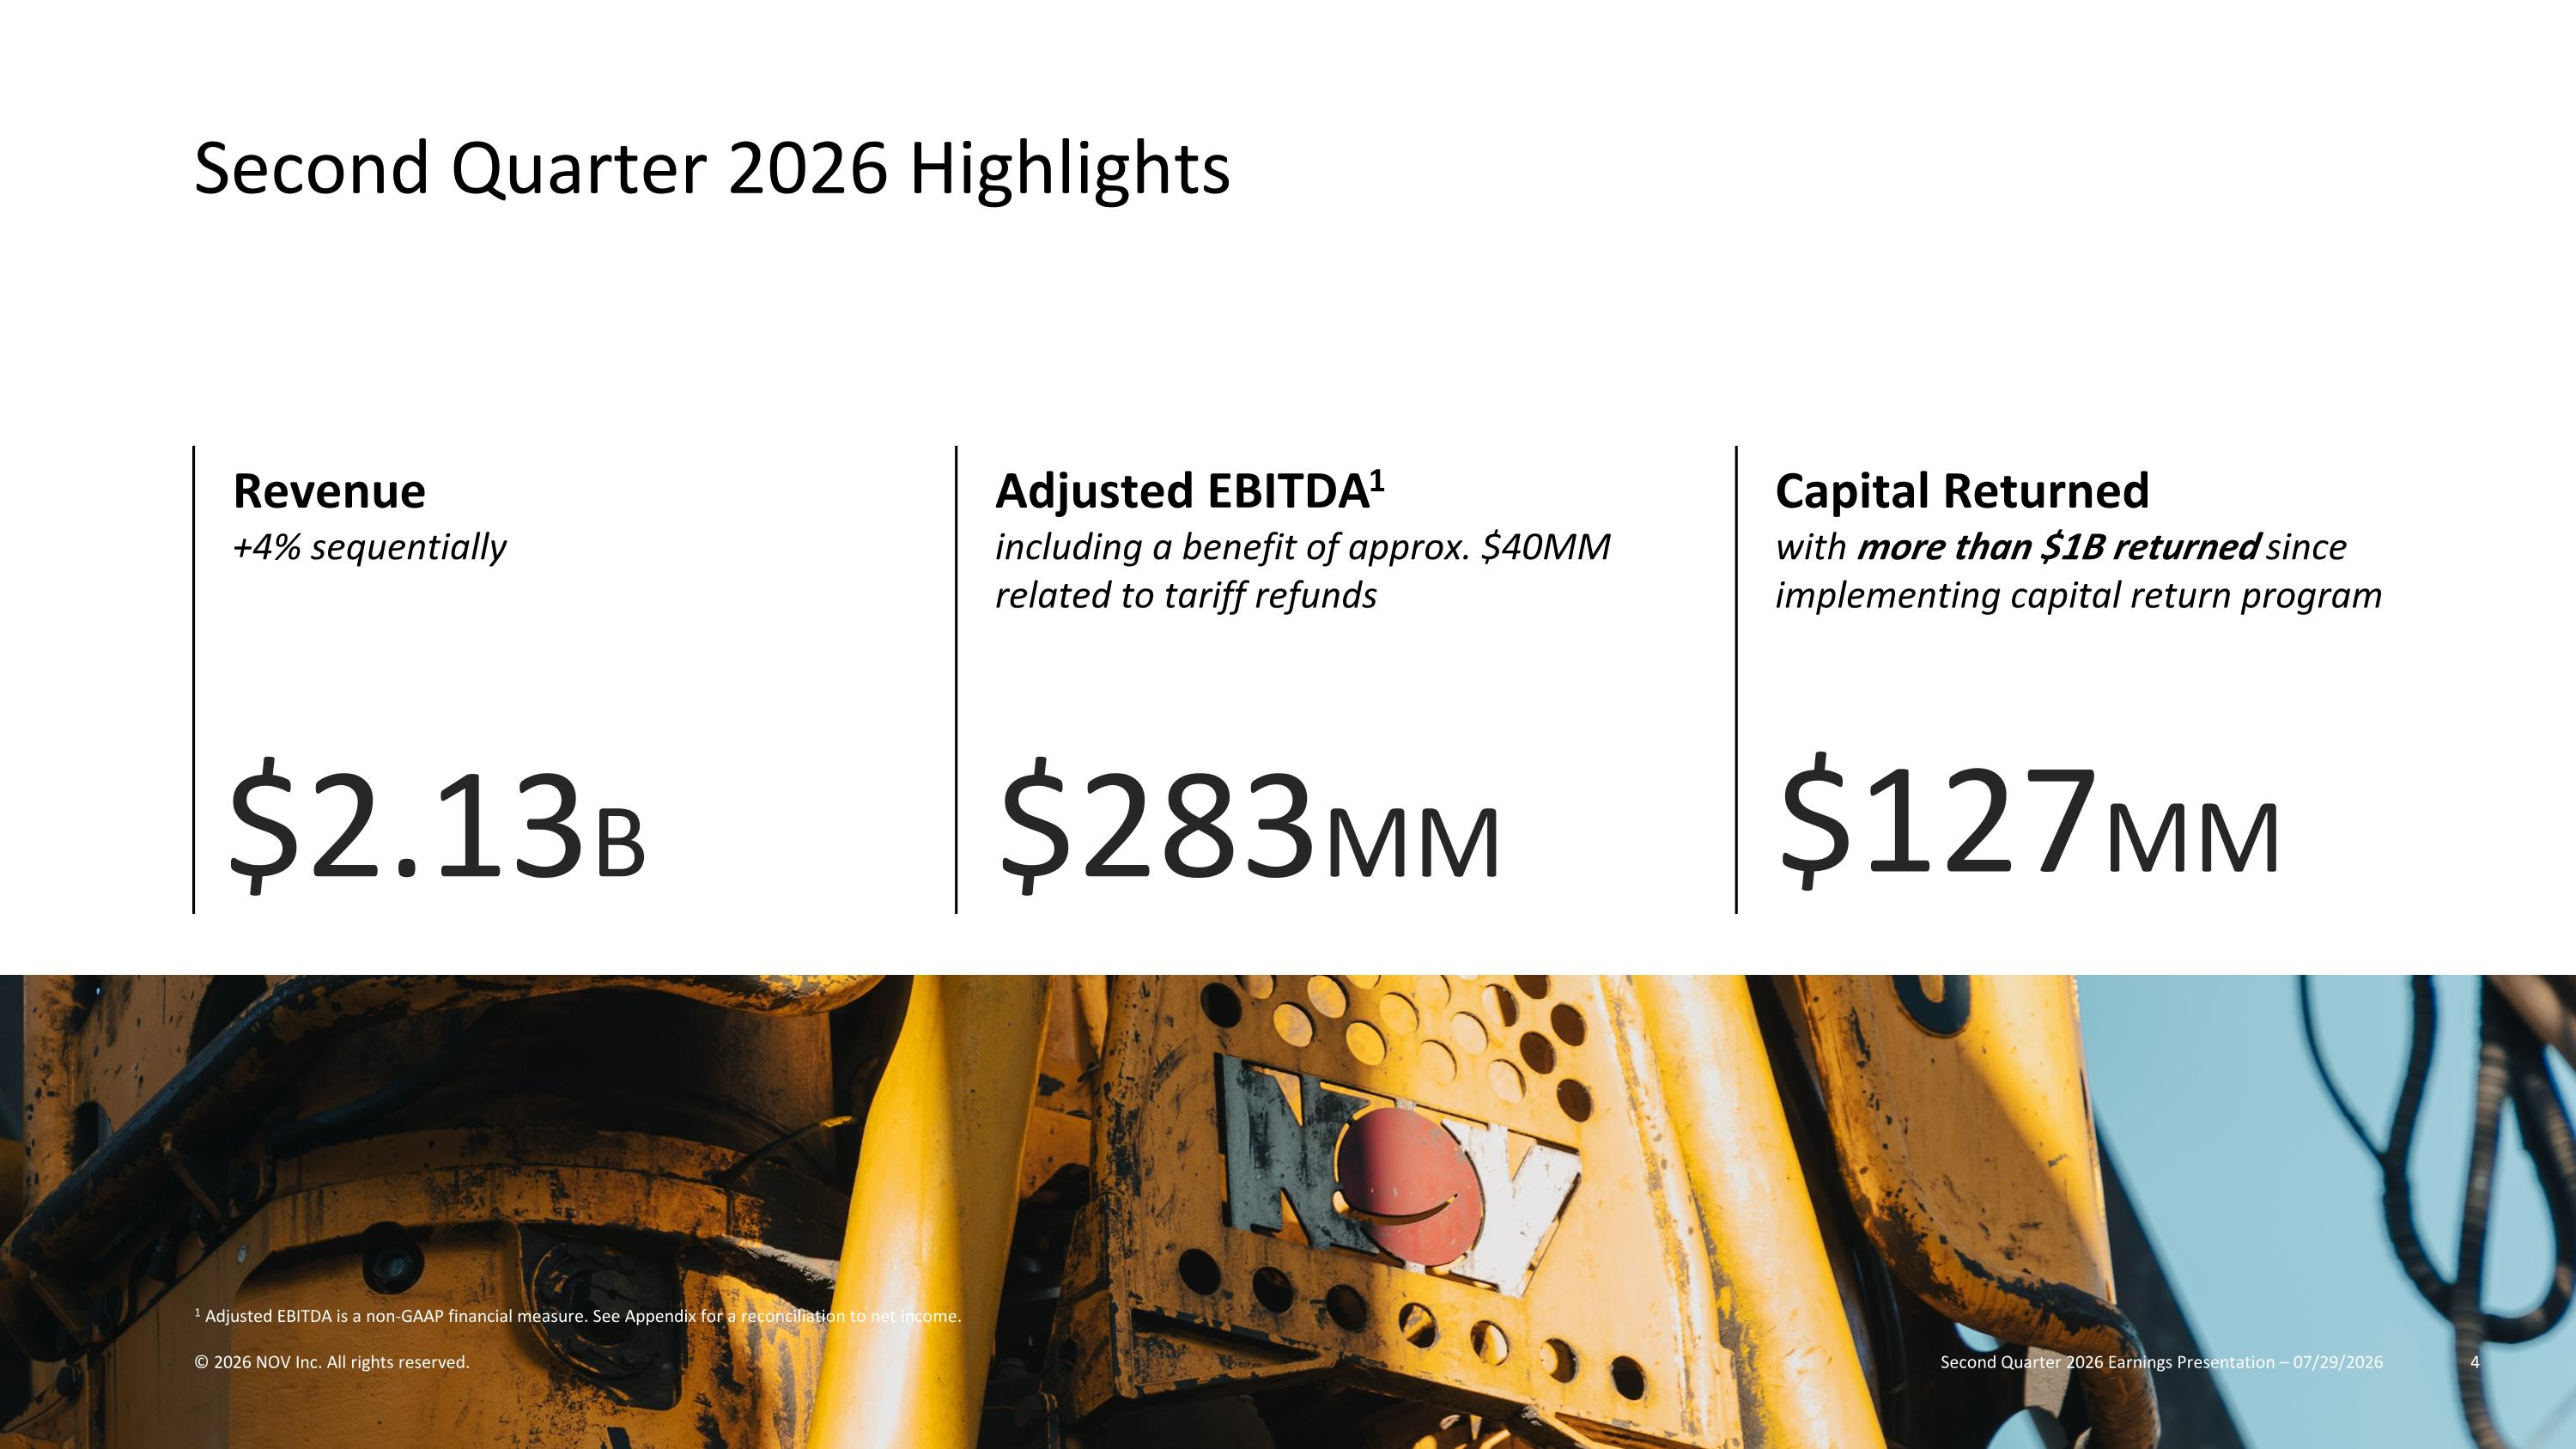
1 Adjusted EBITDA is a non-GAAP financial measure. See Appendix for a reconciliation to net income. $2.13B Revenue +4% sequentially Adjusted EBITDA1 including a benefit of approx. $40MM related to tariff refunds Capital Returned with more than $1B returned since implementing capital return program $283MM $127MM Second Quarter 2026 Highlights Second Quarter 2026 Earnings Presentation – 07/29/2026 © 2026 NOV Inc. All rights reserved.
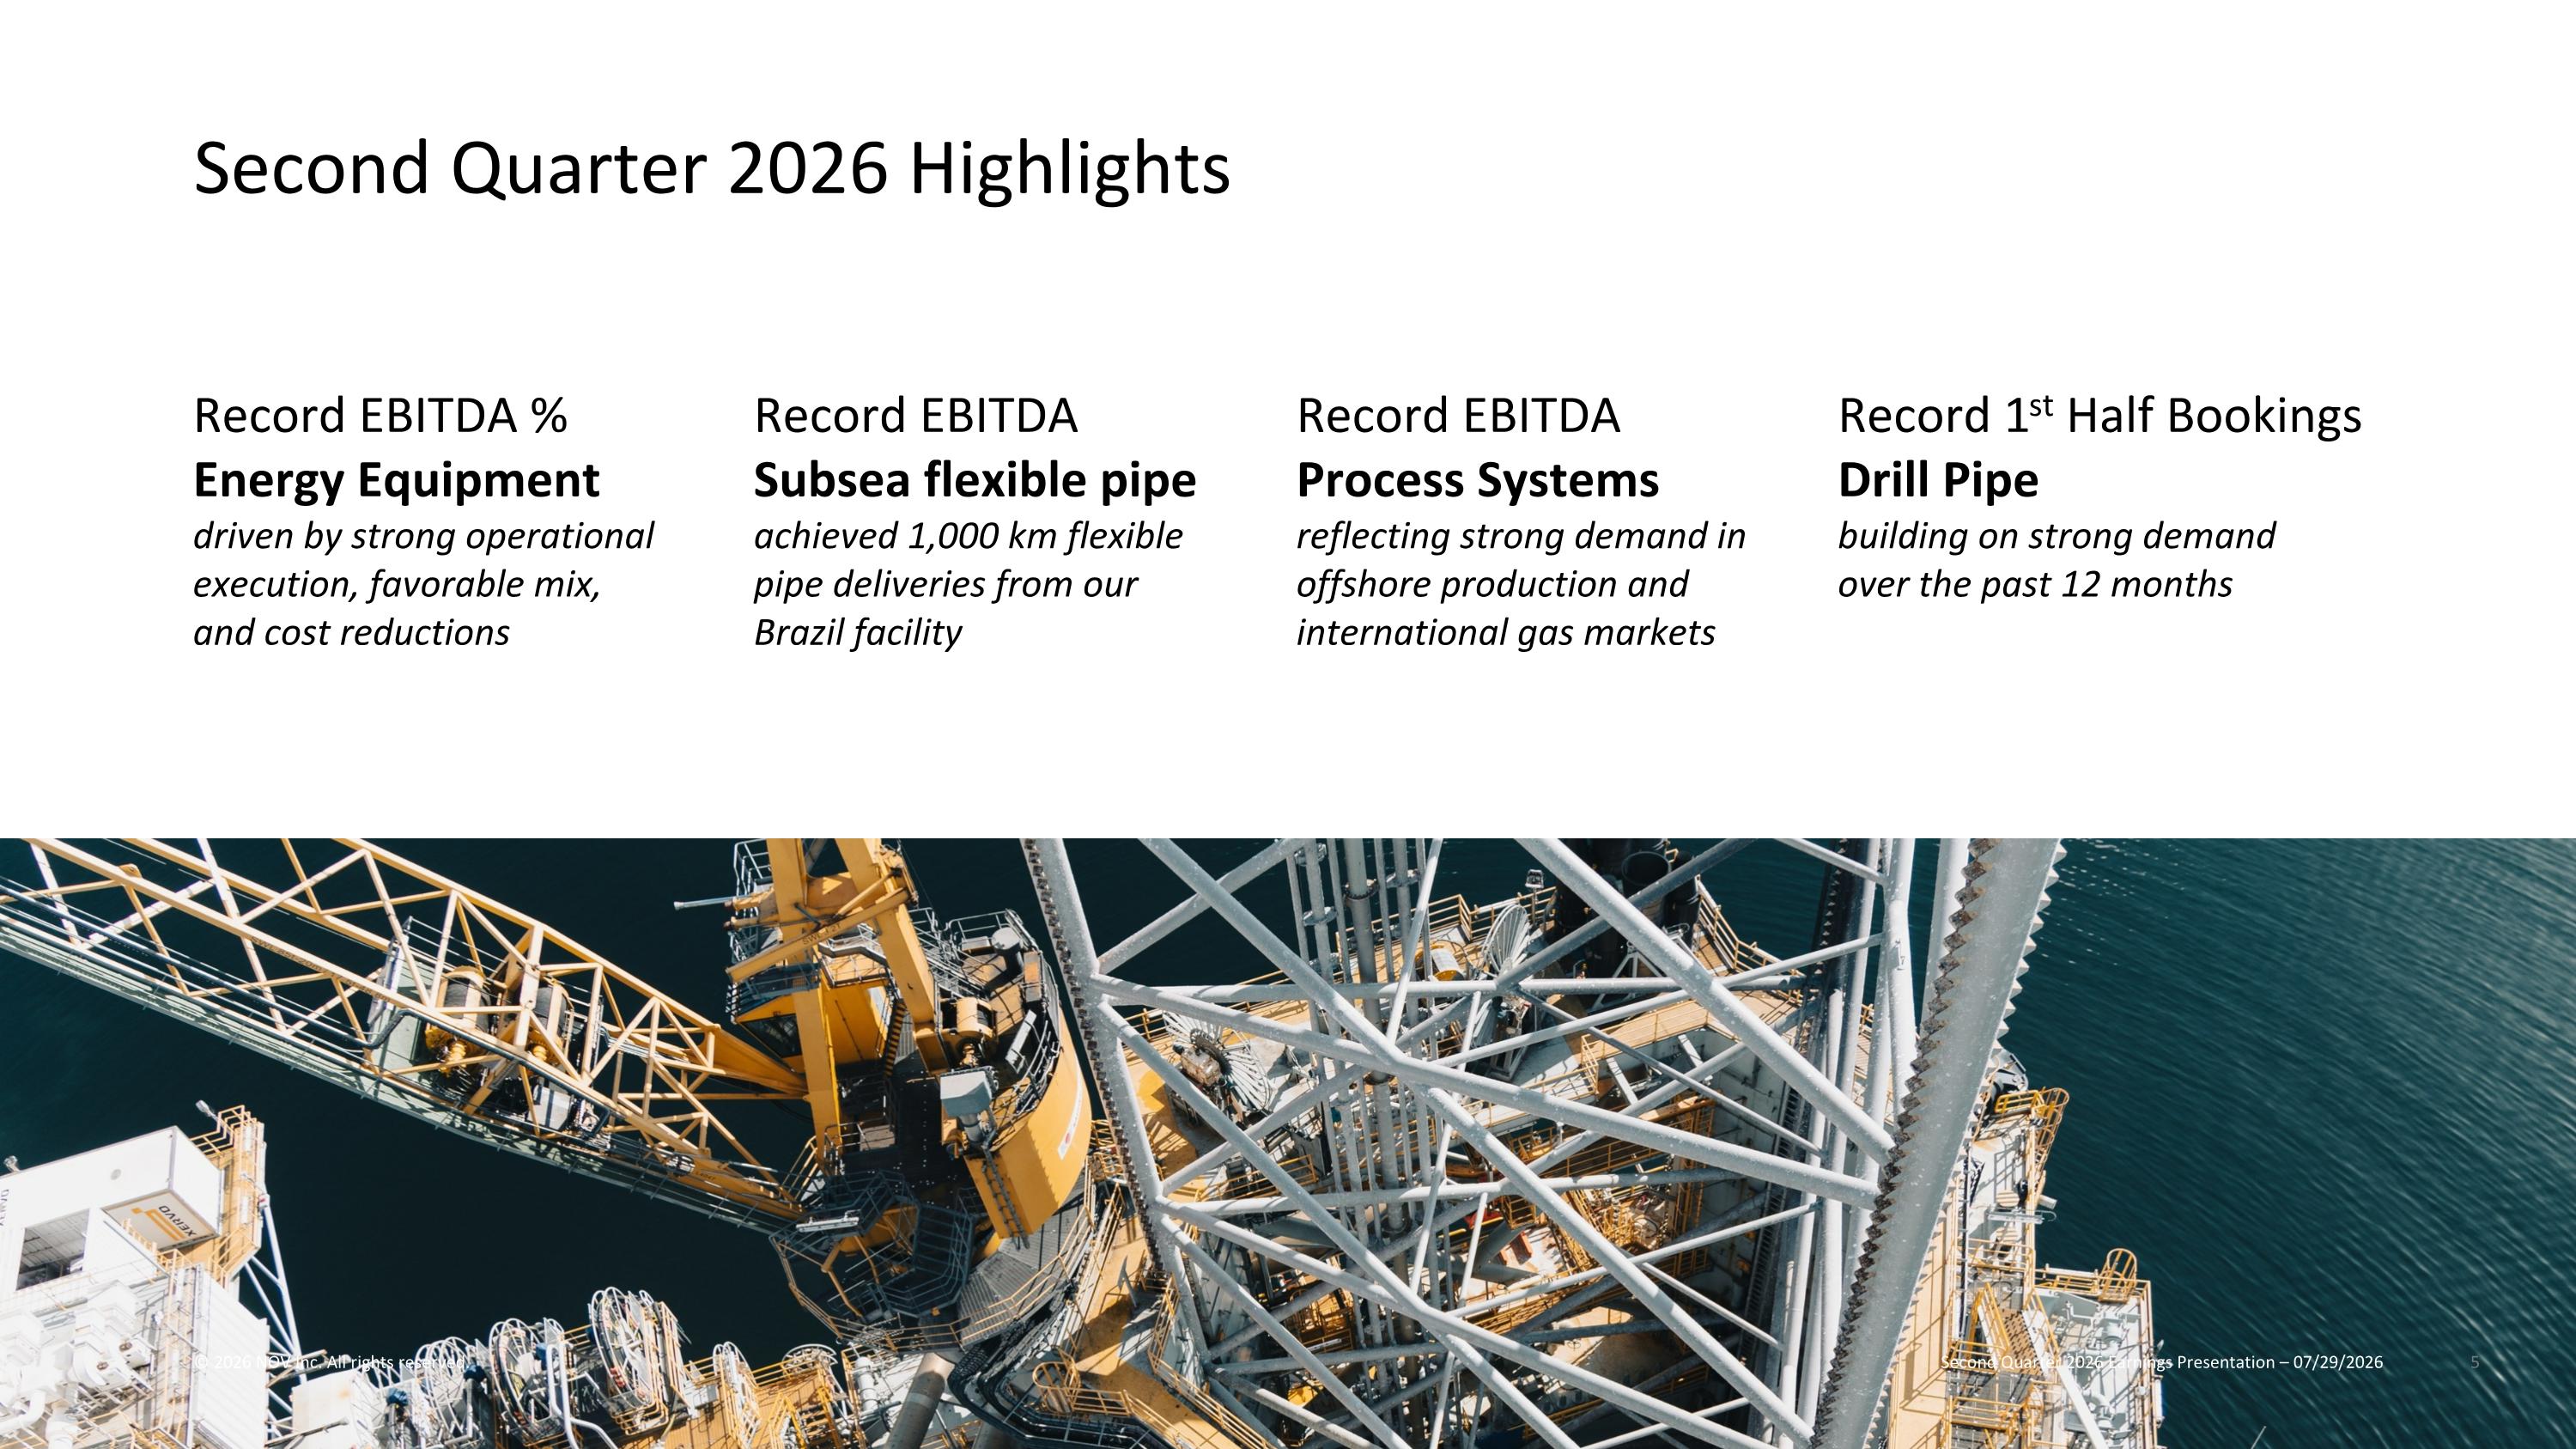
Record 1st Half Bookings Drill Pipe building on strong demand over the past 12 months Second Quarter 2026 Highlights Second Quarter 2026 Earnings Presentation – 07/29/2026 © 2026 NOV Inc. All rights reserved. Record EBITDA % Energy Equipment driven by strong operational execution, favorable mix, and cost reductions Record EBITDA Subsea flexible pipe achieved 1,000 km flexible pipe deliveries from our Brazil facility Record EBITDA Process Systems reflecting strong demand in offshore production and international gas markets
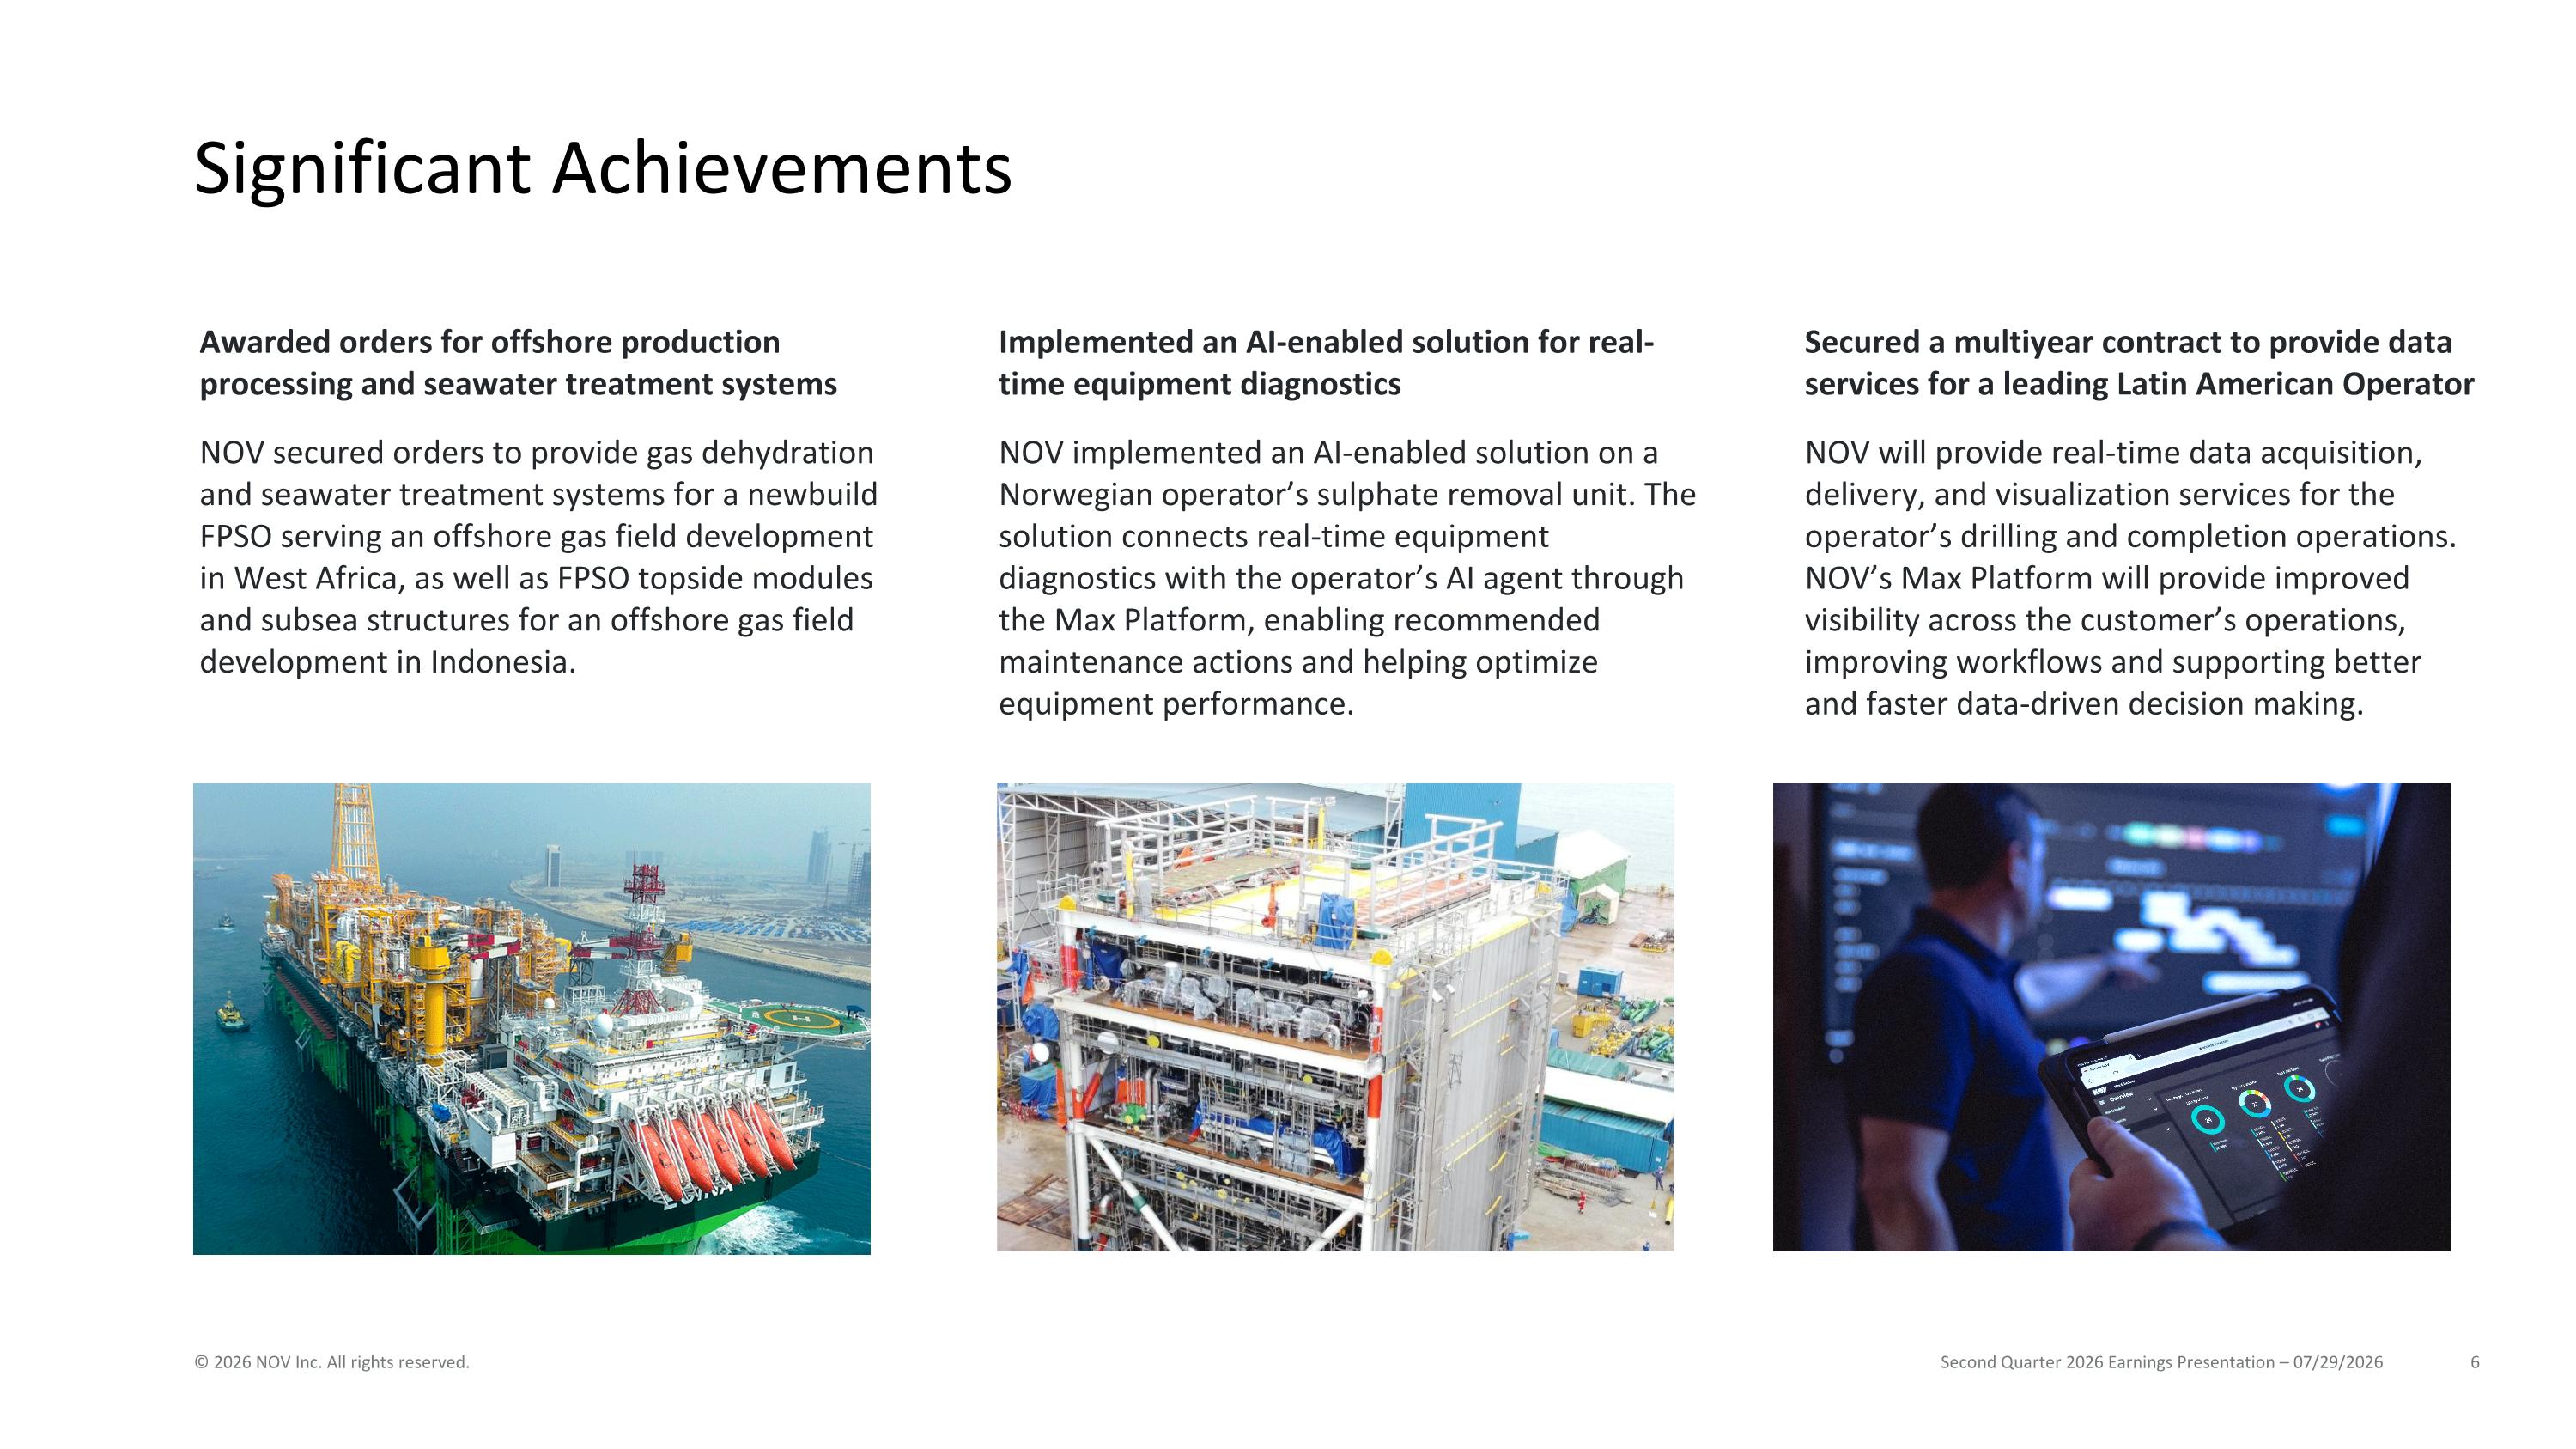
Significant Achievements Second Quarter 2026 Earnings Presentation – 07/29/2026 © 2026 NOV Inc. All rights reserved. Awarded orders for offshore production processing and seawater treatment systems NOV secured orders to provide gas dehydration and seawater treatment systems for a newbuild FPSO serving an offshore gas field development in West Africa, as well as FPSO topside modules and subsea structures for an offshore gas field development in Indonesia. Implemented an AI-enabled solution for real-time equipment diagnostics NOV implemented an AI-enabled solution on a Norwegian operator’s sulphate removal unit. The solution connects real-time equipment diagnostics with the operator’s AI agent through the Max Platform, enabling recommended maintenance actions and helping optimize equipment performance. Secured a multiyear contract to provide data services for a leading Latin American Operator NOV will provide real-time data acquisition, delivery, and visualization services for the operator’s drilling and completion operations. NOV’s Max Platform will provide improved visibility across the customer’s operations, improving workflows and supporting better and faster data-driven decision making.
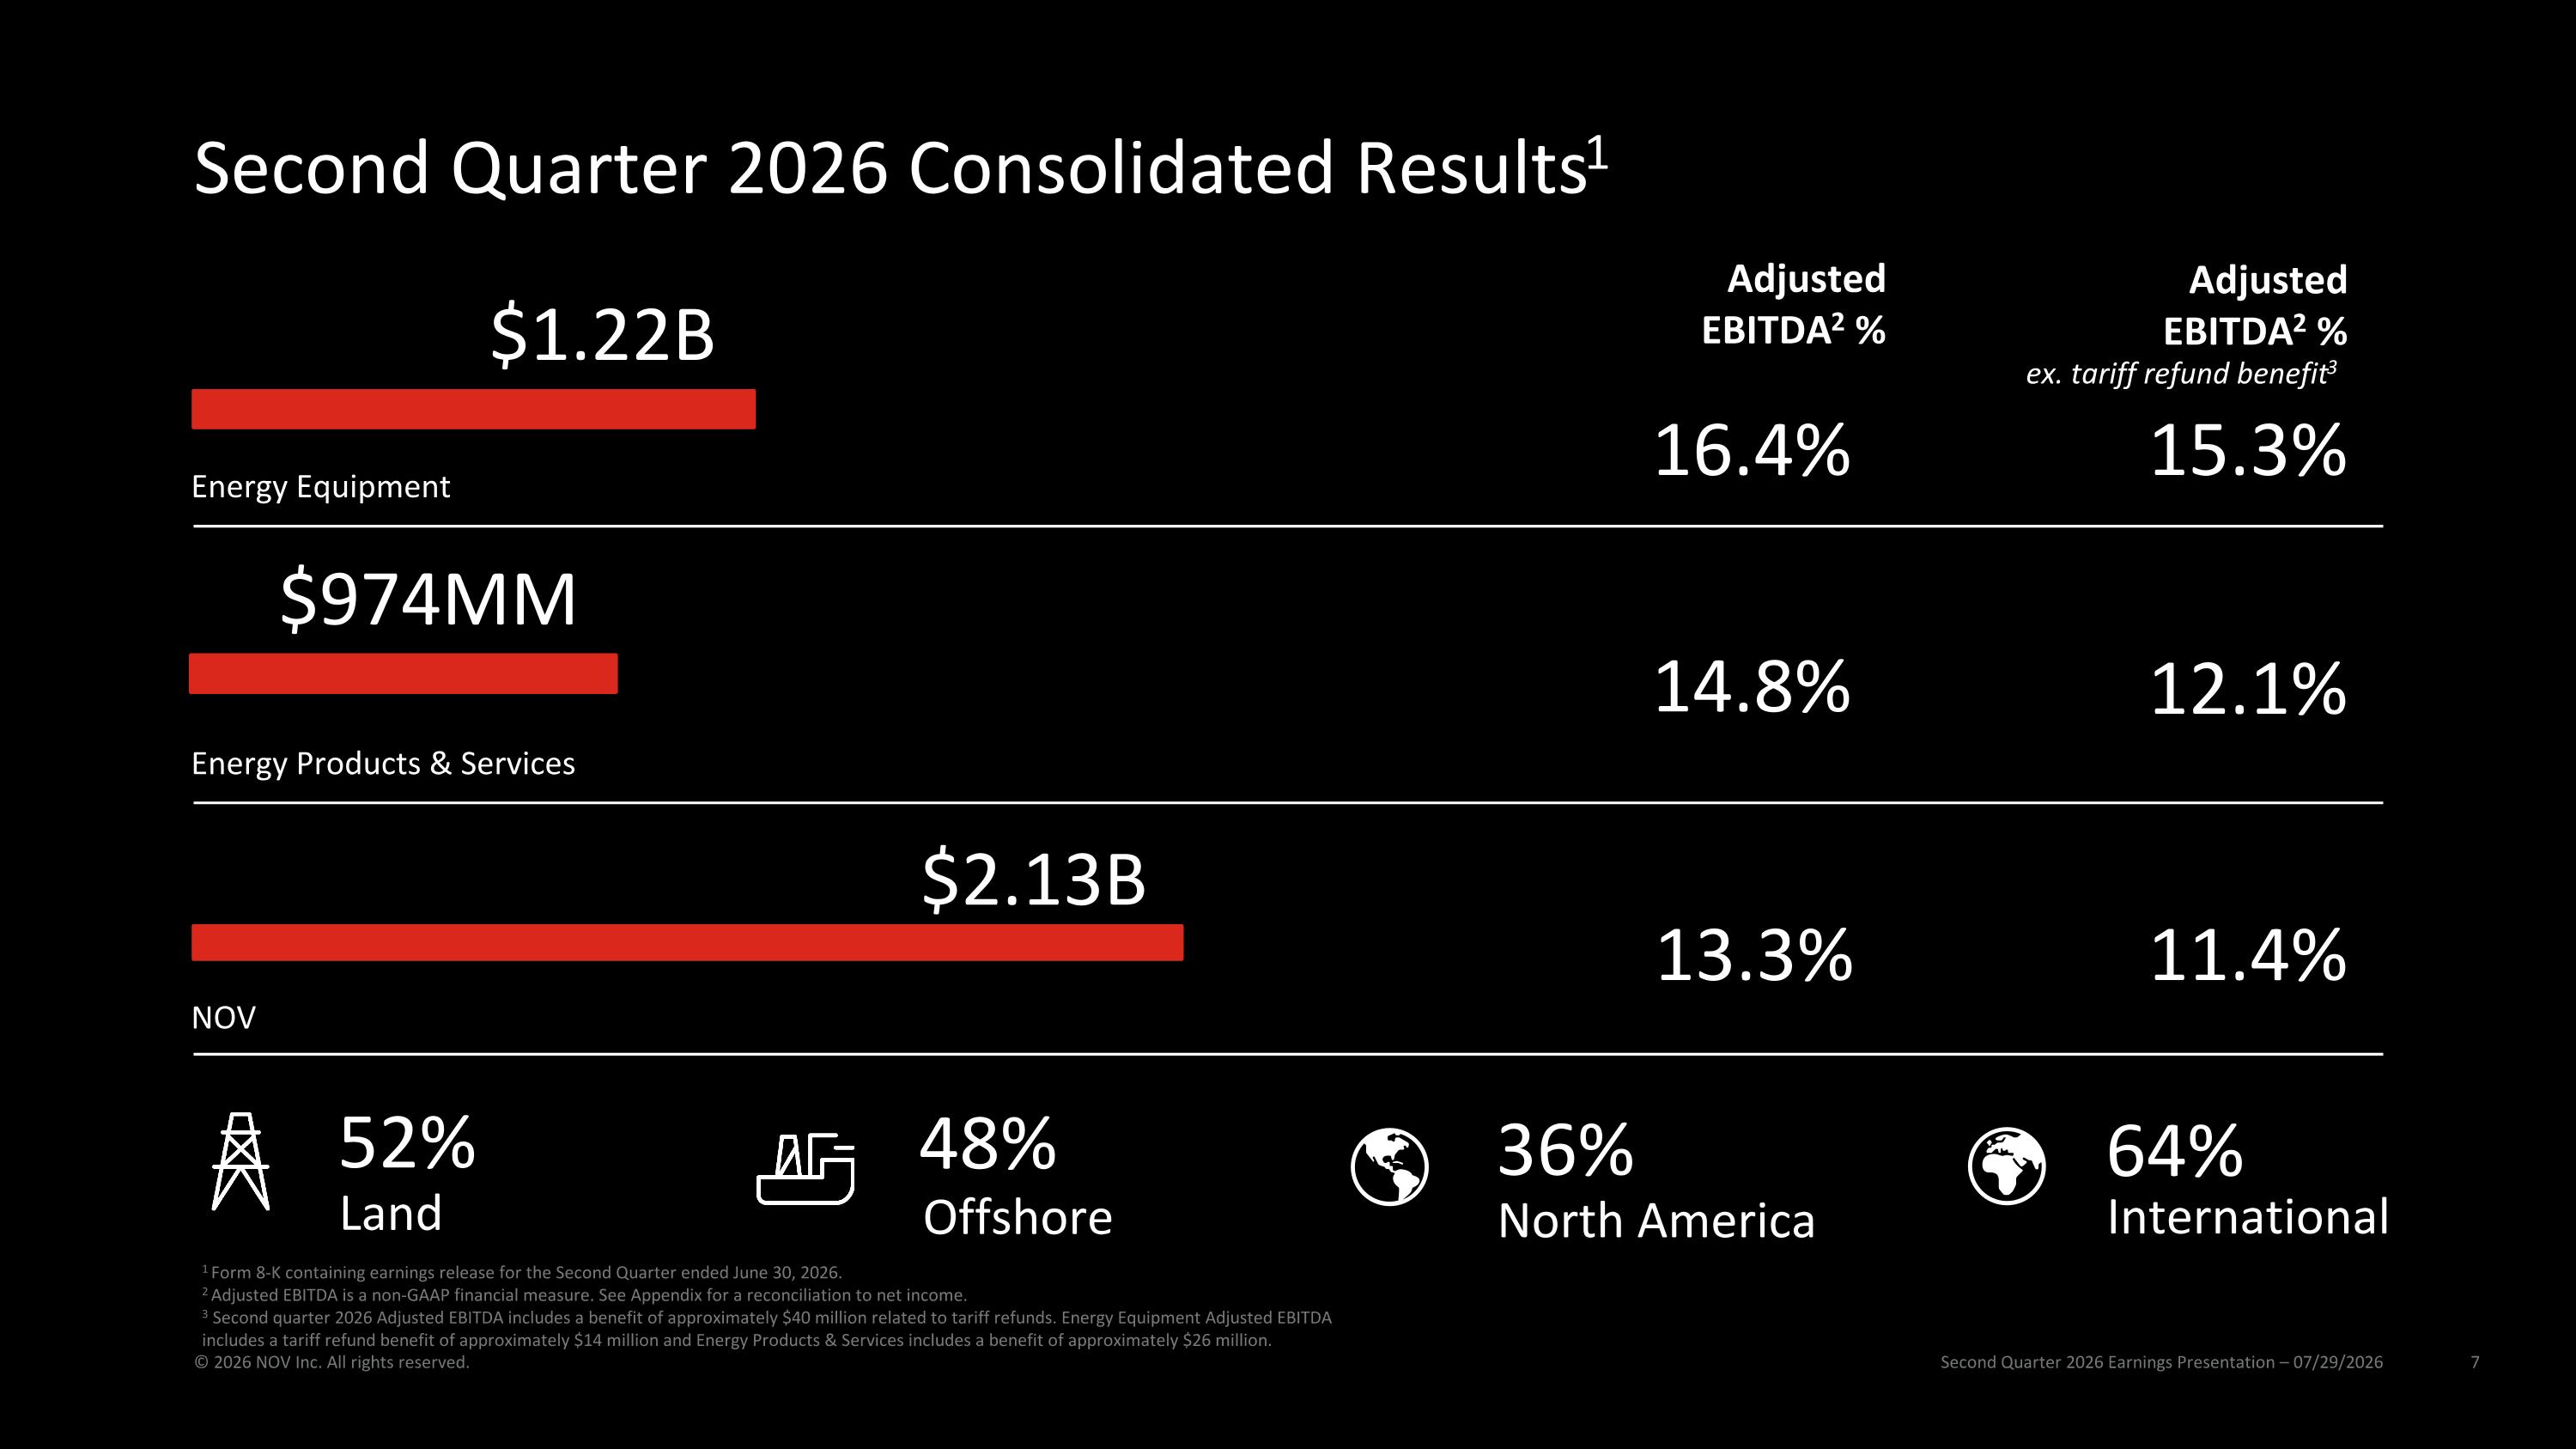
Second Quarter 2026 Consolidated Results1 Second Quarter 2026 Earnings Presentation – 07/29/2026 © 2026 NOV Inc. All rights reserved. $974MM $1.22B Energy Equipment Energy Products & Services 16.4% 15.3% 14.8% 12.1% 36% North America 64% International 52% Land 48% Offshore $2.13B NOV 11.4% 13.3% 1 Form 8-K containing earnings release for the Second Quarter ended June 30, 2026. 2 Adjusted EBITDA is a non-GAAP financial measure. See Appendix for a reconciliation to net income. 3 Second quarter 2026 Adjusted EBITDA includes a benefit of approximately $40 million related to tariff refunds. Energy Equipment Adjusted EBITDA includes a tariff refund benefit of approximately $14 million and Energy Products & Services includes a benefit of approximately $26 million. Adjusted EBITDA2 % Adjusted EBITDA2 % ex. tariff refund benefit3
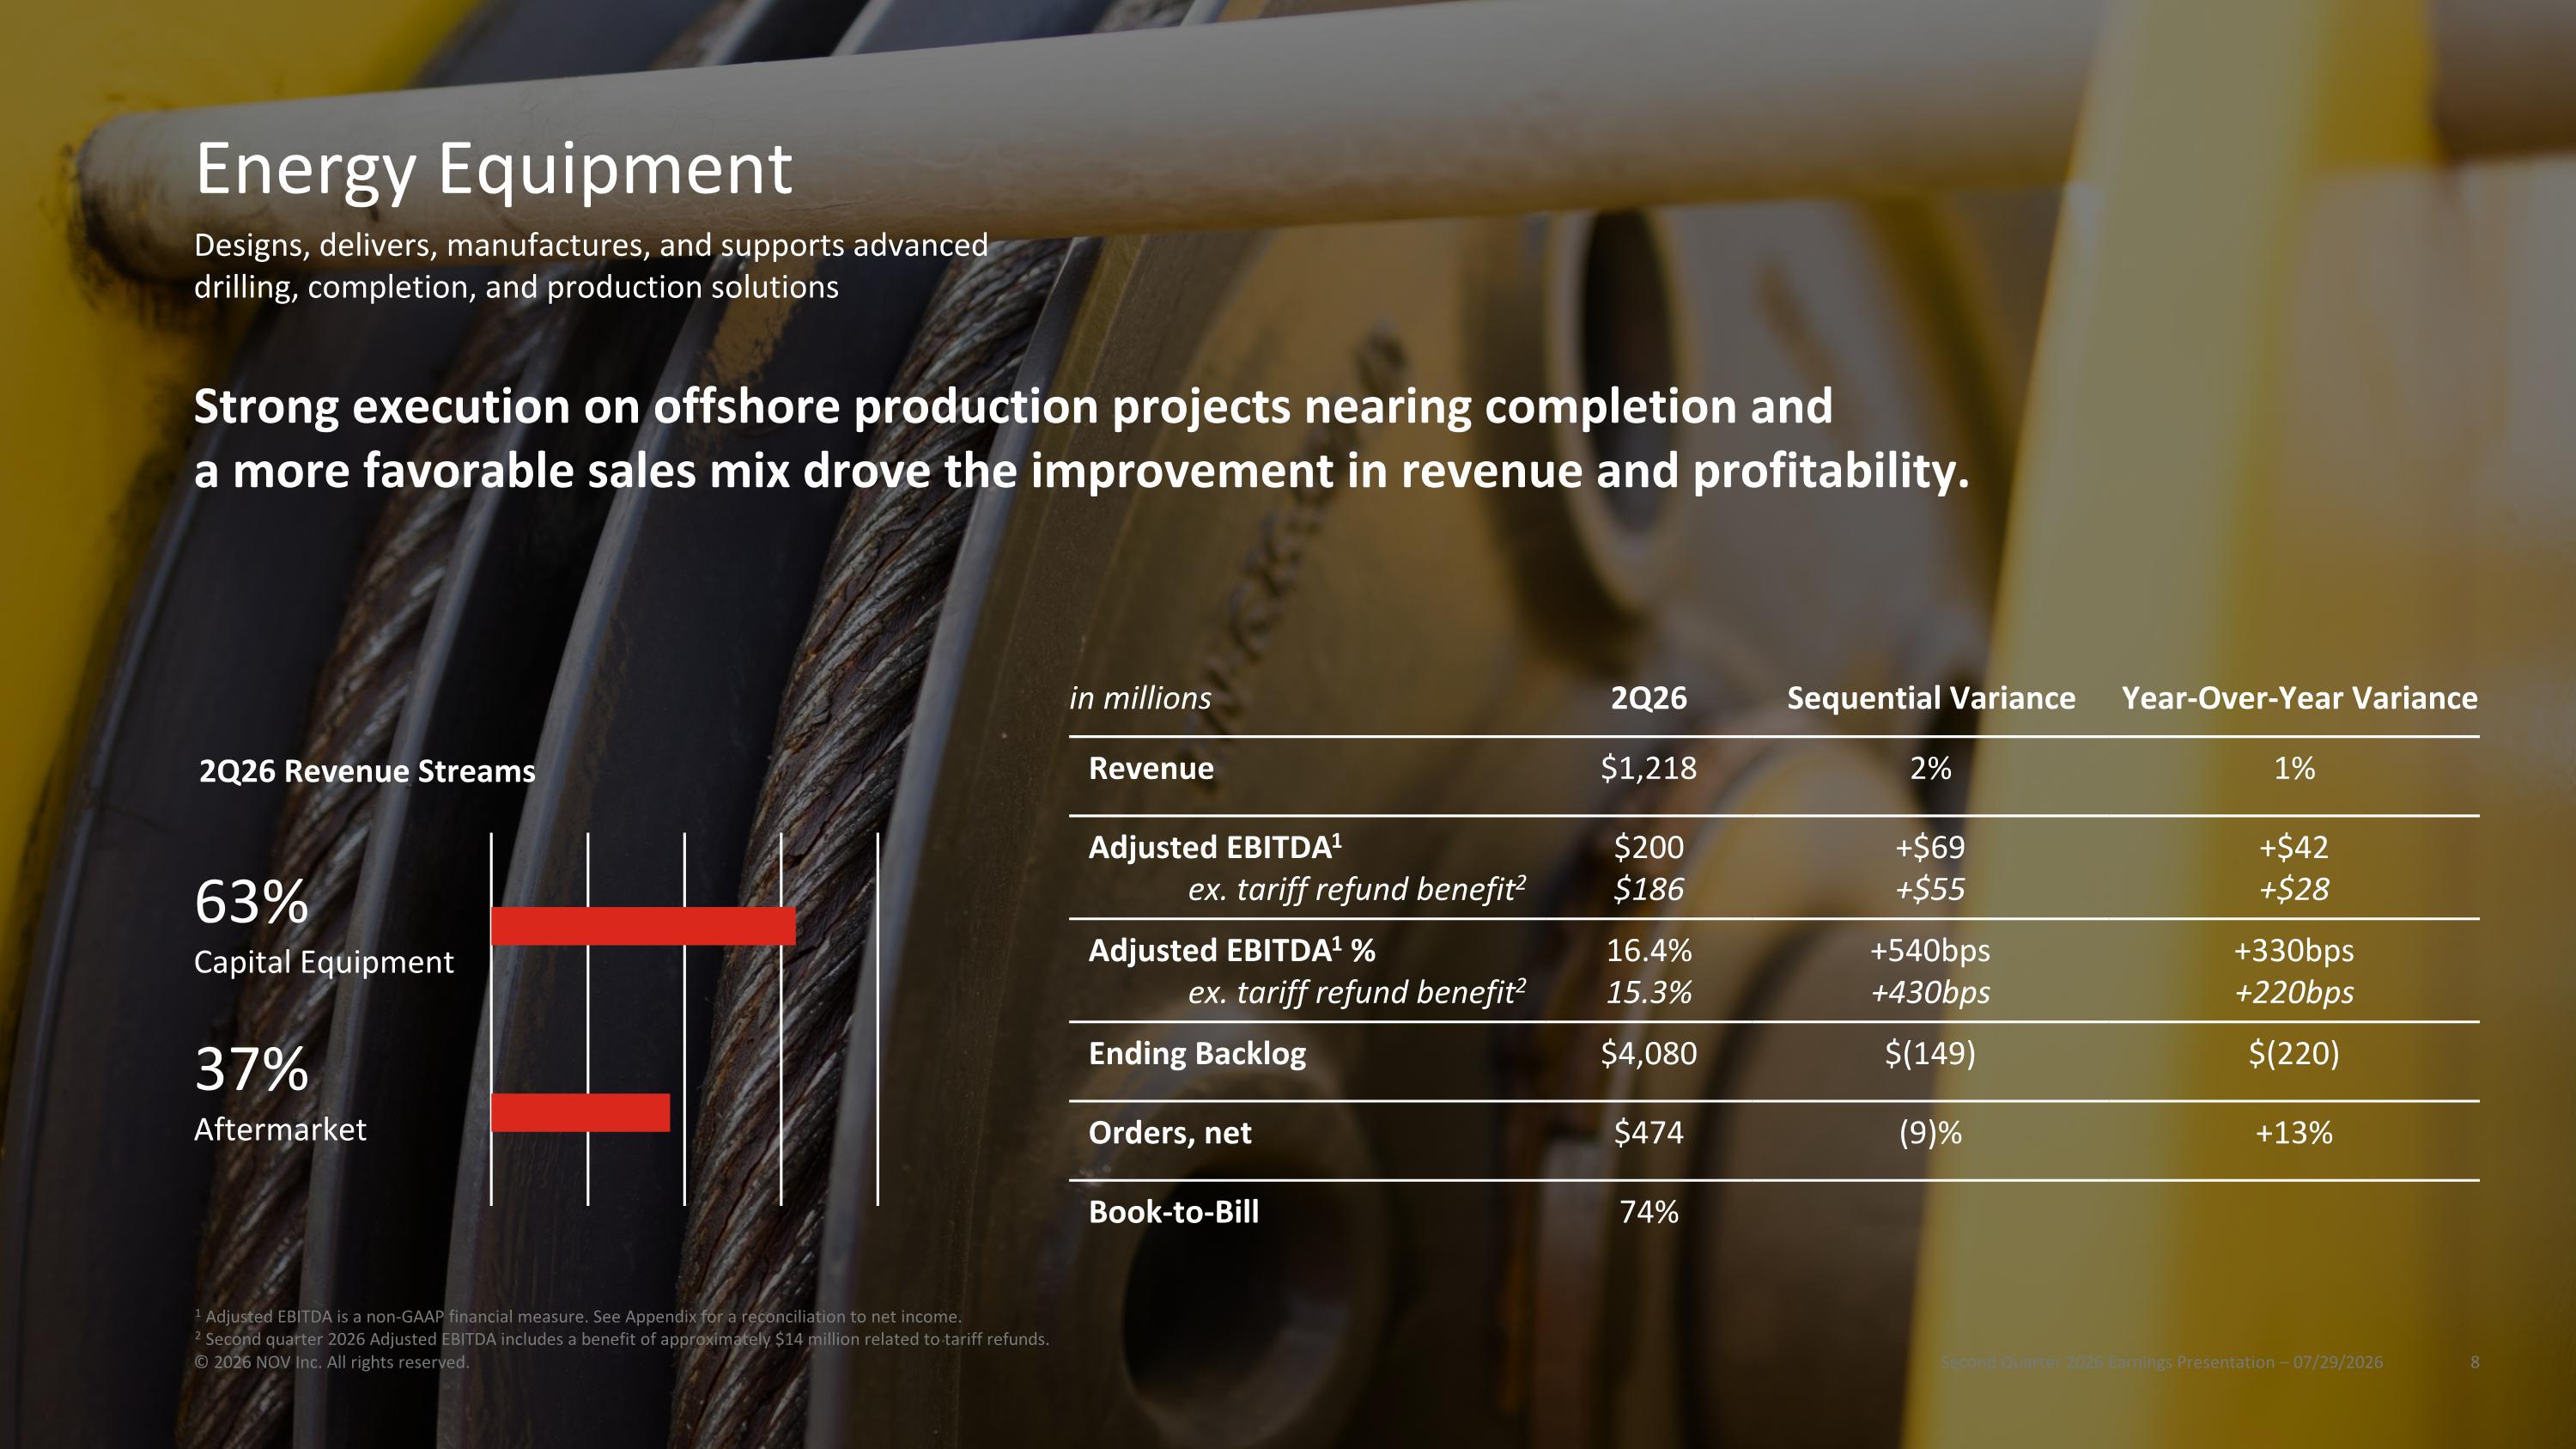
in millions 2Q26 Sequential Variance Year-Over-Year Variance Revenue $1,218 2% 1% Adjusted EBITDA1 ex. tariff refund benefit2 $200 $186 +$69 +$55 +$42 +$28 Adjusted EBITDA1 % ex. tariff refund benefit2 16.4% 15.3% +540bps +430bps +330bps +220bps Ending Backlog $4,080 $(149) $(220) Orders, net $474 (9)% +13% Book-to-Bill 74% Strong execution on offshore production projects nearing completion and a more favorable sales mix drove the improvement in revenue and profitability. 2Q26 Revenue Streams 37% Aftermarket 63% Capital Equipment Energy Equipment Second Quarter 2026 Earnings Presentation – 07/29/2026 © 2026 NOV Inc. All rights reserved. Designs, delivers, manufactures, and supports advanced drilling, completion, and production solutions 1 Adjusted EBITDA is a non-GAAP financial measure. See Appendix for a reconciliation to net income. 2 Second quarter 2026 Adjusted EBITDA includes a benefit of approximately $14 million related to tariff refunds.
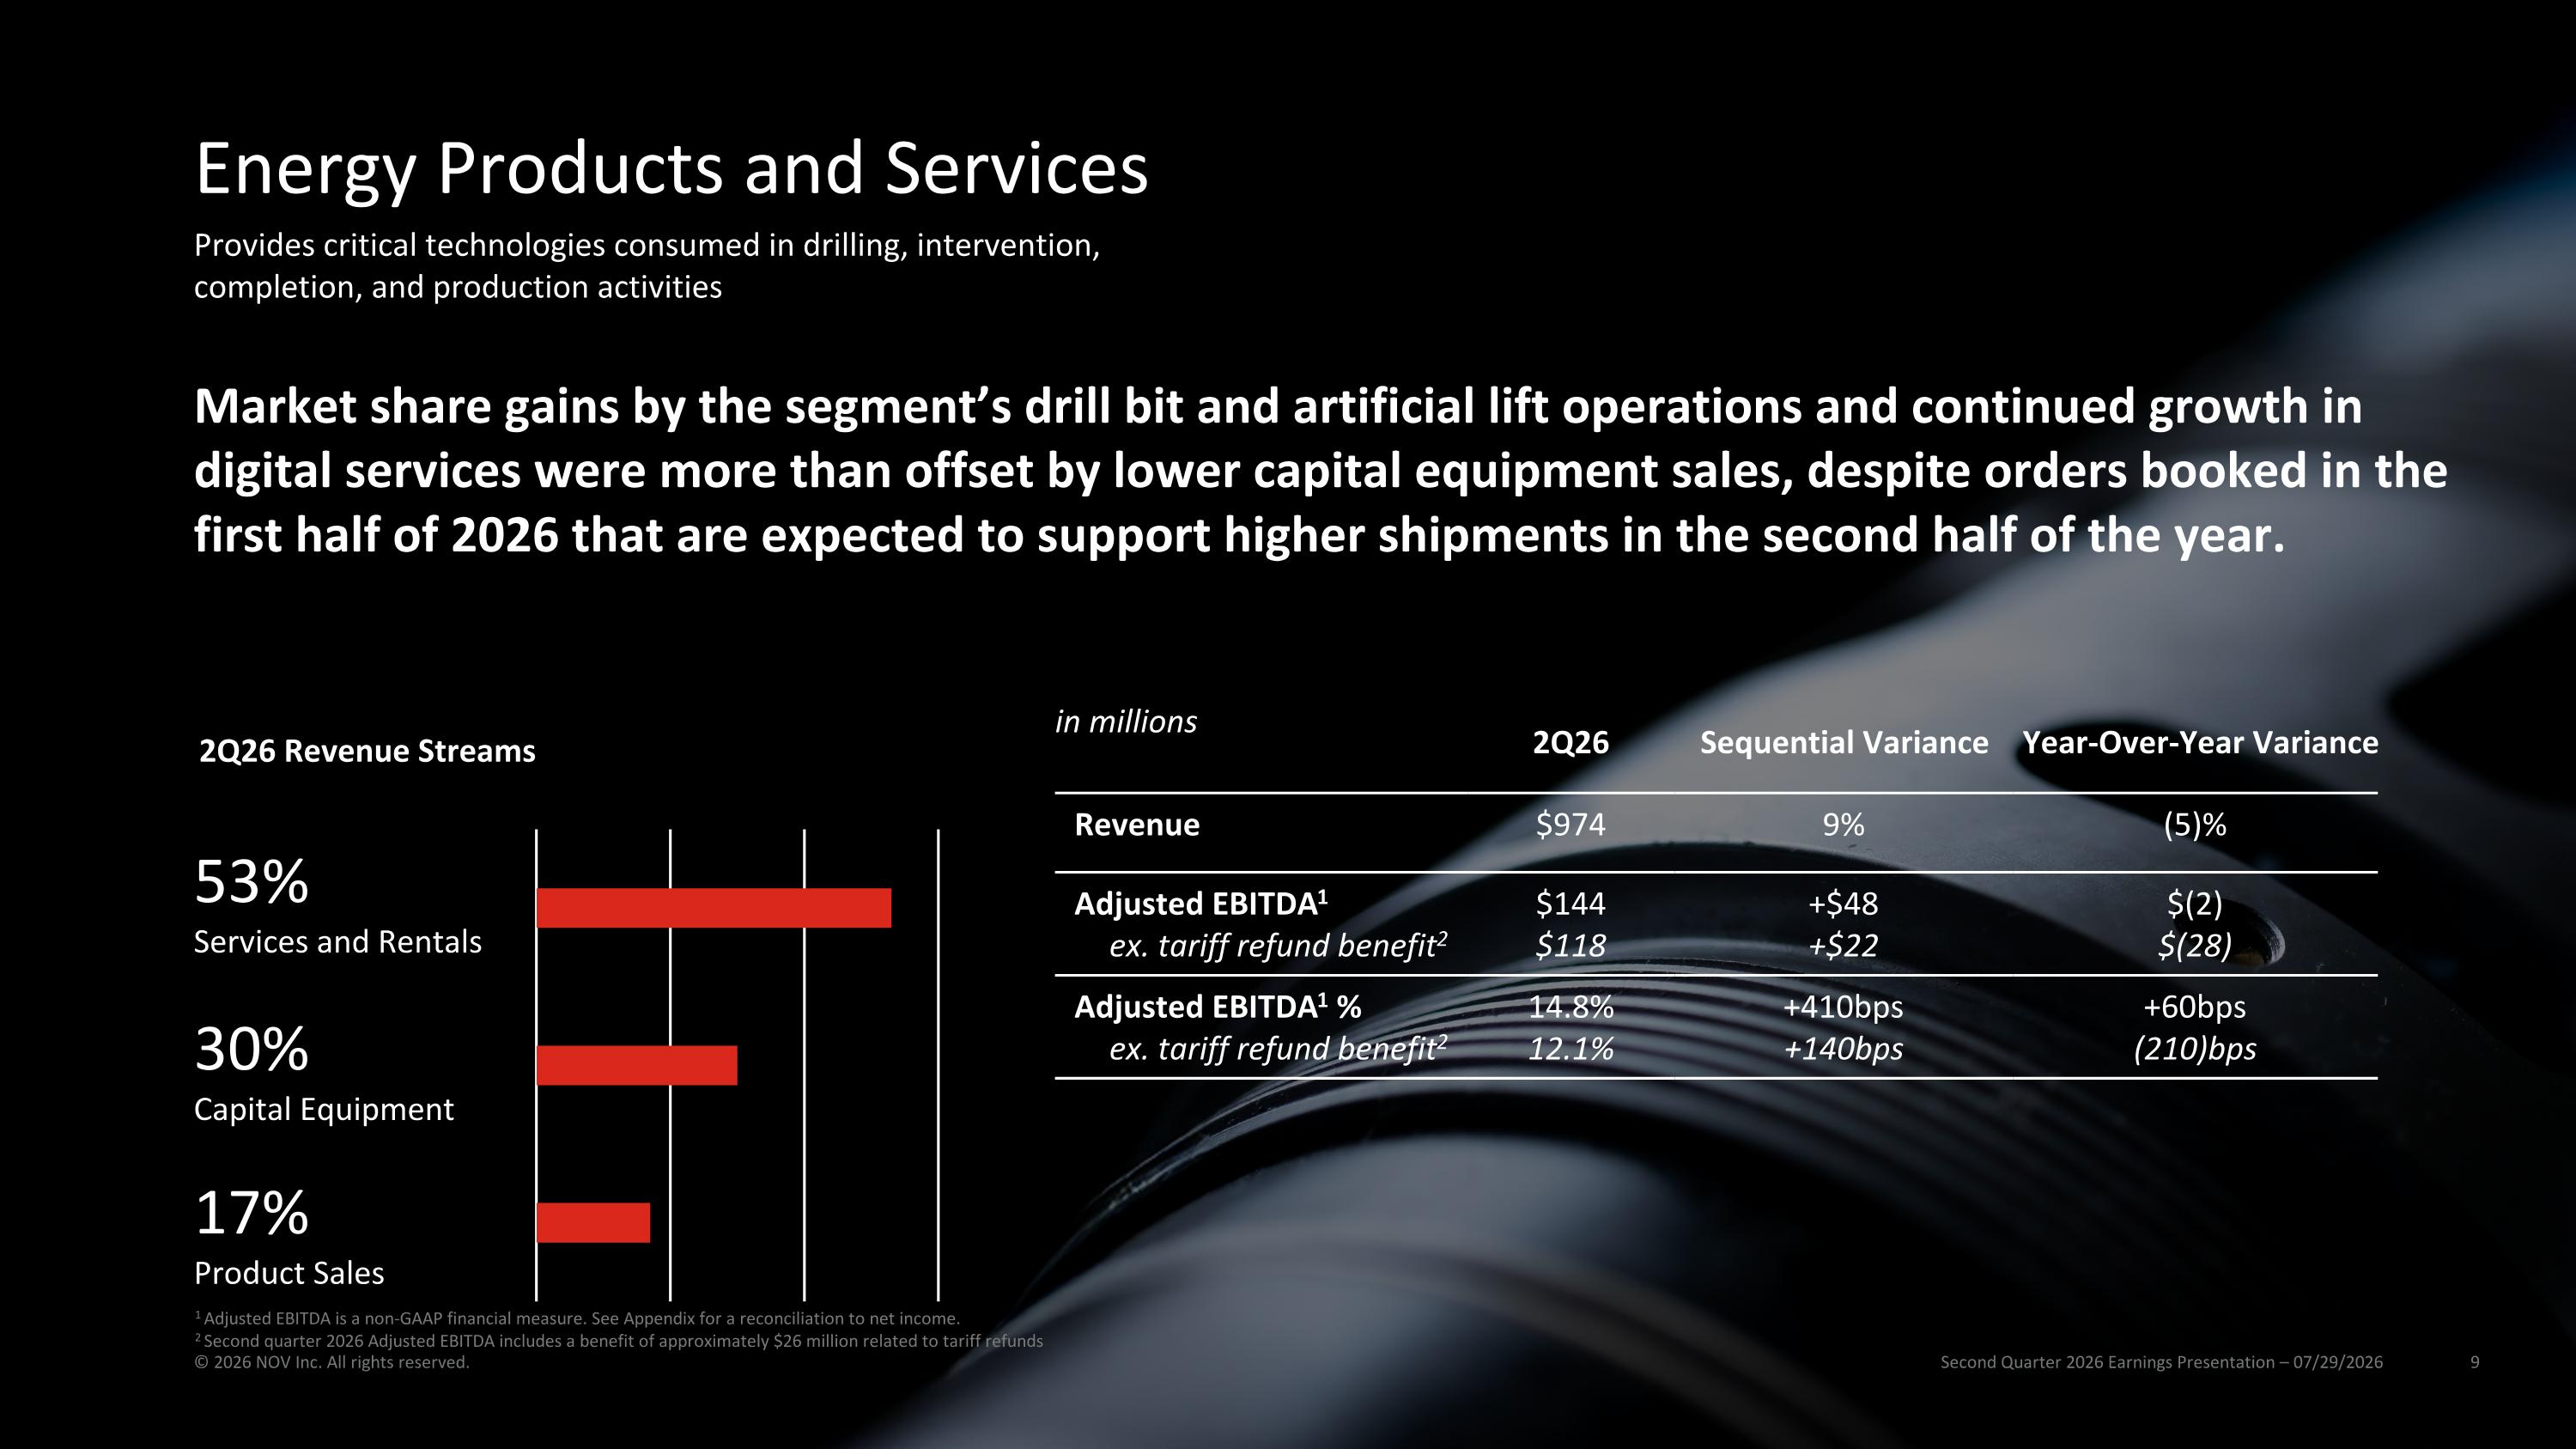
in millions 2Q26 Sequential Variance Year-Over-Year Variance Revenue $974 9% (5)% Adjusted EBITDA1 ex. tariff refund benefit2 $144 $118 +$48 +$22 $(2) $(28) Adjusted EBITDA1 % ex. tariff refund benefit2 14.8% 12.1% +410bps +140bps +60bps (210)bps Market share gains by the segment’s drill bit and artificial lift operations and continued growth in digital services were more than offset by lower capital equipment sales, despite orders booked in the first half of 2026 that are expected to support higher shipments in the second half of the year. 2Q26 Revenue Streams 30% Capital Equipment 53% Services and Rentals 17% Product Sales Energy Products and Services Second Quarter 2026 Earnings Presentation – 07/29/2026 © 2026 NOV Inc. All rights reserved. Provides critical technologies consumed in drilling, intervention, completion, and production activities 1 Adjusted EBITDA is a non-GAAP financial measure. See Appendix for a reconciliation to net income. 2 Second quarter 2026 Adjusted EBITDA includes a benefit of approximately $26 million related to tariff refunds
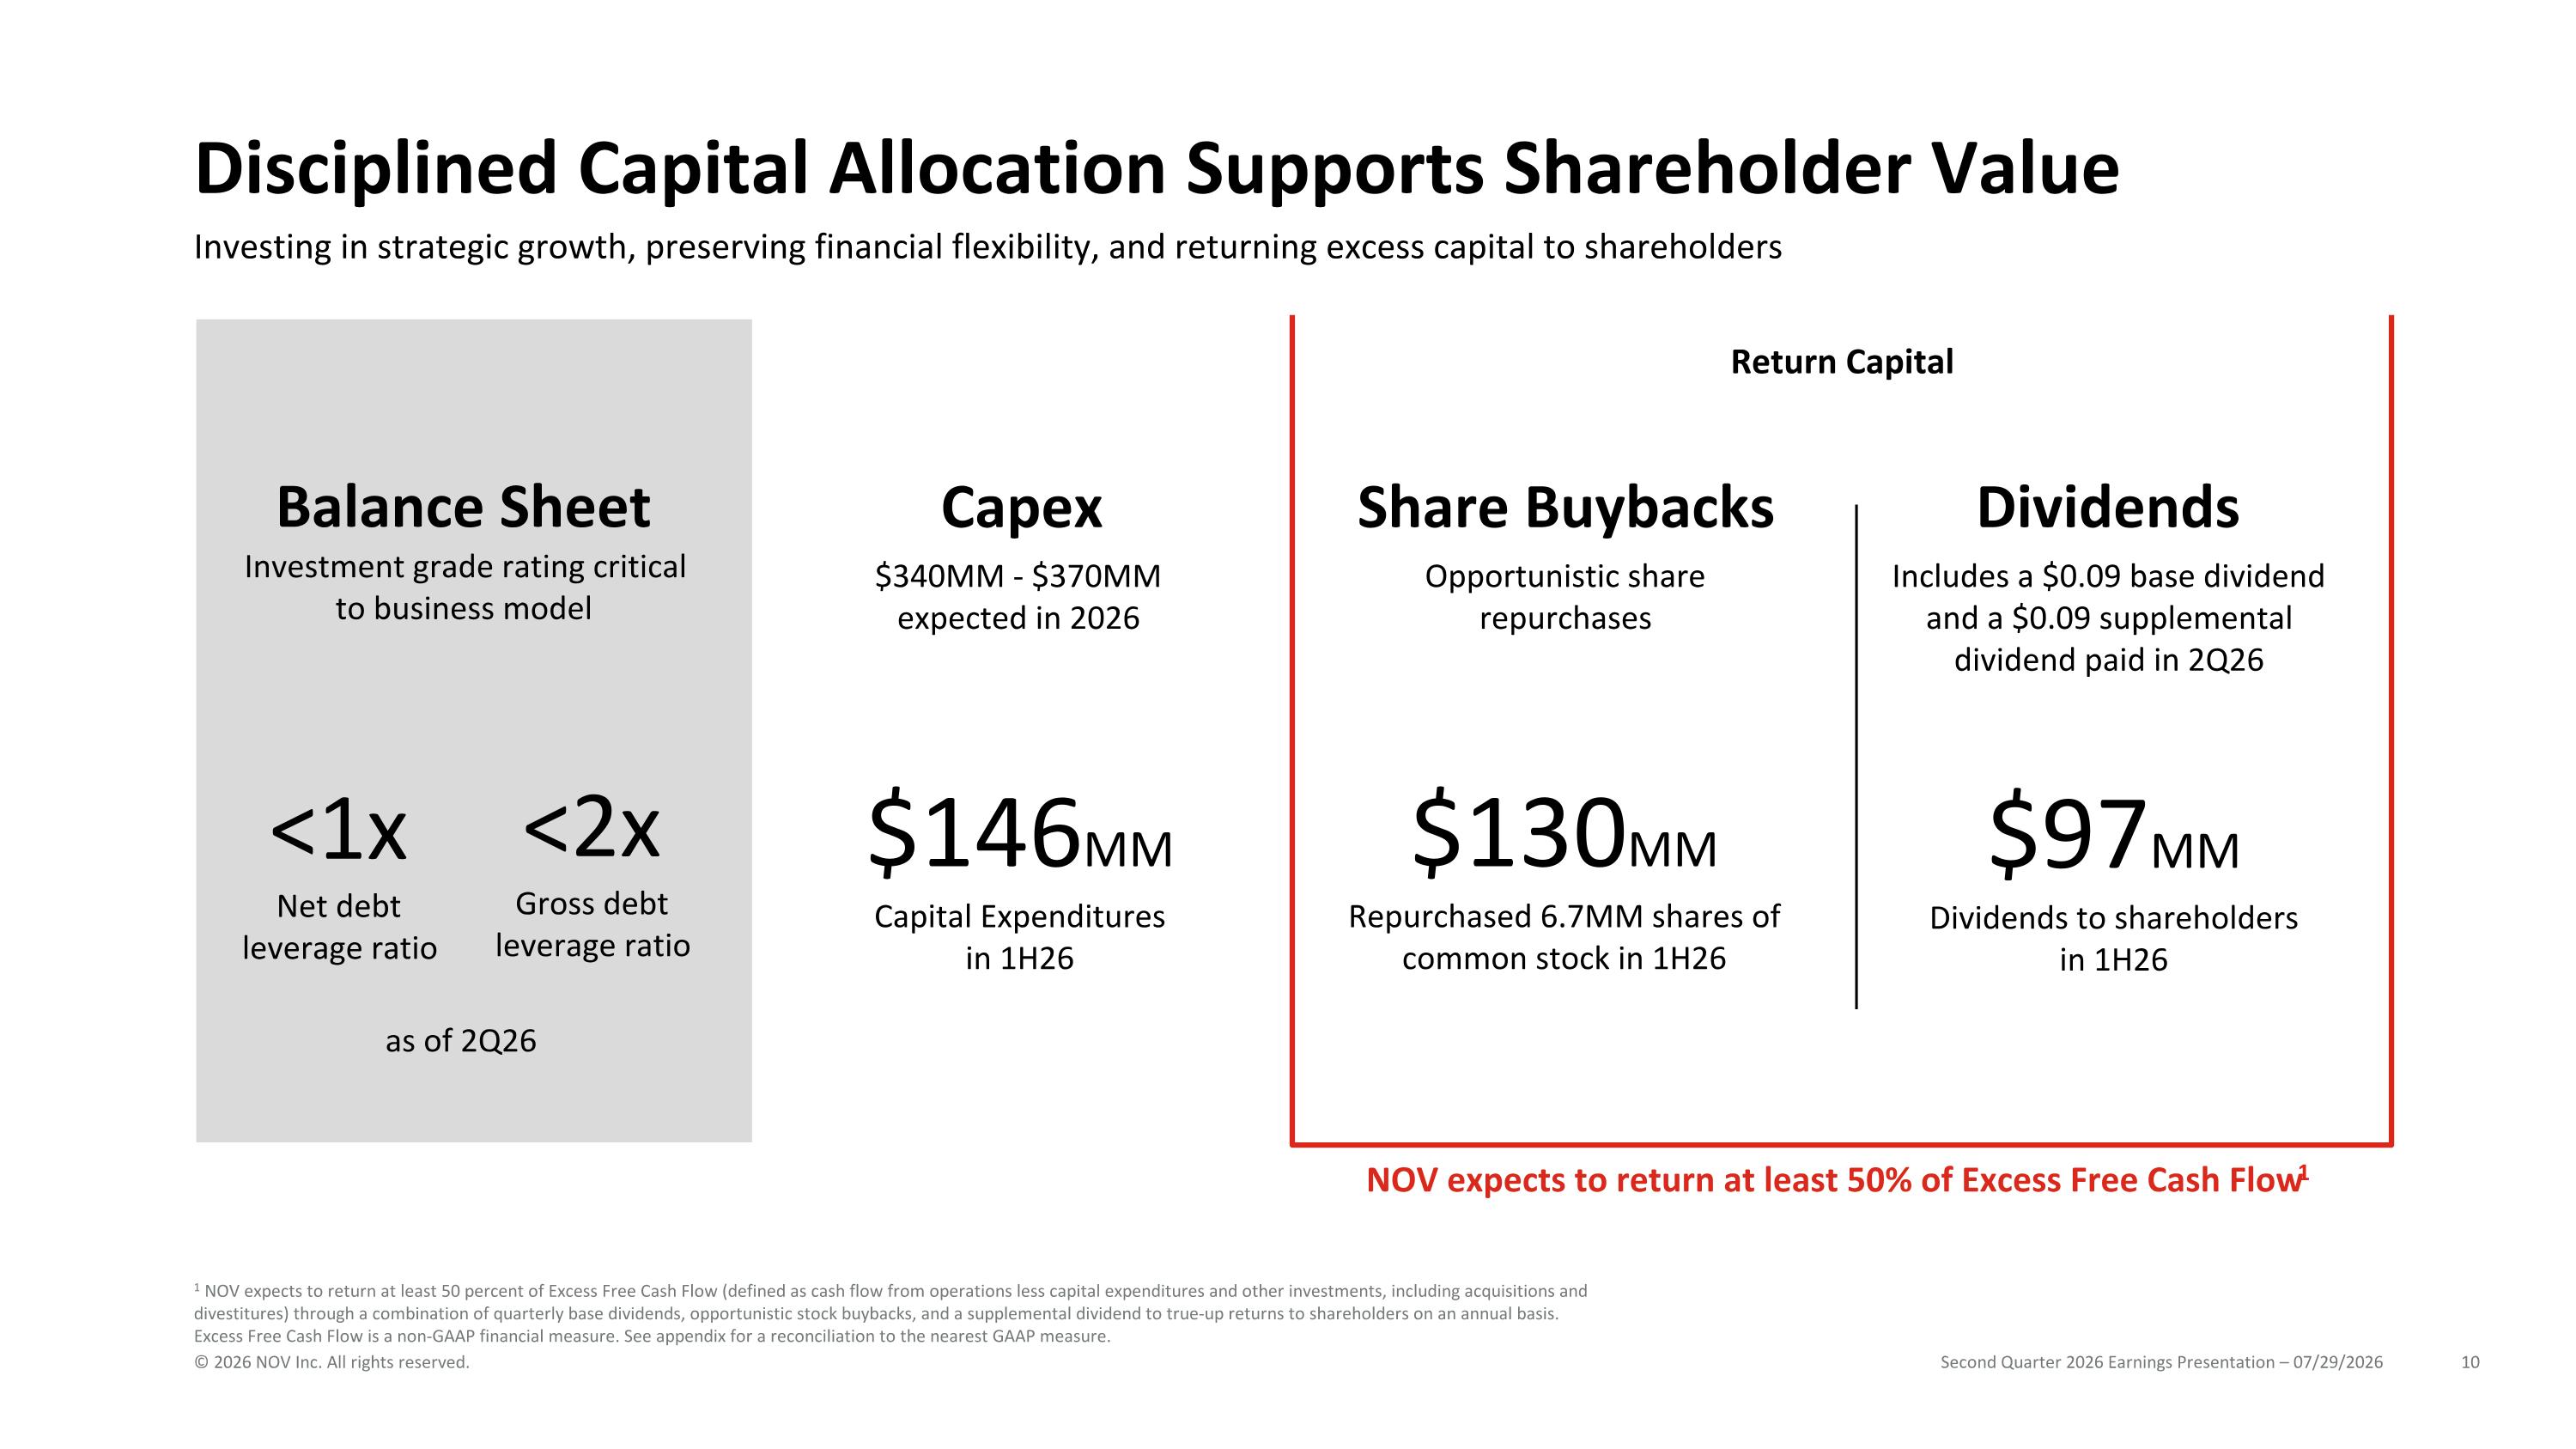
Disciplined Capital Allocation Supports Shareholder Value Investing in strategic growth, preserving financial flexibility, and returning excess capital to shareholders NOV expects to return at least 50% of Excess Free Cash Flow1 1 NOV expects to return at least 50 percent of Excess Free Cash Flow (defined as cash flow from operations less capital expenditures and other investments, including acquisitions and divestitures) through a combination of quarterly base dividends, opportunistic stock buybacks, and a supplemental dividend to true-up returns to shareholders on an annual basis. Excess Free Cash Flow is a non-GAAP financial measure. See appendix for a reconciliation to the nearest GAAP measure. $340MM - $370MM expected in 2026 Opportunistic share repurchases Includes a $0.09 base dividend and a $0.09 supplemental dividend paid in 2Q26 Balance Sheet Capex Share Buybacks Dividends Investment grade rating critical to business model $146MM Capital Expenditures in 1H26 $130MM Repurchased 6.7MM shares of common stock in 1H26 <1x Net debt leverage ratio <2x Gross debt leverage ratio as of 2Q26 $97MM Dividends to shareholders in 1H26 Return Capital Second Quarter 2026 Earnings Presentation – 07/29/2026 © 2026 NOV Inc. All rights reserved.
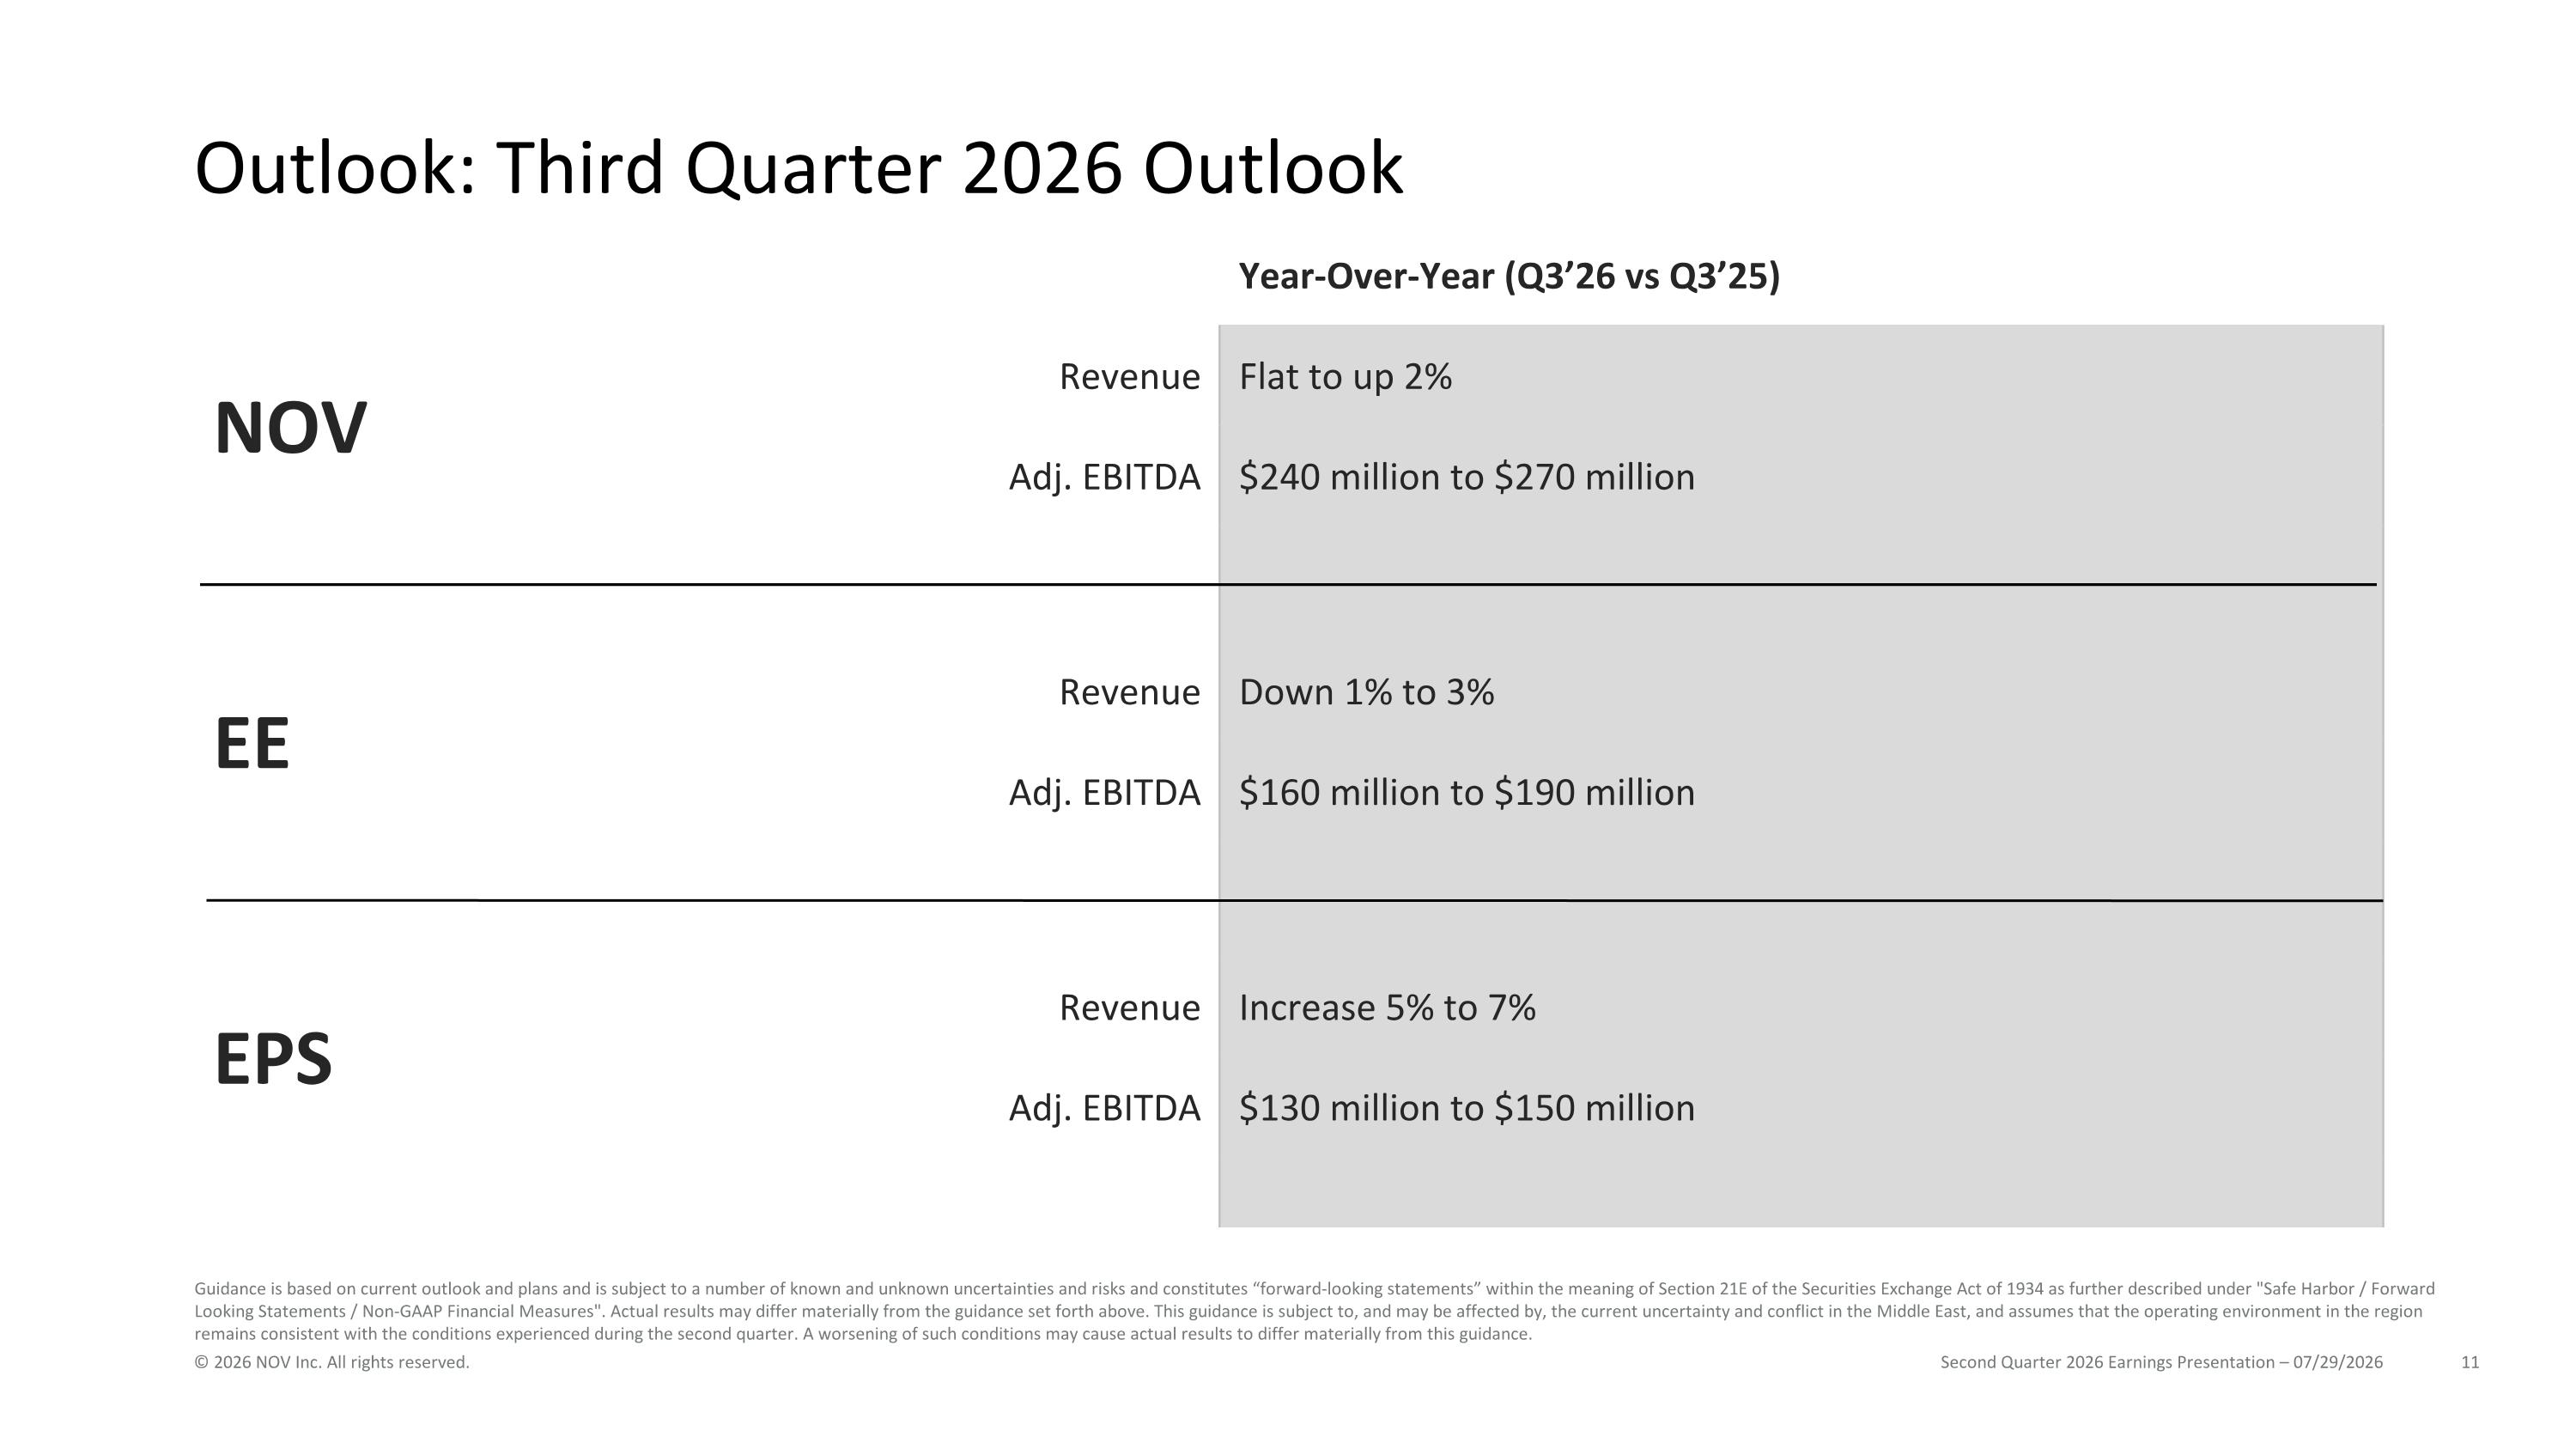
Outlook: Third Quarter 2026 Outlook Second Quarter 2026 Earnings Presentation – 07/29/2026 © 2026 NOV Inc. All rights reserved. Year-Over-Year (Q3’26 vs Q3’25) NOV Revenue Flat to up 2% Adj. EBITDA $240 million to $270 million EE Revenue Down 1% to 3% Adj. EBITDA $160 million to $190 million EPS Revenue Increase 5% to 7% Adj. EBITDA $130 million to $150 million Guidance is based on current outlook and plans and is subject to a number of known and unknown uncertainties and risks and constitutes “forward-looking statements” within the meaning of Section 21E of the Securities Exchange Act of 1934 as further described under "Safe Harbor / Forward Looking Statements / Non-GAAP Financial Measures". Actual results may differ materially from the guidance set forth above. This guidance is subject to, and may be affected by, the current uncertainty and conflict in the Middle East, and assumes that the operating environment in the region remains consistent with the conditions experienced during the second quarter. A worsening of such conditions may cause actual results to differ materially from this guidance.
Appendix Second Quarter 2026 Earnings Presentation – 07/29/2026 © 2026 NOV Inc. All rights reserved.
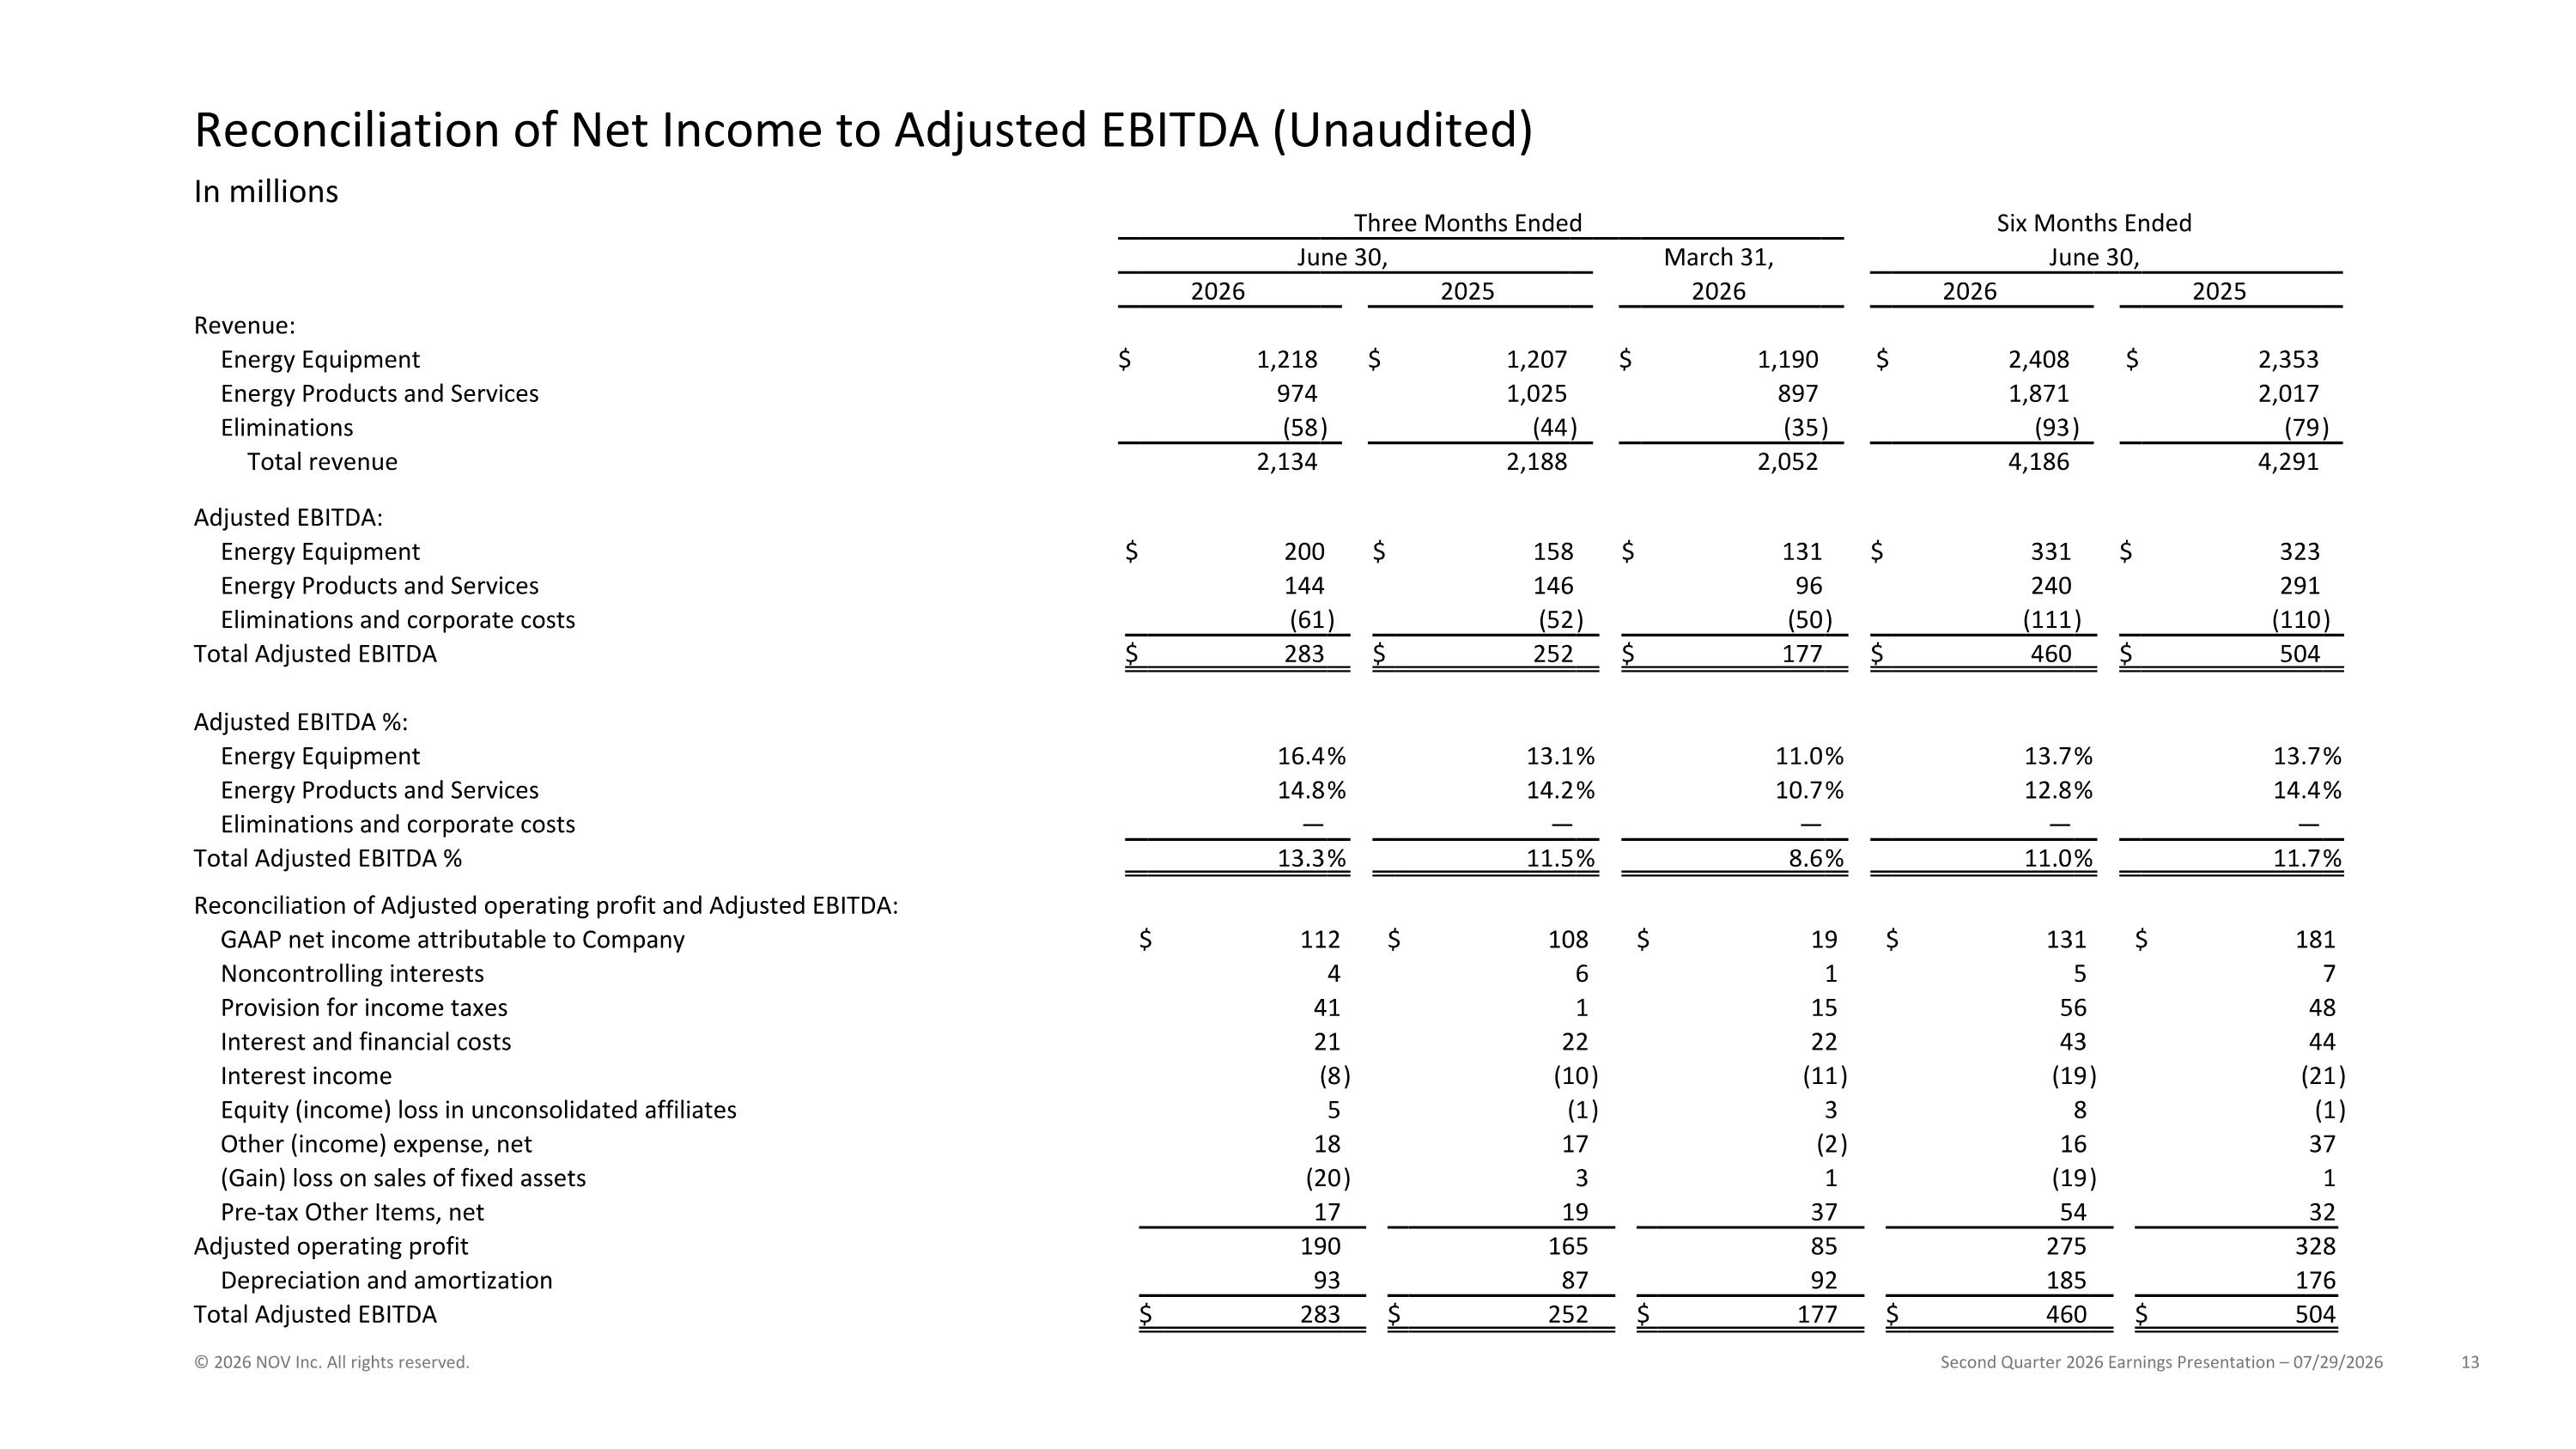
Reconciliation of Net Income to Adjusted EBITDA (Unaudited) Second Quarter 2026 Earnings Presentation – 07/29/2026 © 2026 NOV Inc. All rights reserved. In millions Three Months Ended Six Months Ended June 30, March 31, June 30, 2026 2025 2026 2026 2025 Revenue: Energy Equipment $ 1,218 $ 1,207 $ 1,190 $ 2,408 $ 2,353 Energy Products and Services 974 1,025 897 1,871 2,017 Eliminations (58 ) (44 ) (35 ) (93 ) (79 ) Total revenue 2,134 2,188 2,052 4,186 4,291 Adjusted EBITDA: Energy Equipment $ 200 $ 158 $ 131 $ 331 $ 323 Energy Products and Services 144 146 96 240 291 Eliminations and corporate costs (61 ) (52 ) (50 ) (111 ) (110 ) Total Adjusted EBITDA $ 283 $ 252 $ 177 $ 460 $ 504 Adjusted EBITDA %: Energy Equipment 16.4 % 13.1 % 11.0 % 13.7 % 13.7 % Energy Products and Services 14.8 % 14.2 % 10.7 % 12.8 % 14.4 % Eliminations and corporate costs — — — — — Total Adjusted EBITDA % 13.3 % 11.5 % 8.6 % 11.0 % 11.7 % Reconciliation of Adjusted operating profit and Adjusted EBITDA: GAAP net income attributable to Company $ 112 $ 108 $ 19 $ 131 $ 181 Noncontrolling interests 4 6 1 5 7 Provision for income taxes 41 1 15 56 48 Interest and financial costs 21 22 22 43 44 Interest income (8 ) (10 ) (11 ) (19 ) (21 ) Equity (income) loss in unconsolidated affiliates 5 (1 ) 3 8 (1 ) Other (income) expense, net 18 17 (2 ) 16 37 (Gain) loss on sales of fixed assets (20 ) 3 1 (19 ) 1 Pre-tax Other Items, net 17 19 37 54 32 Adjusted operating profit 190 165 85 275 328 Depreciation and amortization 93 87 92 185 176 Total Adjusted EBITDA $ 283 $ 252 $ 177 $ 460 $ 504
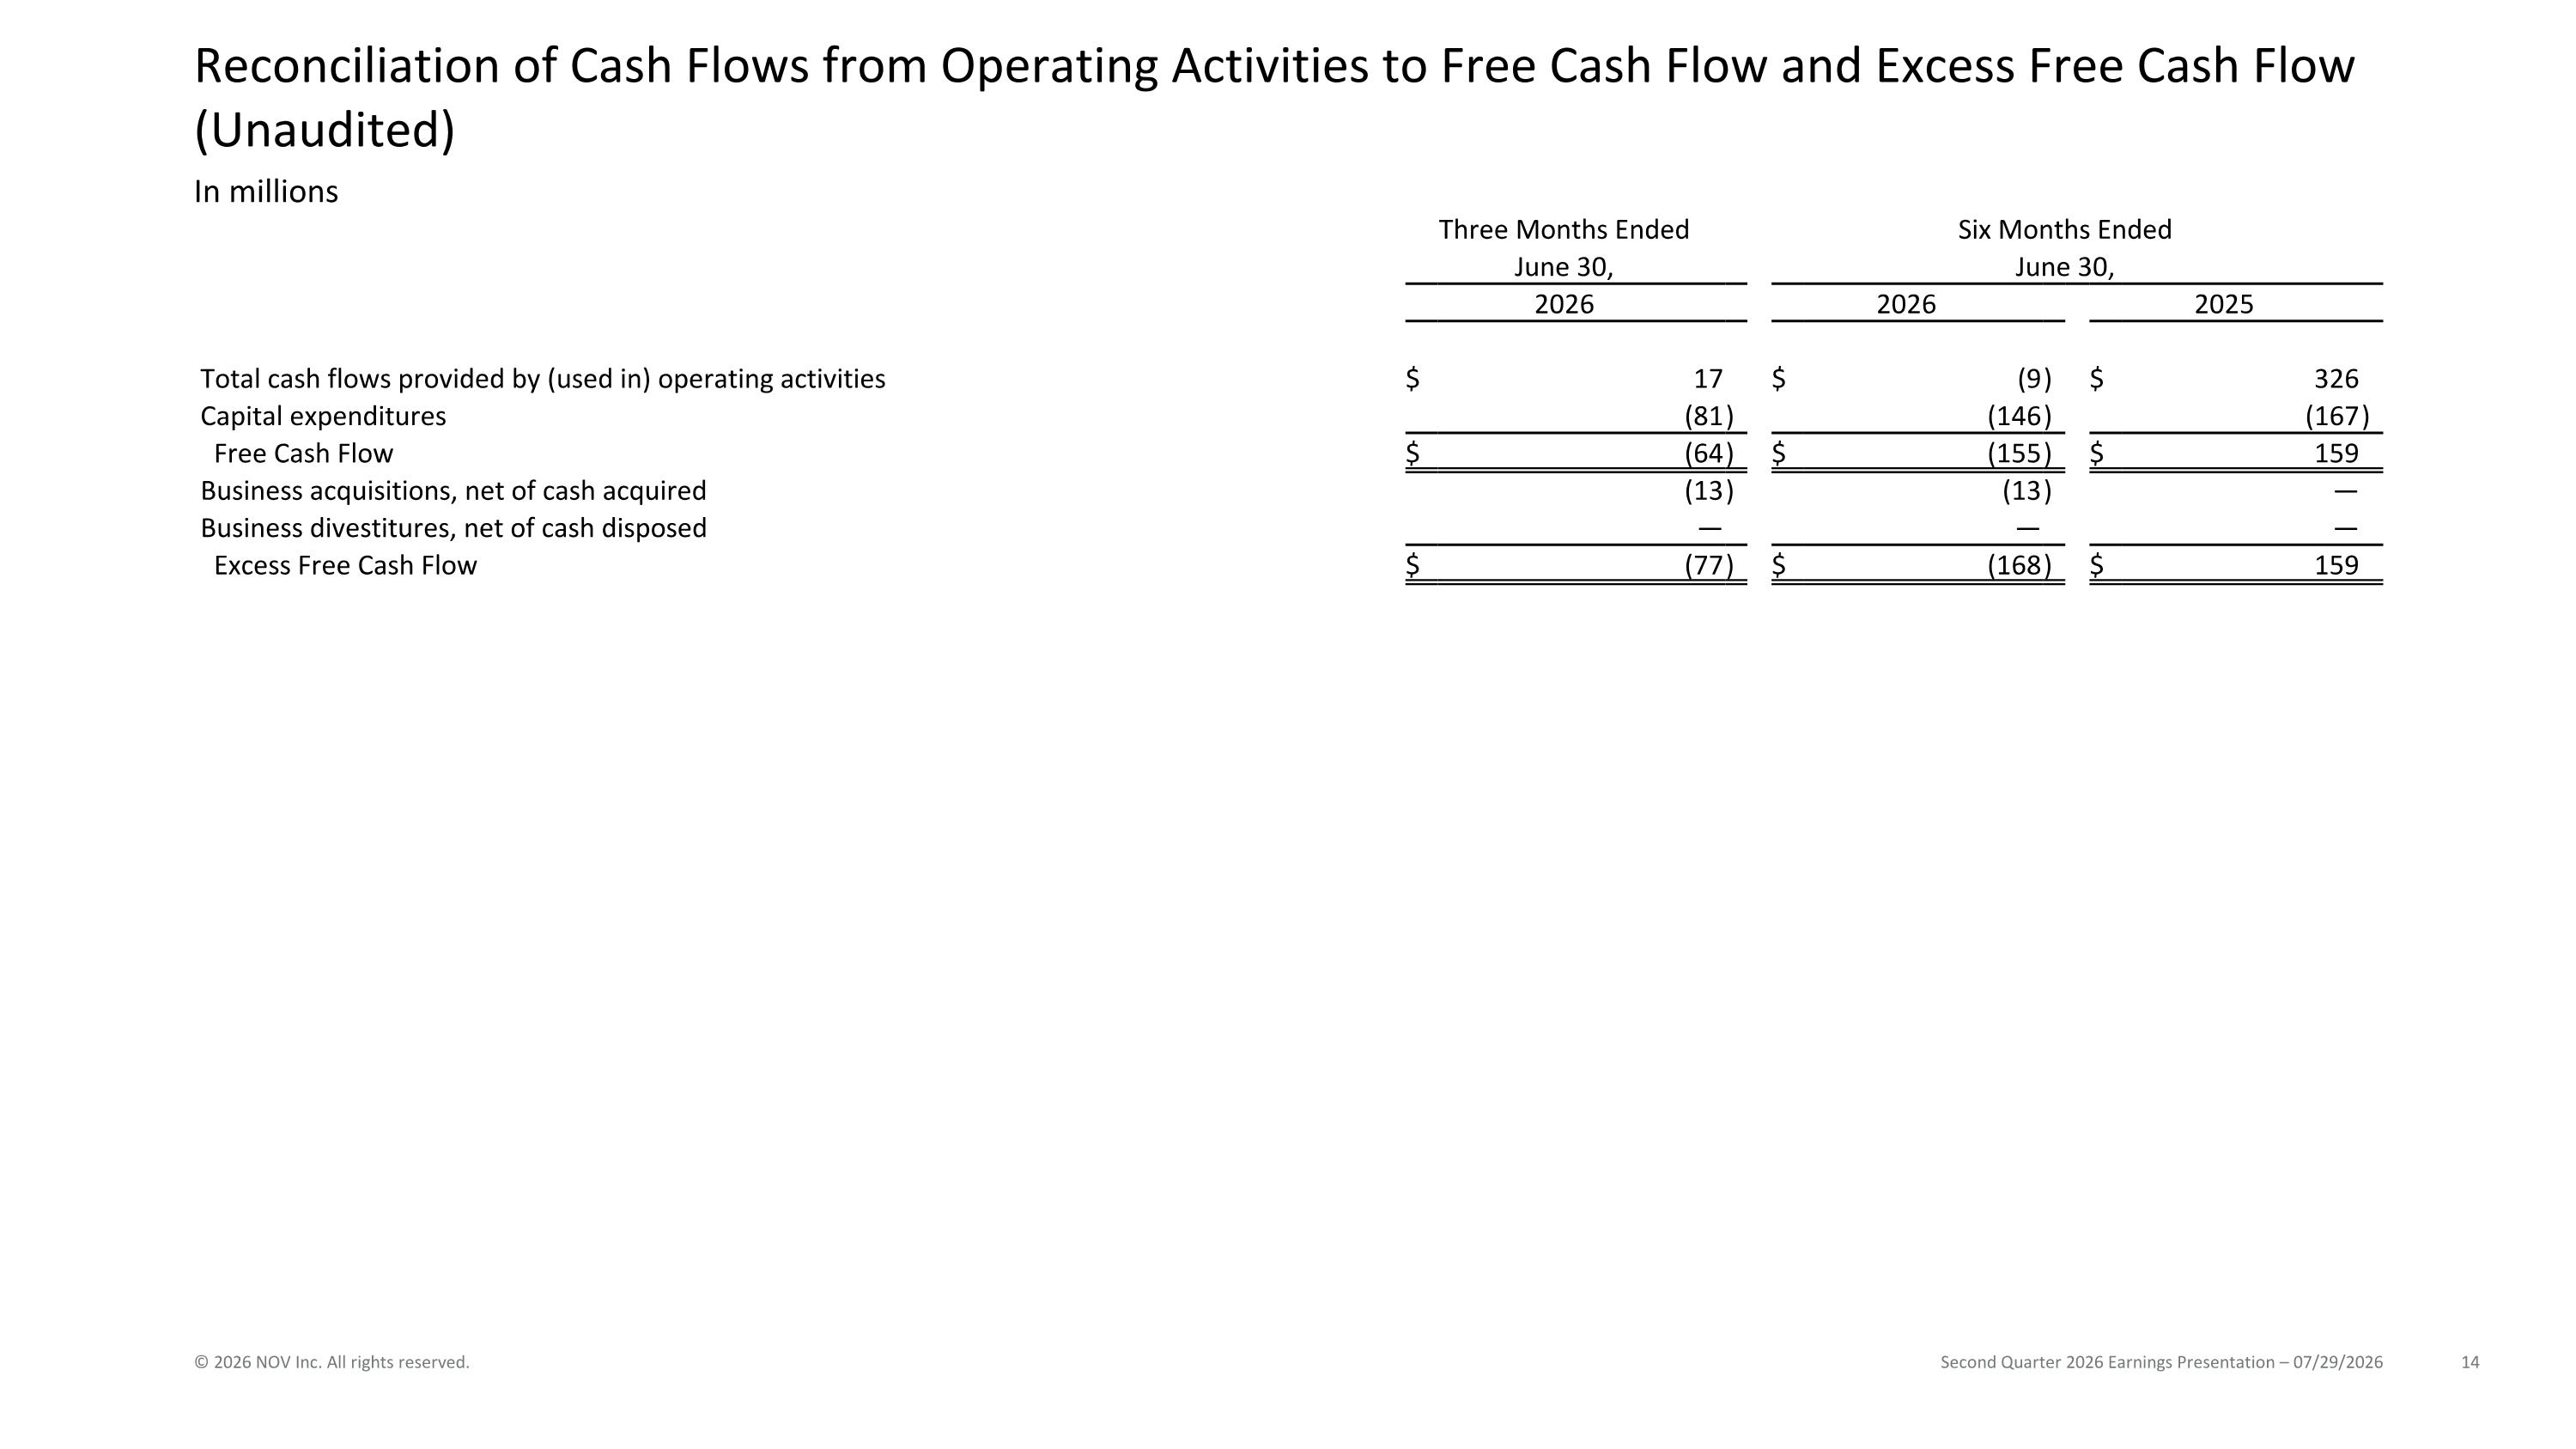
Reconciliation of Cash Flows from Operating Activities to Free Cash Flow and Excess Free Cash Flow (Unaudited) Second Quarter 2026 Earnings Presentation – 07/29/2026 © 2026 NOV Inc. All rights reserved. In millions Three Months Ended Six Months Ended June 30, June 30, 2026 2026 2025 Total cash flows provided by (used in) operating activities $ 17 $ (9 ) $ 326 Capital expenditures (81 ) (146 ) (167 ) Free Cash Flow $ (64 ) $ (155 ) $ 159 Business acquisitions, net of cash acquired (13 ) (13 ) — Business divestitures, net of cash disposed — — — Excess Free Cash Flow $ (77 ) $ (168 ) $ 159

Second Quarter 2026 Earnings Presentation – 07/29/2026 © 2026 NOV Inc. All rights reserved.