Performance Management
|
Jul. 29, 2026 |
| Matisse Discounted Closed-End Fund Strategy |
|
| Prospectus [Line Items] |
|
| Bar Chart and Performance Table [Heading] |
PERFORMANCE
INFORMATION
|
| Performance Narrative [Text Block] |
The
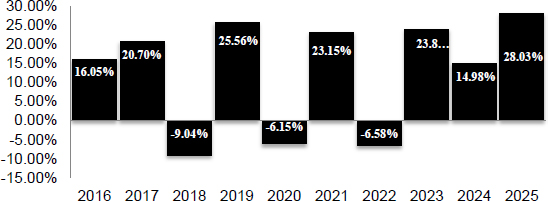
following bar chart and tables provide an indication of the risks of investing in the Fund by showing changes in the Fund’s
performance from year to year and by showing how the Fund’s average annual total returns compare to that of a broad-based
securities market index. The Fund’s past performance (before and after taxes) is not necessarily an indication of how the
Fund will perform in the future. Updated performance information is available online at https://fundinfopages.com/MDCEX.
|
| Performance Past Does Not Indicate Future [Text] |
The Fund’s past performance (before and after taxes) is not necessarily an indication of how the
Fund will perform in the future.
|
| Performance Information Illustrates Variability of Returns [Text] |
The
following bar chart and tables provide an indication of the risks of investing in the Fund by showing changes in the Fund’s
performance from year to year and by showing how the Fund’s average annual total returns compare to that of a broad-based
securities market index.
|
| Bar Chart [Heading] |
Institutional
Class Shares
Calendar
Year Returns
|
| Bar Chart [Table] |
| |
|
| 2016 |
16.05 |
| 2017 |
20.70 |
| 2018 |
-9.04 |
| 2019 |
25.56 |
| 2020 |
-6.15 |
| 2021 |
23.15 |
| 2022 |
-6.58 |
| 2023 |
23.80 |
| 2024 |
14.98 |
| 2025 |
28.03 |
|
| Bar Chart Closing [Text Block] |
During
the periods shown in the bar chart above, the Fund’s highest quarterly return was 19.86% (quarter ended June 30, 2020) and
the Fund’s lowest quarterly return was -37.13% (quarter ended March 31, 2020). The Fund’s year-to-date return as of
June 30, 2026, was 6.54%.
|
| Year to Date Return, Label [Optional Text] |
The Fund’s year-to-date return
|
| Bar Chart, Year to Date Return |
6.54%
|
| Bar Chart, Year to Date Return, Date |
Jun. 30, 2026
|
| Highest Quarterly Return, Label [Optional Text] |
highest quarterly return
|
| Highest Quarterly Return |
19.86%
|
| Highest Quarterly Return, Date |
Jun. 30, 2020
|
| Lowest Quarterly Return, Label [Optional Text] |
lowest quarterly return
|
| Lowest Quarterly Return |
(37.13%)
|
| Lowest Quarterly Return, Date |
Mar. 31, 2020
|
| Performance Table Heading |
Average
Annual Total Returns Periods
Ended December 31, 2025 (returns with maximum sales charge)
|
| Performance Table Uses Highest Federal Rate |
After-tax
returns are calculated using the historical highest individual federal marginal income tax rates and do not reflect the impact
of state and local taxes.
|
| Performance Table Not Relevant to Tax Deferred |
Actual after-tax returns depend on an investor’s tax situation and may differ from those shown
and are not applicable to investors who hold Shares through tax-deferred arrangements such as a 401(k) plan or an individual retirement
account (IRA).
|
| Performance [Table] |
| Average
Annual Total Returns |
Periods
Ended December 31, 2025
(returns with maximum sales charge) |
Past
1
Year |
Past
5
Years |
Past
10
Years |
Since
Inception1 |
| Institutional
Class Shares |
|
|
|
|
Before
taxes
After Taxes on Distributions
After Taxes on Distributions and Sale of Shares |
28.03%
23.10%
17.27% |
15.96%
10.98%
10.80% |
12.16%
8.47%
8.44% |
9.74%
6.20%
6.32% |
| Morningstar
Global Allocation Index |
16.68% |
6.03% |
7.88% |
7.27% |
| S-Network
Composite Closed-End Fund Total Return Index |
13.04% |
6.35% |
7.88% |
6.69% |
| First
Trust Composite Closed-End Fund Index |
14.64% |
6.25% |
7.48% |
6.03% |
| 1. | | The Institutional
Class Shares commenced operations on October 31, 2012. |
|
| Performance Table Closing [Text Block] |
After-tax
returns are calculated using the historical highest individual federal marginal income tax rates and do not reflect the impact
of state and local taxes. Actual after-tax returns depend on an investor’s tax situation and may differ from those shown
and are not applicable to investors who hold Shares through tax-deferred arrangements such as a 401(k) plan or an individual retirement
account (IRA).
|
| Performance Availability Website Address [Text] |
https://fundinfopages.com/MDCEX
|
| Matisse Discounted Bond CEF Strategy |
|
| Prospectus [Line Items] |
|
| Bar Chart and Performance Table [Heading] |
PERFORMANCE
INFORMATION
|
| Performance Narrative [Text Block] |
The
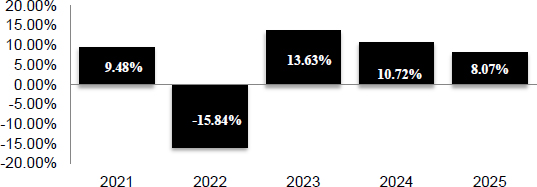
following bar chart and tables provide an indication of the risks of investing in the Fund by showing changes in the Fund’s
performance from year to year and by showing how the Fund’s average annual total returns compare to that of a broad-based
securities market index. The Fund’s past performance (before and after taxes) is not necessarily an indication of how the
Fund will perform in the future. Updated performance information is available online at https://fundinfopages.com/MDFIX.
|
| Performance Past Does Not Indicate Future [Text] |
The Fund’s past performance (before and after taxes) is not necessarily an indication of how the
Fund will perform in the future.
|
| Performance Information Illustrates Variability of Returns [Text] |
The
following bar chart and tables provide an indication of the risks of investing in the Fund by showing changes in the Fund’s
performance from year to year and by showing how the Fund’s average annual total returns compare to that of a broad-based
securities market index.
|
| Bar Chart [Heading] |
Institutional
Class Shares
Calendar
Year Returns
|
| Bar Chart [Table] |
| |
|
| 2021 |
9.48 |
| 2022 |
-15.84 |
| 2023 |
13.63 |
| 2024 |
10.72 |
| 2025 |
8.07 |
|
| Bar Chart Closing [Text Block] |
During
the periods shown in the bar chart above, the Fund’s highest quarterly return was 11.85% (quarter ended December 31, 2023)
and the Fund’s lowest quarterly return was -9.90% (quarter ended June 30, 2022). The Fund’s year-to-date return as
of June 30, 2026, was 0.97%.
|
| Year to Date Return, Label [Optional Text] |
The Fund’s year-to-date return
|
| Bar Chart, Year to Date Return |
0.97%
|
| Bar Chart, Year to Date Return, Date |
Jun. 30, 2026
|
| Highest Quarterly Return, Label [Optional Text] |
highest quarterly return
|
| Highest Quarterly Return |
11.85%
|
| Highest Quarterly Return, Date |
Dec. 31, 2023
|
| Lowest Quarterly Return, Label [Optional Text] |
lowest quarterly return
|
| Lowest Quarterly Return |
(9.90%)
|
| Lowest Quarterly Return, Date |
Jun. 30, 2022
|
| Performance Table Heading |
Average
Annual Total Returns Periods
Ended December 31, 2025 (returns with maximum sales charge)
|
| Performance Table Uses Highest Federal Rate |
After-tax
returns are calculated using the historical highest individual federal marginal income tax rates and do not reflect the impact
of state and local taxes.
|
| Performance Table Not Relevant to Tax Deferred |
Actual after-tax returns depend on an investor’s tax situation and may differ from those shown
and are not applicable to investors who hold Shares through tax-deferred arrangements such as a 401(k) plan or an individual retirement
account (IRA).
|
| Performance [Table] |
Average
Annual Total Returns
Periods
Ended December 31, 2025
(returns with maximum sales charge) |
Past
1
Year |
Since
Inception* |
| Institutional
Class Shares |
|
|
Before
taxes
After taxes on distributions
After taxes on distributions and sale of Shares |
8.07%
4.83%
5.03% |
8.50%
6.07%
5.83% |
| Bloomberg
U.S. Aggregate Bond Index |
7.30% |
0.10% |
| Bloomberg
VLI High Yield Index |
8.79% |
6.40% |
Periods
Ended December 31, 2025
(returns with maximum sales charge) |
Past
1
Year |
Since
Inception* |
| FT
Taxable Fixed Income CEF Index |
6.45% |
8.14% |
| * | | The Institutional
Class Shares commenced operations on April 30, 2020. |
|
| Performance Table One Class of after Tax Shown [Text] |
After-tax returns are shown for only one class of Shares and after-tax returns will vary for other classes.
|
| Performance Table Closing [Text Block] |
After-tax
returns are calculated using the historical highest individual federal marginal income tax rates and do not reflect the impact
of state and local taxes. Actual after-tax returns depend on an investor’s tax situation and may differ from those shown
and are not applicable to investors who hold Shares through tax-deferred arrangements such as a 401(k) plan or an individual retirement
account (IRA). After-tax returns are shown for only one class of Shares and after-tax returns will vary for other classes.
|
| Performance Availability Website Address [Text] |
https://fundinfopages.com/MDFIX
|