Exhibit 99.2
| NABORS INDUSTRIES LTD July 2026 2Q 2026 Earnings Presentation |

| N A B O R S . C O M We often discuss expectations regarding our future markets, demand for our products and services, and our performance in our annual, quarterly, and current reports, press releases, and other written and oral statements. Such statements, including statements in this document that relate to matters that are not historical facts, are “forward-looking statements” within the meaning of the safe harbor provisions of Section 27A of the U.S. Securities Act of 1933 and Section 21E of the U.S. Securities Exchange Act of 1934. These “forward-looking statements” are based on our analysis of currently available competitive, financial and economic data and our operating plans. They are inherently uncertain, and investors should recognize that events and actual results could turn out to be significantly different from our expectations. Factors to consider when evaluating these forward-looking statements include, but are not limited to: • geopolitical events, pandemics and other macro-events and their respective and collective impact on our operations as well as oil and gas markets and prices; • fluctuations and volatility in worldwide prices of and demand for oil and natural gas; • fluctuations in levels of oil and natural gas exploration and development activities; • fluctuations in the demand for our services; • competitive and technological changes and other developments in the oil and gas and oilfield services industries; • our ability to renew customer contracts in order to maintain competitiveness; • the existence of operating risks inherent in the oil and gas and oilfield services industries; • the possibility of the loss of one or a number of our large customers; • the amount and nature of our future capital expenditures and how we expect to fund our capital expenditures; • the occurrence of cybersecurity incidents, attacks and other breaches to our information technology systems; • the impact of long-term indebtedness and other financial commitments on our financial and operating flexibility; • our access to and the cost of capital, including the impact of a further downgrade in our credit rating, covenant restrictions, availability under our revolving credit facility, and future issuances of debt or equity securities and the global interest rate environment; • our dependence on our operating subsidiaries and investments to meet our financial obligations; Forward-Looking Statements NABORS INDUSTRIES 2 • our ability to retain skilled employees; • our ability to realize the expected benefits of strategic transactions we may undertake; • changes in tax laws and the possibility of changes in other laws and regulation; • global views on and the regulatory environment related to energy transition and our ability to implement our energy transition initiatives; • potential long-lived asset impairments • the possibility of changes to U.S. trade policies and regulations including the imposition of trade embargoes, sanctions or tariffs, by either the U.S. or any other country in which we operate or have supply lines; • general economic conditions, including the capital and credit markets; • our ability to utilize NOLs. Our businesses depend, to a large degree, on the level of spending by oil and gas companies for exploration, development and production activities. Therefore, sustained lower oil or natural gas prices that have a material impact on exploration, development or production activities could also materially affect our financial position, results of operations and cash flows. The above description of risks and uncertainties is by no means all-inclusive but is designed to highlight what we believe are important factors to consider. For a discussion of these factors and other risks and uncertainties, please refer to our filings with the Securities and Exchange Commission ("SEC"), including those contained in our Annual Reports on Form 10-K and Quarterly Reports on Form 10-Q, which are available at the SEC's website at www.sec.gov. We undertake no obligation to publicly update or revise any forward-looking statement as a result of new information, future events or otherwise, except as otherwise required by law. Non-GAAP Financial Measures This presentation refers to certain “non-GAAP” financial measures, such as adjusted EBITDA, net debt, adjusted gross margin and adjusted free cash flow. The components of these non-GAAP measures are computed by using amounts that are determined in accordance with accounting principles generally accepted in the United States of America (“GAAP”). Other companies in our industry may compute these metrics differently. These measures have limitations and should not be used in isolation or as a substitute for the amounts reported in accordance with GAAP. |
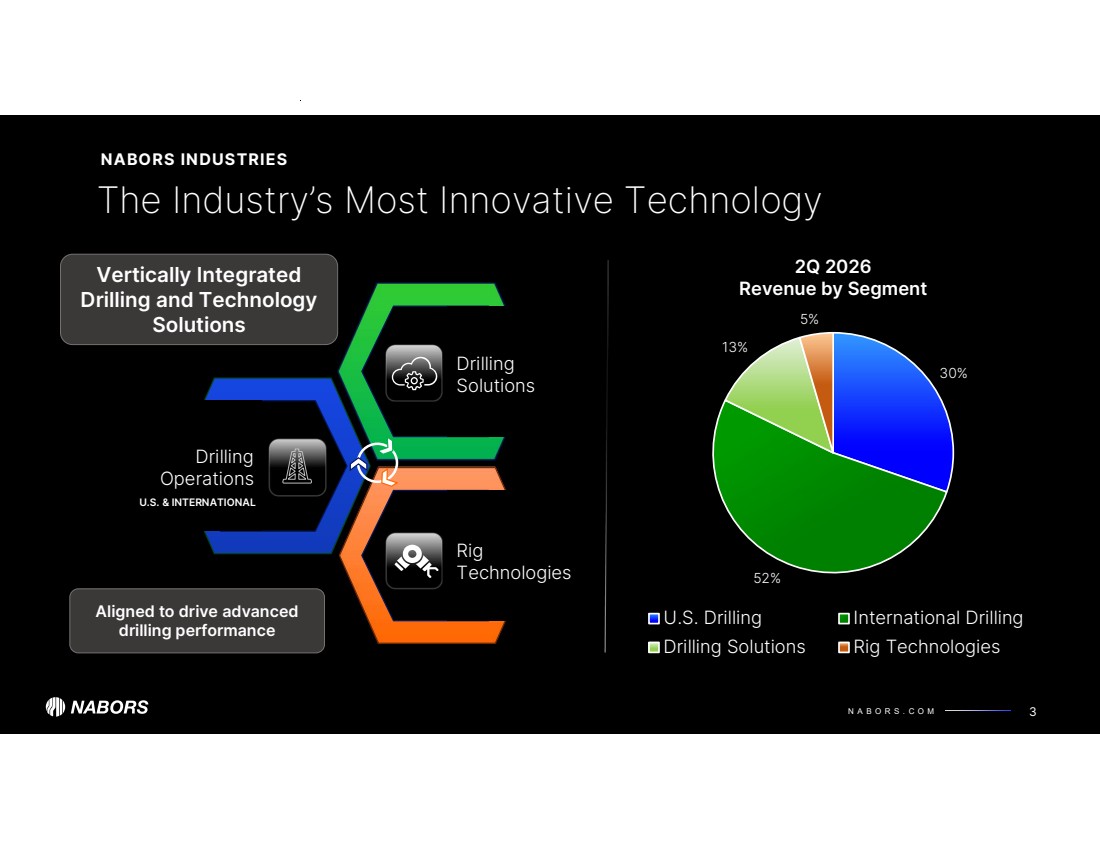
| N A B O R S . C O M 30% 52% 13% 5% 2Q 2026 Revenue by Segment U.S. Drilling International Drilling Drilling Solutions Rig Technologies 3 The Industry’s Most Innovative Technology NABORS INDUSTRIES Vertically Integrated Drilling and Technology Solutions Drilling Operations Rig Technologies Drilling Solutions Aligned to drive advanced drilling performance U.S. & INTERNATIONAL |
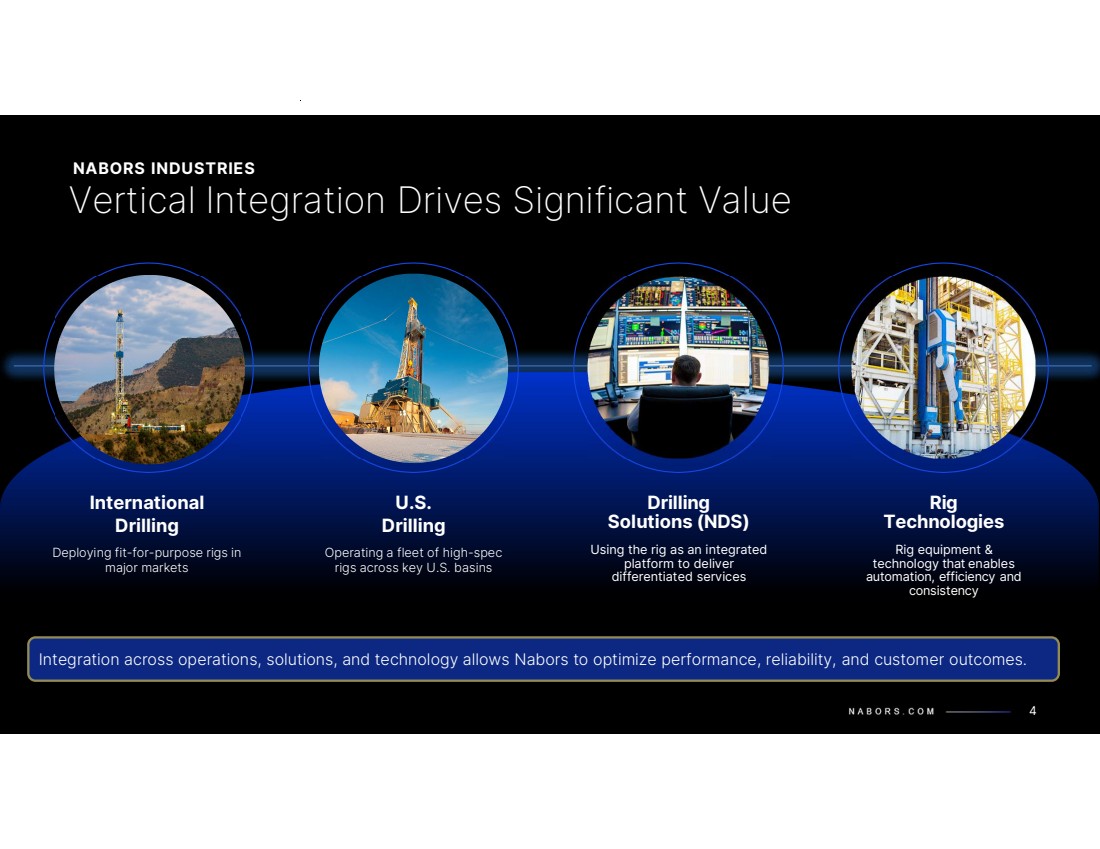
| Vertical Integration Drives Significant Value Rig Technologies Rig equipment & technology that enables automation, efficiency and consistency Drilling Solutions (NDS) Using the rig as an integrated platform to deliver differentiated services NABORS INDUSTRIES N A B O R S . C O M 4 U.S. Drilling Operating a fleet of high-spec rigs across key U.S. basins International Drilling Deploying fit-for-purpose rigs in major markets Integration across operations, solutions, and technology allows Nabors to optimize performance, reliability, and customer outcomes. |
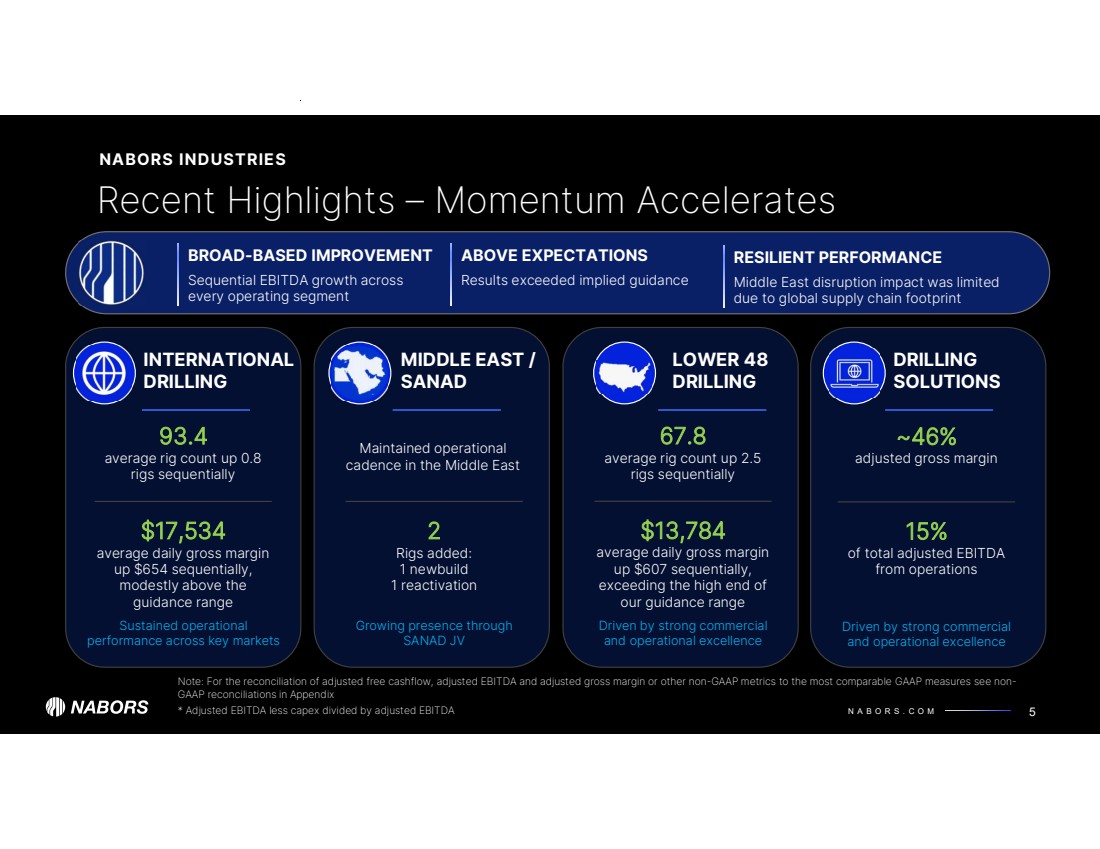
| N A B O R S . C O M Recent Highlights – Momentum Accelerates NABORS INDUSTRIES 5 Note: For the reconciliation of adjusted free cashflow, adjusted EBITDA and adjusted gross margin or other non-GAAP metrics to the most comparable GAAP measures see non-GAAP reconciliations in Appendix * Adjusted EBITDA less capex divided by adjusted EBITDA INTERNATIONAL DRILLING 93.4 average rig count up 0.8 rigs sequentially $17,534 average daily gross margin up $654 sequentially, modestly above the guidance range Sustained operational performance across key markets MIDDLE EAST / SANAD Maintained operational cadence in the Middle East 2 Rigs added: 1 newbuild 1 reactivation Growing presence through SANAD JV 67.8 average rig count up 2.5 rigs sequentially $13,784 average daily gross margin up $607 sequentially, exceeding the high end of our guidance range Driven by strong commercial and operational excellence DRILLING SOLUTIONS ~46% adjusted gross margin 15% of total adjusted EBITDA from operations Driven by strong commercial and operational excellence LOWER 48 DRILLING BROAD-BASED IMPROVEMENT Sequential EBITDA growth across every operating segment ABOVE EXPECTATIONS Results exceeded implied guidance RESILIENT PERFORMANCE Middle East disruption impact was limited due to global supply chain footprint |
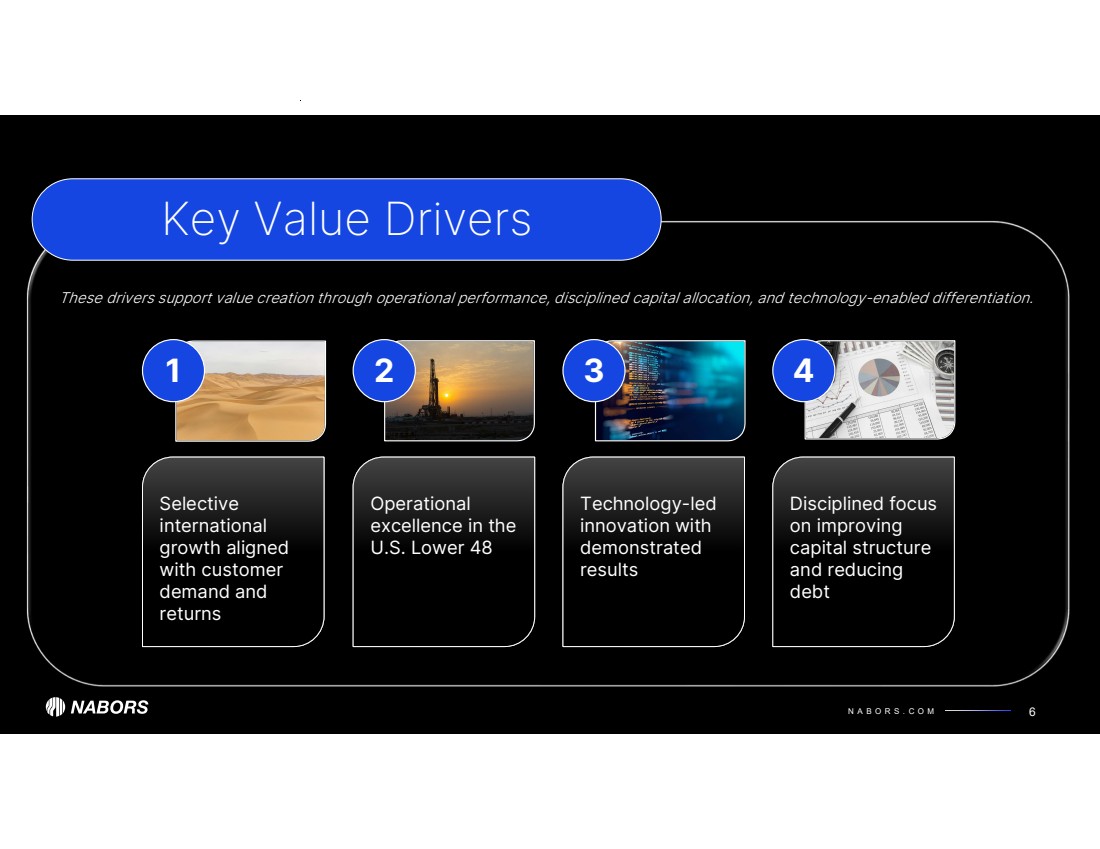
| N A B O R S . C O M 6 Key Value Drivers Selective international growth aligned with customer demand and returns 1 Operational excellence in the U.S. Lower 48 2 Technology-led innovation with demonstrated results 3 Disciplined focus on improving capital structure and reducing debt 4 These drivers support value creation through operational performance, disciplined capital allocation, and technology-enabled differentiation. |
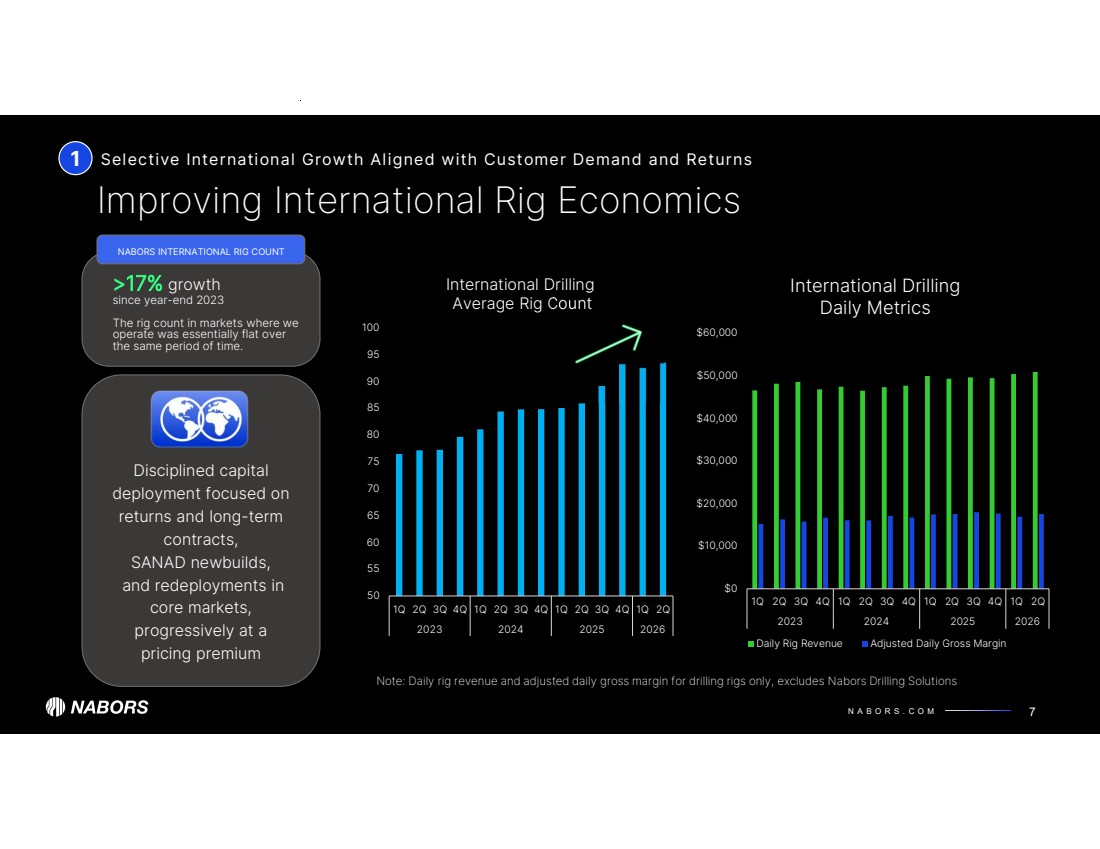
| N A B O R S . C O M 50 55 60 65 70 75 80 85 90 95 100 1Q 2Q 3Q 4Q 1Q 2Q 3Q 4Q 1Q 2Q 3Q 4Q 1Q 2Q 2023 2024 2025 2026 International Drilling Average Rig Count 1 Improving International Rig Economics Selective International Growth Aligned with Customer Demand and Returns 7 Note: Daily rig revenue and adjusted daily gross margin for drilling rigs only, excludes Nabors Drilling Solutions $0 $10,000 $20,000 $30,000 $40,000 $50,000 $60,000 1Q 2Q 3Q 4Q 1Q 2Q 3Q 4Q 1Q 2Q 3Q 4Q 1Q 2023 2024 2025 '26 International Drilling Daily Metrics Daily Rig Revenue Adjusted Daily Gross Margin Disciplined capital deployment focused on returns and long-term contracts, SANAD newbuilds, and redeployments in core markets, progressively at a pricing premium >17% growth since year-end 2023 The rig count in markets where we operate was essentially flat over the same period of time. NABORS INTERNATIONAL RIG COUNT $0 $10,000 $20,000 $30,000 $40,000 $50,000 $60,000 1Q 2Q 3Q 4Q 1Q 2Q 3Q 4Q 1Q 2Q 3Q 4Q 1Q 2Q 2023 2024 2025 2026 International Drilling Daily Metrics Daily Rig Revenue Adjusted Daily Gross Margin |
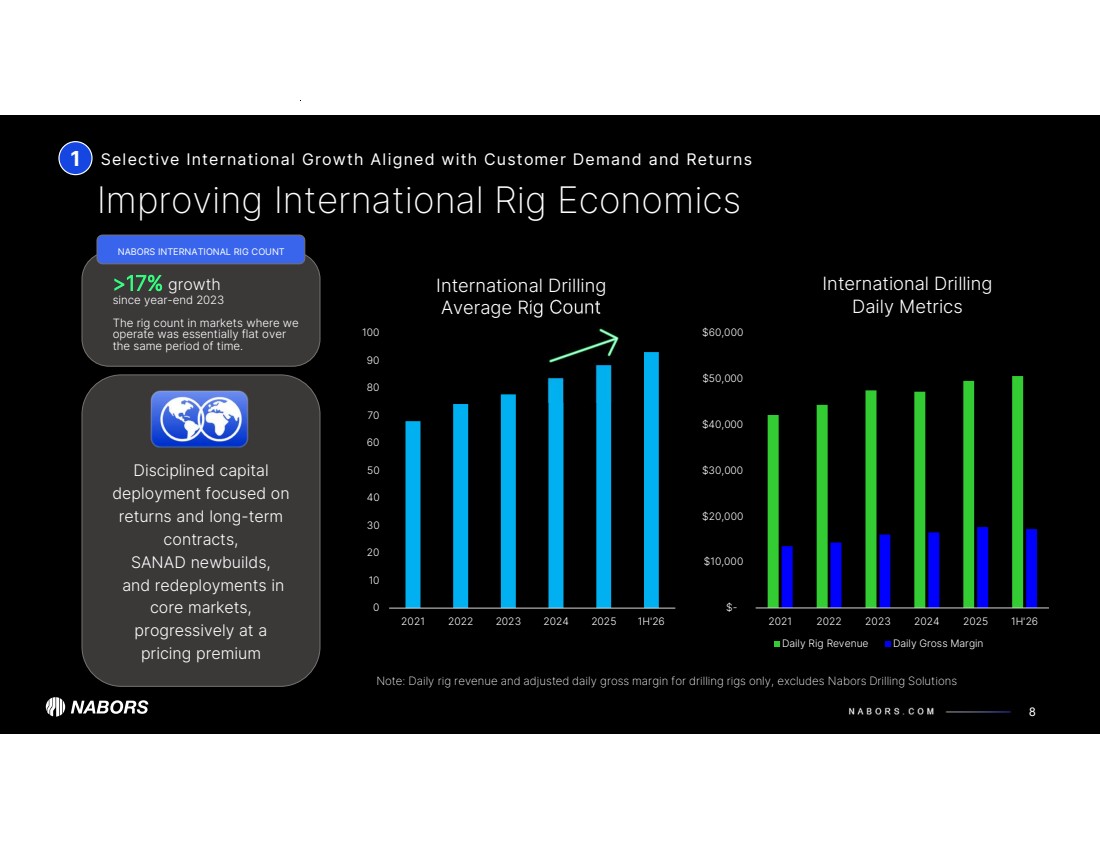
| N A B O R S . C O M $- $10,000 $20,000 $30,000 $40,000 $50,000 $60,000 2021 2022 2023 2024 2025 1H'26 International Drilling Daily Metrics Daily Rig Revenue Daily Gross Margin 0 10 20 30 40 50 60 70 80 90 100 2021 2022 2023 2024 2025 1H'26 International Drilling Average Rig Count Disciplined capital deployment focused on returns and long-term contracts, SANAD newbuilds, and redeployments in core markets, progressively at a pricing premium 1 Improving International Rig Economics Selective International Growth Aligned with Customer Demand and Returns 8 Note: Daily rig revenue and adjusted daily gross margin for drilling rigs only, excludes Nabors Drilling Solutions >17% growth since year-end 2023 The rig count in markets where we operate was essentially flat over the same period of time. NABORS INTERNATIONAL RIG COUNT |
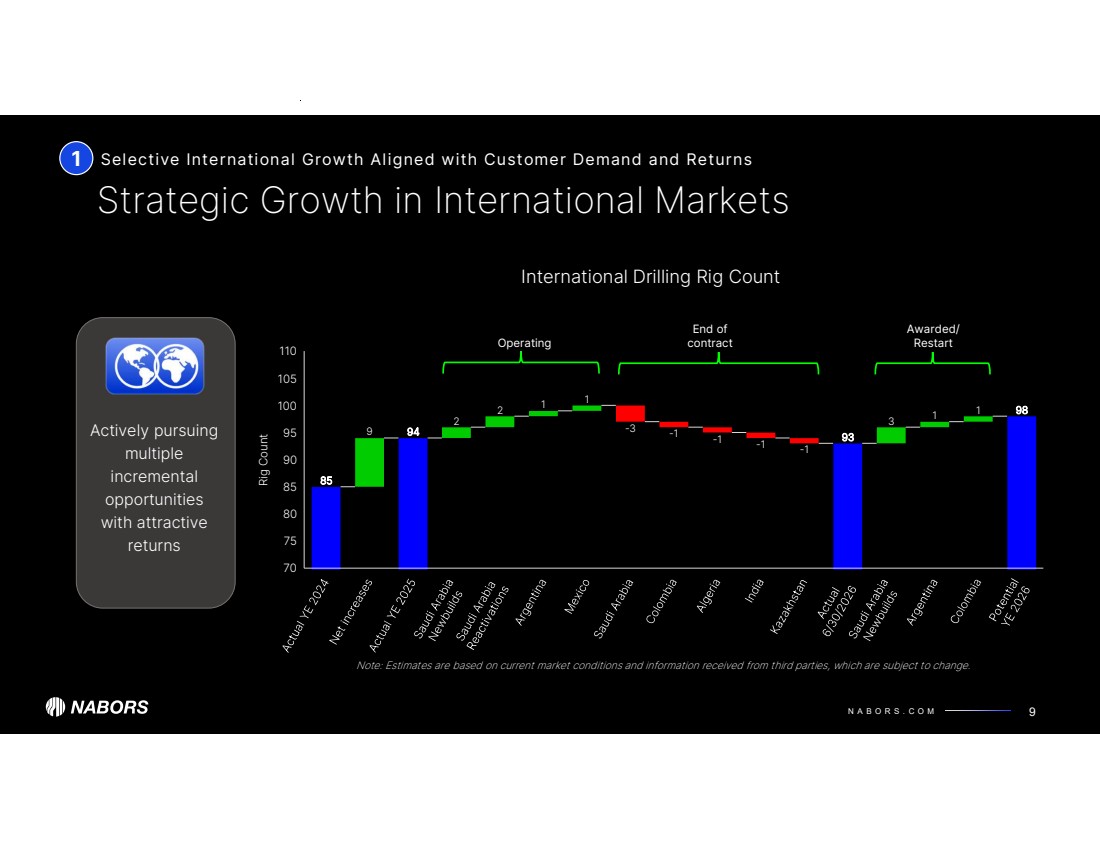
| N A B O R S . C O M 9 2 2 1 1 -3 -1 -1 -1 -1 3 1 1 85 94 93 98 Rig Count 70 75 80 85 90 95 100 105 110 1 Strategic Growth in International Markets 9 Note: Estimates are based on current market conditions and information received from third parties, which are subject to change. Selective International Growth Aligned with Customer Demand and Returns Awarded/ Restart International Drilling Rig Count Operating End of contract Actively pursuing multiple incremental opportunities with attractive returns |
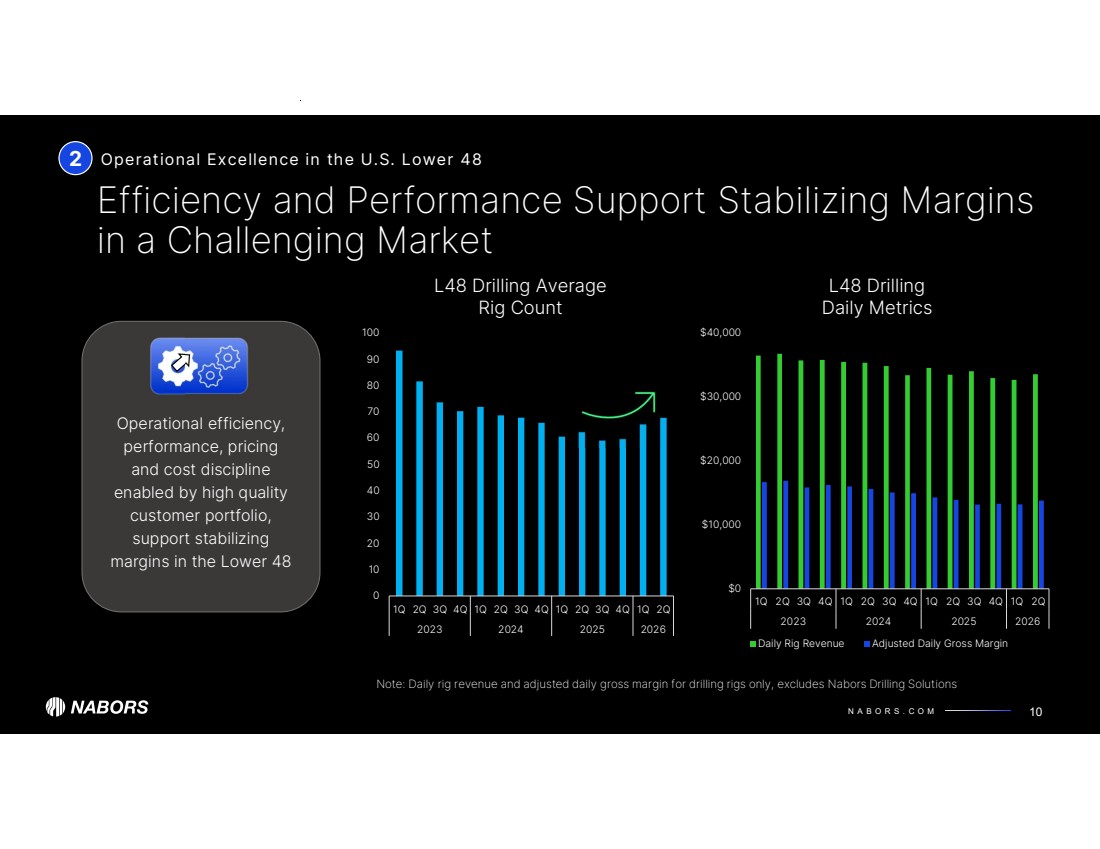
| N A B O R S . C O M 0 10 20 30 40 50 60 70 80 90 100 1Q 2Q 3Q 4Q 1Q 2Q 3Q 4Q 1Q 2Q 3Q 4Q 1Q 2Q 2023 2024 2025 2026 L48 Drilling Average Rig Count $0 $10,000 $20,000 $30,000 $40,000 1Q 2Q 3Q 4Q 1Q 2Q 3Q 4Q 1Q 2Q 3Q 4Q 1Q 2Q 2023 2024 2025 2026 L48 Drilling Daily Metrics Daily Rig Revenue Adjusted Daily Gross Margin 2 Efficiency and Performance Support Stabilizing Margins in a Challenging Market Operational Excellence in the U.S. Lower 48 10 Note: Daily rig revenue and adjusted daily gross margin for drilling rigs only, excludes Nabors Drilling Solutions Operational efficiency, performance, pricing and cost discipline enabled by high quality customer portfolio, support stabilizing margins in the Lower 48 |
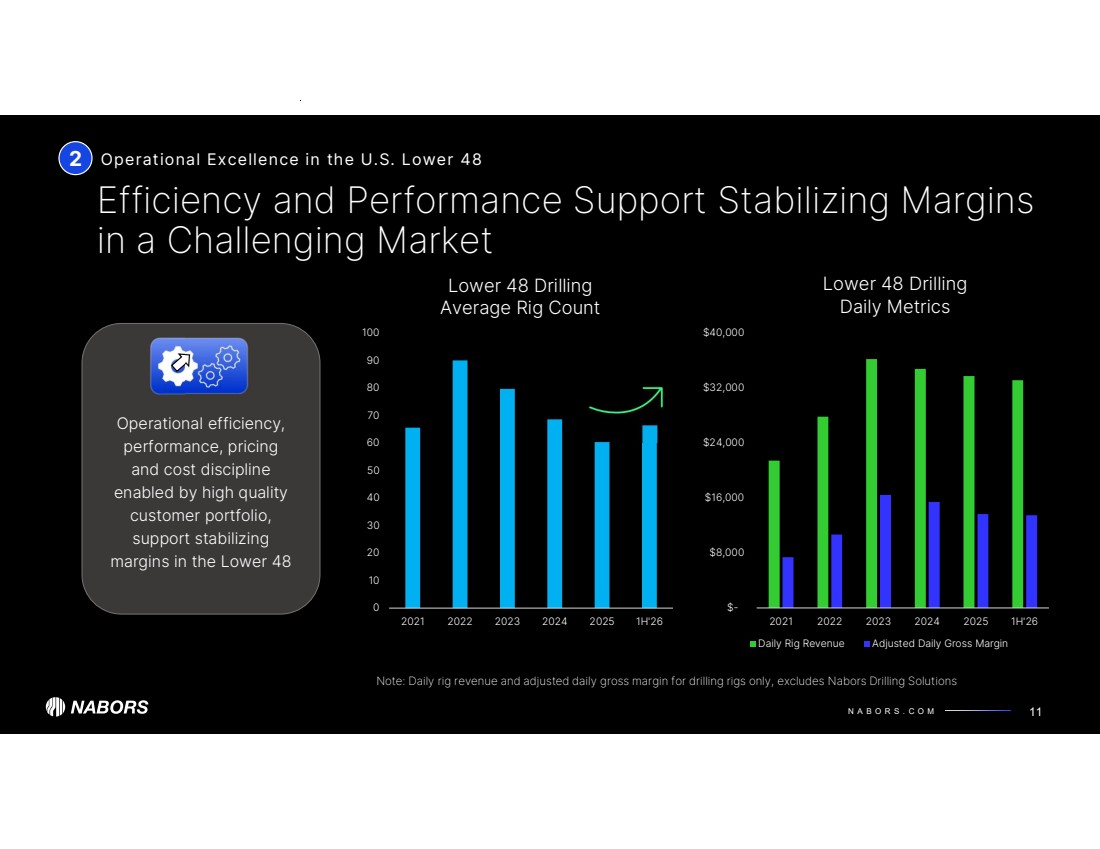
| N A B O R S . C O M 0 10 20 30 40 50 60 70 80 90 100 2021 2022 2023 2024 2025 1H'26 Lower 48 Drilling Average Rig Count $- $8,000 $16,000 $24,000 $32,000 $40,000 2021 2022 2023 2024 2025 1H'26 Lower 48 Drilling Daily Metrics Daily Rig Revenue Adjusted Daily Gross Margin Operational efficiency, performance, pricing and cost discipline enabled by high quality customer portfolio, support stabilizing margins in the Lower 48 2 Efficiency and Performance Support Stabilizing Margins in a Challenging Market Operational Excellence in the U.S. Lower 48 11 Note: Daily rig revenue and adjusted daily gross margin for drilling rigs only, excludes Nabors Drilling Solutions |
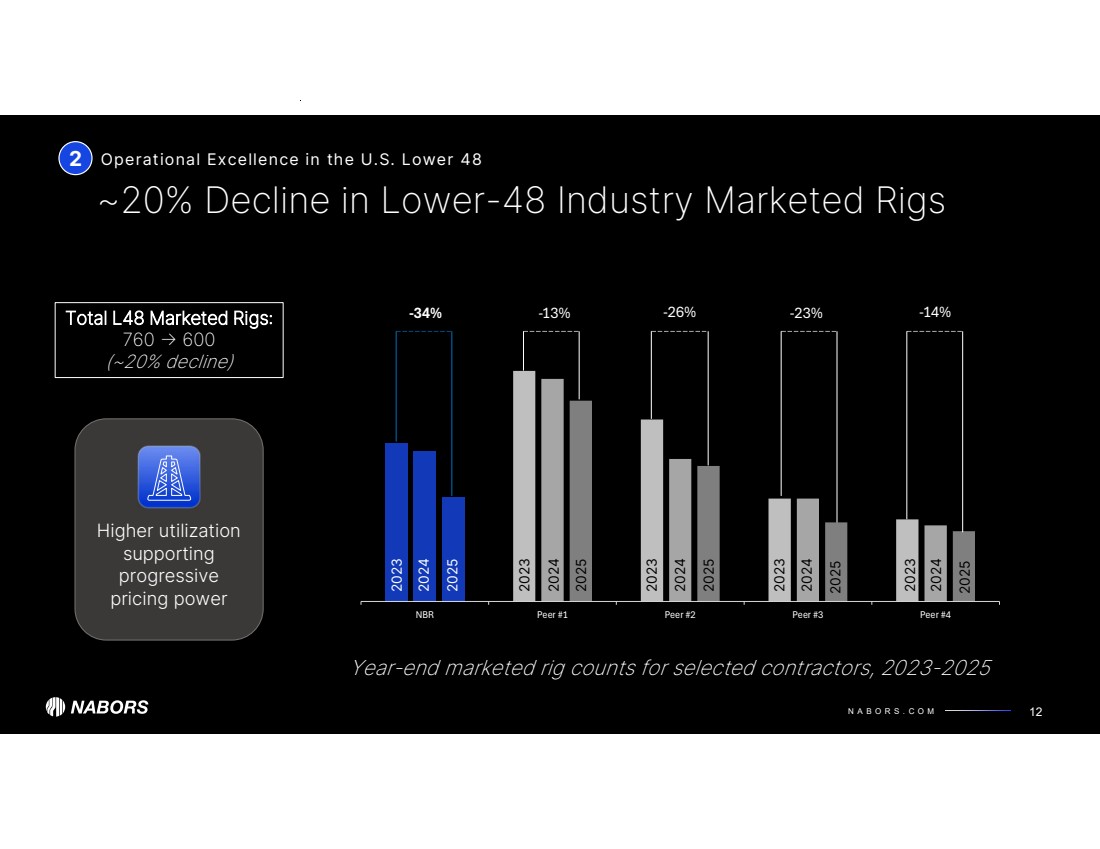
| N A B O R S . C O M -34% -13% -26% -23% -14% NBR Peer #1 Peer #2 Peer #3 Peer #4 ~20% Decline in Lower-48 Industry Marketed Rigs Operational Excellence in the U.S. Lower 48 12 Year-end marketed rig counts for selected contractors, 2023-2025 Total L48 Marketed Rigs: 600 ڵ 760 (~20% decline) 2023 2024 2025 2023 2024 2025 2023 2024 2025 2023 2024 2025 2023 2024 2025 Higher utilization supporting progressive pricing power 2 |
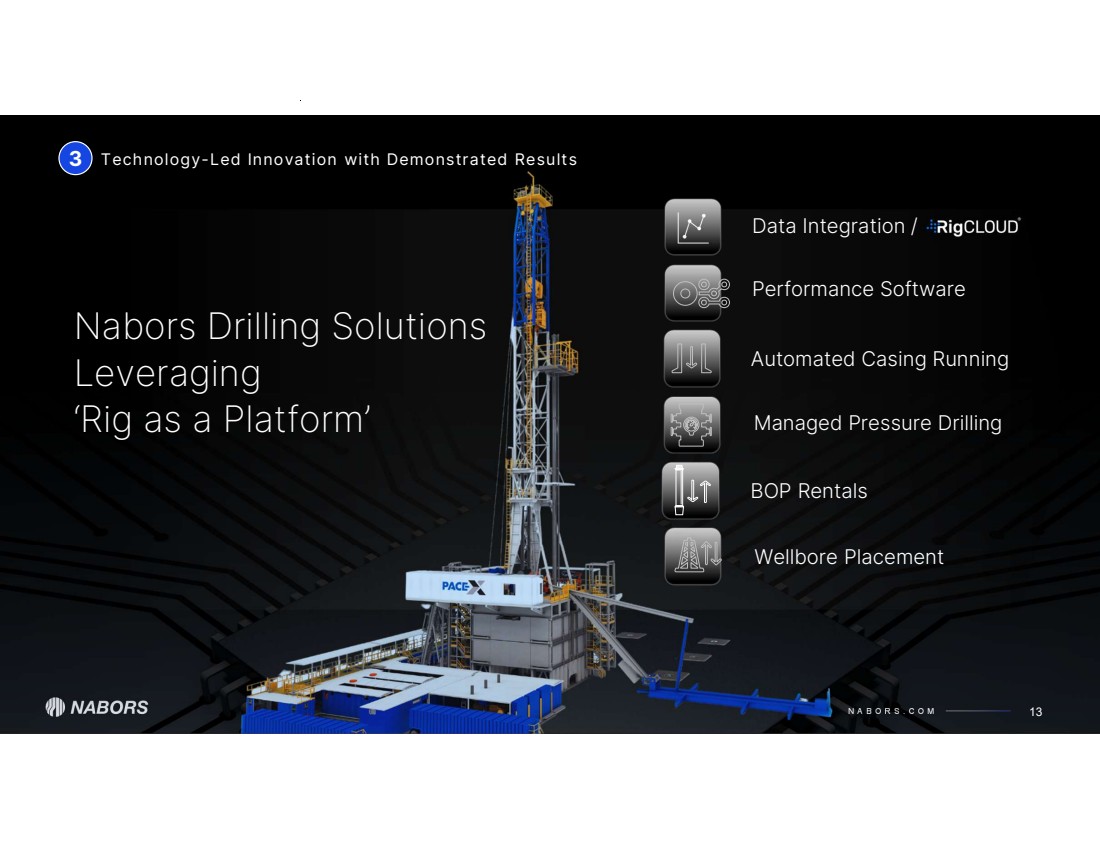
| N A B O R S . C O M 13 Nabors Drilling Solutions Leveraging ‘Rig as a Platform’ Managed Pressure Drilling Performance Software Wellbore Placement Automated Casing Running Data Integration / 3 Technology-Led Innovation with Demonstrated Results BOP Rentals |
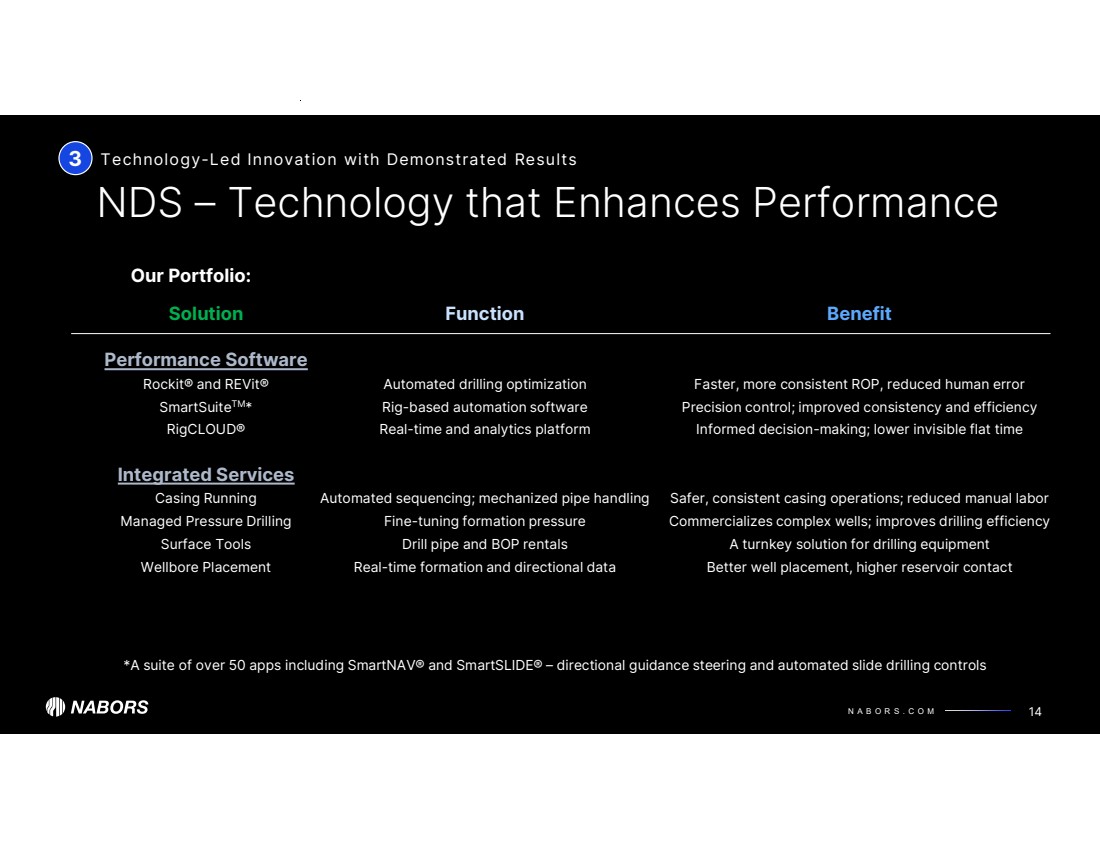
| N A B O R S . C O M 14 NDS – Technology that Enhances Performance Our Portfolio: Solution Performance Software Rockit® and REVit® SmartSuiteTM* RigCLOUD® Integrated Services Casing Running Managed Pressure Drilling Surface Tools Wellbore Placement Function Performance Software Automated drilling optimization Rig-based automation software Real-time and analytics platform Integrated Services Automated sequencing; mechanized pipe handling Fine-tuning formation pressure Drill pipe and BOP rentals Real-time formation and directional data Benefit Performance Software Faster, more consistent ROP, reduced human error Precision control; improved consistency and efficiency Informed decision-making; lower invisible flat time Integrated Services Safer, consistent casing operations; reduced manual labor Commercializes complex wells; improves drilling efficiency A turnkey solution for drilling equipment Better well placement, higher reservoir contact *A suite of over 50 apps including SmartNAV® and SmartSLIDE® – directional guidance steering and automated slide drilling controls 3 Technology-Led Innovation with Demonstrated Results |
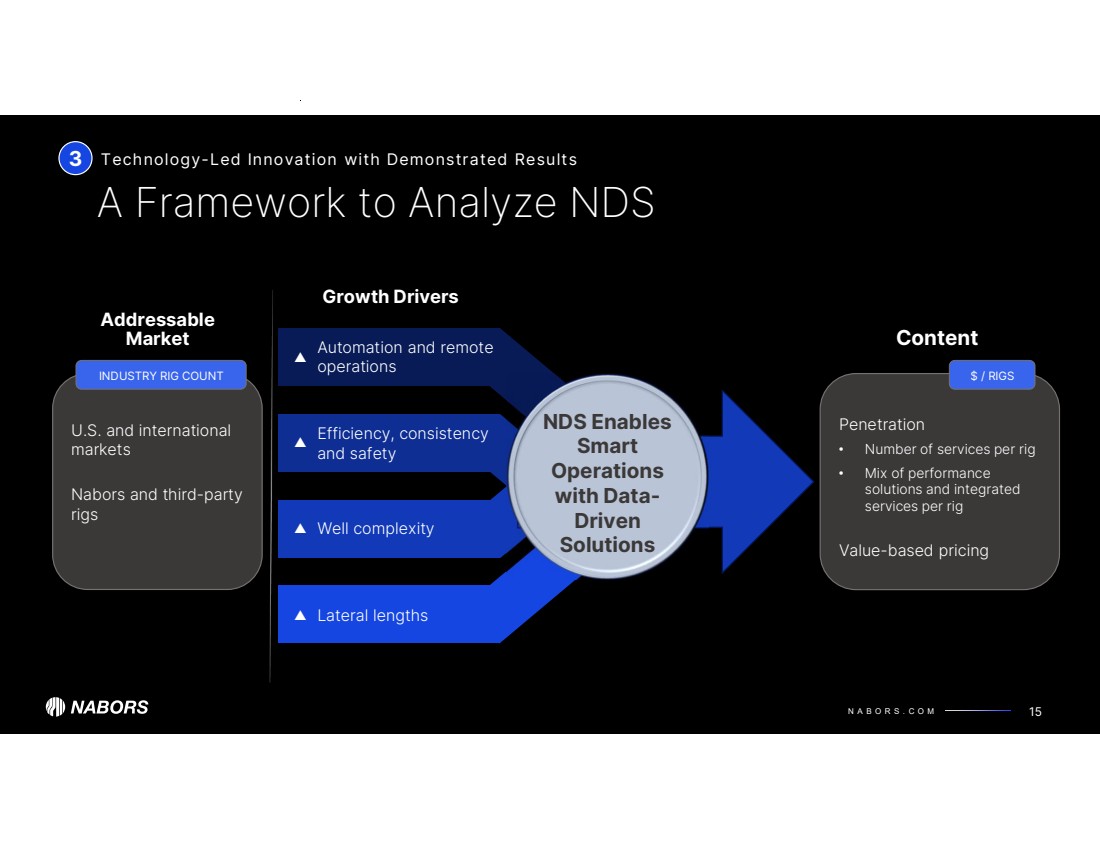
| N A B O R S . C O M 15 A Framework to Analyze NDS NDS Enables Smart Operations with Data-Driven Solutions 3 Technology-Led Innovation with Demonstrated Results Efficiency, consistency and safety Automation and remote operations Well complexity Lateral lengths Addressable Market Growth Drivers Content Penetration • Number of services per rig • Mix of performance solutions and integrated services per rig Value-based pricing $ / RIGS U.S. and international markets Nabors and third-party rigs INDUSTRY RIG COUNT ▲ ▲ ▲ ▲ |
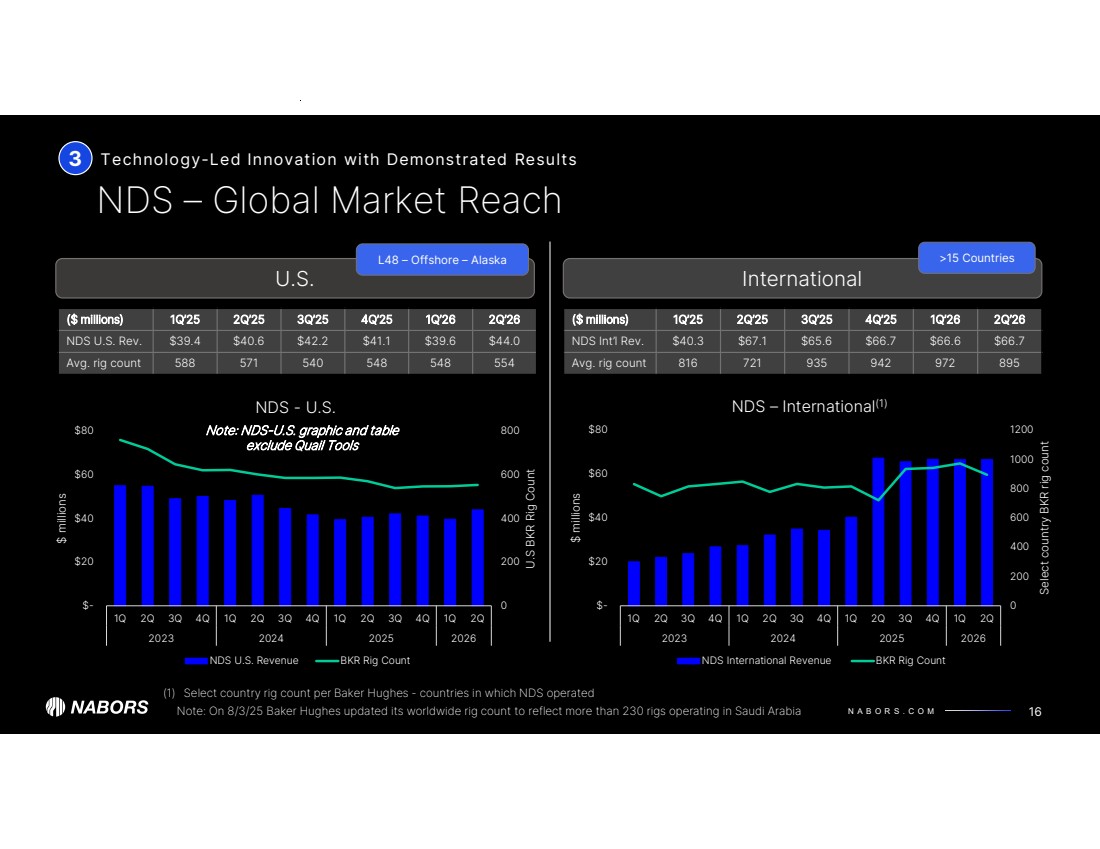
| N A B O R S . C O M 0 200 400 600 800 $- $20 $40 $60 $80 1Q 2Q 3Q 4Q 1Q 2Q 3Q 4Q 1Q 2Q 3Q 4Q 1Q 2Q 2023 2024 2025 2026 U.S BKR Rig Count $ millions NDS - U.S. NDS U.S. Revenue BKR Rig Count 0 200 400 600 800 1000 1200 $- $20 $40 $60 $80 1Q 2Q 3Q 4Q 1Q 2Q 3Q 4Q 1Q 2Q 3Q 4Q 1Q 2Q 2023 2024 2025 2026 Select country BKR rig count $ millions NDS – International(1) NDS International Revenue BKR Rig Count U.S. 16 NDS – Global Market Reach International L48 – Offshore – Alaska (1) Select country rig count per Baker Hughes - countries in which NDS operated >15 Countries ($ millions) 1Q’25 2Q’25 3Q’25 4Q’25 1Q’26 2Q’26 NDS U.S. Rev. $39.4 $40.6 $42.2 $41.1 $39.6 $44.0 Avg. rig count 588 571 540 548 548 554 ($ millions) 1Q’25 2Q’25 3Q’25 4Q’25 1Q’26 2Q’26 NDS Int’l Rev. $40.3 $67.1 $65.6 $66.7 $66.6 $66.7 Avg. rig count 816 721 935 942 972 895 3 Technology-Led Innovation with Demonstrated Results Note: NDS-U.S. graphic and table exclude Quail Tools Note: On 8/3/25 Baker Hughes updated its worldwide rig count to reflect more than 230 rigs operating in Saudi Arabia |
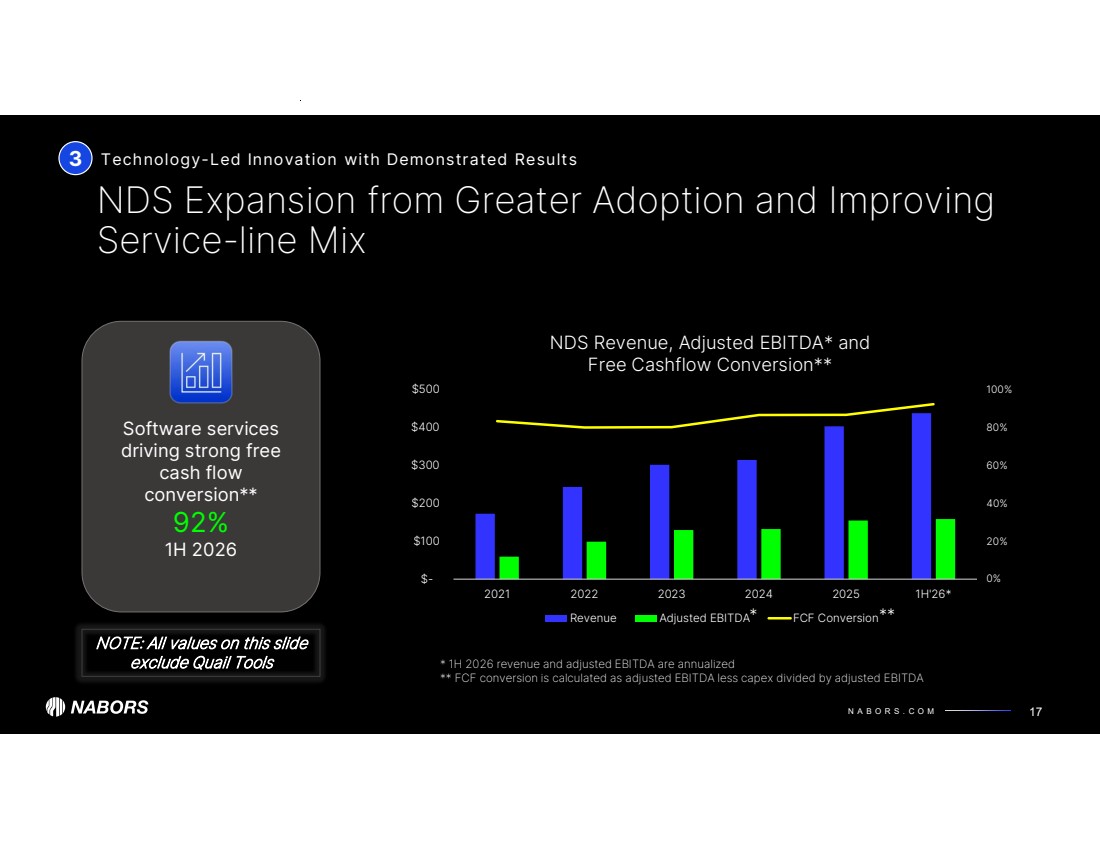
| N A B O R S . C O M 0% 20% 40% 60% 80% 100% $- $100 $200 $300 $400 $500 2021 2022 2023 2024 2025 1H'26* NDS Revenue, Adjusted EBITDA* and Free Cashflow Conversion** Revenue Adjusted EBITDA FCF Conversion NDS Expansion from Greater Adoption and Improving Service-line Mix Technology-Led Innovation with Demonstrated Results 17 3 NOTE: All values on this slide exclude Quail Tools * 1H 2026 revenue and adjusted EBITDA are annualized ** FCF conversion is calculated as adjusted EBITDA less capex divided by adjusted EBITDA ** Software services driving strong free cash flow conversion** 92% 1H 2026 * |
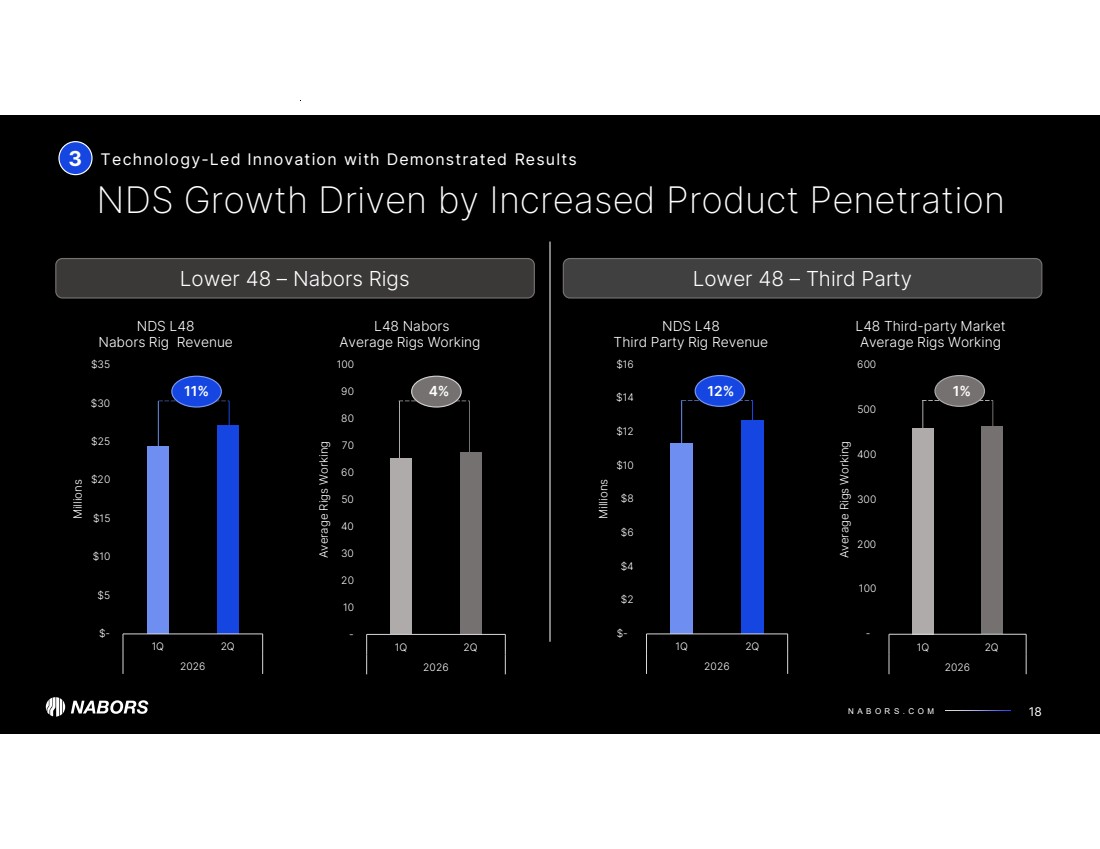
| N A B O R S . C O M Lower 48 – Nabors Rigs 18 NDS Growth Driven by Increased Product Penetration Lower 48 – Third Party 3 Technology-Led Innovation with Demonstrated Results $- $2 $4 $6 $8 $10 $12 $14 $16 1Q 2Q 2026 Millions NDS L48 Third Party Rig Revenue - 100 200 300 400 500 600 1Q 2Q 2026 Average Rigs Working L48 Third-party Market Average Rigs Working 12% 1% $- $5 $10 $15 $20 $25 $30 $35 1Q 2Q 2026 Millions NDS L48 Nabors Rig Revenue - 10 20 30 40 50 60 70 80 90 100 1Q 2Q 2026 Average Rigs Working L48 Nabors Average Rigs Working 11% 4% |
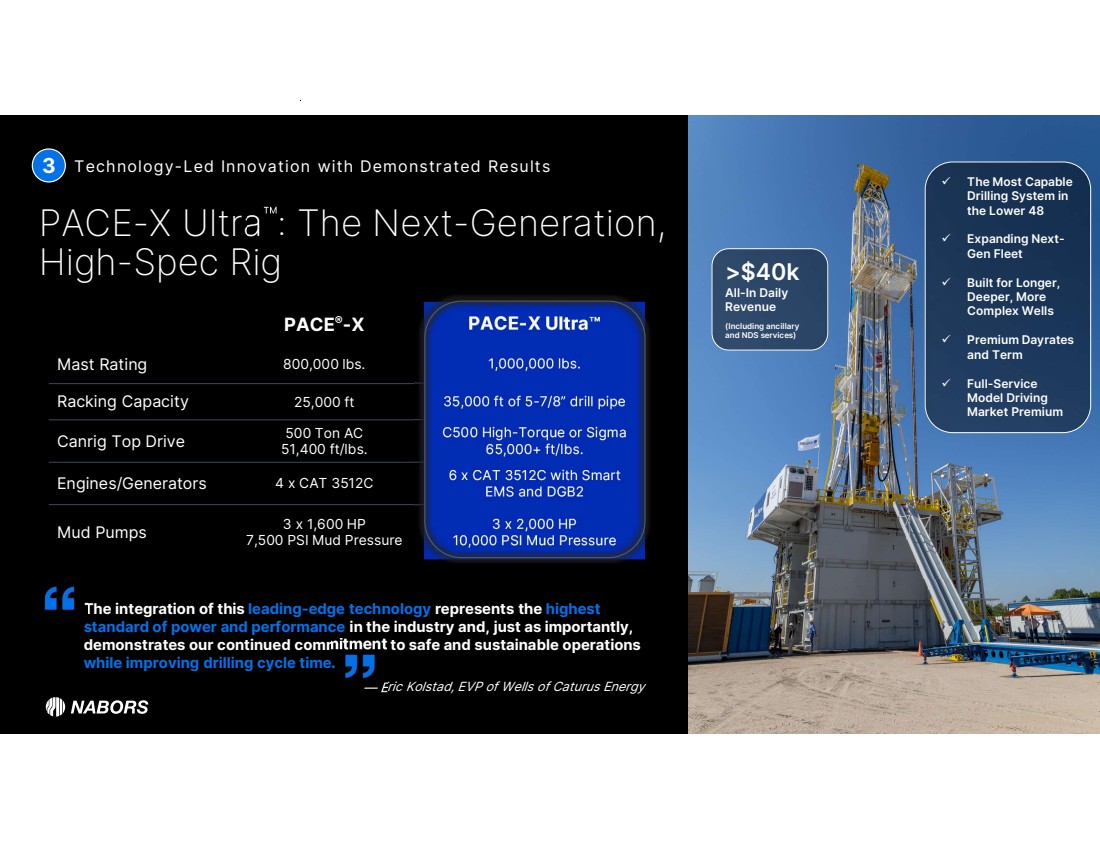
| N A B O R S . C O M PACE-X Ultra : The Next-Generation, High-Spec Rig Technology-Led Innovation with Demonstrated Results 19 3 — Eric Kolstad, EVP of Wells of Caturus Energy The integration of this leading-edge technology represents the highest standard of power and performance in the industry and, just as importantly, demonstrates our continued commitment to safe and sustainable operations while improving drilling cycle time. PACE PACE-X Ultra ®-X Mast Rating 800,000 lbs. 1,000,000 lbs. Racking Capacity 25,000 ft 35,000 ft of 5-7/8” drill pipe C500 High-Torque or Sigma 65,000+ ft/lbs. 500 Ton AC 51,400 ft/lbs. Canrig Top Drive 6 x CAT 3512C with Smart EMS and DGB2 Engines/Generators 4 x CAT 3512C 3 x 2,000 HP 10,000 PSI Mud Pressure 3 x 1,600 HP 7,500 PSI Mud Pressure Mud Pumps The Most Capable Drilling System in the Lower 48 Expanding Next-Gen Fleet Built for Longer, Deeper, More Complex Wells Premium Dayrates and Term Full-Service Model Driving Market Premium >$40k All-In Daily Revenue (Including ancillary and NDS services) |
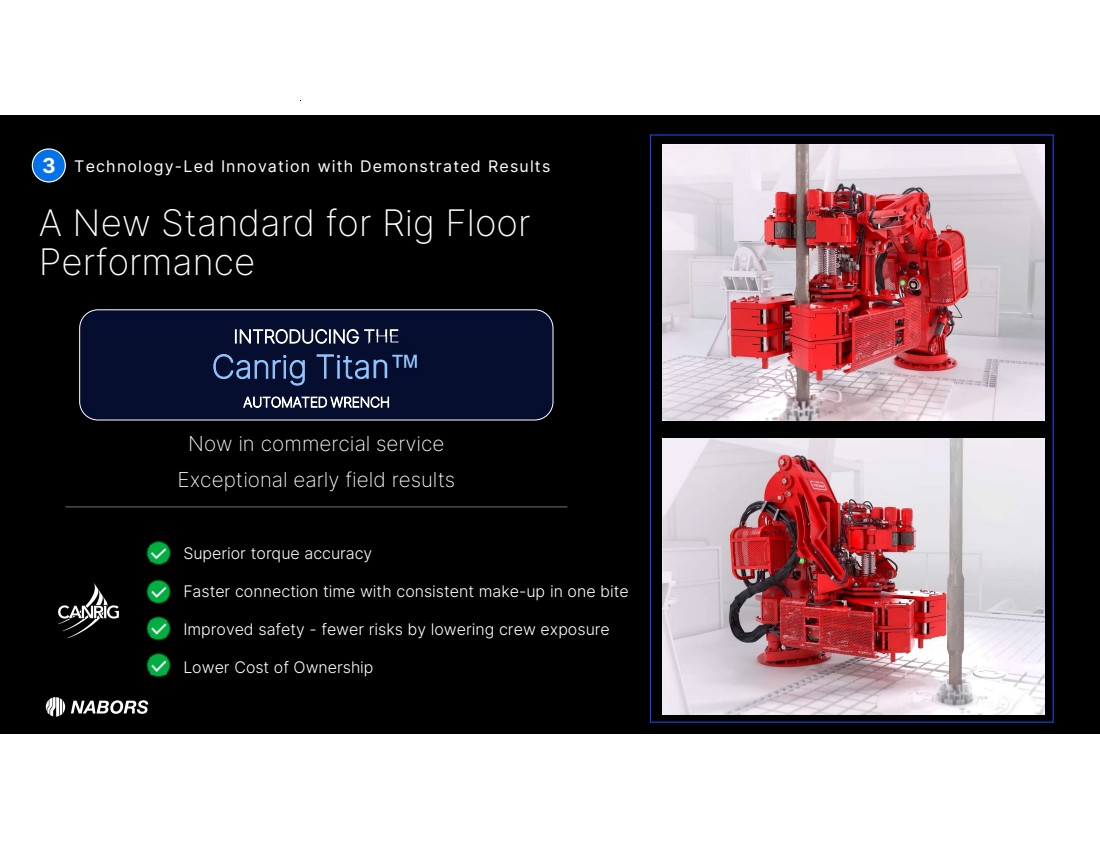
| N A B O R S . C O M A New Standard for Rig Floor Performance 3 Technology-Led Innovation with Demonstrated Results INTRODUCING THE Canrig Titan Now in commercial service Exceptional early field results AUTOMATED WRENCH Superior torque accuracy Faster connection time with consistent make-up in one bite Lower Cost of Ownership Improved safety - fewer risks by lowering crew exposure |
| N A B O R S . C O M 21 Quaise Energy Moves From Venture Investment to Field Deployment 3 Technology-Led Innovation with Demonstrated Results A Nabors rig is now operating at Project Obsidian in Central Oregon – turning our geothermal investment thesis into an active commercial relationship. FIRST-OF-ITS-KIND SUPERHOT GEOTHERMAL PROJECT 300-500ºC SUPERHOT ROCK 50 MW PHASE I OF III INITIAL PHASE PHASE I OF III Project Obsidian will be a 1+ GW power plant once completed*, developed in phases, using a combination of conventional drill bits and millimeter wave drilling technology *We can provide no assurance the Project Obsidian will be completed, either in the for described here or at all. See “Forward Looking Statements”. |

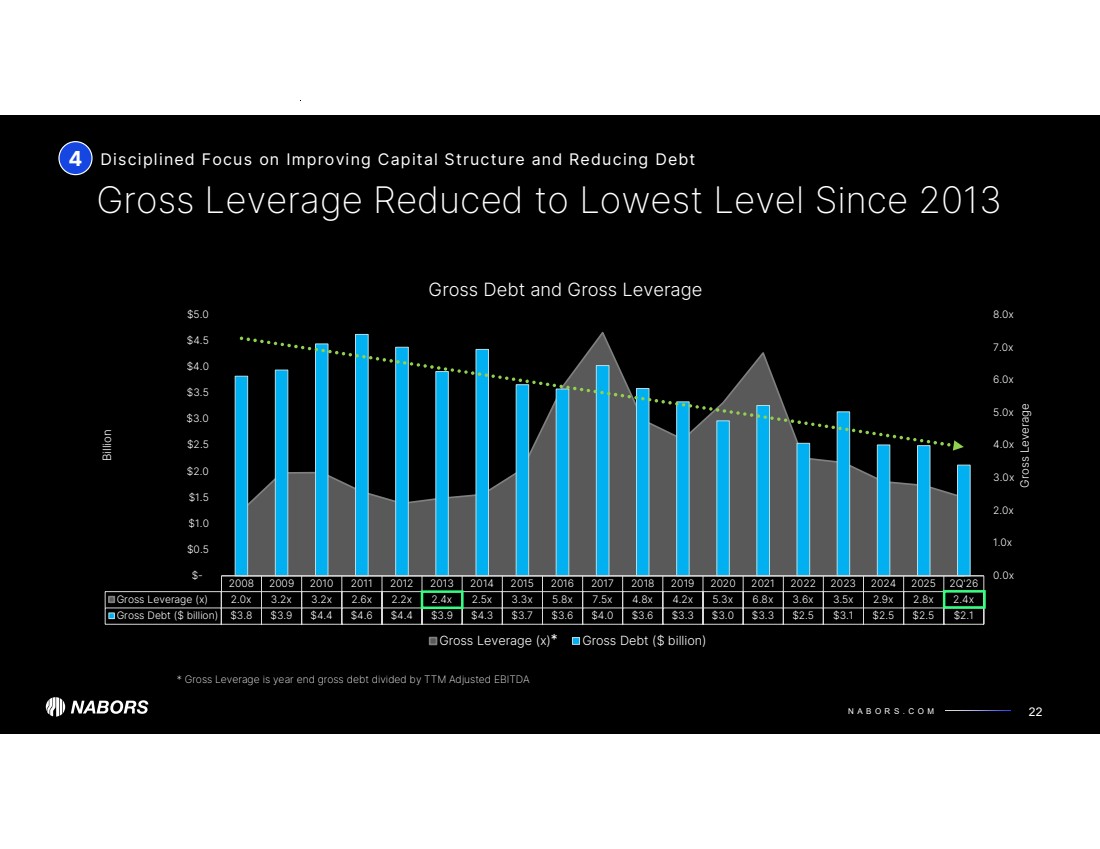
| N A B O R S . C O M 2008 2009 2010 2011 2012 2013 2014 2015 2016 2017 2018 2019 2020 2021 2022 2023 2024 2025 2Q'26 Gross Leverage (x) 2.0x 3.2x 3.2x 2.6x 2.2x 2.4x 2.5x 3.3x 5.8x 7.5x 4.8x 4.2x 5.3x 6.8x 3.6x 3.5x 2.9x 2.8x 2.4x Gross Debt ($ billion) $3.8 $3.9 $4.4 $4.6 $4.4 $3.9 $4.3 $3.7 $3.6 $4.0 $3.6 $3.3 $3.0 $3.3 $2.5 $3.1 $2.5 $2.5 $2.1 0.0x 1.0x 2.0x 3.0x 4.0x 5.0x 6.0x 7.0x 8.0x $- $0.5 $1.0 $1.5 $2.0 $2.5 $3.0 $3.5 $4.0 $4.5 $5.0 Gross Leverage Billion Gross Debt and Gross Leverage Gross Leverage (x) Gross Debt ($ billion) Gross Leverage Reduced to Lowest Level Since 2013 Disciplined Focus on Improving Capital Structure and Reducing Debt 22 4 * Gross Leverage is year end gross debt divided by TTM Adjusted EBITDA * |
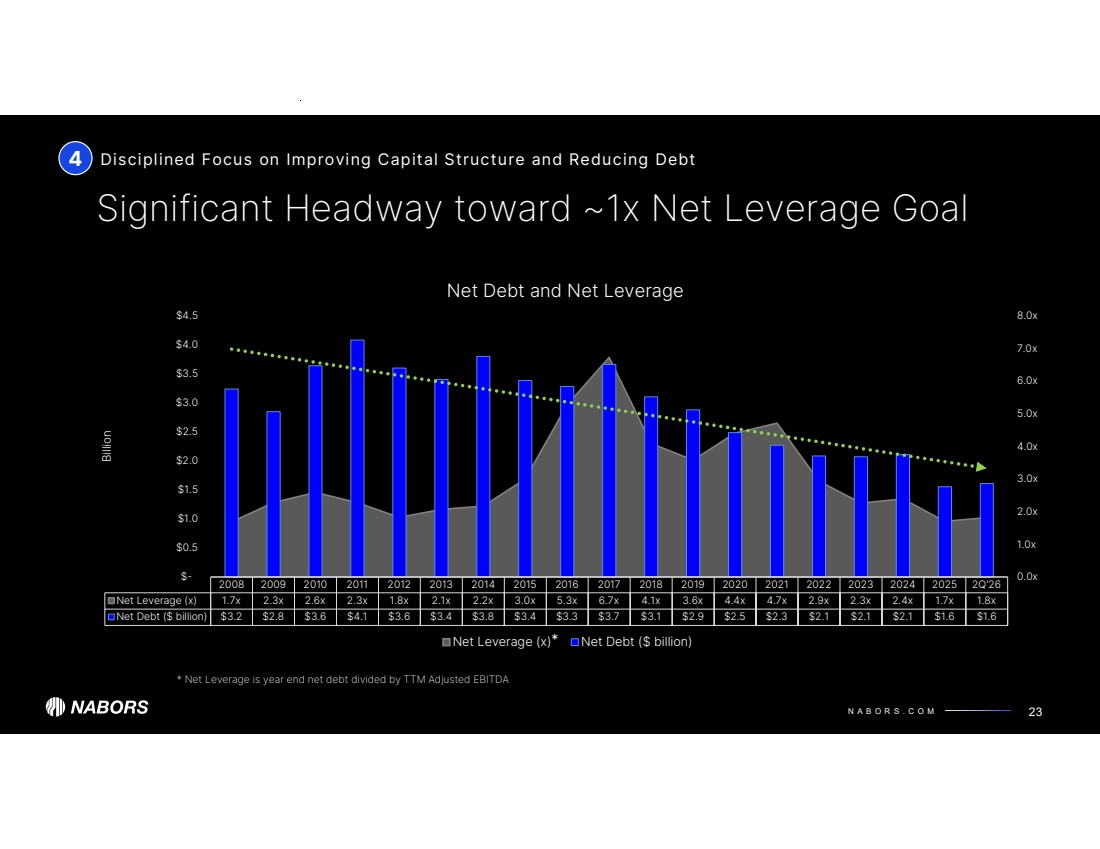
| N A B O R S . C O M 2008 2009 2010 2011 2012 2013 2014 2015 2016 2017 2018 2019 2020 2021 2022 2023 2024 2025 2Q'26 Net Leverage (x) 1.7x 2.3x 2.6x 2.3x 1.8x 2.1x 2.2x 3.0x 5.3x 6.7x 4.1x 3.6x 4.4x 4.7x 2.9x 2.3x 2.4x 1.7x 1.8x Net Debt ($ billion) $3.2 $2.8 $3.6 $4.1 $3.6 $3.4 $3.8 $3.4 $3.3 $3.7 $3.1 $2.9 $2.5 $2.3 $2.1 $2.1 $2.1 $1.6 $1.6 0.0x 1.0x 2.0x 3.0x 4.0x 5.0x 6.0x 7.0x 8.0x $- $0.5 $1.0 $1.5 $2.0 $2.5 $3.0 $3.5 $4.0 $4.5 Billion Net Debt and Net Leverage Net Leverage (x) Net Debt ($ billion) Significant Headway toward ~1x Net Leverage Goal Disciplined Focus on Improving Capital Structure and Reducing Debt 23 4 * Net Leverage is year end net debt divided by TTM Adjusted EBITDA * |
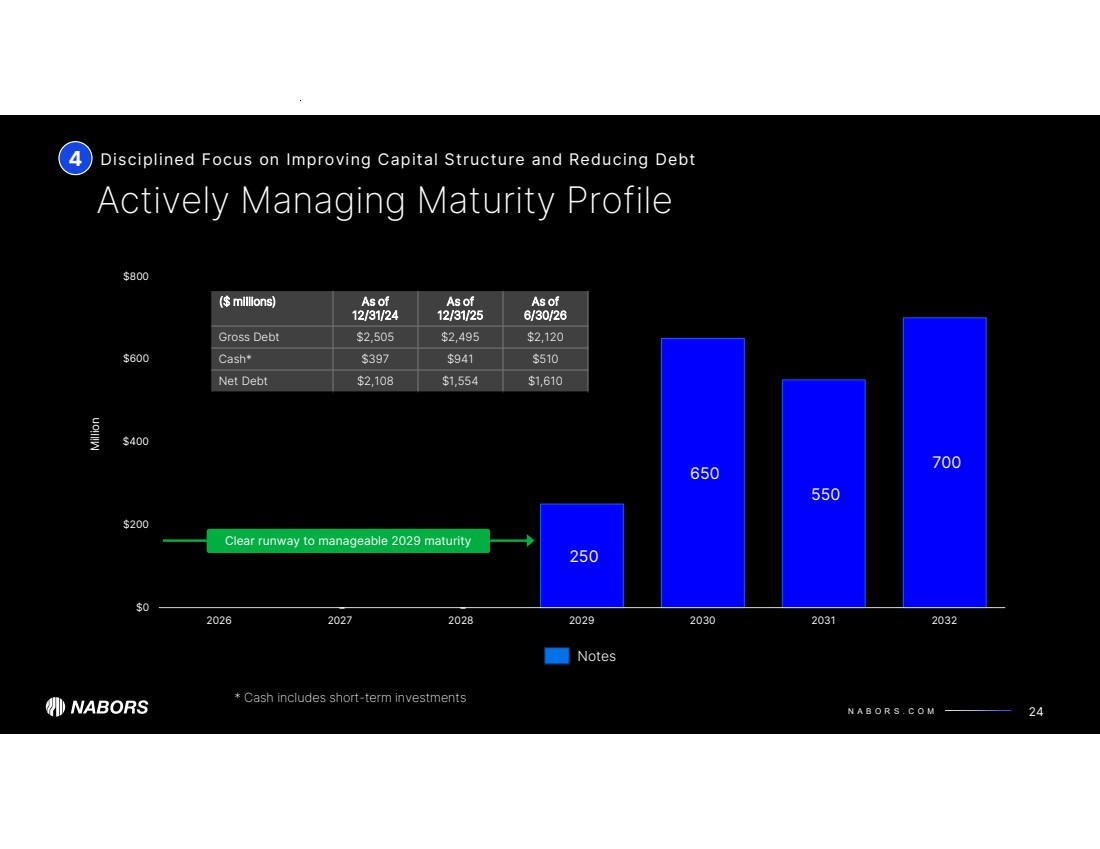
| N A B O R S . C O M - - 250 650 550 700 $0 $200 $400 $600 $800 2026 2027 2028 2029 2030 2031 2032 Million Actively Managing Maturity Profile Disciplined Focus on Improving Capital Structure and Reducing Debt 24 Notes 4 As of 6/30/26 As of 12/31/25 As of 12/31/24 ($ millions) Gross Debt $2,505 $2,495 $2,120 Cash* $397 $941 $510 Net Debt $2,108 $1,554 $1,610 * Cash includes short-term investments Clear runway to manageable 2029 maturity |
| Appendix 25 |
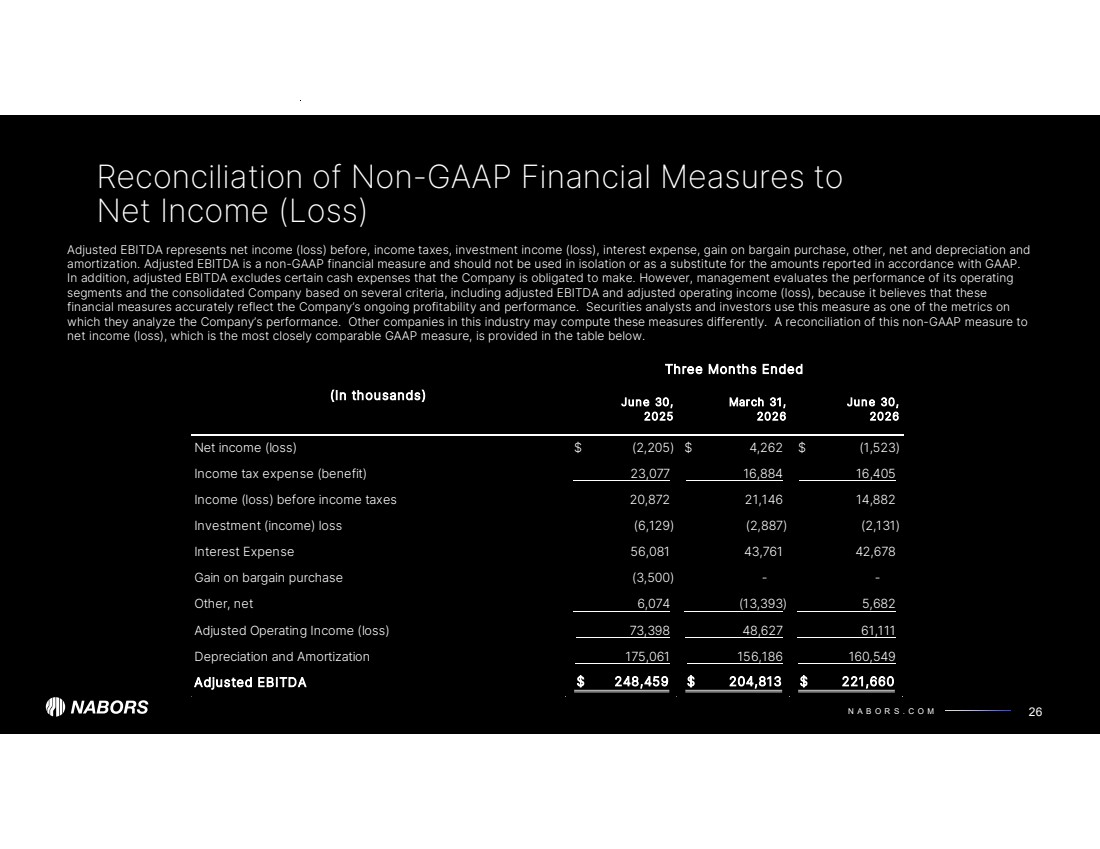
| N A B O R S . C O M Reconciliation of Non-GAAP Financial Measures to Net Income (Loss) 26 Adjusted EBITDA represents net income (loss) before, income taxes, investment income (loss), interest expense, gain on bargain purchase, other, net and depreciation and amortization. Adjusted EBITDA is a non-GAAP financial measure and should not be used in isolation or as a substitute for the amounts reported in accordance with GAAP. In addition, adjusted EBITDA excludes certain cash expenses that the Company is obligated to make. However, management evaluates the performance of its operating segments and the consolidated Company based on several criteria, including adjusted EBITDA and adjusted operating income (loss), because it believes that these financial measures accurately reflect the Company’s ongoing profitability and performance. Securities analysts and investors use this measure as one of the metrics on which they analyze the Company’s performance. Other companies in this industry may compute these measures differently. A reconciliation of this non-GAAP measure to net income (loss), which is the most closely comparable GAAP measure, is provided in the table below. (In thousands) June 30, March 31, June 30, 2025 2026 2026 Net income (loss) (2,205) $ 4,262 $ (1,523) $ Income tax expense (benefit) 23,077 16,884 16,405 Income (loss) before income taxes 20,872 21,146 14,882 Investment (income) loss (6,129) (2,887) (2,131) Interest Expense 56,081 43,761 42,678 Gain on bargain purchase (3,500) - - Other, net 6,074 (13,393) 5,682 Adjusted Operating Income (loss) 73,398 48,627 61,111 Depreciation and Amortization 175,061 156,186 160,549 Adjusted EBITDA $ 248,459 204,813 $ 221,660 $ Three Months Ended |
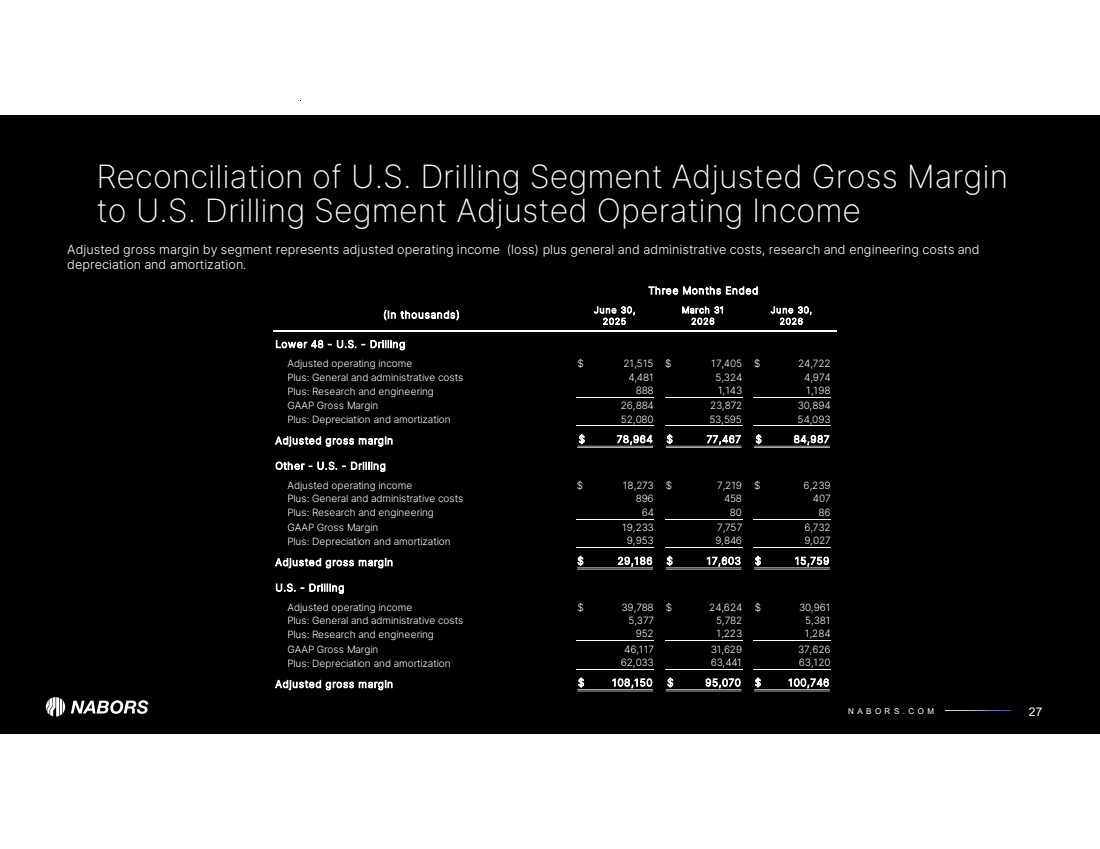
| N A B O R S . C O M Reconciliation of U.S. Drilling Segment Adjusted Gross Margin to U.S. Drilling Segment Adjusted Operating Income 27 Adjusted gross margin by segment represents adjusted operating income (loss) plus general and administrative costs, research and engineering costs and depreciation and amortization. June 30, March 31 June 30, 2025 2026 2026 Lower 48 - U.S. - Drilling Adjusted operating income 21,515 $ 17,405 $ 24,722 $ Plus: General and administrative costs 4,481 5,324 4,974 Plus: Research and engineering 888 1,143 1,198 GAAP Gross Margin 26,884 23,872 30,894 Plus: Depreciation and amortization 53,595 52,080 54,093 Adjusted gross margin $ 77,467 78,964 $ 84,987 $ Other - U.S. - Drilling Adjusted operating income 18,273 $ 7,219 $ 6,239 $ Plus: General and administrative costs 896 458 407 Plus: Research and engineering 64 80 86 GAAP Gross Margin 19,233 7,757 6,732 Plus: Depreciation and amortization 9,846 9,953 9,027 Adjusted gross margin $ 29,186 17,603 $ 15,759 $ U.S. - Drilling Adjusted operating income 39,788 $ 24,624 $ 30,961 $ Plus: General and administrative costs 5,377 5,782 5,381 Plus: Research and engineering 952 1,223 1,284 GAAP Gross Margin 46,117 31,629 37,626 Plus: Depreciation and amortization 63,441 62,033 63,120 Adjusted gross margin $ 95,070 108,150 $ 100,746 $ (In thousands) Three Months Ended |
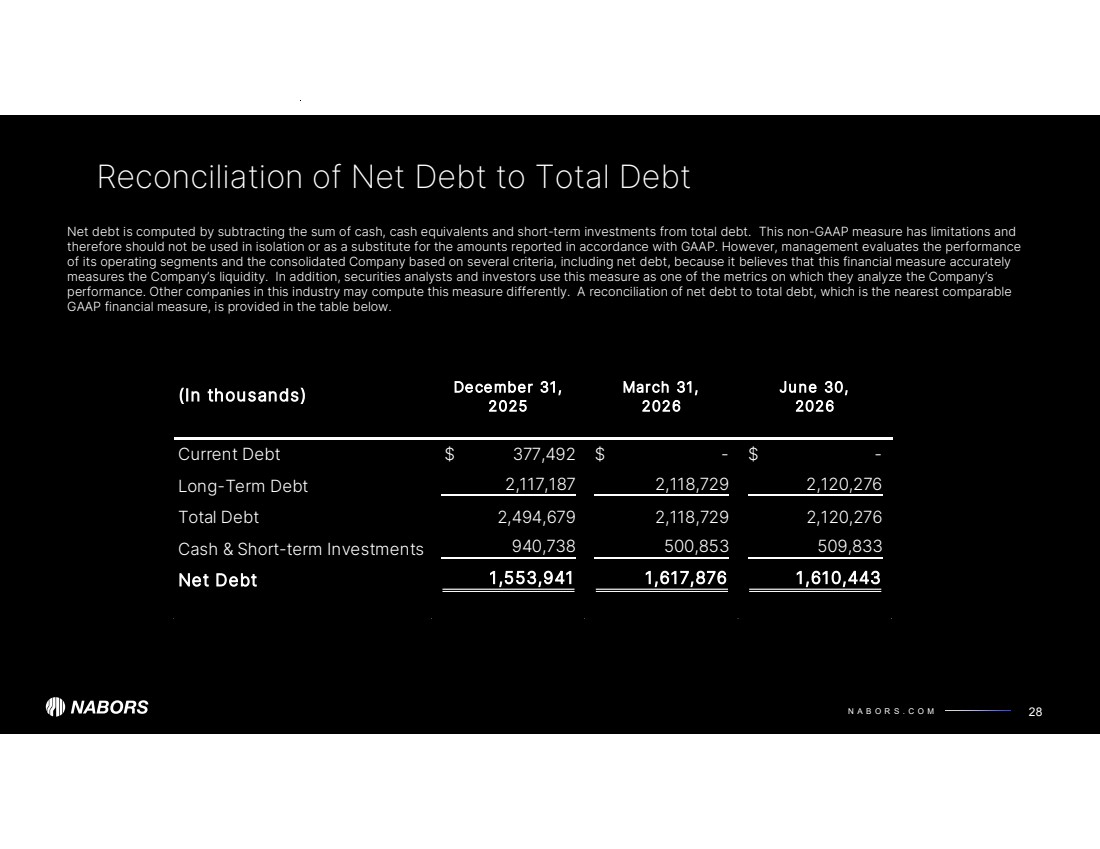
| N A B O R S . C O M Reconciliation of Net Debt to Total Debt 28 Net debt is computed by subtracting the sum of cash, cash equivalents and short-term investments from total debt. This non-GAAP measure has limitations and therefore should not be used in isolation or as a substitute for the amounts reported in accordance with GAAP. However, management evaluates the performance of its operating segments and the consolidated Company based on several criteria, including net debt, because it believes that this financial measure accurately measures the Company’s liquidity. In addition, securities analysts and investors use this measure as one of the metrics on which they analyze the Company’s performance. Other companies in this industry may compute this measure differently. A reconciliation of net debt to total debt, which is the nearest comparable GAAP financial measure, is provided in the table below. December 31, March 31, June 30, 2025 2026 2026 Current Debt 377,492 $ - $ - $ Long-Term Debt 2,117,187 2,118,729 2,120,276 Total Debt 2,494,679 2,118,729 2,120,276 Cash & Short-term Investments 940,738 500,853 509,833 Net Debt 1,553,941 1,617,876 1,610,443 (In thousands) |
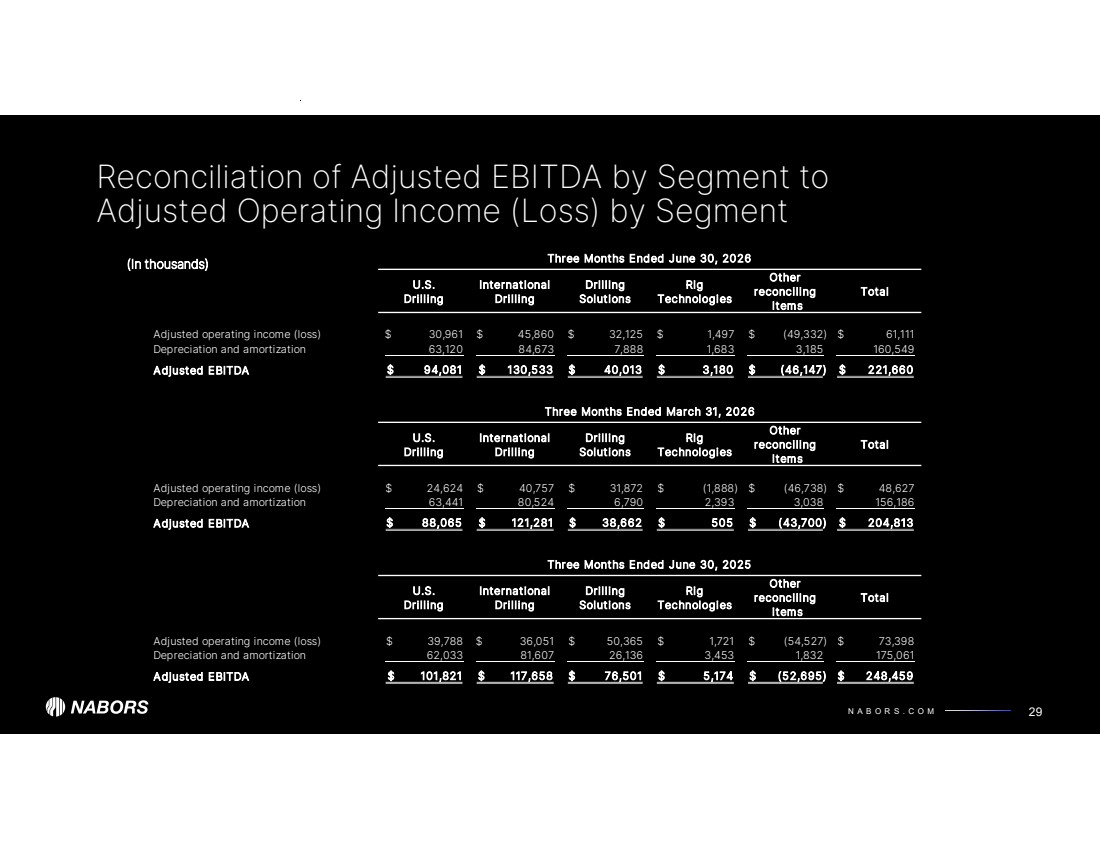
| N A B O R S . C O M Three Months Ended June 30, 2026 U.S. Drilling International Drilling Drilling Solutions Rig Technologies Other reconciling items Total Adjusted operating income (loss) 30,961 $ 45,860 $ 32,125 $ 1,497 $ (49,332) $ 61,111 $ Depreciation and amortization 63,120 84,673 7,888 1,683 3,185 160,549 Adjusted EBITDA $ 130,533 94,081 $ 40,013 $ 3,180 $ (46,147) $ 221,660 $ Three Months Ended March 31, 2026 U.S. Drilling International Drilling Drilling Solutions Rig Technologies Other reconciling items Total Adjusted operating income (loss) 24,624 $ 40,757 $ 31,872 $ (1,888) $ (46,738) $ 48,627 $ Depreciation and amortization 63,441 80,524 6,790 2,393 3,038 156,186 Adjusted EBITDA $ 88,065 121,281 $ 38,662 $ 505 $ (43,700) $ 204,813 $ Three Months Ended June 30, 2025 U.S. Drilling International Drilling Drilling Solutions Rig Technologies Other reconciling items Total Adjusted operating income (loss) 39,788 $ 36,051 $ 50,365 $ 1,721 $ (54,527) $ 73,398 $ Depreciation and amortization 81,607 62,033 26,136 3,453 1,832 175,061 Adjusted EBITDA $ 117,658 101,821 $ 76,501 $ 5,174 $ (52,695) $ 248,459 $ Reconciliation of Adjusted EBITDA by Segment to Adjusted Operating Income (Loss) by Segment 29 (In thousands) |
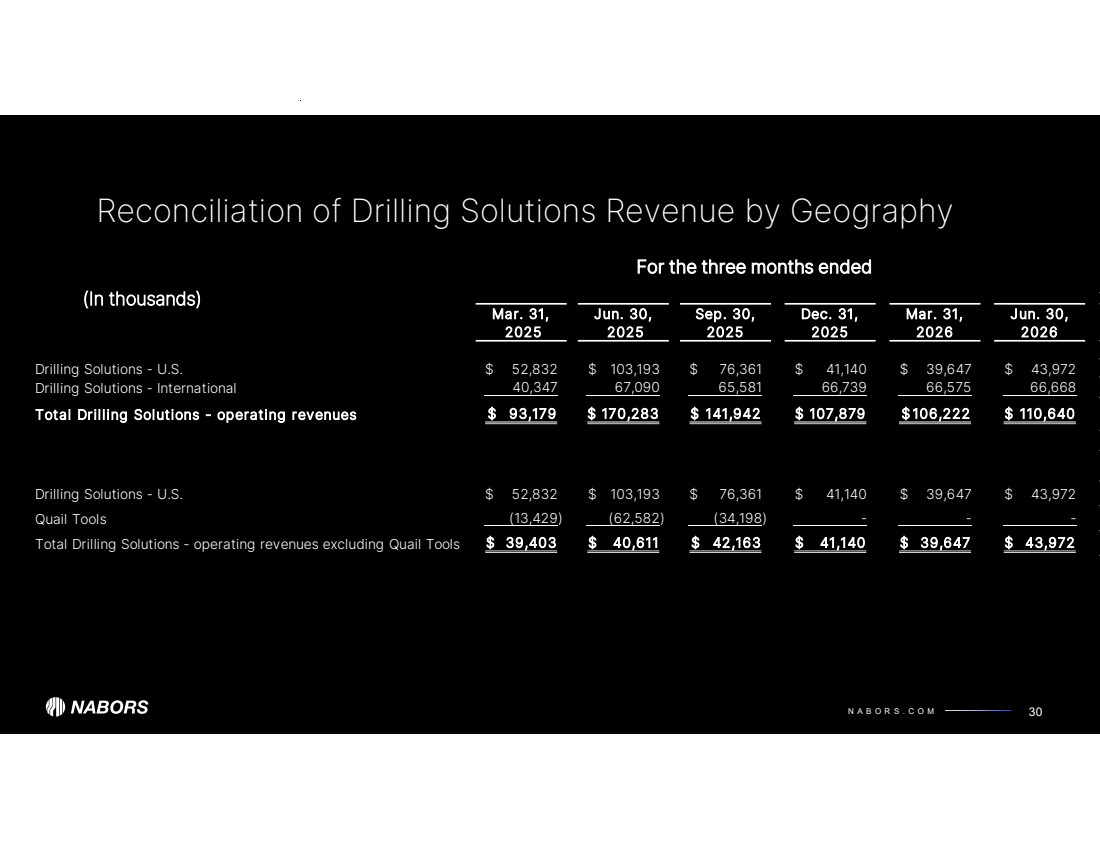
| N A B O R S . C O M Mar. 31, 2025 Jun. 30, 2025 Sep. 30, 2025 Dec. 31, 2025 Mar. 31, 2026 Jun. 30, 2026 Drilling Solutions - U.S. 52,832 $ 103,193 $ 76,361 $ 41,140 $ 39,647 $ 43,972 $ Drilling Solutions - International 67,090 40,347 65,581 66,739 66,575 66,668 Total Drilling Solutions - operating revenues $ 170,283 93,179 $ 141,942 $ 107,879 $ 106,222 $ 110,640 $ Drilling Solutions - U.S. 52,832 $ 103,193 $ 76,361 $ 41,140 $ 39,647 $ 43,972 $ Quail Tools (62,582) (13,429) (34,198) - - - Total Drilling Solutions - operating revenues excluding Quail Tools $ 39,403 40,611 $ 42,163 $ 41,140 $ 39,647 $ 43,972 $ Reconciliation of Drilling Solutions Revenue by Geography 30 (In thousands) For the three months ended |
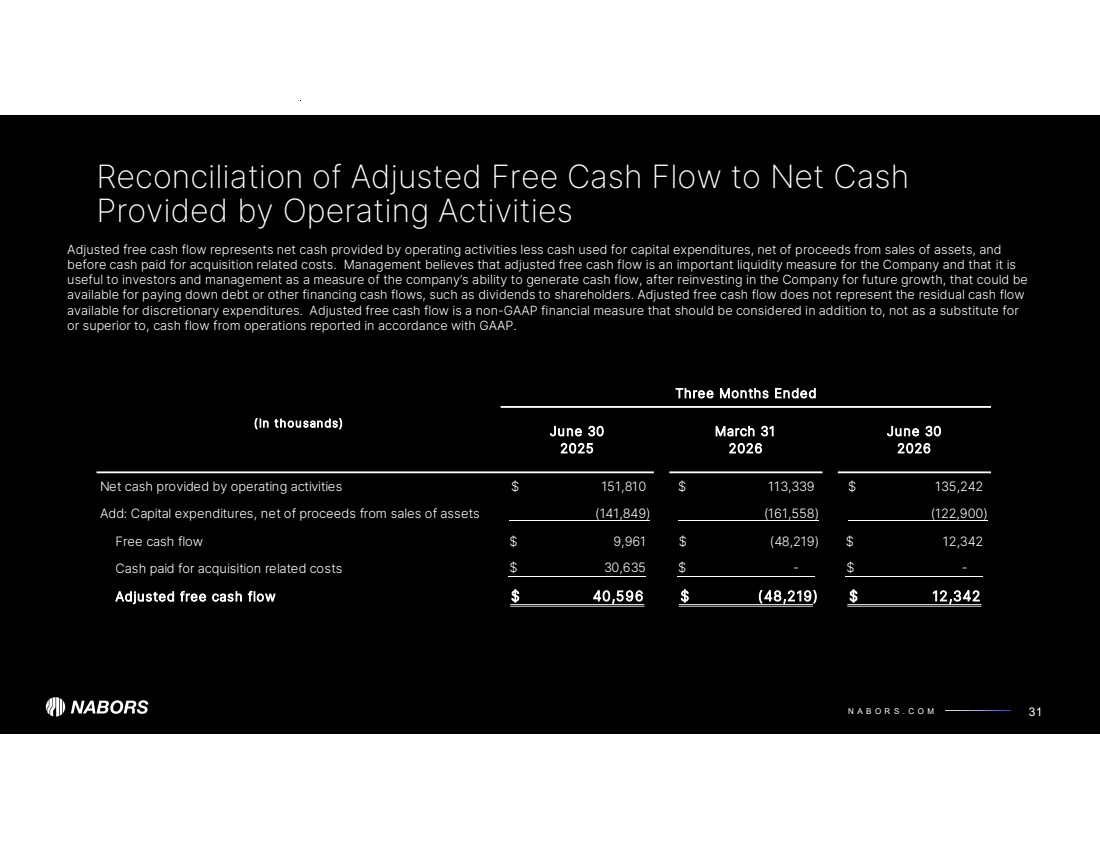
| N A B O R S . C O M Reconciliation of Adjusted Free Cash Flow to Net Cash Provided by Operating Activities 31 Adjusted free cash flow represents net cash provided by operating activities less cash used for capital expenditures, net of proceeds from sales of assets, and before cash paid for acquisition related costs. Management believes that adjusted free cash flow is an important liquidity measure for the Company and that it is useful to investors and management as a measure of the company’s ability to generate cash flow, after reinvesting in the Company for future growth, that could be available for paying down debt or other financing cash flows, such as dividends to shareholders. Adjusted free cash flow does not represent the residual cash flow available for discretionary expenditures. Adjusted free cash flow is a non-GAAP financial measure that should be considered in addition to, not as a substitute for or superior to, cash flow from operations reported in accordance with GAAP. Three Months Ended (In thousands) June 30 March 31 June 30 2025 2026 2026 Net cash provided by operating activities 151,810 $ 113,339 $ 135,242 $ Add: Capital expenditures, net of proceeds from sales of assets (141,849) (161,558) (122,900) Free cash flow 9,961 $ (48,219) $ 12,342 $ Cash paid for acquisition related costs $ - 30,635 $ - $ Adjusted free cash flow $ 40,596 (48,219) $ 12,342 $ |
| NABORS INDUSTRIES LTD. NABORS.COM NABORS CORPORATE SERVICES 515 W. Greens Road Suite 1200 Houston, TX 77067-4525 @ n a b o r s g l o b a l Contact Us: William C. Conroy, CFA VP - Corporate Development and Investor Relations William.Conroy@nabors.com Kara K. Peak Director - Corporate Development and Investor Relations Kara.Peak@nabors.com |