
CONTACT: Michael D. Witzeman
(513) 762-6714
Chemed Reports Second-Quarter 2026 Results
Full-Year Guidance Increased Due Mainly to VITAS Outperformance
CINCINNATI, July 28, 2026—Chemed Corporation (Chemed) (NYSE: CHE), which operates VITAS Healthcare Corporation (VITAS), the nation’s largest providers of end-of-life care, and Roto-Rooter, the nation’s largest commercial and residential plumbing and drain cleaning services provider, reported financial results for its second quarter ended June 30, 2026, versus the comparable prior-year period.
Results for Quarter Ended June 30, 2026
Consolidated operating results:
|
·
| |
Revenue increased 8.8% to $673.3 million |
|
·
| |
GAAP Diluted Earnings-per-Share (EPS) of $5.13, an increase of 43.7% |
|
·
| |
Adjusted Diluted EPS of $6.06, an increase of 41.9% |
VITAS segment operating results:
|
·
| |
Net Patient Revenue of $443.3 million, an increase of 11.9% |
|
·
| |
Average Daily Census (ADC) of 23,687, an increase of 6.1% |
|
·
| |
Admissions of 19,125, an increase of 9.0% |
|
·
| |
Net Income, excluding certain discrete items, of $61.3 million, an increase of 60.5% |
|
·
| |
Adjusted EBITDA, excluding Medicare Cap, of $80.6 million, an increase of 20.6% |
|
·
| |
Adjusted EBITDA margin, excluding Medicare Cap, of 18.2%, an increase of 196-basis points |
Roto-Rooter segment operating results:
|
·
| |
Revenue of $229.9 million, an increase of 3.3% |
|
·
| |
Net Income, excluding certain discrete items, of $33.8 million, essentially flat |
|
·
| |
Adjusted EBITDA of $48.5 million, essentially flat |
|
·
| |
Adjusted EBITDA margin of 21.1%, a decline of 77-basis points |
VITAS
VITAS net revenue was $443.3 million in the second quarter of 2026, which is an increase of 11.9% when compared to the prior-year period. This revenue increase is comprised primarily of a 6.1% increase in days-of-care and a geographically weighted average Medicare reimbursement rate increase of approximately 2.4%. Acuity mix shift negatively impacted revenue growth 115-basis points in the quarter when compared to the prior-year period’s revenue and level-of-care mix. The combination of Medicare Cap and other contra revenue changes positively impacted revenue growth by 455-basis points.
Total VITAS admissions increased 9.0% in the second quarter of 2026 compared to the second quarter of 2025.
In the second quarter of 2026, VITAS accrued $500,000 in Medicare Cap billing limitation. This compares to the Medicare Cap billing limitation recorded in the second quarter of 2025 of $16.4 million. No Medicare Cap billing limitation was recorded in the second quarter of 2026 for the Florida combined program, and none is anticipated for the 2026 fiscal period.
Of VITAS’ 33 Medicare provider numbers, 22 provider numbers have an anticipated full-year Medicare Cap cushion of 10% or greater, seven provider numbers have a cushion between 0% and 10%, and four provider numbers have a Medicare Cap billing limitation totaling $7.0 million.
Average revenue per patient per day in the second quarter of 2026 was $209.98 which is 143-basis points above the prior-year period. Reimbursement for routine home care and high-acuity care averaged $188.62 and $1,152.14, respectively. During the quarter, high-acuity days-of-care were 2.2% of total days of care, a decline of 24-basis points when compared to the prior-year quarter.
The second quarter 2026 gross margin, excluding Medicare Cap, was 23.9%, a 164-basis point increase from the same period of 2025. Selling, general and administrative expenses were $26.1 million in the second quarter of 2026 compared to $25.1 million in the prior- year quarter.
Adjusted EBITDA, excluding Medicare Cap, totaled $80.6 million in the quarter, an increase of 20.6% when compared to the prior-year period. Adjusted EBITDA margin in the quarter, excluding Medicare Cap, was 18.2%.
Roto-Rooter
Roto-Rooter generated quarterly revenue of $229.9 million in the second quarter of 2026, an increase of 3.3%, when compared to the prior-year quarter.
Roto-Rooter branch commercial revenue in the quarter totaled $56.8 million, an increase of 6.8% from the prior-year period. This aggregate commercial revenue change consisted of plumbing increasing 11.9%, drain cleaning increasing 6.9%, water restoration increasing 3.7% and excavation increasing 2.3%.
Roto-Rooter branch residential revenue in the quarter totaled $159.1 million, an increase of 1.7%, over the prior-year period. This aggregate residential revenue change consisted of excavation increasing 11.1%, plumbing increasing 3.3%, and drain cleaning increasing 1.3%, offset by a decline in water restoration of 6.7%.
In the second quarter of 2026, revenue from independent contractors was $17.1 million which is a decline of 1.9% as compared to the same period of 2025.
Roto-Rooter’s second quarter 2026 gross margin was 50.4%. This compares to the prior-year quarter’s gross margin of 49.0%. Roto-Rooter’s selling, general and administrative expenses were $67.4 million in the quarter, which is an increase of 11.3% compared to the second quarter of 2025.
Adjusted EBITDA in the second quarter of 2026 totaled $48.5 million, essentially flat when compared to the second quarter of 2025. The Adjusted EBITDA margin in the quarter was 21.1% which represents a 77-basis point decline from the second quarter of 2025.
Chemed Consolidated
As of June 30, 2026, Chemed had total cash and cash equivalents of $40.2 million and $140.0 million in long-term debt.
In April 2026, Chemed entered into a new five-year $450 million Amended and Restated Credit Agreement (Credit Agreement). This Credit Agreement consists of a $450 million revolving line of credit and a $250 million expansion feature. The interest rate on this Credit Agreement has a floating rate that is currently SOFR plus 100-basis points. There is approximately $262.7 million undrawn borrowing capacity under the Credit Agreement after excluding $47.3 million for Letters of Credit.
During the quarter, the Company repurchased 210,000 shares of Chemed stock for $89.8 million which equates to a cost per share of $427.81. Over the trailing 12-months, the Company has repurchased 1,517,500 shares of Chemed stock at an average price of $423.63 per share. This equates to a reduction in outstanding Chemed shares of approximately 10.5% over that period. As of June 30, 2026, there was approximately $139.8 million of remaining share repurchase authorization under its plan.
Guidance Update
Although, historically, we do not give quarterly updates, our guidance was revised in conjunction with the first quarter 2026 earnings release due to the materially improved performance of VITAS, coupled with the level of share repurchases. We have updated the guidance again mainly to continue our normal, historical cadence of updating expectations at the mid-year earnings release. Barring any unusual developments, updating guidance once per year in conjunction with our second quarter press release is our on-going expectation. Further operational detail will be provided during the investor conference call.
VITAS’ initiatives to return to a normal growth pattern after managing the 2025 Medicare Cap issue progressed more quickly than originally anticipated and continue to provide higher than expected growth in the business. The following shows the updated key guidance metrics compared to the guidance metrics provided in the first quarter 2026 earnings release:
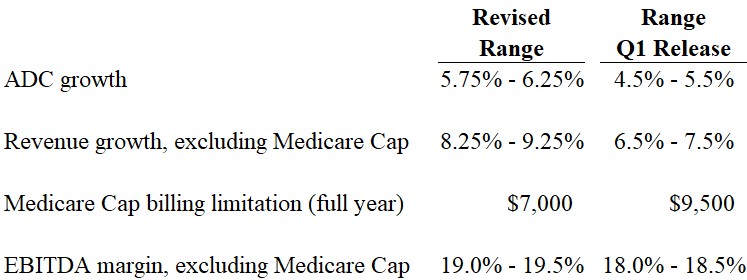
Roto-Rooter performed in-line with our expectations and therefore, full year guidance for the segment remains unchanged. Full year anticipated revenue growth is 3.0% to 3.5%. Estimated adjusted EBITDA margin is 21.5% to 22.5%.
Based on the above, full-year 2026 earnings per diluted share, excluding non-cash expenses for stock options, tax benefits from stock option exercises, costs related to litigation and other discrete items, are estimated to be in the range of $25.00 to $25.75. This compares to the guidance given in conjunction with the first quarter of 2026 press release of $24.00 to $24.75 per diluted share. The mid-point of the revised guidance represents a 17.8% increase from 2025 adjusted earnings per diluted share of $21.55. The revised guidance assumes an effective corporate tax rate on adjusted earnings of 24.5% and a diluted share count of 13.5 million shares.
Conference Call
As previously disclosed, Chemed will host a conference call and webcast at 10 a.m., ET, on Wednesday July 29, 2026, to discuss the company's quarterly results and to provide an update on its business. Participants may access a live webcast of the conference call through the investor relations section of Chemed’s website, Investor Relations Home | Chemed Corporation or the hosting website https://edge.media-server.com/mmc/p/u8u2qjst.
Participants may also register via teleconference at:
https://register-conf.media-server.com/register/BI55b09312fbd04f76b526dfcc5f7e174e.
Once registration is completed, participants will be provided with a dial-in number containing a personalized conference code to access the call. All participants are instructed to dial-in 15 minutes prior to the start time.
A taped replay of the conference call will be available beginning approximately two hours after the call's conclusion. You may access the replay via webcast through the investor relations section of Chemed’s website.
Chemed operates in the healthcare field through its VITAS Healthcare Corporation subsidiary. VITAS provides daily hospice services to patients with severe, life-limiting illnesses. This type of care is focused on making the terminally ill patient's final days as comfortable and pain-free as possible.
Chemed operates in the residential and commercial plumbing and drain cleaning industry under the brand name Roto-Rooter. Roto-Rooter provides plumbing, drain cleaning, and water cleanup services through company-owned branches, independent contractors and franchisees in the United States and Canada. Roto-Rooter also has licensed master franchisees in the republics of Indonesia and Singapore, and the Philippines.
This press release contains information about Chemed’s EBITDA, Adjusted EBITDA, and Adjusted Diluted EPS, which are not measures derived in accordance with GAAP and which exclude components that are important to understanding Chemed’s financial performance. In reporting its operating results, Chemed provides EBITDA, Adjusted EBITDA and Adjusted Diluted EPS measures to help investors and others evaluate the Company’s operating results, compare its operating performance with that of similar companies that have different capital structures and evaluate its ability to meet its future debt service, capital expenditures and working capital requirements. Chemed’s management similarly uses EBITDA, Adjusted EBITDA, and Adjusted Diluted EPS to assist it in evaluating the performance of the Company across fiscal periods and in assessing how its performance compares to its peer companies. These measures also help Chemed’s management to estimate the resources required to meet Chemed’s future financial obligations and expenditures. Chemed’s EBITDA, Adjusted EBITDA and Adjusted Diluted EPS should not be considered in isolation or as a substitute for comparable measures calculated and presented in accordance with GAAP. We calculated Adjusted EBITDA Margin by dividing Adjusted EBITDA by service revenue and sales. A reconciliation of Chemed’s net income to its EBITDA, Adjusted EBITDA and Adjusted Diluted EPS is presented in the tables following the text of this press release.
SAFE HARBOR STATEMENT UNDER THE PRIVATE SECURITIES LITIGATION REFORM ACT OF 1995 REGARDING FORWARD-LOOKING INFORMATION
Statements in this press release contain forward-looking statements within the meaning of the safe harbor provisions of the U.S. Private Securities Litigation Reform Act of 1995. Forward-looking statements can be identified by words such as “anticipate,” “intend,” “plan,” “goal,” “seek,” “believe,” “project,” “estimate,” “expect,” “strategy,” “future,” “likely,” “may,” “should,” “will” and similar references to future periods and are based upon assumptions subject to certain known and unknown risks, uncertainties, contingencies and other factors, including, but not limited to, the impact of laws and regulations on Chemed’s operations, including Medicare Cap and Medicare reimbursement rates, Chemed’s estimates of the effect of Medicare Cap on VITAS’ revenues and future prospects, Chemed’s expectations regarding VITAS’ patient mix and Chemed’s expectations regarding demand for Roto-Rooter’s services.
Because forward looking statements relate to the future, they are subject to inherent uncertainties, risks and changes in circumstances that are difficult to predict and many of which are outside of Chemed’s control. Chemed’s actual results and financial condition may differ materially from those
indicated in the forward-looking statements included in this press release, including as a result of the risks described above and those described in the Chemed’s Annual Report on Form 10-K for the year ended December 31, 2025 and in its Quarterly Reports filed in 2026. Any forward-looking statement made by Chemed in this press release is based only on information currently available to Chemed and speaks only as of the date on which it is made. Chemed undertakes no obligation to publicly update any forward-looking statement, whether written or oral, that may be made from time to time, whether as a result of new information, future developments or otherwise.
|
|
|
|
|
|
|
|
|
|
|
|
|
|
|
CHEMED CORPORATION AND SUBSIDIARY COMPANIES
|
|
CONSOLIDATED STATEMENTS OF INCOME
|
|
(in thousands, except per share data)(unaudited)
|
|
|
|
|
|
|
|
|
|
|
|
|
|
|
|
|
|
Three Months Ended June 30,
|
|
Six Months Ended June 30,
|
|
|
|
2026
|
|
2025
|
|
2026
|
|
2025
|
|
Service revenues and sales
|
|
$
|
673,251
|
|
$
|
618,798
|
|
$
|
1,330,764
|
|
|
1,265,741
|
|
Cost of services provided and goods sold
|
|
|
451,780
|
|
|
434,105
|
|
|
893,529
|
|
|
864,635
|
|
Selling, general and administrative expenses (aa)
|
|
|
115,203
|
|
|
100,323
|
|
|
229,524
|
|
|
205,910
|
|
Depreciation
|
|
|
14,267
|
|
|
13,689
|
|
|
28,570
|
|
|
27,134
|
|
Amortization
|
|
|
2,719
|
|
|
2,571
|
|
|
5,289
|
|
|
5,143
|
|
Other operating expense
|
|
|
78
|
|
|
26
|
|
|
70
|
|
|
77
|
|
Total costs and expenses
|
|
|
584,047
|
|
|
550,714
|
|
|
1,156,982
|
|
|
1,102,899
|
|
Income from operations
|
|
|
89,204
|
|
|
68,084
|
|
|
173,782
|
|
|
162,842
|
|
Interest expense
|
|
|
(1,789)
|
|
|
(443)
|
|
|
(2,301)
|
|
|
(772)
|
|
Other income--net (bb)
|
|
|
3,914
|
|
|
3,474
|
|
|
8,688
|
|
|
4,719
|
|
Income before income taxes
|
|
|
91,329
|
|
|
71,115
|
|
|
180,169
|
|
|
166,789
|
|
Income taxes
|
|
|
(23,626)
|
|
|
(18,622)
|
|
|
(46,164)
|
|
|
(42,539)
|
|
Net income
|
|
$
|
67,703
|
|
$
|
52,493
|
|
$
|
134,005
|
|
$
|
124,250
|
|
Earnings Per Share
|
|
|
|
|
|
|
|
|
|
|
|
|
|
Net income
|
|
$
|
5.14
|
|
$
|
3.60
|
|
$
|
9.98
|
|
$
|
8.51
|
|
Average number of shares outstanding
|
|
|
13,174
|
|
|
14,591
|
|
|
13,423
|
|
|
14,606
|
|
Diluted Earnings Per Share
|
|
|
|
|
|
|
|
|
|
|
|
|
|
Net income
|
|
$
|
5.13
|
|
$
|
3.57
|
|
$
|
9.97
|
|
$
|
8.43
|
|
Average number of shares outstanding
|
|
|
13,199
|
|
|
14,703
|
|
|
13,442
|
|
|
14,733
|
|
|
|
|
|
|
|
|
|
|
|
|
|
|
|
(aa) Selling, general and administrative ("SG&A") expenses comprise (in thousands):
|
|
|
|
|
|
|
|
|
|
|
|
|
|
|
|
|
|
Three Months Ended June 30,
|
|
Six Months Ended June 30,
|
|
|
|
2026
|
|
2025
|
|
2026
|
|
2025
|
|
SG&A expenses before long-term incentive compensation
|
|
|
|
|
|
|
|
|
|
|
|
|
|
and the impact of market value adjustments related to
|
|
|
|
|
|
|
|
|
|
|
|
|
|
deferred compensation plans
|
|
$
|
109,256
|
|
$
|
98,552
|
|
$
|
218,187
|
|
$
|
202,312
|
|
Market value adjustments related to deferred
|
|
|
|
|
|
|
|
|
|
|
|
|
|
compensation trusts
|
|
|
3,699
|
|
|
918
|
|
|
7,584
|
|
|
88
|
|
Long-term incentive compensation
|
|
|
2,248
|
|
|
853
|
|
|
3,753
|
|
|
3,510
|
|
Total SG&A expenses
|
|
$
|
115,203
|
|
$
|
100,323
|
|
$
|
229,524
|
|
$
|
205,910
|
|
|
|
|
|
|
|
|
|
|
|
|
|
|
|
(bb) Other income--net comprises (in thousands):
|
|
|
|
|
|
|
|
|
|
Three Months Ended June 30,
|
|
Six Months Ended June 30,
|
|
|
|
2026
|
|
2025
|
|
2026
|
|
2025
|
|
|
|
|
|
|
|
|
|
|
|
|
|
|
|
Market value adjustments related to deferred
|
|
|
|
|
|
|
|
|
|
|
|
|
|
compensation trusts
|
|
$
|
3,699
|
|
$
|
918
|
|
$
|
7,584
|
|
$
|
88
|
|
Interest income
|
|
|
214
|
|
|
2,555
|
|
|
1,104
|
|
|
4,631
|
|
Other
|
|
|
1
|
|
|
1
|
|
|
-
|
|
|
-
|
|
Total other income--net
|
|
$
|
3,914
|
|
$
|
3,474
|
|
$
|
8,688
|
|
$
|
4,719
|
|
|
|
|
|
|
|
|
|
CHEMED CORPORATION AND SUBSIDIARY COMPANIES
|
|
CONSOLIDATED BALANCE SHEETS
|
|
(in thousands, except per share data)(unaudited)
|
|
|
|
|
|
|
|
|
|
|
|
June 30,
|
|
|
|
2026
|
|
2025
|
|
Assets
|
|
|
|
|
|
|
|
Current assets
|
|
|
|
|
|
|
|
Cash and cash equivalents
|
|
$
|
40,222
|
|
$
|
249,904
|
|
Accounts receivable less allowances
|
|
|
188,634
|
|
|
184,880
|
|
Inventories
|
|
|
7,630
|
|
|
9,148
|
|
Prepaid income taxes
|
|
|
17,646
|
|
|
14,239
|
|
Prepaid expenses
|
|
|
37,103
|
|
|
33,206
|
|
Total current assets
|
|
|
291,235
|
|
|
491,377
|
|
Investments of deferred compensation plans held in trust
|
|
|
148,153
|
|
|
129,560
|
|
Properties and equipment, at cost less accumulated depreciation
|
|
|
208,499
|
|
|
202,281
|
|
Lease right of use asset
|
|
|
142,535
|
|
|
131,948
|
|
Identifiable intangible assets less accumulated amortization
|
|
|
78,601
|
|
|
87,360
|
|
Goodwill
|
|
|
699,398
|
|
|
666,996
|
|
Other assets
|
|
|
11,164
|
|
|
8,325
|
|
Total Assets
|
|
$
|
1,579,585
|
|
$
|
1,717,847
|
|
Liabilities
|
|
|
|
|
|
|
|
Current liabilities
|
|
|
|
|
|
|
|
Accounts payable
|
|
$
|
84,713
|
|
$
|
50,864
|
|
Accrued insurance
|
|
|
72,455
|
|
|
66,888
|
|
Accrued compensation
|
|
|
63,794
|
|
|
54,688
|
|
Short-term lease liability
|
|
|
41,277
|
|
|
43,700
|
|
Other current liabilities
|
|
|
57,607
|
|
|
47,746
|
|
Total current liabilities
|
|
|
319,846
|
|
|
263,886
|
|
Deferred income taxes
|
|
|
15,050
|
|
|
12,703
|
|
Deferred compensation liabilities
|
|
|
146,986
|
|
|
127,699
|
|
Long-term debt
|
|
|
140,000
|
|
|
-
|
|
Long-term lease liability
|
|
|
113,516
|
|
|
101,861
|
|
Other liabilities
|
|
|
13,677
|
|
|
13,213
|
|
Total Liabilities
|
|
|
749,075
|
|
|
519,362
|
|
Stockholders' Equity
|
|
|
|
|
|
|
|
Capital stock
|
|
|
37,613
|
|
|
37,593
|
|
Paid-in capital
|
|
|
1,617,125
|
|
|
1,576,165
|
|
Retained earnings
|
|
|
3,073,331
|
|
|
2,831,540
|
|
Treasury stock, at cost
|
|
|
(3,900,000)
|
|
|
(3,249,115)
|
|
Deferred compensation payable in Company stock
|
|
|
2,441
|
|
|
2,302
|
|
Total Stockholders' Equity
|
|
|
830,510
|
|
|
1,198,485
|
|
Total Liabilities and Stockholders' Equity
|
|
$
|
1,579,585
|
|
$
|
1,717,847
|
|
|
|
|
|
|
|
|
|
CHEMED CORPORATION AND SUBSIDIARY COMPANIES
|
|
CONSOLIDATED STATEMENTS OF CASH FLOWS
|
|
(in thousands)(unaudited)
|
|
|
|
|
|
|
|
|
|
|
|
For the Six Months Ended June 30,
|
|
|
|
2026
|
|
2025
|
|
Cash Flows from Operating Activities
|
|
|
|
|
|
|
|
Net income
|
|
$
|
134,005
|
|
$
|
124,250
|
|
Adjustments to reconcile net income to net cash provided
|
|
|
|
|
|
|
|
by operating activities:
|
|
|
|
|
|
|
|
Depreciation and amortization
|
|
|
33,859
|
|
|
32,277
|
|
Stock option expense
|
|
|
18,302
|
|
|
18,307
|
|
Benefit for deferred income taxes
|
|
|
(4,262)
|
|
|
(13,243)
|
|
Noncash long-term incentive compensation
|
|
|
3,633
|
|
|
3,273
|
|
Noncash directors' compensation
|
|
|
1,191
|
|
|
1,123
|
|
Legal settlements
|
|
|
548
|
|
|
-
|
|
Amortization of debt issuance costs
|
|
|
163
|
|
|
160
|
|
Changes in operating assets and liabilities, excluding
|
|
|
|
|
|
|
|
amounts acquired in business combinations:
|
|
|
|
|
|
|
|
Increase in accounts receivable
|
|
|
(6,716)
|
|
|
(13,466)
|
|
Increase in inventories
|
|
|
(87)
|
|
|
(955)
|
|
Increase in prepaid expenses
|
|
|
(10,285)
|
|
|
(7,232)
|
|
Increase/(decrease) in accounts payable and
|
|
|
|
|
|
|
|
other current liabilities
|
|
|
9,174
|
|
|
(12,449)
|
|
Change in current income taxes
|
|
|
(8,985)
|
|
|
(10,764)
|
|
Net change in lease assets and liabilities
|
|
|
292
|
|
|
(72)
|
|
(Increase)/decrease in other assets
|
|
|
(9,489)
|
|
|
48,426
|
|
Increase in other liabilities
|
|
|
11,191
|
|
|
1,521
|
|
Other sources
|
|
|
498
|
|
|
194
|
|
Net cash provided by operating activities
|
|
|
173,032
|
|
|
171,350
|
|
Cash Flows from Investing Activities
|
|
|
|
|
|
|
|
Business combinations, net of cash acquired
|
|
|
(33,540)
|
|
|
(225)
|
|
Capital expenditures
|
|
|
(32,639)
|
|
|
(29,088)
|
|
Proceeds from sale of fixed assets
|
|
|
422
|
|
|
480
|
|
Other uses
|
|
|
(270)
|
|
|
(322)
|
|
Net cash used by investing activities
|
|
|
(66,027)
|
|
|
(29,155)
|
|
Cash Flows from Financing Activities
|
|
|
|
|
|
|
|
Proceeds from revolving line of credit
|
|
|
491,480
|
|
|
-
|
|
Payments on revolving line of credit
|
|
|
(351,480)
|
|
|
-
|
|
Purchases of treasury stock
|
|
|
(287,521)
|
|
|
(76,168)
|
|
Change in cash overdrafts payable
|
|
|
23,305
|
|
|
309
|
|
Dividends paid
|
|
|
(16,049)
|
|
|
(14,542)
|
|
Proceeds from exercise of stock options
|
|
|
2,731
|
|
|
27,152
|
|
Capital stock surrendered to pay taxes on stock-based compensation
|
|
|
(1,482)
|
|
|
(8,484)
|
|
Debt issuance costs
|
|
|
(1,349)
|
|
|
-
|
|
Other (uses)/sources
|
|
|
(933)
|
|
|
1,092
|
|
Net cash used by financing activities
|
|
|
(141,298)
|
|
|
(70,641)
|
|
(Decrease)/increase in Cash and Cash Equivalents
|
|
|
(34,293)
|
|
|
71,554
|
|
Cash and cash equivalents at beginning of year
|
|
|
74,515
|
|
|
178,350
|
|
Cash and cash equivalents at end of period
|
|
$
|
40,222
|
|
$
|
249,904
|
|
|
|
|
|
|
|
|
|
|
|
|
|
|
|
CHEMED CORPORATION AND SUBSIDIARY COMPANIES
|
|
CONSOLIDATING STATEMENTS OF INCOME
|
|
FOR THE THREE MONTHS ENDED JUNE 30, 2026 AND 2025
|
|
(in thousands)(unaudited)
|
|
|
|
|
|
|
|
|
|
Chemed
|
|
|
|
VITAS
|
|
Roto-Rooter
|
|
Corporate
|
|
Consolidated
|
|
2026 (a)
|
|
|
|
|
|
|
|
|
|
|
|
|
|
Service revenues and sales
|
|
$
|
443,341
|
|
$
|
229,910
|
|
$
|
-
|
|
$
|
673,251
|
|
Cost of services provided and goods sold
|
|
|
337,691
|
|
|
114,089
|
|
|
-
|
|
|
451,780
|
|
Selling, general and administrative expenses
|
|
|
26,105
|
|
|
67,373
|
|
|
21,725
|
|
|
115,203
|
|
Depreciation
|
|
|
5,781
|
|
|
8,474
|
|
|
12
|
|
|
14,267
|
|
Amortization
|
|
|
27
|
|
|
2,692
|
|
|
-
|
|
|
2,719
|
|
Other operating expense
|
|
|
28
|
|
|
50
|
|
|
-
|
|
|
78
|
|
Total costs and expenses
|
|
|
369,632
|
|
|
192,678
|
|
|
21,737
|
|
|
584,047
|
|
Income/(loss) from operations
|
|
|
73,709
|
|
|
37,232
|
|
|
(21,737)
|
|
|
89,204
|
|
Interest expense
|
|
|
(54)
|
|
|
(185)
|
|
|
(1,550)
|
|
|
(1,789)
|
|
Intercompany interest income/(expense)
|
|
|
6,480
|
|
|
4,575
|
|
|
(11,055)
|
|
|
-
|
|
Other income—net
|
|
|
66
|
|
|
10
|
|
|
3,838
|
|
|
3,914
|
|
Income/(loss) before income taxes
|
|
|
80,201
|
|
|
41,632
|
|
|
(30,504)
|
|
|
91,329
|
|
Income taxes
|
|
|
(19,290)
|
|
|
(9,719)
|
|
|
5,383
|
|
|
(23,626)
|
|
Net income/(loss)
|
|
$
|
60,911
|
|
$
|
31,913
|
|
$
|
(25,121)
|
|
$
|
67,703
|
|
|
|
|
|
|
|
|
|
|
|
|
|
|
|
2025 (b)
|
|
|
|
|
|
|
|
|
|
|
|
|
|
Service revenues and sales
|
|
$
|
396,201
|
|
$
|
222,597
|
|
$
|
-
|
|
$
|
618,798
|
|
Cost of services provided and goods sold
|
|
|
320,644
|
|
|
113,461
|
|
|
-
|
|
|
434,105
|
|
Selling, general and administrative expenses
|
|
|
25,085
|
|
|
60,536
|
|
|
14,702
|
|
|
100,323
|
|
Depreciation
|
|
|
5,314
|
|
|
8,363
|
|
|
12
|
|
|
13,689
|
|
Amortization
|
|
|
26
|
|
|
2,545
|
|
|
-
|
|
|
2,571
|
|
Other operating expense/(income)
|
|
|
55
|
|
|
(29)
|
|
|
-
|
|
|
26
|
|
Total costs and expenses
|
|
|
351,124
|
|
|
184,876
|
|
|
14,714
|
|
|
550,714
|
|
Income/(loss) from operations
|
|
|
45,077
|
|
|
37,721
|
|
|
(14,714)
|
|
|
68,084
|
|
Interest expense
|
|
|
(47)
|
|
|
(129)
|
|
|
(267)
|
|
|
(443)
|
|
Intercompany interest income/(expense)
|
|
|
5,454
|
|
|
3,970
|
|
|
(9,424)
|
|
|
-
|
|
Other income—net
|
|
|
61
|
|
|
23
|
|
|
3,390
|
|
|
3,474
|
|
Income/(loss) before income taxes
|
|
|
50,545
|
|
|
41,585
|
|
|
(21,015)
|
|
|
71,115
|
|
Income taxes
|
|
|
(12,326)
|
|
|
(9,671)
|
|
|
3,375
|
|
|
(18,622)
|
|
Net income/(loss)
|
|
$
|
38,219
|
|
$
|
31,914
|
|
$
|
(17,640)
|
|
$
|
52,493
|
|
|
|
|
|
|
|
|
|
|
|
|
|
|
|
|
|
|
|
|
|
|
|
|
|
|
|
|
|
The "Footnotes to Financial Statements" are integral parts of this financial information.
|
|
|
|
|
|
|
|
|
|
|
|
|
|
|
|
CHEMED CORPORATION AND SUBSIDIARY COMPANIES
|
|
CONSOLIDATING STATEMENTS OF INCOME
|
|
FOR THE SIX MONTHS ENDED JUNE 30, 2026 AND 2025
|
|
(in thousands)(unaudited)
|
|
|
|
|
|
|
|
|
|
|
|
|
|
|
|
|
|
|
|
|
Chemed
|
|
|
|
VITAS
|
|
Roto-Rooter
|
|
Corporate
|
|
Consolidated
|
|
2026 (a)
|
|
|
|
|
|
|
|
|
|
|
|
|
|
Service revenues and sales
|
|
$
|
863,358
|
|
$
|
467,406
|
|
$
|
-
|
|
$
|
1,330,764
|
|
Cost of services provided and goods sold
|
|
|
663,157
|
|
|
230,372
|
|
|
-
|
|
|
893,529
|
|
Selling, general and administrative expenses
|
|
|
52,213
|
|
|
135,302
|
|
|
42,009
|
|
|
229,524
|
|
Depreciation
|
|
|
11,693
|
|
|
16,853
|
|
|
24
|
|
|
28,570
|
|
Amortization
|
|
|
53
|
|
|
5,236
|
|
|
-
|
|
|
5,289
|
|
Other operating expense/(income)
|
|
|
80
|
|
|
(9)
|
|
|
(1)
|
|
|
70
|
|
Total costs and expenses
|
|
|
727,196
|
|
|
387,754
|
|
|
42,032
|
|
|
1,156,982
|
|
Income/(loss) from operations
|
|
|
136,162
|
|
|
79,652
|
|
|
(42,032)
|
|
|
173,782
|
|
Interest expense
|
|
|
(104)
|
|
|
(321)
|
|
|
(1,876)
|
|
|
(2,301)
|
|
Intercompany interest income/(expense)
|
|
|
12,717
|
|
|
9,088
|
|
|
(21,805)
|
|
|
-
|
|
Other income—net
|
|
|
161
|
|
|
25
|
|
|
8,502
|
|
|
8,688
|
|
Income/(loss) before income taxes
|
|
|
148,936
|
|
|
88,444
|
|
|
(57,211)
|
|
|
180,169
|
|
Income taxes
|
|
|
(35,818)
|
|
|
(20,747)
|
|
|
10,401
|
|
|
(46,164)
|
|
Net income/(loss)
|
|
$
|
113,118
|
|
$
|
67,697
|
|
$
|
(46,810)
|
|
$
|
134,005
|
|
|
|
|
|
|
|
|
|
|
|
|
|
|
|
2025 (b)
|
|
|
|
|
|
|
|
|
|
|
|
|
|
Service revenues and sales
|
|
$
|
803,600
|
|
$
|
462,141
|
|
$
|
-
|
|
$
|
1,265,741
|
|
Cost of services provided and goods sold
|
|
|
633,451
|
|
|
231,184
|
|
|
-
|
|
|
864,635
|
|
Selling, general and administrative expenses
|
|
|
51,624
|
|
|
123,184
|
|
|
31,102
|
|
|
205,910
|
|
Depreciation
|
|
|
10,509
|
|
|
16,601
|
|
|
24
|
|
|
27,134
|
|
Amortization
|
|
|
52
|
|
|
5,091
|
|
|
-
|
|
|
5,143
|
|
Other operating expense/(income)
|
|
|
119
|
|
|
(42)
|
|
|
-
|
|
|
77
|
|
Total costs and expenses
|
|
|
695,755
|
|
|
376,018
|
|
|
31,126
|
|
|
1,102,899
|
|
Income/(loss) from operations
|
|
|
107,845
|
|
|
86,123
|
|
|
(31,126)
|
|
|
162,842
|
|
Interest expense
|
|
|
(95)
|
|
|
(261)
|
|
|
(416)
|
|
|
(772)
|
|
Intercompany interest income/(expense)
|
|
|
10,750
|
|
|
7,900
|
|
|
(18,650)
|
|
|
-
|
|
Other income—net
|
|
|
110
|
|
|
32
|
|
|
4,577
|
|
|
4,719
|
|
Income/(loss) before income taxes
|
|
|
118,610
|
|
|
93,794
|
|
|
(45,615)
|
|
|
166,789
|
|
Income taxes
|
|
|
(30,361)
|
|
|
(21,936)
|
|
|
9,758
|
|
|
(42,539)
|
|
Net income/(loss)
|
|
$
|
88,249
|
|
$
|
71,858
|
|
$
|
(35,857)
|
|
$
|
124,250
|
|
|
|
|
|
|
|
|
|
|
|
|
|
|
|
|
|
|
|
|
|
|
|
|
|
|
|
|
|
The "Footnotes to Financial Statements" are integral parts of this financial information.
|
|
|
|
|
|
|
|
|
|
|
|
|
|
|
|
CHEMED CORPORATION AND SUBSIDIARY COMPANIES
|
|
CONSOLIDATING SUMMARIES OF EBITDA
|
|
FOR THREE MONTHS ENDED JUNE 30, 2026 AND 2025
|
|
(in thousands)(unaudited)
|
|
|
|
|
|
|
|
|
|
Chemed
|
|
|
|
VITAS
|
|
Roto-Rooter
|
|
Corporate
|
|
Consolidated
|
|
2026
|
|
|
|
|
|
|
|
|
|
|
|
|
|
Net income/(loss)
|
|
$
|
60,911
|
|
$
|
31,913
|
|
$
|
(25,121)
|
|
$
|
67,703
|
|
Add/(deduct):
|
|
|
|
|
|
|
|
|
|
|
|
|
|
Interest expense
|
|
|
54
|
|
|
185
|
|
|
1,550
|
|
|
1,789
|
|
Income taxes
|
|
|
19,290
|
|
|
9,719
|
|
|
(5,383)
|
|
|
23,626
|
|
Depreciation
|
|
|
5,781
|
|
|
8,474
|
|
|
12
|
|
|
14,267
|
|
Amortization
|
|
|
27
|
|
|
2,692
|
|
|
-
|
|
|
2,719
|
|
EBITDA
|
|
|
86,063
|
|
|
52,983
|
|
|
(28,942)
|
|
|
110,104
|
|
Add/(deduct):
|
|
|
|
|
|
|
|
|
|
|
|
|
|
Intercompany interest expense/(income)
|
|
|
(6,480)
|
|
|
(4,575)
|
|
|
11,055
|
|
|
-
|
|
Interest income
|
|
|
(66)
|
|
|
(10)
|
|
|
(138)
|
|
|
(214)
|
|
Stock option expense
|
|
|
-
|
|
|
-
|
|
|
9,052
|
|
|
9,052
|
|
Long-term incentive compensation
|
|
|
-
|
|
|
-
|
|
|
2,248
|
|
|
2,248
|
|
Legal settlements
|
|
|
548
|
|
|
-
|
|
|
-
|
|
|
548
|
|
Acquisition expense
|
|
|
8
|
|
|
60
|
|
|
-
|
|
|
68
|
|
Adjusted EBITDA
|
|
$
|
80,073
|
|
$
|
48,458
|
|
$
|
(6,725)
|
|
$
|
121,806
|
|
|
|
|
|
|
|
|
|
|
|
|
|
|
|
2025
|
|
|
|
|
|
|
|
|
|
|
|
|
|
Net income/(loss)
|
|
$
|
38,219
|
|
$
|
31,914
|
|
$
|
(17,640)
|
|
$
|
52,493
|
|
Add/(deduct):
|
|
|
|
|
|
|
|
|
|
|
|
|
|
Interest expense
|
|
|
47
|
|
|
129
|
|
|
267
|
|
|
443
|
|
Income taxes
|
|
|
12,326
|
|
|
9,671
|
|
|
(3,375)
|
|
|
18,622
|
|
Depreciation
|
|
|
5,314
|
|
|
8,363
|
|
|
12
|
|
|
13,689
|
|
Amortization
|
|
|
26
|
|
|
2,545
|
|
|
-
|
|
|
2,571
|
|
EBITDA
|
|
|
55,932
|
|
|
52,622
|
|
|
(20,736)
|
|
|
87,818
|
|
Add/(deduct):
|
|
|
|
|
|
|
|
|
|
|
|
|
|
Intercompany interest expense/(income)
|
|
|
(5,454)
|
|
|
(3,970)
|
|
|
9,424
|
|
|
-
|
|
Interest income
|
|
|
(61)
|
|
|
(23)
|
|
|
(2,472)
|
|
|
(2,556)
|
|
Stock option expense
|
|
|
-
|
|
|
-
|
|
|
9,216
|
|
|
9,216
|
|
Long-term incentive compensation
|
|
|
-
|
|
|
-
|
|
|
853
|
|
|
853
|
|
Adjusted EBITDA
|
|
$
|
50,417
|
|
$
|
48,629
|
|
$
|
(3,715)
|
|
$
|
95,331
|
|
|
|
|
|
|
|
|
|
|
|
|
|
|
|
The "Footnotes to Financial Statements" are integral parts of this financial information.
|
|
|
|
|
|
|
|
|
|
|
|
|
|
|
|
CHEMED CORPORATION AND SUBSIDIARY COMPANIES
|
|
CONSOLIDATING SUMMARIES OF EBITDA
|
|
FOR THE SIX MONTHS ENDED JUNE 30, 2026 AND 2025
|
|
(in thousands)(unaudited)
|
|
|
|
|
|
|
|
|
|
|
|
|
Chemed
|
|
|
|
VITAS
|
|
Roto-Rooter
|
|
Corporate
|
|
Consolidated
|
|
2026
|
|
|
|
|
|
|
|
|
|
|
|
|
|
Net income/(loss)
|
|
$
|
113,118
|
|
$
|
67,697
|
|
$
|
(46,810)
|
|
$
|
134,005
|
|
Add/(deduct):
|
|
|
|
|
|
|
|
|
|
|
|
|
|
Interest expense
|
|
|
104
|
|
|
321
|
|
|
1,876
|
|
|
2,301
|
|
Income taxes
|
|
|
35,818
|
|
|
20,747
|
|
|
(10,401)
|
|
|
46,164
|
|
Depreciation
|
|
|
11,693
|
|
|
16,853
|
|
|
24
|
|
|
28,570
|
|
Amortization
|
|
|
53
|
|
|
5,236
|
|
|
-
|
|
|
5,289
|
|
EBITDA
|
|
|
160,786
|
|
|
110,854
|
|
|
(55,311)
|
|
|
216,329
|
|
Add/(deduct):
|
|
|
|
|
|
|
|
|
|
|
|
|
|
Intercompany interest expense/(income)
|
|
|
(12,717)
|
|
|
(9,088)
|
|
|
21,805
|
|
|
-
|
|
Interest income
|
|
|
(162)
|
|
|
(25)
|
|
|
(917)
|
|
|
(1,104)
|
|
Stock option expense
|
|
|
-
|
|
|
-
|
|
|
18,302
|
|
|
18,302
|
|
Long-term incentive compensation
|
|
|
-
|
|
|
-
|
|
|
3,753
|
|
|
3,753
|
|
Legal settlements
|
|
|
548
|
|
|
-
|
|
|
-
|
|
|
548
|
|
Acquisition expense
|
|
|
8
|
|
|
226
|
|
|
-
|
|
|
234
|
|
Adjusted EBITDA
|
|
$
|
148,463
|
|
$
|
101,967
|
|
$
|
(12,368)
|
|
$
|
238,062
|
|
2025
|
|
|
|
|
|
|
|
|
|
|
|
|
|
Net income/(loss)
|
|
$
|
88,249
|
|
$
|
71,858
|
|
$
|
(35,857)
|
|
$
|
124,250
|
|
Add/(deduct):
|
|
|
|
|
|
|
|
|
|
|
|
|
|
Interest expense
|
|
|
95
|
|
|
261
|
|
|
416
|
|
|
772
|
|
Income taxes
|
|
|
30,361
|
|
|
21,936
|
|
|
(9,758)
|
|
|
42,539
|
|
Depreciation
|
|
|
10,509
|
|
|
16,601
|
|
|
24
|
|
|
27,134
|
|
Amortization
|
|
|
52
|
|
|
5,091
|
|
|
-
|
|
|
5,143
|
|
EBITDA
|
|
|
129,266
|
|
|
115,747
|
|
|
(45,175)
|
|
|
199,838
|
|
Add/(deduct):
|
|
|
|
|
|
|
|
|
|
|
|
|
|
Intercompany interest expense/(income)
|
|
|
(10,750)
|
|
|
(7,900)
|
|
|
18,650
|
|
|
-
|
|
Interest income
|
|
|
(110)
|
|
|
(33)
|
|
|
(4,489)
|
|
|
(4,632)
|
|
Stock option expense
|
|
|
-
|
|
|
-
|
|
|
18,307
|
|
|
18,307
|
|
Long-term incentive compensation
|
|
|
-
|
|
|
-
|
|
|
3,510
|
|
|
3,510
|
|
Adjusted EBITDA
|
|
$
|
118,406
|
|
$
|
107,814
|
|
$
|
(9,197)
|
|
$
|
217,023
|
|
|
|
|
|
|
|
|
|
|
|
|
|
|
|
The "Footnotes to Financial Statements" are integral parts of this financial information.
|
|
|
|
|
|
|
|
|
|
|
|
CHEMED CORPORATION AND SUBSIDIARY COMPANIES
|
|
RECONCILIATION OF ADJUSTED NET INCOME
|
|
(in thousands, except per share data)(unaudited)
|
|
|
|
|
|
|
|
|
|
|
|
|
|
|
|
|
|
|
|
|
|
|
|
Three Months Ended June 30,
|
|
Six Months Ended June 30,
|
|
|
|
2026
|
|
2025
|
|
2026
|
|
2025
|
|
Net income as reported
|
|
$
|
67,703
|
|
$
|
52,493
|
|
$
|
134,005
|
|
$
|
124,250
|
|
Add/(deduct) pre-tax cost of:
|
|
|
|
|
|
|
|
|
|
|
|
|
|
Stock option expense
|
|
|
9,052
|
|
|
9,216
|
|
|
18,302
|
|
|
18,307
|
|
Amortization of reacquired franchise rights
|
|
|
2,352
|
|
|
2,352
|
|
|
4,704
|
|
|
4,704
|
|
Long-term incentive compensation
|
|
|
2,248
|
|
|
853
|
|
|
3,753
|
|
|
3,510
|
|
Legal settlements
|
|
|
548
|
|
|
-
|
|
|
548
|
|
|
-
|
|
Acquisition expense
|
|
|
68
|
|
|
-
|
|
|
234
|
|
|
-
|
|
Add/(deduct) tax impacts:
|
|
|
|
|
|
|
|
|
|
|
|
|
|
Tax impact of the above pre-tax adjustments (1)
|
|
|
(2,377)
|
|
|
(2,143)
|
|
|
(4,626)
|
|
|
(4,462)
|
|
Excess tax expenses/(benefits) on stock compensation
|
|
|
445
|
|
|
(50)
|
|
|
501
|
|
|
(513)
|
|
Adjusted net income
|
|
$
|
80,039
|
|
$
|
62,721
|
|
$
|
157,421
|
|
$
|
145,796
|
|
|
|
|
|
|
|
|
|
|
|
|
|
|
|
Diluted Earnings Per Share As Reported
|
|
|
|
|
|
|
|
|
|
|
|
|
|
Net income
|
|
$
|
5.13
|
|
$
|
3.57
|
|
$
|
9.97
|
|
$
|
8.43
|
|
Average number of shares outstanding
|
|
|
13,199
|
|
|
14,703
|
|
|
13,442
|
|
|
14,733
|
|
|
|
|
|
|
|
|
|
|
|
|
|
|
|
Adjusted Diluted Earnings Per Share
|
|
|
|
|
|
|
|
|
|
|
|
|
|
Adjusted net income
|
|
$
|
6.06
|
|
$
|
4.27
|
|
$
|
11.71
|
|
$
|
9.90
|
|
Average number of shares outstanding
|
|
|
13,199
|
|
|
14,703
|
|
|
13,442
|
|
|
14,733
|
|
|
|
|
|
|
|
|
|
|
|
|
|
|
|
(1) The tax impact of pre-tax adjustments was calculated using the effective tax rate of the operating unit for which each adjustment is associated.
|
|
|
|
|
|
|
|
|
|
|
|
|
|
|
|
The "Footnotes to Financial Statements" are integral parts of this financial information.
|
|
|
|
|
|
|
|
|
|
|
|
|
|
|
|
|
CHEMED CORPORATION AND SUBSIDIARY COMPANIES
|
|
OPERATING STATISTICS FOR VITAS SEGMENT
|
|
(unaudited)
|
|
|
Three Months Ended June 30,
|
|
|
For the Six Months Ended June 30,
|
|
|
OPERATING STATISTICS
|
2026
|
|
2025
|
|
|
2026
|
|
2025
|
|
|
Net revenue ($000) (c)
|
|
|
|
|
|
|
|
|
|
|
|
|
|
|
Homecare
|
$
|
391,348
|
|
$
|
358,042
|
|
|
$
|
762,438
|
|
$
|
709,608
|
|
|
Inpatient
|
|
35,673
|
|
|
33,023
|
|
|
|
71,599
|
|
|
67,045
|
|
|
Continuous care
|
|
19,396
|
|
|
23,640
|
|
|
|
37,530
|
|
|
48,276
|
|
|
Other
|
|
6,206
|
|
|
5,747
|
|
|
|
11,783
|
|
|
11,092
|
|
|
Subtotal
|
$
|
452,623
|
|
$
|
420,452
|
|
|
$
|
883,350
|
|
$
|
836,021
|
|
|
Room and board, net
|
|
(3,938)
|
|
|
(3,892)
|
|
|
|
(7,196)
|
|
|
(7,417)
|
|
|
Contractual allowances
|
|
(4,844)
|
|
|
(3,984)
|
|
|
|
(9,921)
|
|
|
(6,304)
|
|
|
Medicare cap allowance
|
|
(500)
|
|
|
(16,375)
|
|
|
|
(2,875)
|
|
|
(18,700)
|
|
|
Net Revenue
|
$
|
443,341
|
|
$
|
396,201
|
|
|
$
|
863,358
|
|
$
|
803,600
|
|
|
Net revenue as a percent of total before Medicare cap allowance
|
|
|
|
|
|
|
|
|
|
|
|
|
|
|
Homecare
|
|
86.5
|
%
|
|
85.2
|
%
|
|
|
86.4
|
%
|
|
84.9
|
%
|
|
Inpatient
|
|
7.9
|
|
|
7.9
|
|
|
|
8.1
|
|
|
8.0
|
|
|
Continuous care
|
|
4.3
|
|
|
5.6
|
|
|
|
4.2
|
|
|
5.8
|
|
|
Other
|
|
1.3
|
|
|
1.3
|
|
|
|
1.3
|
|
|
1.3
|
|
|
Subtotal
|
|
100.0
|
|
|
100.0
|
|
|
|
100.0
|
|
|
100.0
|
|
|
Room and board, net
|
|
(0.9)
|
|
|
(0.9)
|
|
|
|
(0.9)
|
|
|
(0.9)
|
|
|
Contractual allowances
|
|
(1.1)
|
|
|
(0.9)
|
|
|
|
(1.1)
|
|
|
(0.8)
|
|
|
Medicare cap allowance
|
|
(0.1)
|
|
|
(3.9)
|
|
|
|
(0.3)
|
|
|
(2.2)
|
|
|
Net Revenue
|
|
97.9
|
%
|
|
94.3
|
%
|
|
|
97.7
|
%
|
|
96.1
|
%
|
|
Days of care
|
|
|
|
|
|
|
|
|
|
|
|
|
|
|
Homecare
|
|
1,792,360
|
|
|
1,662,455
|
|
|
|
3,483,979
|
|
|
3,295,024
|
|
|
Nursing home
|
|
303,053
|
|
|
307,158
|
|
|
|
597,871
|
|
|
614,266
|
|
|
Respite
|
|
12,307
|
|
|
11,440
|
|
|
|
23,182
|
|
|
21,435
|
|
|
Subtotal routine homecare and respite
|
|
2,107,720
|
|
|
1,981,053
|
|
|
|
4,105,032
|
|
|
3,930,725
|
|
|
Inpatient
|
|
29,703
|
|
|
28,213
|
|
|
|
60,177
|
|
|
57,917
|
|
|
Continuous care
|
|
18,094
|
|
|
21,647
|
|
|
|
35,382
|
|
|
44,267
|
|
|
Total
|
|
2,155,517
|
|
|
2,030,913
|
|
|
|
4,200,591
|
|
|
4,032,909
|
|
|
|
|
|
|
|
|
|
|
|
|
|
|
|
|
|
Number of days in relevant time period
|
|
91
|
|
|
91
|
|
|
|
181
|
|
|
181
|
|
|
Average daily census ("ADC") (days)
|
|
|
|
|
|
|
|
|
|
|
|
|
|
|
Homecare
|
|
19,697
|
|
|
18,269
|
|
|
|
19,249
|
|
|
18,205
|
|
|
Nursing home
|
|
3,330
|
|
|
3,375
|
|
|
|
3,303
|
|
|
3,394
|
|
|
Respite
|
|
135
|
|
|
126
|
|
|
|
128
|
|
|
118
|
|
|
Subtotal routine homecare and respite
|
|
23,162
|
|
|
21,770
|
|
|
|
22,680
|
|
|
21,717
|
|
|
Inpatient
|
|
326
|
|
|
310
|
|
|
|
333
|
|
|
320
|
|
|
Continuous care
|
|
199
|
|
|
238
|
|
|
|
195
|
|
|
244
|
|
|
Total
|
|
23,687
|
|
|
22,318
|
|
|
|
23,208
|
|
|
22,281
|
|
|
|
|
|
|
|
|
|
|
|
|
|
|
|
|
|
Total Admissions
|
|
19,125
|
|
|
17,545
|
|
|
|
38,519
|
|
|
35,684
|
|
|
Total Discharges
|
|
18,167
|
|
|
17,845
|
|
|
|
36,704
|
|
|
35,583
|
|
|
Average length of stay (days)
|
|
101.2
|
|
|
137.1
|
|
|
|
101.9
|
|
|
127.9
|
|
|
Median length of stay (days)
|
|
16.0
|
|
|
20.0
|
|
|
|
15.0
|
|
|
18.0
|
|
|
|
|
|
|
|
|
|
|
|
|
|
|
|
|
|
ADC by major diagnosis
|
|
|
|
|
|
|
|
|
|
|
|
|
|
|
Cerebro
|
|
44.2
|
%
|
|
44.4
|
%
|
|
|
44.4
|
%
|
|
44.6
|
%
|
|
Neurological
|
|
11.1
|
|
|
12.1
|
|
|
|
11.2
|
|
|
12.2
|
|
|
Cancer
|
|
9.5
|
|
|
9.7
|
|
|
|
9.5
|
|
|
9.6
|
|
|
Cardio
|
|
16.6
|
|
|
16.2
|
|
|
|
16.5
|
|
|
16.1
|
|
|
Respiratory
|
|
8.0
|
|
|
7.5
|
|
|
|
7.8
|
|
|
7.3
|
|
|
Other
|
|
10.6
|
|
|
10.1
|
|
|
|
10.6
|
|
|
10.2
|
|
|
Total
|
|
100.0
|
%
|
|
100.0
|
%
|
|
|
100.0
|
%
|
|
100.0
|
%
|
|
Admissions by major diagnosis
|
|
|
|
|
|
|
|
|
|
|
|
|
|
|
Cerebro
|
|
27.3
|
%
|
|
26.7
|
%
|
|
|
27.1
|
%
|
|
27.6
|
%
|
|
Neurological
|
|
7.1
|
|
|
7.2
|
|
|
|
7.0
|
|
|
6.8
|
|
|
Cancer
|
|
24.7
|
|
|
26.6
|
|
|
|
24.1
|
|
|
25.6
|
|
|
Cardio
|
|
15.2
|
|
|
14.9
|
|
|
|
15.5
|
|
|
15.0
|
|
|
Respiratory
|
|
11.8
|
|
|
10.7
|
|
|
|
12.1
|
|
|
11.1
|
|
|
Other
|
|
13.9
|
|
|
13.9
|
|
|
|
14.2
|
|
|
13.9
|
|
|
Total
|
|
100.0
|
%
|
|
100.0
|
%
|
|
|
100.0
|
%
|
|
100.0
|
%
|
|
|
|
|
|
|
|
|
|
|
|
|
|
|
|
|
Estimated uncollectible accounts as a percent of revenues
|
|
0.7
|
%
|
|
1.0
|
%
|
|
|
1.1
|
%
|
|
0.8
|
%
|
|
|
|
|
|
|
|
|
|
|
|
|
|
|
|
|
Accounts receivable --
|
|
|
|
|
|
|
|
|
|
|
|
|
|
|
Days of revenue outstanding-excluding unapplied Medicare payments
|
39.7
|
|
|
37.5
|
|
|
|
n.a.
|
|
|
n.a.
|
|
|
Days of revenue outstanding-including unapplied Medicare payments
|
26.9
|
|
|
26.9
|
|
|
|
n.a.
|
|
|
n.a.
|
|
|
|
|
|
|
|
|
|
|
|
|
|
|
|
|
|
CHEMED CORPORATION AND SUBSIDIARY COMPANIES
|
|
FOOTNOTES TO FINANCIAL STATEMENTS
|
|
FOR THE THREE AND SIX MONTHS ENDED JUNE 30, 2026 AND 2025
|
|
(unaudited)
|
|
|
|
|
|
|
|
|
|
|
|
|
|
|
|
|
(a)
|
Included in the results of operations for 2026 are the following significant credits/(charges) which may not be indicative of ongoing operations
|
|
|
(in thousands):
|
|
|
|
|
|
|
|
|
|
|
|
|
|
|
|
|
Three Months Ended June 30, 2026
|
|
|
|
|
VITAS
|
|
Roto-Rooter
|
|
Corporate
|
|
Consolidated
|
|
|
|
|
|
|
|
|
|
|
|
|
|
|
|
|
|
Stock option expense
|
|
$
|
-
|
|
$
|
-
|
|
$
|
(9,052)
|
|
$
|
(9,052)
|
|
|
Amortization of reacquired franchise agreements
|
|
|
-
|
|
|
(2,352)
|
|
|
-
|
|
|
(2,352)
|
|
|
Long-term incentive compensation
|
|
|
-
|
|
|
-
|
|
|
(2,248)
|
|
|
(2,248)
|
|
|
Legal expense
|
|
|
(548)
|
|
|
-
|
|
|
-
|
|
|
(548)
|
|
|
Acquisition expense
|
|
|
(8)
|
|
|
(60)
|
|
|
-
|
|
|
(68)
|
|
|
Pretax impact on earnings
|
|
|
(556)
|
|
|
(2,412)
|
|
|
(11,300)
|
|
|
(14,268)
|
|
|
Excess tax expenses on stock compensation
|
|
|
-
|
|
|
-
|
|
|
(445)
|
|
|
(445)
|
|
|
Income tax benefit on the above
|
|
|
135
|
|
|
562
|
|
|
1,680
|
|
|
2,377
|
|
|
After-tax impact on earnings
|
|
$
|
(421)
|
|
$
|
(1,850)
|
|
$
|
(10,065)
|
|
$
|
(12,336)
|
|
|
|
|
|
|
|
|
|
|
|
|
|
|
|
|
|
|
|
Six Months Ended June 30, 2026
|
|
|
|
|
VITAS
|
|
Roto-Rooter
|
|
Corporate
|
|
Consolidated
|
|
|
|
|
|
|
|
|
|
|
|
|
|
|
|
|
|
Stock option expense
|
|
$
|
-
|
|
$
|
-
|
|
$
|
(18,302)
|
|
$
|
(18,302)
|
|
|
Amortization of reacquired franchise agreements
|
|
|
-
|
|
|
(4,704)
|
|
|
-
|
|
|
(4,704)
|
|
|
Long-term incentive compensation
|
|
|
-
|
|
|
-
|
|
|
(3,753)
|
|
|
(3,753)
|
|
|
Legal settlements
|
|
|
(548)
|
|
|
-
|
|
|
-
|
|
|
(548)
|
|
|
Acquisition expense
|
|
|
(8)
|
|
|
(226)
|
|
|
-
|
|
|
(234)
|
|
|
Pretax impact on earnings
|
|
|
(556)
|
|
|
(4,930)
|
|
|
(22,055)
|
|
|
(27,541)
|
|
|
Excess tax expenses on stock compensation
|
|
|
-
|
|
|
-
|
|
|
(501)
|
|
|
(501)
|
|
|
Income tax benefit on the above
|
|
|
135
|
|
|
1,149
|
|
|
3,342
|
|
|
4,626
|
|
|
After-tax impact on earnings
|
|
$
|
(421)
|
|
$
|
(3,781)
|
|
$
|
(19,214)
|
|
$
|
(23,416)
|
|
|
|
|
|
|
|
|
|
|
|
|
|
|
|
|
(b)
|
Included in the results of operations for 2025 are the following significant credits/(charges) which may not be indicative of ongoing operations
|
|
|
(in thousands):
|
|
|
|
|
|
|
|
|
|
|
|
|
|
|
|
|
Three Months Ended June 30, 2025
|
|
|
|
|
VITAS
|
|
Roto-Rooter
|
|
Corporate
|
|
Consolidated
|
|
|
|
|
|
|
|
|
|
|
|
|
|
|
|
|
|
Stock option expense
|
|
$
|
-
|
|
$
|
-
|
|
$
|
(9,216)
|
|
$
|
(9,216)
|
|
|
Amortization of reacquired franchise agreements
|
|
|
-
|
|
|
(2,352)
|
|
|
-
|
|
|
(2,352)
|
|
|
Long-term incentive compensation
|
|
|
-
|
|
|
-
|
|
|
(853)
|
|
|
(853)
|
|
|
Pretax impact on earnings
|
|
|
-
|
|
|
(2,352)
|
|
|
(10,069)
|
|
|
(12,421)
|
|
|
Excess tax benefits on stock compensation
|
|
|
-
|
|
|
-
|
|
|
50
|
|
|
50
|
|
|
Income tax benefit on the above
|
|
|
-
|
|
|
546
|
|
|
1,597
|
|
|
2,143
|
|
|
After-tax impact on earnings
|
|
$
|
-
|
|
$
|
(1,806)
|
|
$
|
(8,422)
|
|
$
|
(10,228)
|
|
|
|
|
|
|
|
|
|
|
|
|
|
|
|
|
|
|
|
Six Months Ended June 30, 2025
|
|
|
|
|
VITAS
|
|
Roto-Rooter
|
|
Corporate
|
|
Consolidated
|
|
|
|
|
|
|
|
|
|
|
|
|
|
|
|
|
|
Stock option expense
|
|
$
|
-
|
|
$
|
-
|
|
$
|
(18,307)
|
|
$
|
(18,307)
|
|
|
Amortization of reacquired franchise agreements
|
|
|
-
|
|
|
(4,704)
|
|
|
-
|
|
|
(4,704)
|
|
|
Long-term incentive compensation
|
|
|
-
|
|
|
-
|
|
|
(3,510)
|
|
|
(3,510)
|
|
|
Pretax impact on earnings
|
|
|
-
|
|
|
(4,704)
|
|
|
(21,817)
|
|
|
(26,521)
|
|
|
Excess tax benefits on stock compensation
|
|
|
-
|
|
|
-
|
|
|
513
|
|
|
513
|
|
|
Income tax benefit on the above
|
|
|
-
|
|
|
1,091
|
|
|
3,371
|
|
|
4,462
|
|
|
After-tax impact on earnings
|
|
$
|
-
|
|
$
|
(3,613)
|
|
$
|
(17,933)
|
|
$
|
(21,546)
|
|
|
|
|
|
|
|
|
|
|
|
|
|
|
|
|
|
|
|
|
|
|
|
|
|
|
|
|
|
|
|
(c)
|
VITAS has 13 large (greater than 450 ADC), 24 medium (greater than 200 but less than 450 ADC) and 23 small (less than 200 ADC) hospice programs. Of Vitas' 33 Medicare provider numbers, for the current cap year, 22 provider numbers have a Medicare cap cushion of greater than 10%, seven provider numbers have a Medicare cap cushion between 0% and 10%, and four provider numbers have a Medicare cap liability.
|