
Second Quarter 2026 Earnings July 28, 2026 Chris Cartwright, President and CEO Todd Cello, CFO Exhibit 99.2
2© 2026 TransUnion, its subsidiaries and/or affiliates. All Rights Reserved. Non-GAAP Financial InformationForward-Looking Statements This investor presentation contains forward-looking statements within the meaning of the Private Securities Litigation Reform Act of 1995. These statements are based on the current beliefs and expectations of TransUnion’s management and are subject to significant risks and uncertainties. Actual results may differ materially from those described in the forward-looking statements. Factors that could cause TransUnion’s actual results to differ materially from those described in the forward-looking statements include: macroeconomic effects and changes in market conditions, including the impact of tariffs, inflation, risk of recession, trade policy, and industry trends and adverse developments in the debt, consumer credit and financial services markets, including the impact on the carrying value of our assets in all of the markets where we operate; ongoing conflict in the Middle East; our ability to provide competitive services and prices; our ability to retain or renew existing agreements with large or long-term customers; our ability to maintain the security and integrity of our data; our ability to deliver services timely without interruption; uncertainty related to FICO’s new Mortgage Direct License Program; our ability to maintain our access to data sources; government regulation and changes in the regulatory environment; litigation or regulatory proceedings; our approach to the use of artificial intelligence; our ability to effectively manage our costs; our ability to maintain effective internal control over financial reporting or disclosure controls and procedures; economic and political stability in the United States and risks associated with the international markets where we operate; our ability to effectively develop and maintain strategic alliances and joint ventures; our ability to timely develop new services and the market’s willingness to adopt our new services; our ability to manage and expand our operations and keep up with rapidly changing technologies; our ability to acquire businesses, successfully secure financing for our acquisitions, timely consummate our acquisitions, successfully integrate the operations of our acquisitions, control the costs of integrating our acquisitions and realize the intended benefits of such acquisitions; our ability to protect and enforce our intellectual property, trade secrets and other forms of unpatented intellectual property; our ability to defend our intellectual property from infringement claims by third parties; the ability of our outside service providers and key vendors to fulfill their obligations to us; further consolidation in our end-customer markets; the increased availability of free or inexpensive consumer information; losses against which we do not insure; our ability to make timely payments of principal and interest on our indebtedness; our ability to satisfy covenants in the agreements governing our indebtedness; our ability to maintain our liquidity; stock price volatility; share repurchase plans; dividend rate; our reliance on key management personnel; and changes in tax laws or adverse outcomes resulting from examination of our tax returns; and other one-time events and other factors that can be found in our Annual Report on Form 10-K for the year ended December 31, 2025, and any subsequent Quarterly Report on Form 10-Q or Current Report on Form 8-K, which are filed with the SEC and are available on TransUnion’s website (www.transunion.com/tru) and on the SEC’s website (www.sec.gov). TransUnion undertakes no obligation to publicly release the result of any revisions to these forward-looking statements to reflect the impact of events or circumstances that may arise after the date of this investor presentation. This investor presentation includes certain non-GAAP measures that are more fully described in the appendices to the presentation. Exhibit 99.1, “Press release of TransUnion dated July 28, 2026, announcing results for the quarter ended June 30, 2026,” under the heading ‘Non- GAAP Financial Measures,’” furnished to the Securities and Exchange Commission on July 28, 2026. These financial measures should be reviewed in conjunction with the relevant GAAP financial measures and are not presented as alternative measures of GAAP. Other companies in our industry may define or calculate these measures differently than we do, limiting their usefulness as comparative measures. Because of these limitations, these non-GAAP financial measures should not be considered in isolation or as substitutes for performance measures calculated in accordance with GAAP. Reconciliations of these non-GAAP financial measures to their most directly comparable GAAP financial measures for each of the periods included in this presentation are included in the Appendices at the back of this investor presentation.
3© 2026 TransUnion, its subsidiaries and/or affiliates. All Rights Reserved. Second quarter 2026 highlights1 Diversified and durable U.S. Financial Services growth 2 3@ Copyright 2026 Tran Union, its ubsidiaries and/or affiliates. All Rights Reserved. Second quarter 2026 financial results3 Third quarter and full-year 2026 guidance 4
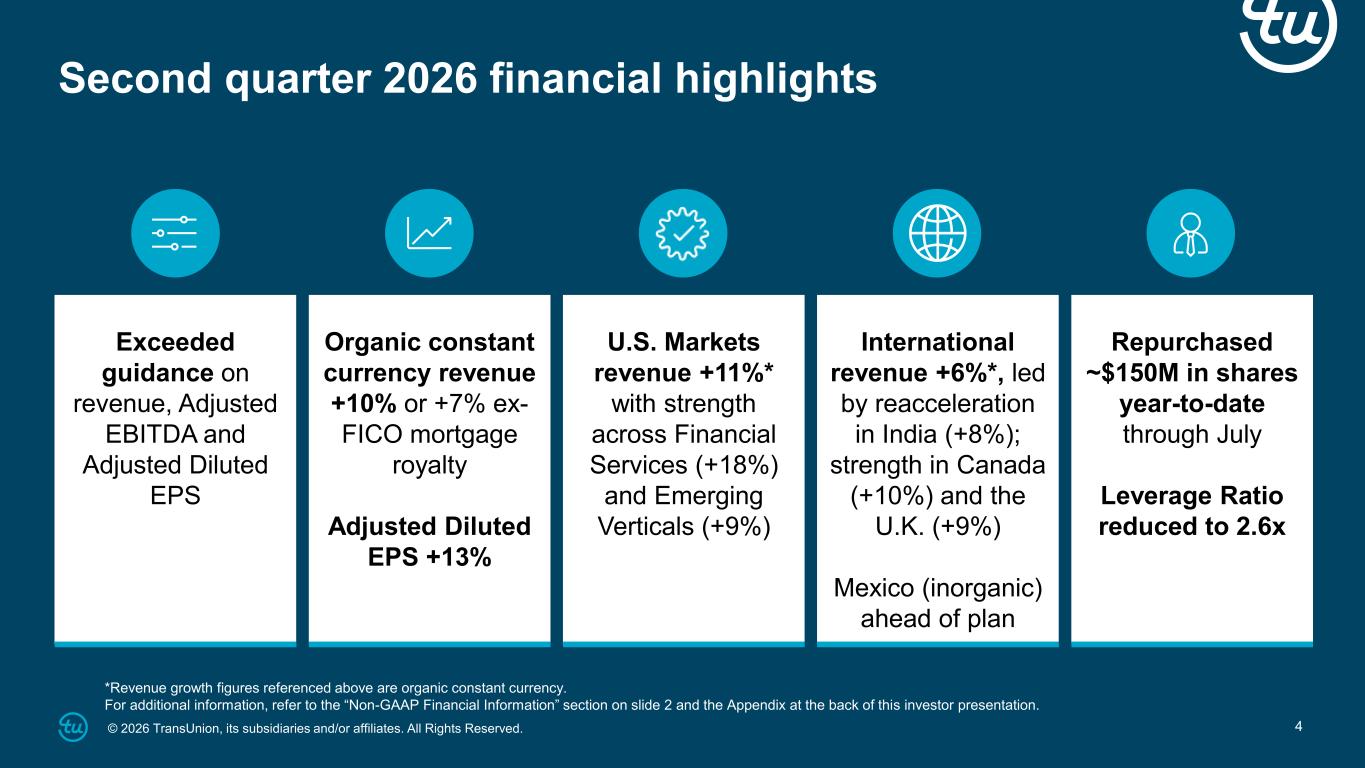
4© 2026 TransUnion, its subsidiaries and/or affiliates. All Rights Reserved. *Revenue growth figures referenced above are organic constant currency. For additional information, refer to the “Non-GAAP Financial Information” section on slide 2 and the Appendix at the back of this investor presentation. International revenue +6%*, led by reacceleration in India (+8%); strength in Canada (+10%) and the U.K. (+9%) Mexico (inorganic) ahead of plan U.S. Markets revenue +11%* with strength across Financial Services (+18%) and Emerging Verticals (+9%) Organic constant currency revenue +10% or +7% ex- FICO mortgage royalty Adjusted Diluted EPS +13% Exceeded guidance on revenue, Adjusted EBITDA and Adjusted Diluted EPS Repurchased ~$150M in shares year-to-date through July Leverage Ratio reduced to 2.6x Second quarter 2026 financial highlights
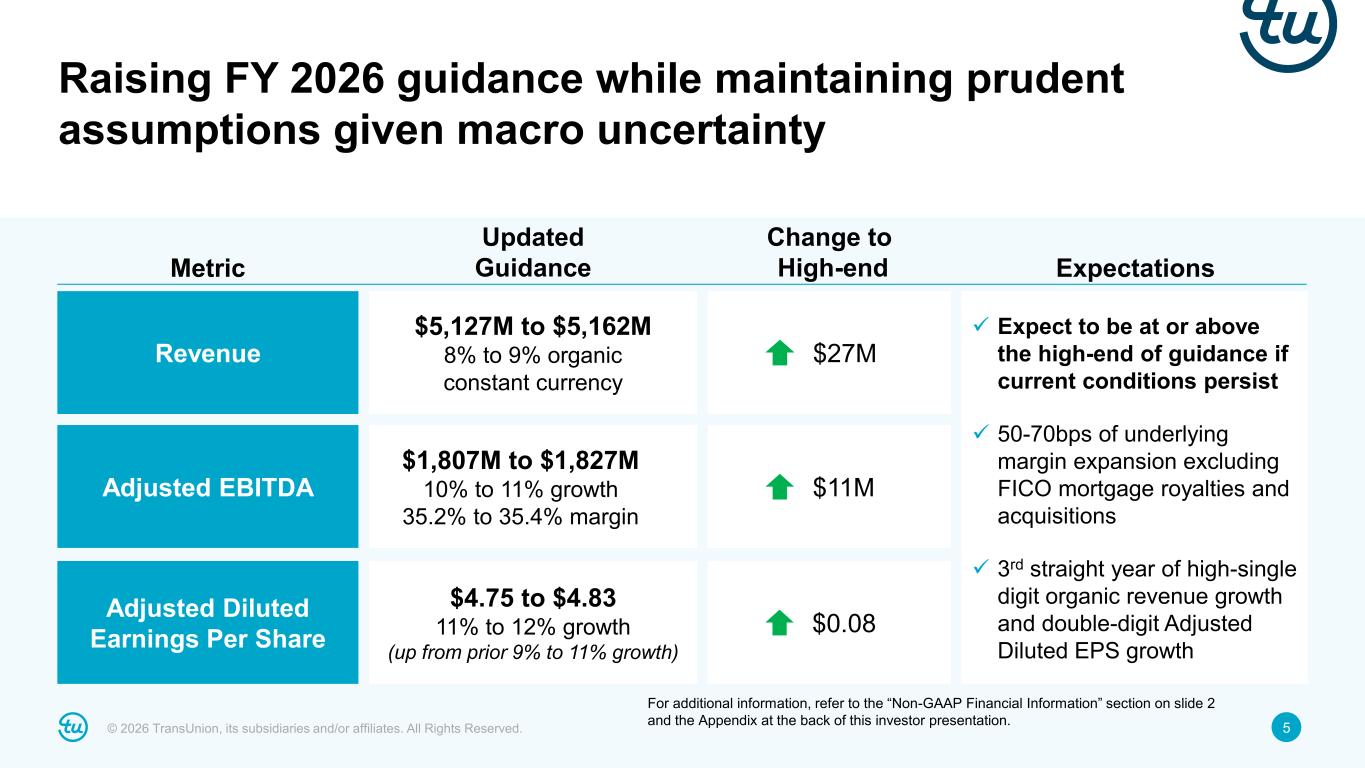
© 2026 TransUnion, its subsidiaries and/or affiliates. All Rights Reserved. 55 ✓ Expect to be at or above the high-end of guidance if current conditions persist ✓ 50-70bps of underlying margin expansion excluding FICO mortgage royalties and acquisitions ✓ 3rd straight year of high-single digit organic revenue growth and double-digit Adjusted Diluted EPS growth Revenue Adjusted EBITDA Adjusted Diluted Earnings Per Share Metric Updated Guidance Change to High-end Expectations $5,127M to $5,162M 8% to 9% organic constant currency $1,807M to $1,827M 10% to 11% growth 35.2% to 35.4% margin $4.75 to $4.83 11% to 12% growth (up from prior 9% to 11% growth) $27M $11M $0.08 Raising FY 2026 guidance while maintaining prudent assumptions given macro uncertainty For additional information, refer to the “Non-GAAP Financial Information” section on slide 2 and the Appendix at the back of this investor presentation.
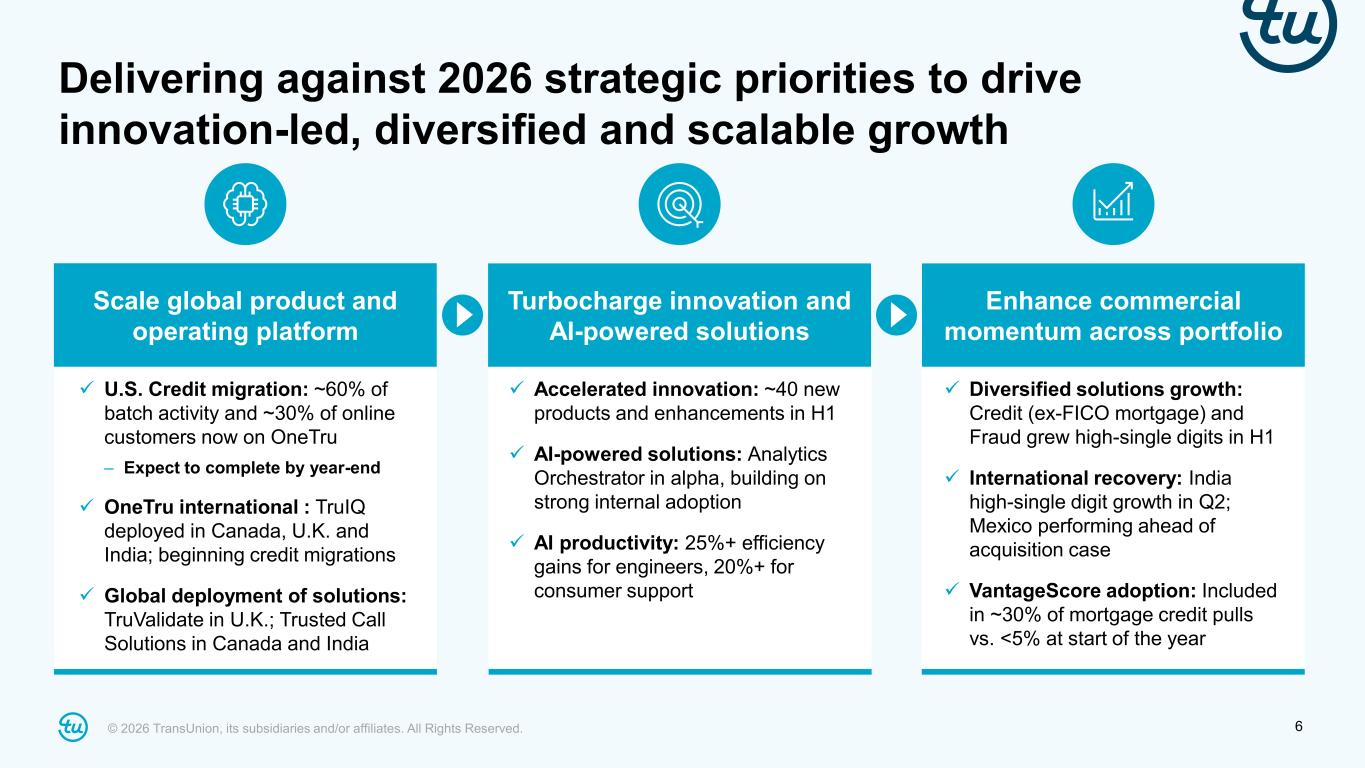
© 2026 TransUnion, its subsidiaries and/or affiliates. All Rights Reserved. 6 ✓ U.S. Credit migration: ~60% of batch activity and ~30% of online customers now on OneTru – Expect to complete by year-end ✓ OneTru international : TruIQ deployed in Canada, U.K. and India; beginning credit migrations ✓ Global deployment of solutions: TruValidate in U.K.; Trusted Call Solutions in Canada and India Scale global product and operating platform Delivering against 2026 strategic priorities to drive innovation-led, diversified and scalable growth Turbocharge innovation and AI-powered solutions Enhance commercial momentum across portfolio ✓ Accelerated innovation: ~40 new products and enhancements in H1 ✓ AI-powered solutions: Analytics Orchestrator in alpha, building on strong internal adoption ✓ AI productivity: 25%+ efficiency gains for engineers, 20%+ for consumer support ✓ Diversified solutions growth: Credit (ex-FICO mortgage) and Fraud grew high-single digits in H1 ✓ International recovery: India high-single digit growth in Q2; Mexico performing ahead of acquisition case ✓ VantageScore adoption: Included in ~30% of mortgage credit pulls vs. <5% at start of the year
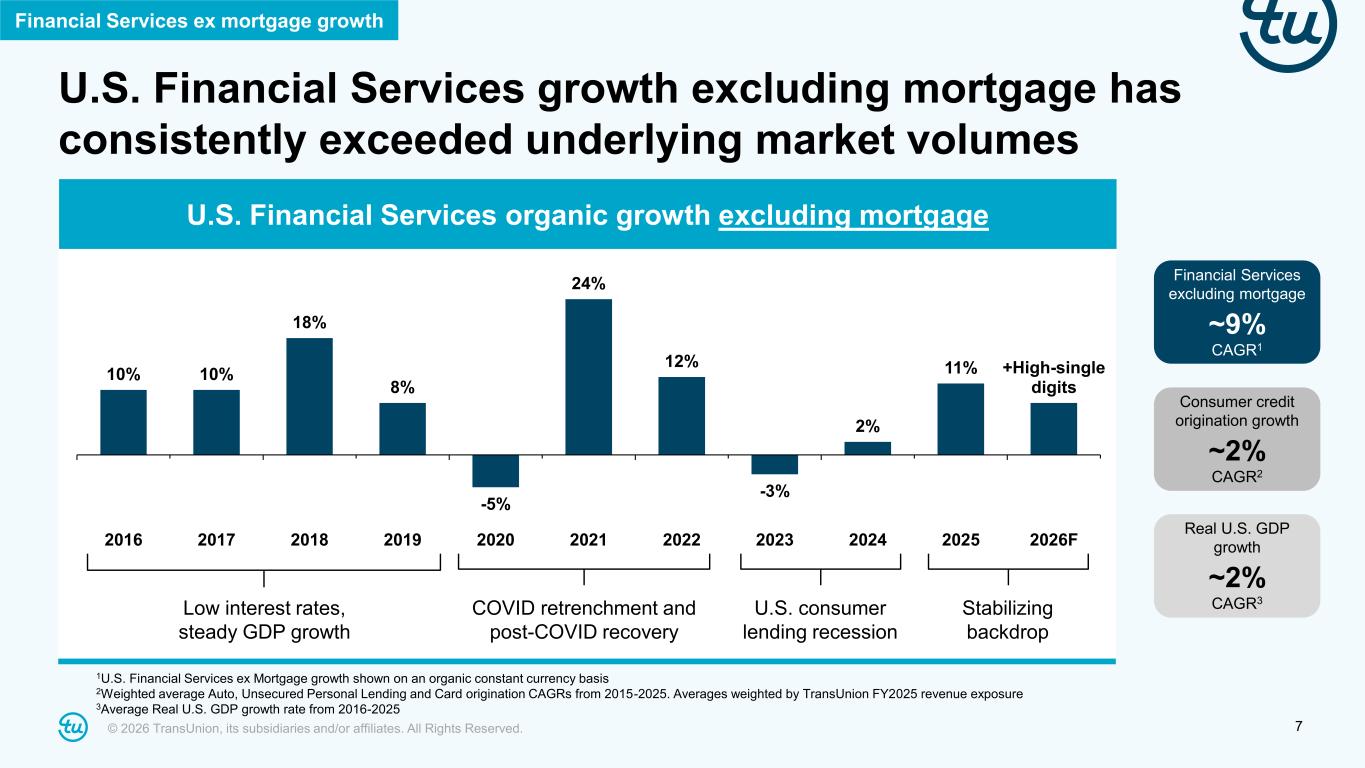
© 2026 TransUnion, its subsidiaries and/or affiliates. All Rights Reserved. 7 U.S. Financial Services growth excluding mortgage has consistently exceeded underlying market volumes 10% 10% 18% 8% -5% 24% 12% -3% 2% 11% +High-single digits 2016 2017 2018 2019 2020 2021 2022 2023 2024 2025 2026F Consumer credit origination growth ~2% CAGR2 Real U.S. GDP growth ~2% CAGR3 Financial Services excluding mortgage ~9% CAGR1 1U.S. Financial Services ex Mortgage growth shown on an organic constant currency basis 2Weighted average Auto, Unsecured Personal Lending and Card origination CAGRs from 2015-2025. Averages weighted by TransUnion FY2025 revenue exposure 3Average Real U.S. GDP growth rate from 2016-2025 Financial Services ex mortgage growth U.S. Financial Services organic growth excluding mortgage Low interest rates, steady GDP growth COVID retrenchment and post-COVID recovery U.S. consumer lending recession Stabilizing backdrop
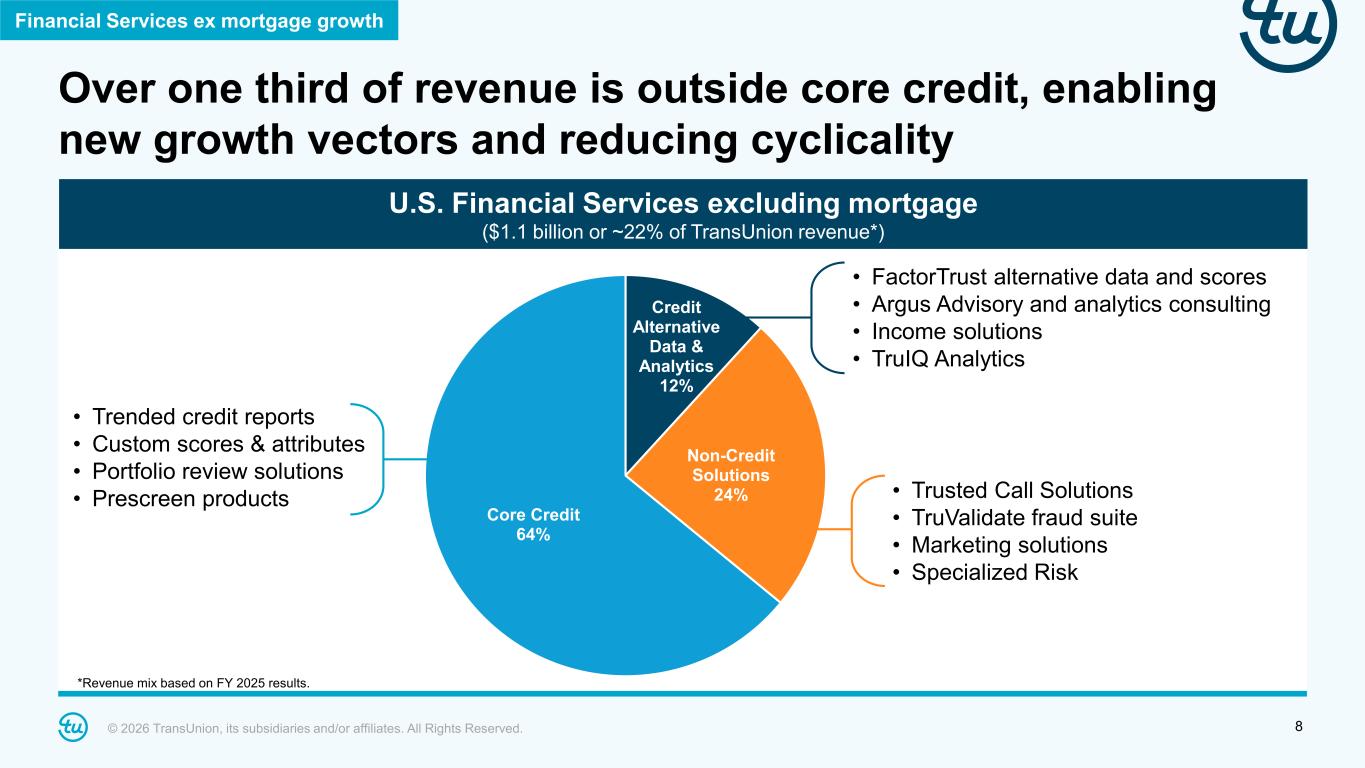
© 2026 TransUnion, its subsidiaries and/or affiliates. All Rights Reserved. 8 U.S. Financial Services excluding mortgage ($1.1 billion or ~22% of TransUnion revenue*) Credit Alternative Data & Analytics 12% Non-Credit Solutions 24% Core Credit 64% • Trusted Call Solutions • TruValidate fraud suite • Marketing solutions • Specialized Risk • Trended credit reports • Custom scores & attributes • Portfolio review solutions • Prescreen products Financial Services ex mortgage growth Over one third of revenue is outside core credit, enabling new growth vectors and reducing cyclicality • FactorTrust alternative data and scores • Argus Advisory and analytics consulting • Income solutions • TruIQ Analytics *Revenue mix based on FY 2025 results.
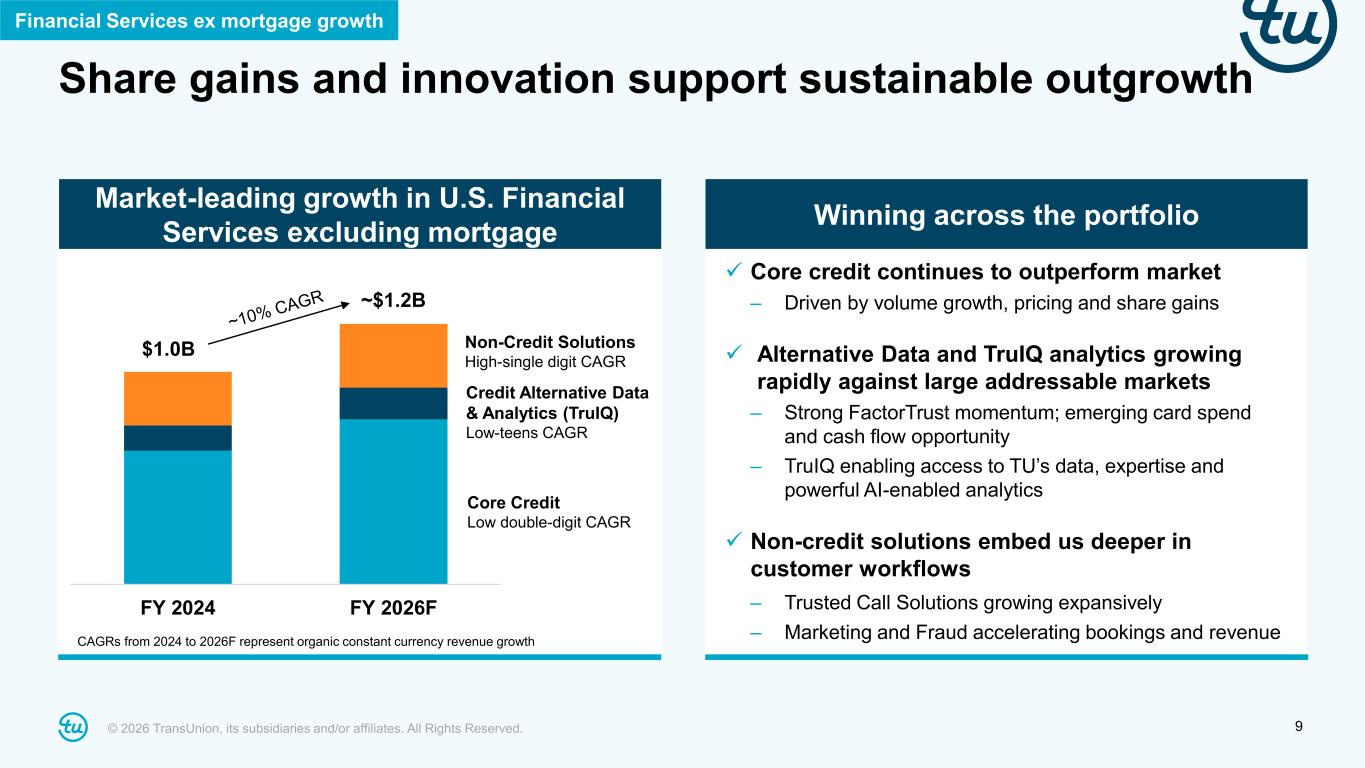
© 2026 TransUnion, its subsidiaries and/or affiliates. All Rights Reserved. 9 Market-leading growth in U.S. Financial Services excluding mortgage Winning across the portfolio Financial Services ex mortgage growth Share gains and innovation support sustainable outgrowth Credit Alternative Data & Analytics (TruIQ) Low-teens CAGR Non-Credit Solutions High-single digit CAGR Core Credit Low double-digit CAGR ✓ Core credit continues to outperform market – Driven by volume growth, pricing and share gains ✓ Alternative Data and TruIQ analytics growing rapidly against large addressable markets – Strong FactorTrust momentum; emerging card spend and cash flow opportunity – TruIQ enabling access to TU’s data, expertise and powerful AI-enabled analytics ✓ Non-credit solutions embed us deeper in customer workflows – Trusted Call Solutions growing expansively – Marketing and Fraud accelerating bookings and revenue CAGRs from 2024 to 2026F represent organic constant currency revenue growth FY 2024 FY 2026F $1.0B ~$1.2B
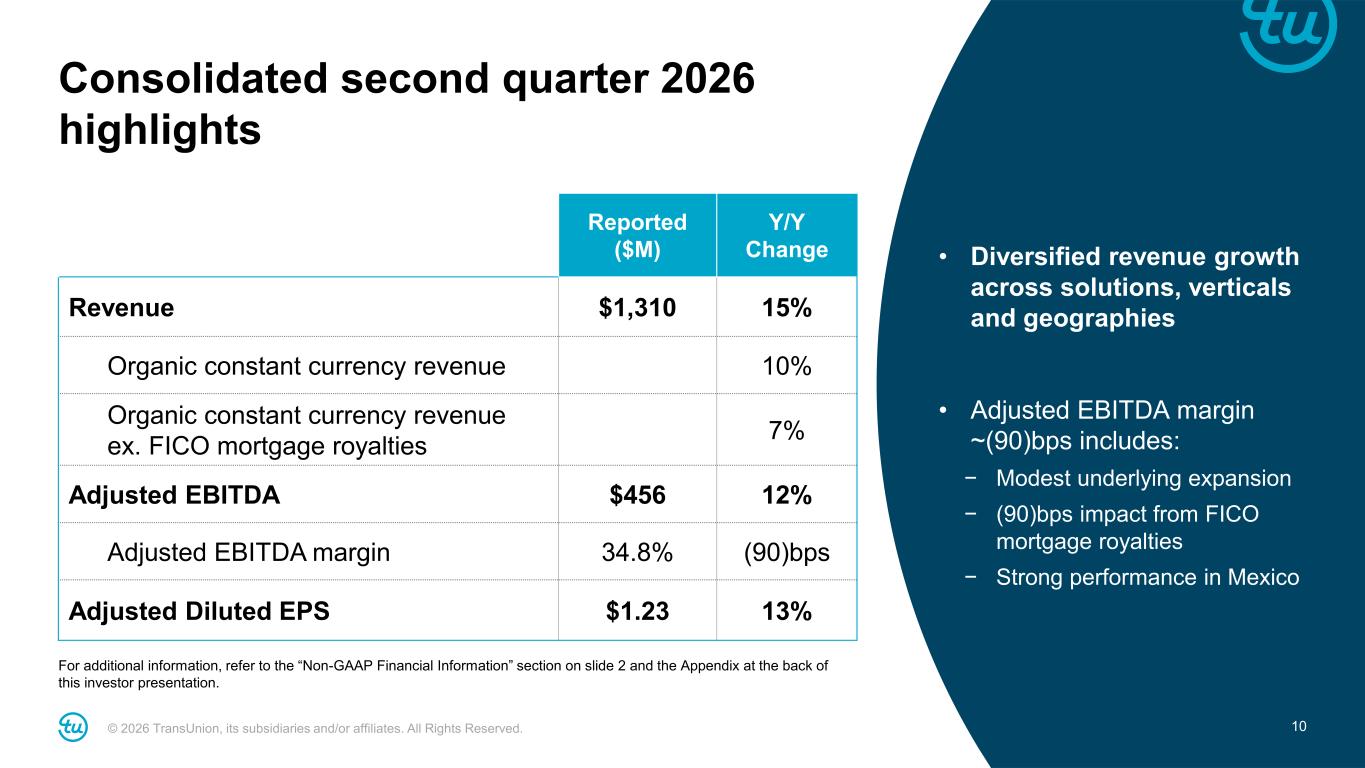
© 2026 TransUnion, its subsidiaries and/or affiliates. All Rights Reserved. 10 Consolidated second quarter 2026 highlights Y/Y Change Reported ($M) 15%$1,310Revenue 10%Organic constant currency revenue 7% Organic constant currency revenue ex. FICO mortgage royalties 12%$456Adjusted EBITDA (90)bps34.8%Adjusted EBITDA margin 13%$1.23Adjusted Diluted EPS • Diversified revenue growth across solutions, verticals and geographies • Adjusted EBITDA margin ~(90)bps includes: − Modest underlying expansion − (90)bps impact from FICO mortgage royalties − Strong performance in Mexico For additional information, refer to the “Non-GAAP Financial Information” section on slide 2 and the Appendix at the back of this investor presentation.
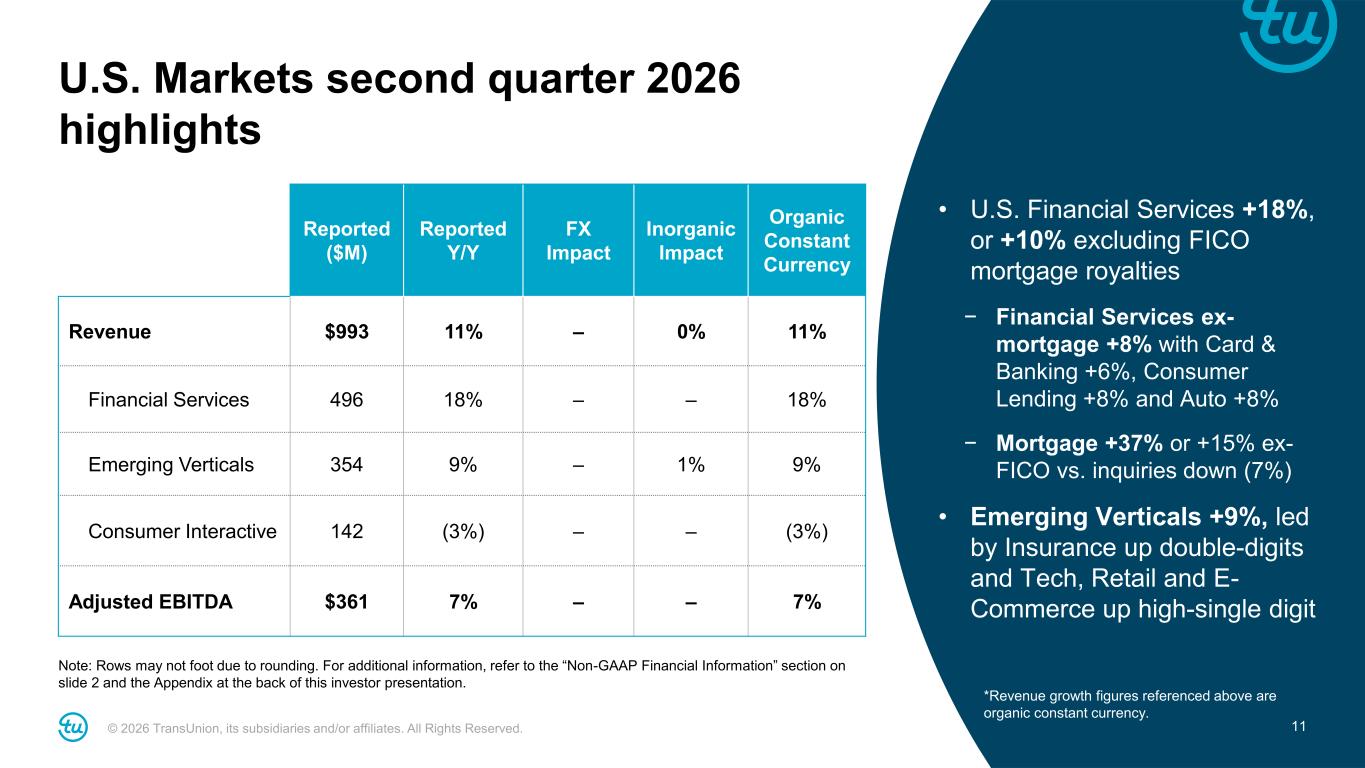
© 2026 TransUnion, its subsidiaries and/or affiliates. All Rights Reserved. 11 U.S. Markets second quarter 2026 highlights Note: Rows may not foot due to rounding. For additional information, refer to the “Non-GAAP Financial Information” section on slide 2 and the Appendix at the back of this investor presentation. • U.S. Financial Services +18%, or +10% excluding FICO mortgage royalties − Financial Services ex- mortgage +8% with Card & Banking +6%, Consumer Lending +8% and Auto +8% − Mortgage +37% or +15% ex- FICO vs. inquiries down (7%) • Emerging Verticals +9%, led by Insurance up double-digits and Tech, Retail and E- Commerce up high-single digit Organic Constant Currency Inorganic Impact FX Impact Reported Y/Y Reported ($M) 11%0%–11%$993Revenue 18%––18%496Financial Services 9%1%–9%354Emerging Verticals (3%)––(3%)142Consumer Interactive 7%––7%$361Adjusted EBITDA *Revenue growth figures referenced above are organic constant currency.
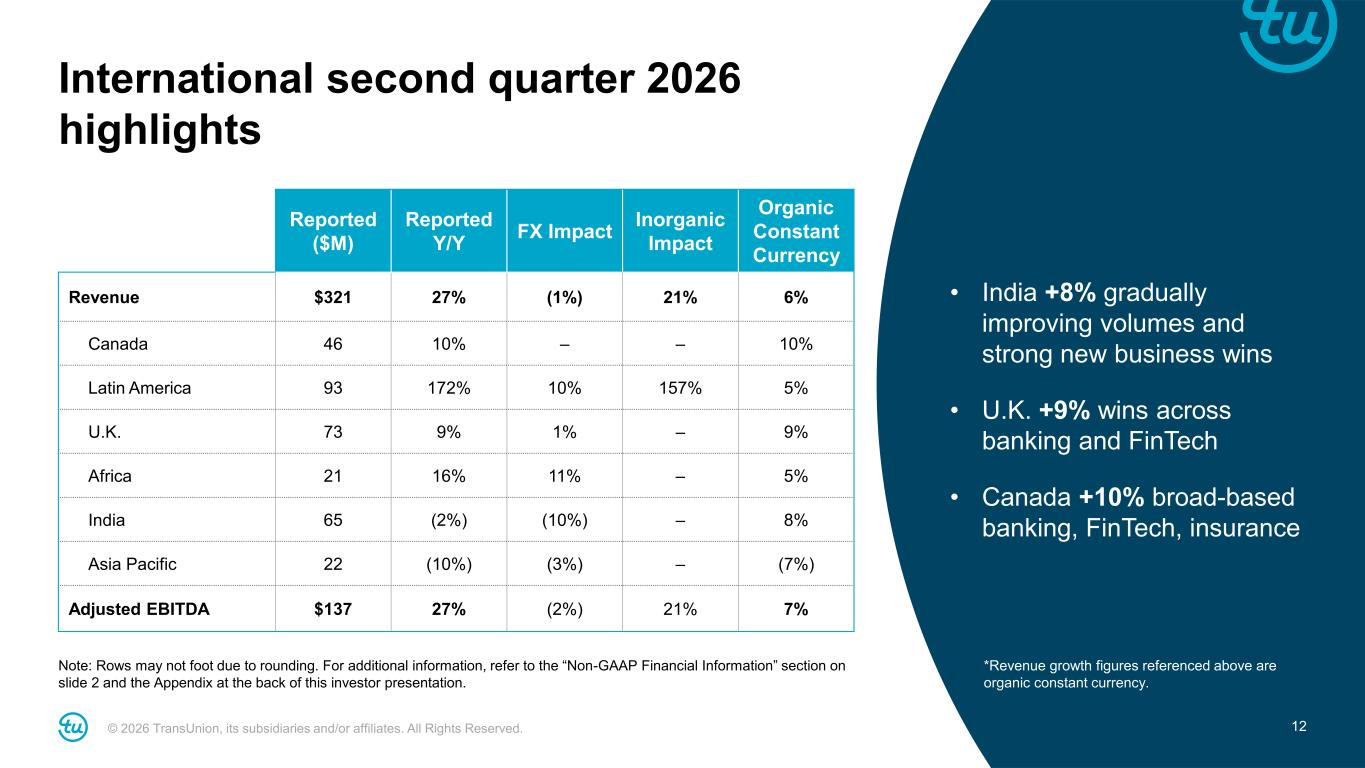
© 2026 TransUnion, its subsidiaries and/or affiliates. All Rights Reserved. 12 International second quarter 2026 highlights Note: Rows may not foot due to rounding. For additional information, refer to the “Non-GAAP Financial Information” section on slide 2 and the Appendix at the back of this investor presentation. Organic Constant Currency Inorganic Impact FX Impact Reported Y/Y Reported ($M) 6%21%(1%)27%$321Revenue 10%––10%46Canada 5%157%10%172%93Latin America 9%–1%9%73U.K. 5%–11%16%21Africa 8%–(10%)(2%)65India (7%)–(3%)(10%)22Asia Pacific 7%21%(2%)27%$137Adjusted EBITDA *Revenue growth figures referenced above are organic constant currency. • India +8% gradually improving volumes and strong new business wins • U.K. +9% wins across banking and FinTech • Canada +10% broad-based banking, FinTech, insurance
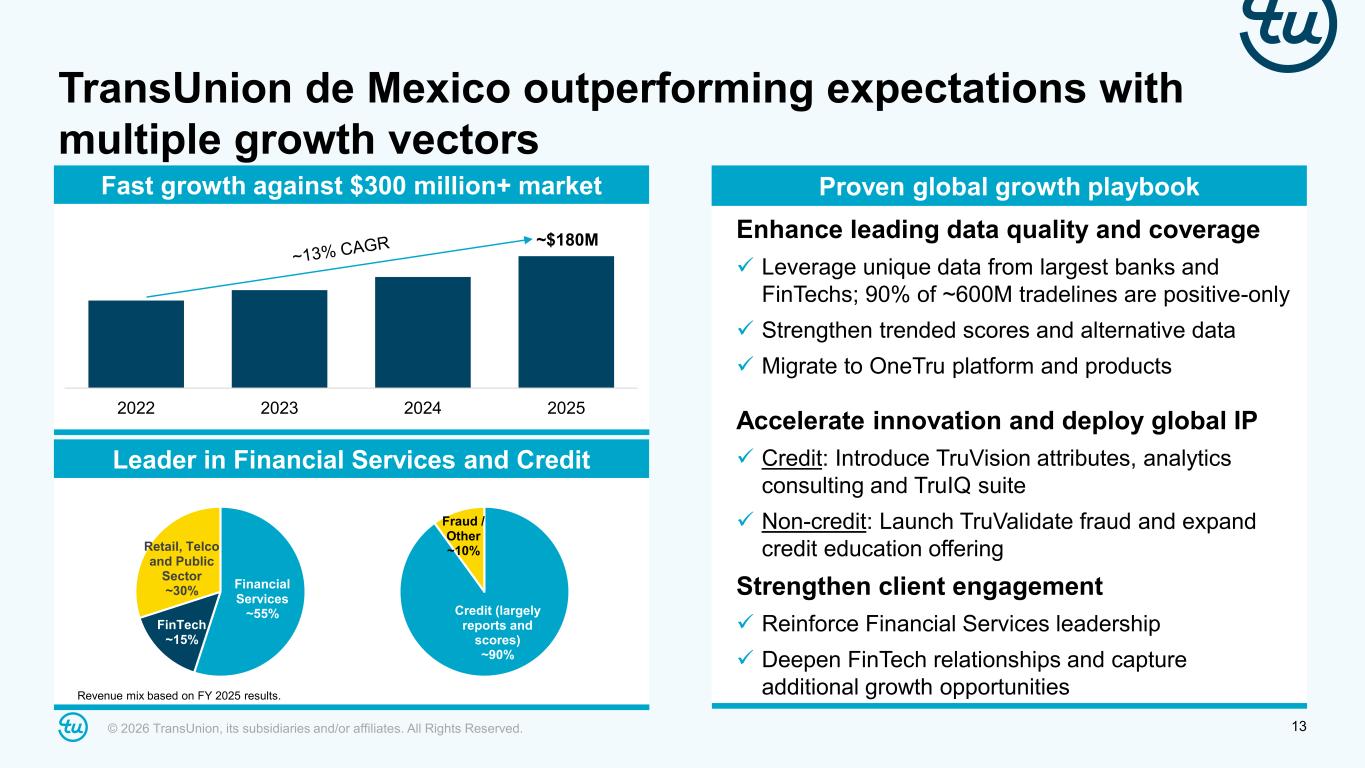
© 2026 TransUnion, its subsidiaries and/or affiliates. All Rights Reserved. 13 TransUnion de Mexico outperforming expectations with multiple growth vectors Enhance leading data quality and coverage ✓ Leverage unique data from largest banks and FinTechs; 90% of ~600M tradelines are positive-only ✓ Strengthen trended scores and alternative data ✓ Migrate to OneTru platform and products Accelerate innovation and deploy global IP ✓ Credit: Introduce TruVision attributes, analytics consulting and TruIQ suite ✓ Non-credit: Launch TruValidate fraud and expand credit education offering Strengthen client engagement ✓ Reinforce Financial Services leadership ✓ Deepen FinTech relationships and capture additional growth opportunities Fast growth against $300 million+ market Proven global growth playbook Leader in Financial Services and Credit Financial Services ~55% FinTech ~15% Retail, Telco and Public Sector ~30% Credit (largely reports and scores) ~90% Fraud / Other ~10% 2022 2023 2024 2025 ~$180M Revenue mix based on FY 2025 results.
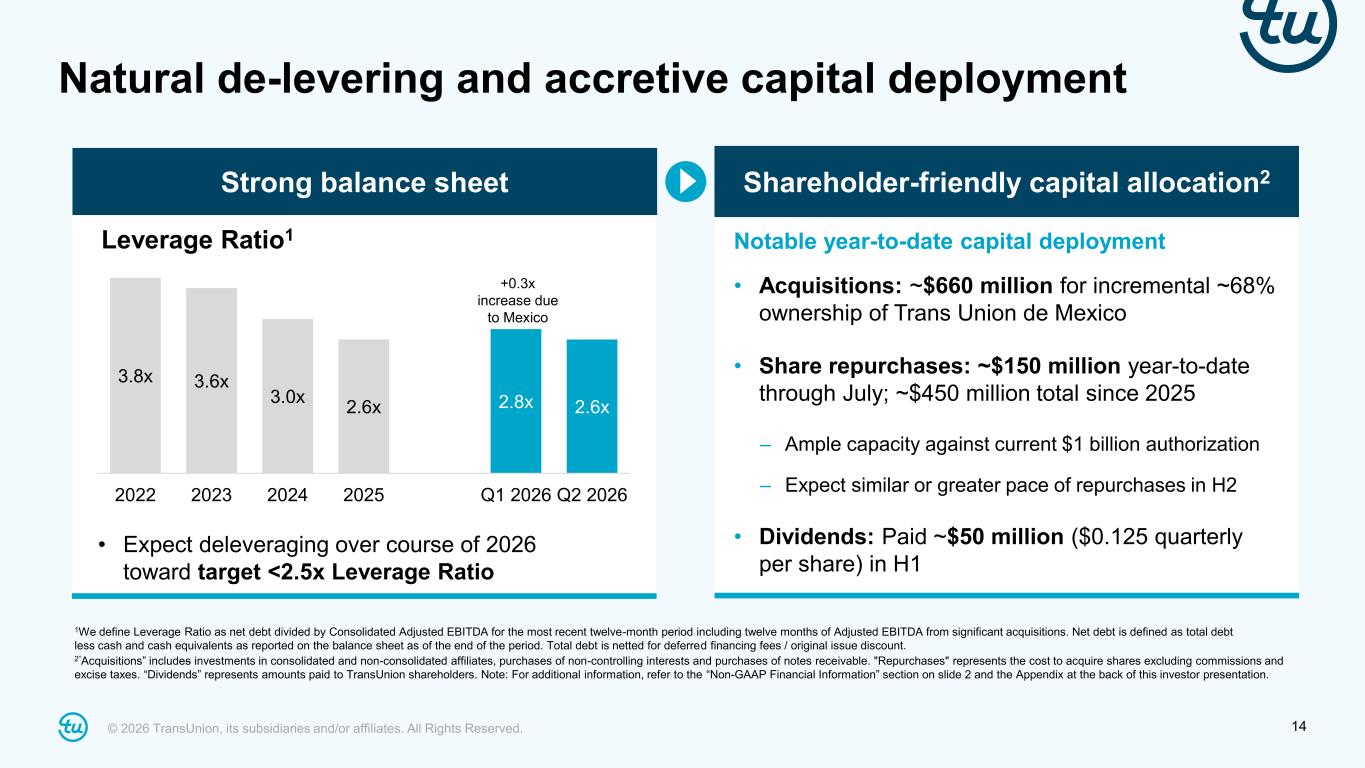
© 2026 TransUnion, its subsidiaries and/or affiliates. All Rights Reserved. 14 Natural de-levering and accretive capital deployment Shareholder-friendly capital allocation2 Strong balance sheet 1We define Leverage Ratio as net debt divided by Consolidated Adjusted EBITDA for the most recent twelve-month period including twelve months of Adjusted EBITDA from significant acquisitions. Net debt is defined as total debt less cash and cash equivalents as reported on the balance sheet as of the end of the period. Total debt is netted for deferred financing fees / original issue discount. 2”Acquisitions” includes investments in consolidated and non-consolidated affiliates, purchases of non-controlling interests and purchases of notes receivable. "Repurchases" represents the cost to acquire shares excluding commissions and excise taxes. “Dividends” represents amounts paid to TransUnion shareholders. Note: For additional information, refer to the “Non-GAAP Financial Information” section on slide 2 and the Appendix at the back of this investor presentation. 3.8x 3.6x 3.0x 2.6x 2.8x 2.6x 2022 2023 2024 2025 Q1 2026 Q2 2026 Notable year-to-date capital deployment • Acquisitions: ~$660 million for incremental ~68% ownership of Trans Union de Mexico • Share repurchases: ~$150 million year-to-date through July; ~$450 million total since 2025 – Ample capacity against current $1 billion authorization – Expect similar or greater pace of repurchases in H2 • Dividends: Paid ~$50 million ($0.125 quarterly per share) in H1 • Expect deleveraging over course of 2026 toward target <2.5x Leverage Ratio Leverage Ratio1 +0.3x increase due to Mexico
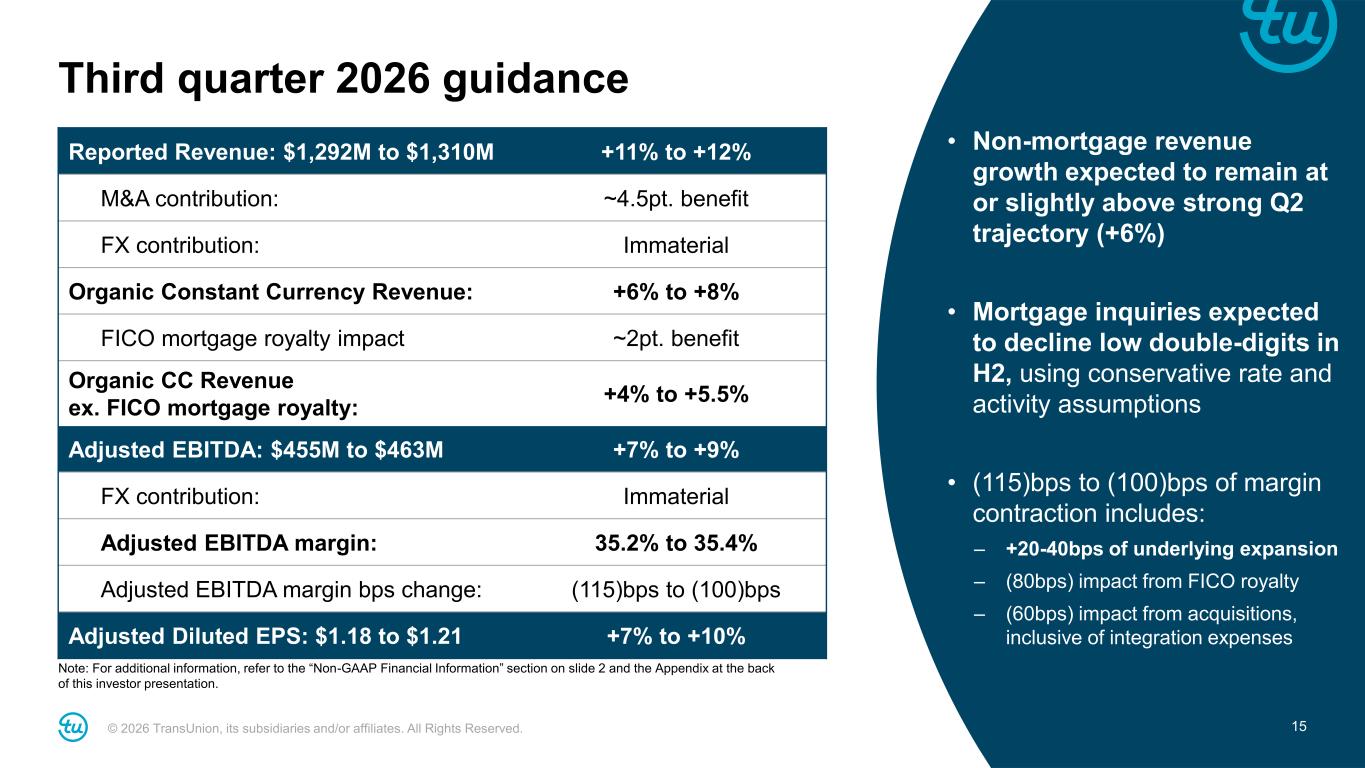
© 2026 TransUnion, its subsidiaries and/or affiliates. All Rights Reserved. 15 +11% to +12%Reported Revenue: $1,292M to $1,310M ~4.5pt. benefit M&A contribution: ImmaterialFX contribution: +6% to +8%Organic Constant Currency Revenue: ~2pt. benefitFICO mortgage royalty impact +4% to +5.5% Organic CC Revenue ex. FICO mortgage royalty: +7% to +9%Adjusted EBITDA: $455M to $463M ImmaterialFX contribution: 35.2% to 35.4%Adjusted EBITDA margin: (115)bps to (100)bpsAdjusted EBITDA margin bps change: +7% to +10%Adjusted Diluted EPS: $1.18 to $1.21 Third quarter 2026 guidance Note: For additional information, refer to the “Non-GAAP Financial Information” section on slide 2 and the Appendix at the back of this investor presentation. • Non-mortgage revenue growth expected to remain at or slightly above strong Q2 trajectory (+6%) • Mortgage inquiries expected to decline low double-digits in H2, using conservative rate and activity assumptions • (115)bps to (100)bps of margin contraction includes: – +20-40bps of underlying expansion – (80bps) impact from FICO royalty – (60bps) impact from acquisitions, inclusive of integration expenses
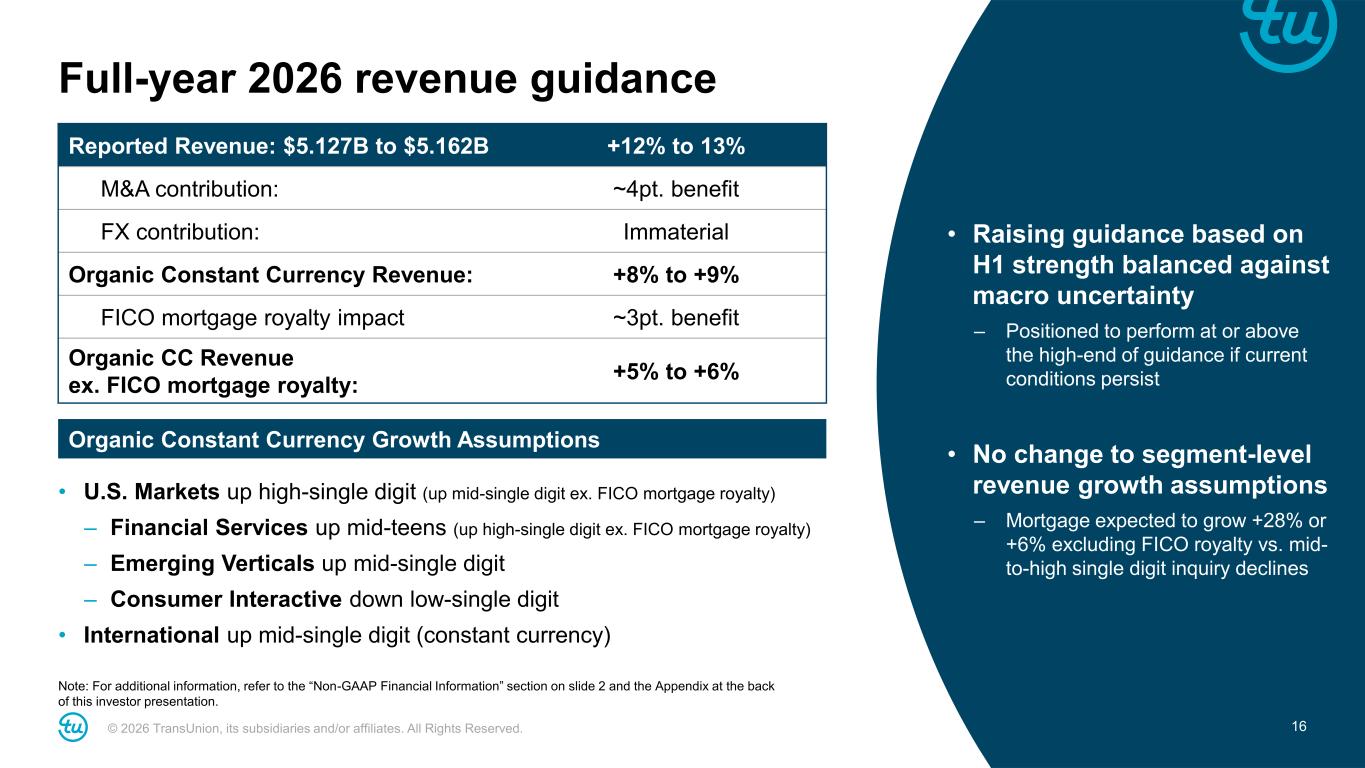
© 2026 TransUnion, its subsidiaries and/or affiliates. All Rights Reserved. 16 Full-year 2026 revenue guidance +12% to 13%Reported Revenue: $5.127B to $5.162B ~4pt. benefitM&A contribution: ImmaterialFX contribution: +8% to +9%Organic Constant Currency Revenue: ~3pt. benefitFICO mortgage royalty impact +5% to +6% Organic CC Revenue ex. FICO mortgage royalty: Organic Constant Currency Growth Assumptions • U.S. Markets up high-single digit (up mid-single digit ex. FICO mortgage royalty) – Financial Services up mid-teens (up high-single digit ex. FICO mortgage royalty) – Emerging Verticals up mid-single digit – Consumer Interactive down low-single digit • International up mid-single digit (constant currency) Note: For additional information, refer to the “Non-GAAP Financial Information” section on slide 2 and the Appendix at the back of this investor presentation. • Raising guidance based on H1 strength balanced against macro uncertainty – Positioned to perform at or above the high-end of guidance if current conditions persist • No change to segment-level revenue growth assumptions – Mortgage expected to grow +28% or +6% excluding FICO royalty vs. mid- to-high single digit inquiry declines
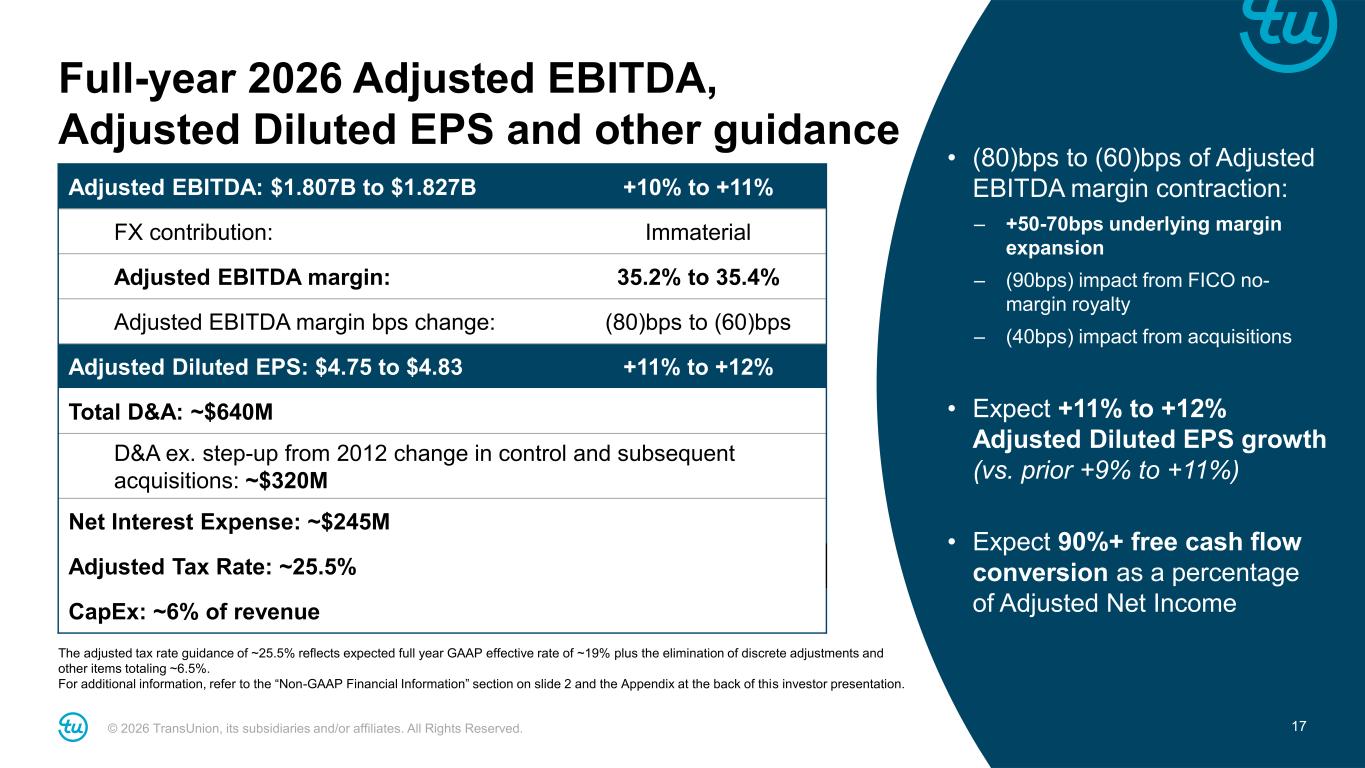
© 2026 TransUnion, its subsidiaries and/or affiliates. All Rights Reserved. 17 The adjusted tax rate guidance of ~25.5% reflects expected full year GAAP effective rate of ~19% plus the elimination of discrete adjustments and other items totaling ~6.5%. For additional information, refer to the “Non-GAAP Financial Information” section on slide 2 and the Appendix at the back of this investor presentation. Full-year 2026 Adjusted EBITDA, Adjusted Diluted EPS and other guidance +10% to +11%Adjusted EBITDA: $1.807B to $1.827B ImmaterialFX contribution: 35.2% to 35.4%Adjusted EBITDA margin: (80)bps to (60)bpsAdjusted EBITDA margin bps change: +11% to +12%Adjusted Diluted EPS: $4.75 to $4.83 Total D&A: ~$640M D&A ex. step-up from 2012 change in control and subsequent acquisitions: ~$320M Net Interest Expense: ~$245M Adjusted Tax Rate: ~25.5% CapEx: ~6% of revenue • (80)bps to (60)bps of Adjusted EBITDA margin contraction: – +50-70bps underlying margin expansion – (90bps) impact from FICO no- margin royalty – (40bps) impact from acquisitions • Expect +11% to +12% Adjusted Diluted EPS growth (vs. prior +9% to +11%) • Expect 90%+ free cash flow conversion as a percentage of Adjusted Net Income
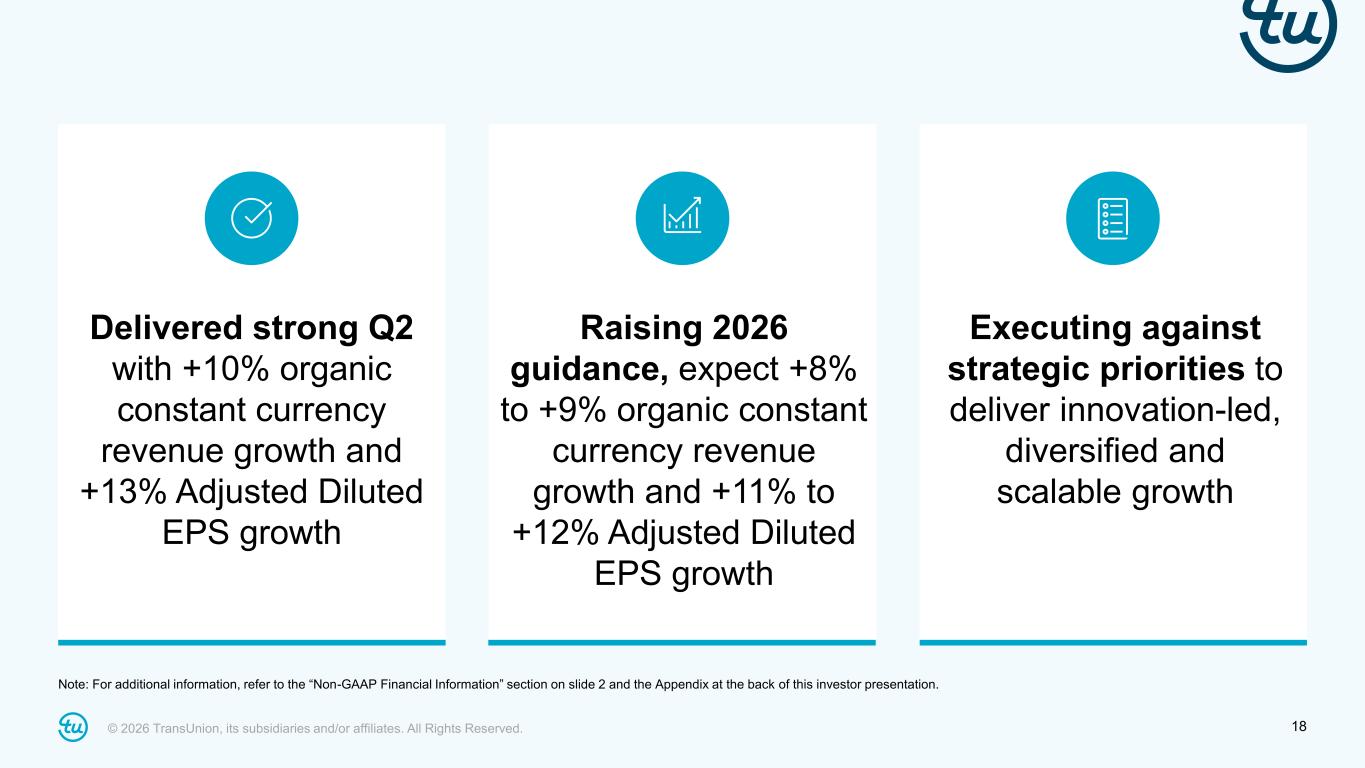
© 2026 TransUnion, its subsidiaries and/or affiliates. All Rights Reserved. 18 Raising 2026 guidance, expect +8% to +9% organic constant currency revenue growth and +11% to +12% Adjusted Diluted EPS growth Delivered strong Q2 with +10% organic constant currency revenue growth and +13% Adjusted Diluted EPS growth Executing against strategic priorities to deliver innovation-led, diversified and scalable growth Note: For additional information, refer to the “Non-GAAP Financial Information” section on slide 2 and the Appendix at the back of this investor presentation.

© 2026 TransUnion, its subsidiaries and/or affiliates. All Rights Reserved. 19 Q&A

Greg Bardi Investor Relations gregory.bardi@transunion.com Jason Stuhldreher Investor Relations jason.stuhldreher@transunion.com

Appendices and Non-GAAP Reconciliations
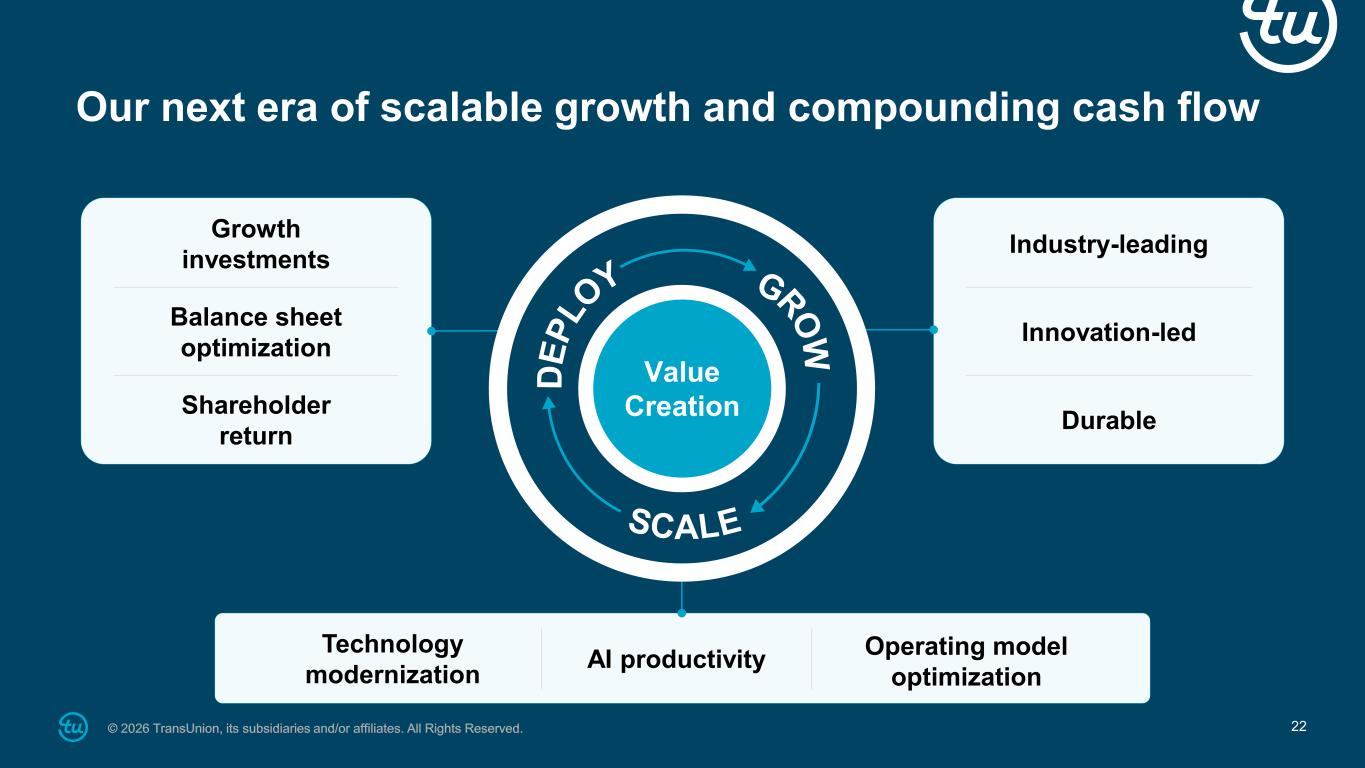
22© 2026 TransUnion, its subsidiaries and/or affiliates. All Rights Reserved. Our next era of scalable growth and compounding cash flow Industry-leading Durable Innovation-led Growth investments Shareholder return Balance sheet optimization D E P L O Y GR O W SCALE Value Creation Technology modernization AI productivity Operating model optimization
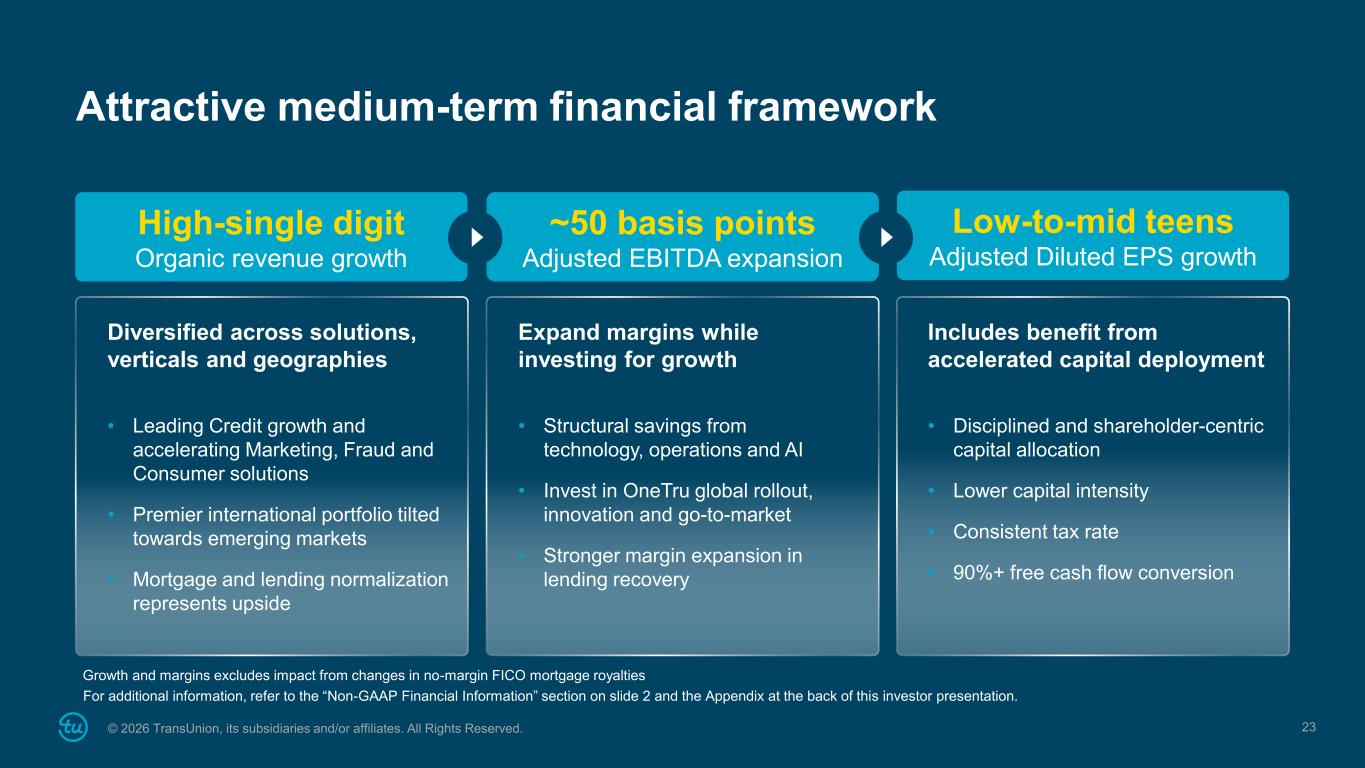
© 2026 TransUnion, its subsidiaries and/or affiliates. All Rights Reserved. 23 High-single digit Organic revenue growth Diversified across solutions, verticals and geographies • Leading Credit growth and accelerating Marketing, Fraud and Consumer solutions • Premier international portfolio tilted towards emerging markets • Mortgage and lending normalization represents upside For additional information, refer to the “Non-GAAP Financial Information” section on slide 2 and the Appendix at the back of this investor presentation. ~50 basis points Adjusted EBITDA expansion Expand margins while investing for growth • Structural savings from technology, operations and AI • Invest in OneTru global rollout, innovation and go-to-market • Stronger margin expansion in lending recovery Low-to-mid teens Adjusted Diluted EPS growth Includes benefit from accelerated capital deployment • Disciplined and shareholder-centric capital allocation • Lower capital intensity • Consistent tax rate • 90%+ free cash flow conversion Growth and margins excludes impact from changes in no-margin FICO mortgage royalties Attractive medium-term financial framework
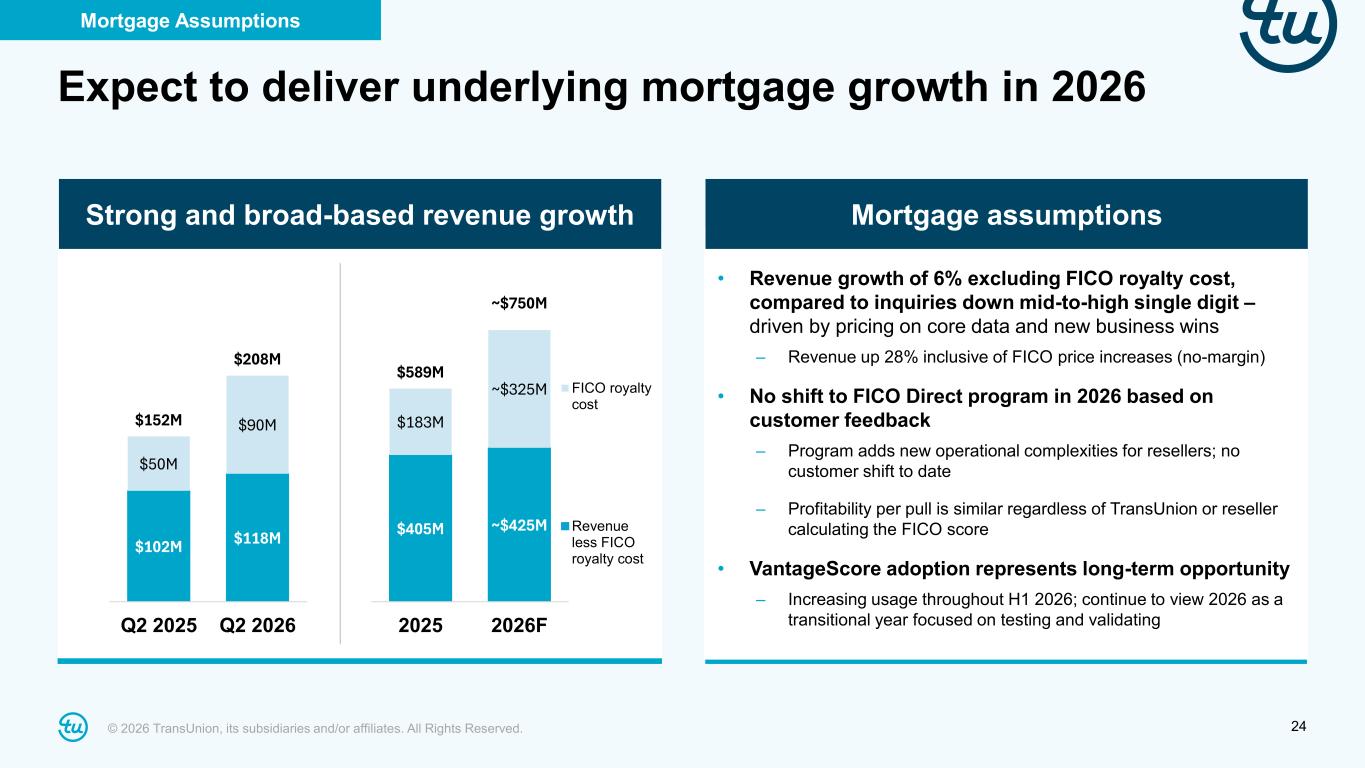
© 2026 TransUnion, its subsidiaries and/or affiliates. All Rights Reserved. 24 Strong and broad-based revenue growth Expect to deliver underlying mortgage growth in 2026 ~70bps of underlying margin expansion Mortgage Assumptions Mortgage assumptions • Revenue growth of 6% excluding FICO royalty cost, compared to inquiries down mid-to-high single digit – driven by pricing on core data and new business wins – Revenue up 28% inclusive of FICO price increases (no-margin) • No shift to FICO Direct program in 2026 based on customer feedback – Program adds new operational complexities for resellers; no customer shift to date – Profitability per pull is similar regardless of TransUnion or reseller calculating the FICO score • VantageScore adoption represents long-term opportunity – Increasing usage throughout H1 2026; continue to view 2026 as a transitional year focused on testing and validating $405M ~$425M $183M ~$325M $589M ~$750M 2025 2026F FICO royalty cost Revenue less FICO royalty cost $102M $118M $50M $90M$152M $208M Q2 2025 Q2 2026
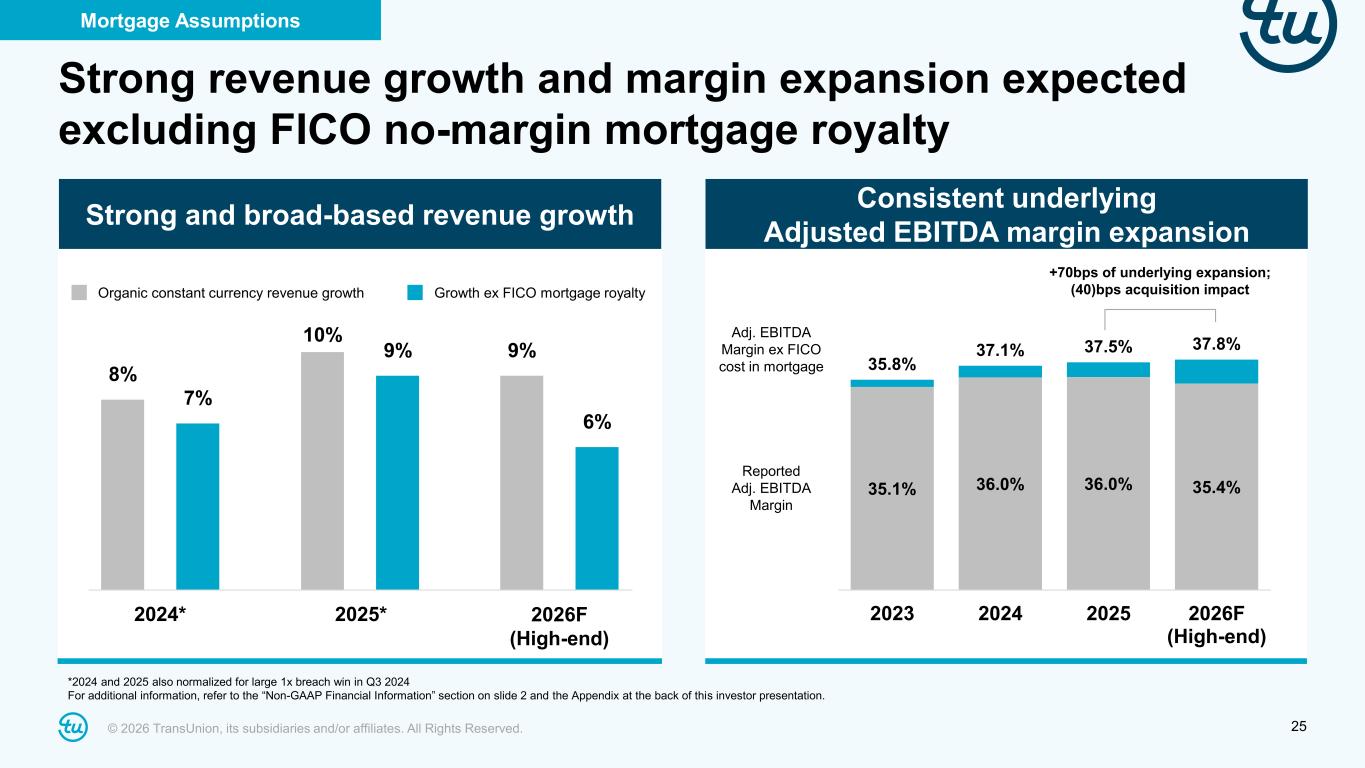
© 2026 TransUnion, its subsidiaries and/or affiliates. All Rights Reserved. 25 Strong and broad-based revenue growth Consistent underlying Adjusted EBITDA margin expansion 2025* 2026F (High-end) 10% 9% 9% 6% 35.1% 36.0% 36.0% 35.4% 35.8% 37.1% 37.5% 37.8% 2023 2024 2025 2026F (High-end) Reported Adj. EBITDA Margin Adj. EBITDA Margin ex FICO cost in mortgage 8% 7% 2024* Organic constant currency revenue growth Growth ex FICO mortgage royalty +70bps of underlying expansion; (40)bps acquisition impact *2024 and 2025 also normalized for large 1x breach win in Q3 2024 For additional information, refer to the “Non-GAAP Financial Information” section on slide 2 and the Appendix at the back of this investor presentation. Mortgage Assumptions Strong revenue growth and margin expansion expected excluding FICO no-margin mortgage royalty
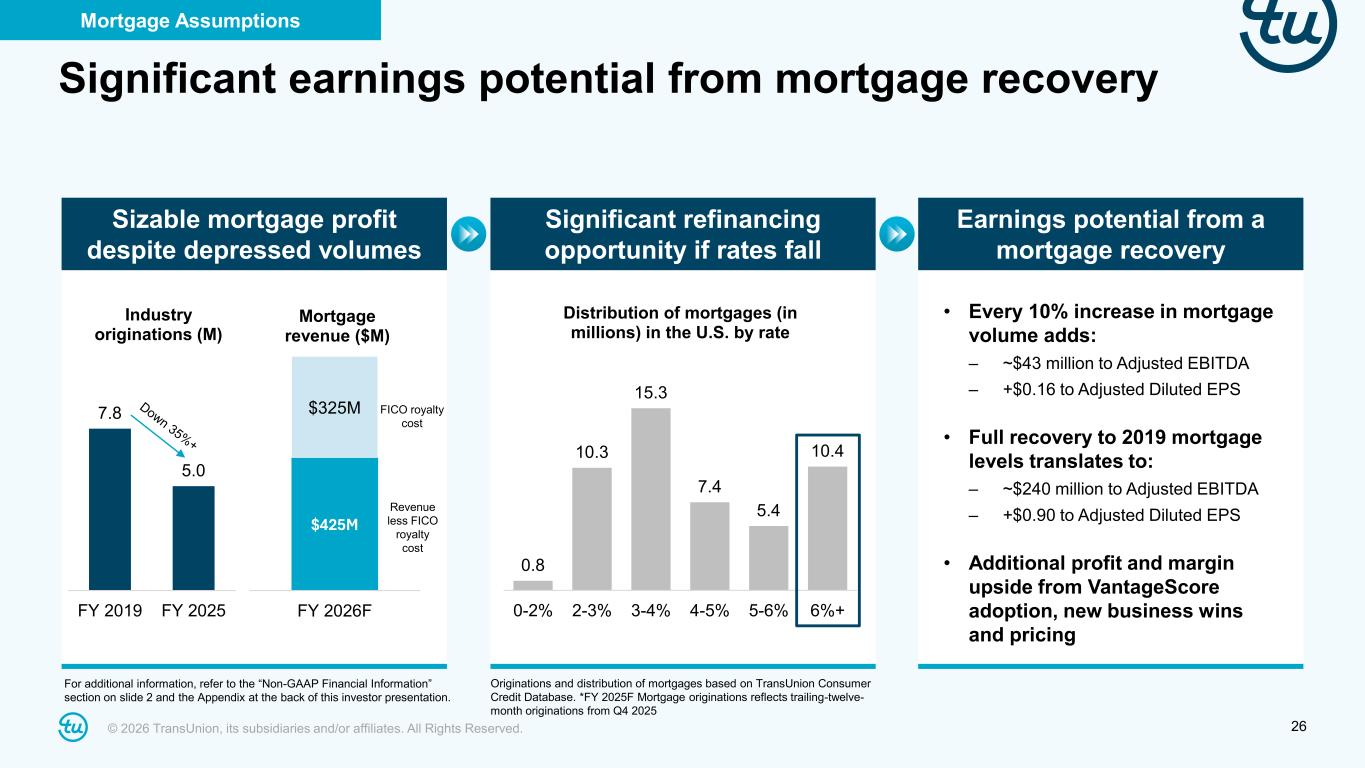
© 2026 TransUnion, its subsidiaries and/or affiliates. All Rights Reserved. 26 Significant earnings potential from mortgage recovery Sizable mortgage profit despite depressed volumes Originations and distribution of mortgages based on TransUnion Consumer Credit Database. *FY 2025F Mortgage originations reflects trailing-twelve- month originations from Q4 2025 7.8 5.0 FY 2019 FY 2025 Industry originations (M) $425M $325M FY 2026F Mortgage revenue ($M) Significant refinancing opportunity if rates fall 0.8 10.3 15.3 7.4 5.4 10.4 0-2% 2-3% 3-4% 4-5% 5-6% 6%+ Distribution of mortgages (in millions) in the U.S. by rate Earnings potential from a mortgage recovery • Every 10% increase in mortgage volume adds: – ~$43 million to Adjusted EBITDA – +$0.16 to Adjusted Diluted EPS • Full recovery to 2019 mortgage levels translates to: – ~$240 million to Adjusted EBITDA – +$0.90 to Adjusted Diluted EPS • Additional profit and margin upside from VantageScore adoption, new business wins and pricing FICO royalty cost Revenue less FICO royalty cost For additional information, refer to the “Non-GAAP Financial Information” section on slide 2 and the Appendix at the back of this investor presentation. Mortgage Assumptions
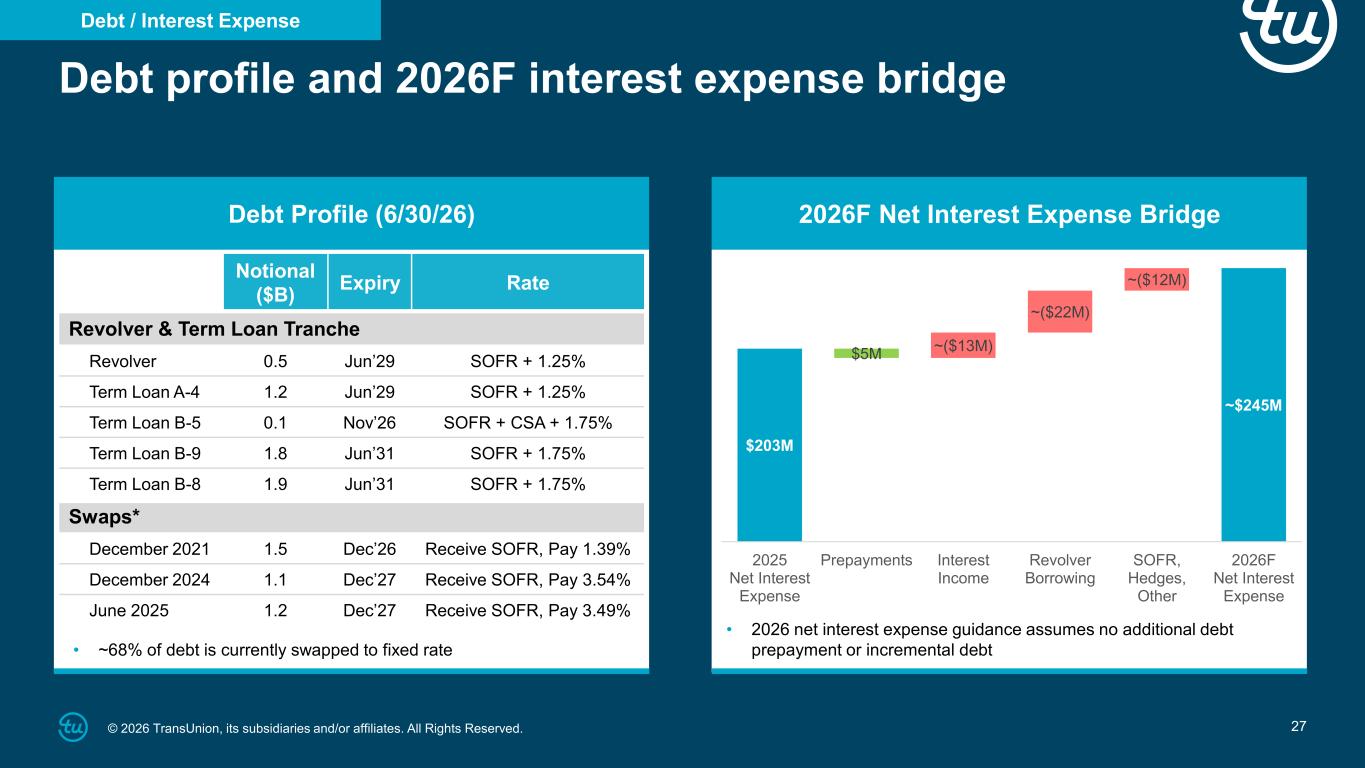
27© 2026 TransUnion, its subsidiaries and/or affiliates. All Rights Reserved. Debt profile and 2026F interest expense bridge Debt Profile (6/30/26) 2026F Net Interest Expense Bridge RateExpiry Notional ($B) Revolver & Term Loan Tranche SOFR + 1.25%Jun’290.5Revolver SOFR + 1.25%Jun’291.2Term Loan A-4 SOFR + CSA + 1.75%Nov’260.1Term Loan B-5 SOFR + 1.75%Jun’311.8Term Loan B-9 SOFR + 1.75%Jun’311.9Term Loan B-8 Swaps* Receive SOFR, Pay 1.39%Dec’261.5December 2021 Receive SOFR, Pay 3.54%Dec’271.1December 2024 Receive SOFR, Pay 3.49%Dec’271.2June 2025 • ~68% of debt is currently swapped to fixed rate • 2026 net interest expense guidance assumes no additional debt prepayment or incremental debt Debt / Interest Expense $203M ~$245M $5M ~($13M) ~($22M) ~($12M) 2025 Net Interest Expense Prepayments Interest Income Revolver Borrowing SOFR, Hedges, Other 2026F Net Interest Expense
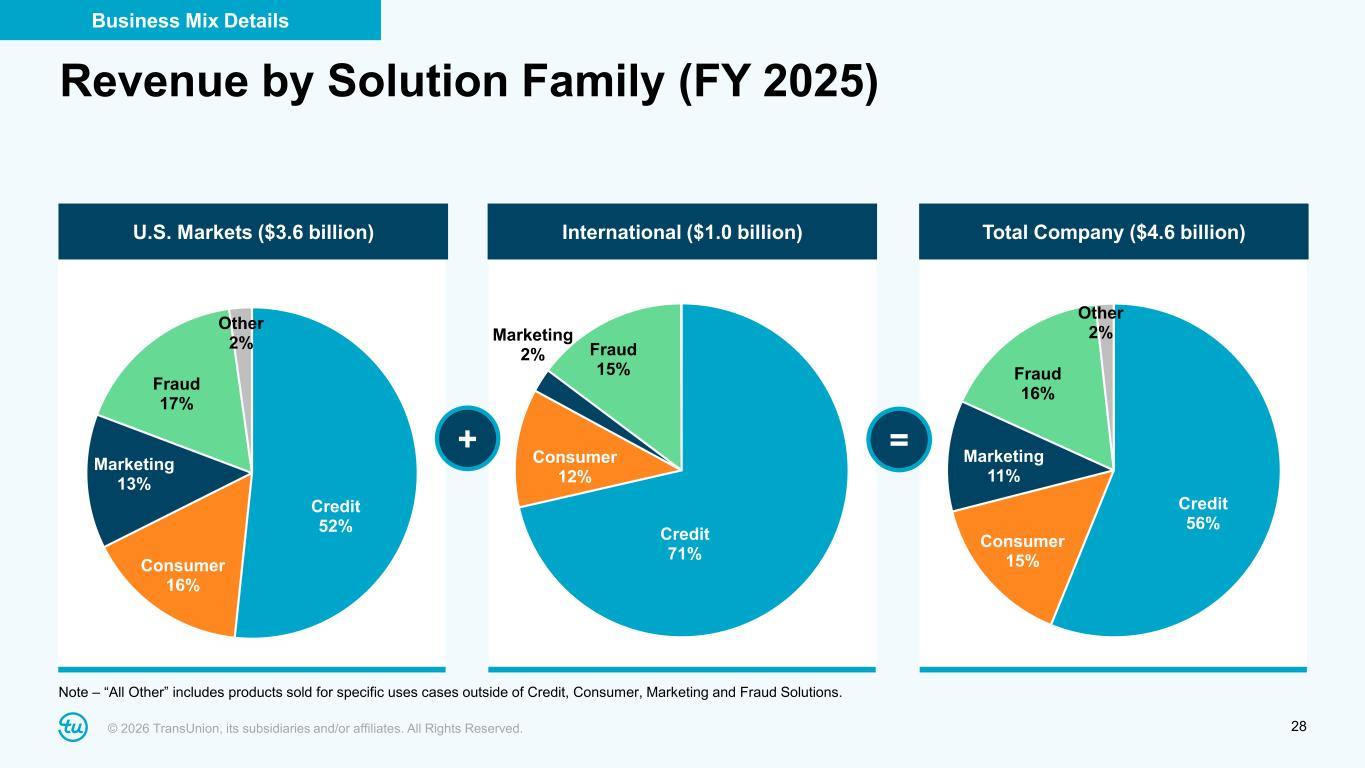
© 2026 TransUnion, its subsidiaries and/or affiliates. All Rights Reserved. 28 Credit 56% Consumer 15% Marketing 11% Fraud 16% Other 2% Credit 52% Consumer 16% Marketing 13% Fraud 17% Other 2% Credit 71% Consumer 12% Marketing 2% Fraud 15% + = Revenue by Solution Family (FY 2025) U.S. Markets ($3.6 billion) International ($1.0 billion) Total Company ($4.6 billion) Note – “All Other” includes products sold for specific uses cases outside of Credit, Consumer, Marketing and Fraud Solutions. Business Mix Details
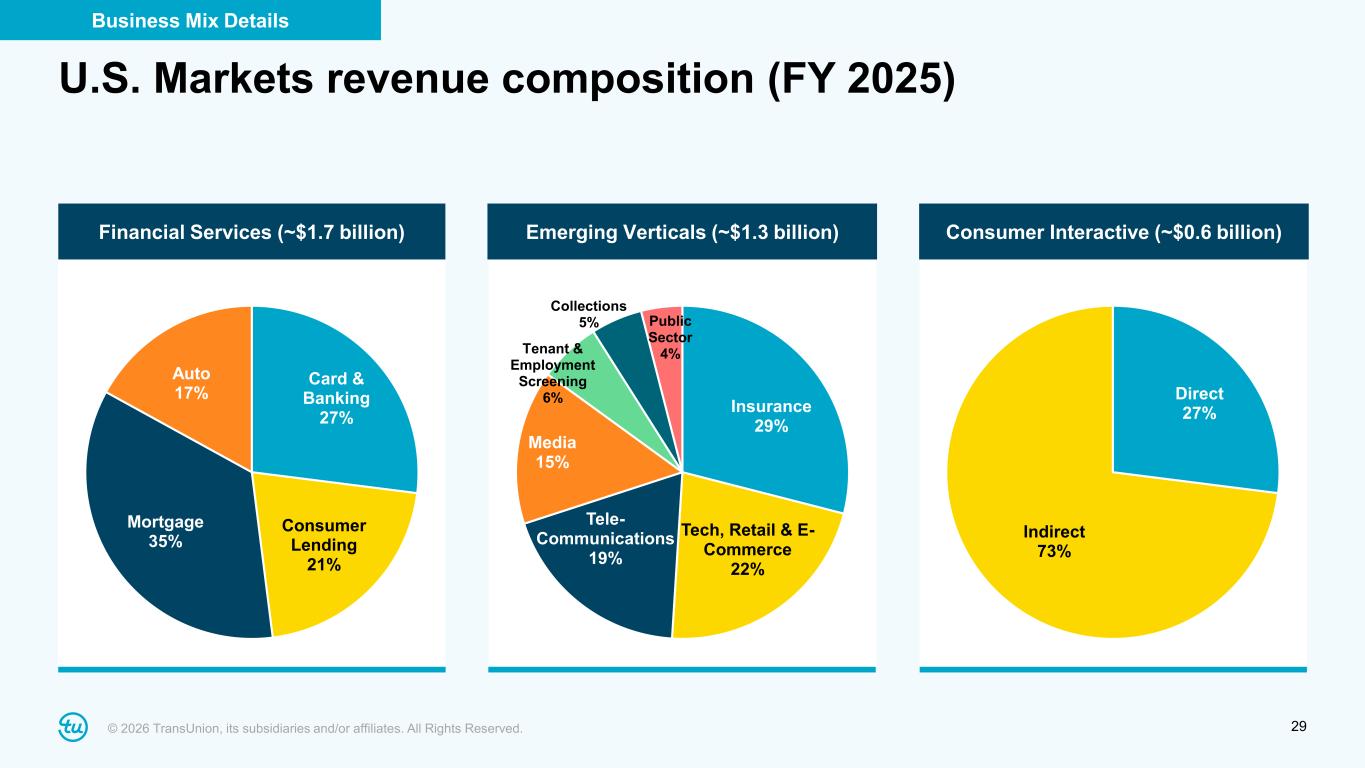
© 2026 TransUnion, its subsidiaries and/or affiliates. All Rights Reserved. 29 U.S. Markets revenue composition (FY 2025) Card & Banking 27% Consumer Lending 21% Mortgage 35% Auto 17% Insurance 29% Tech, Retail & E- Commerce 22% Tele- Communications 19% Media 15% Tenant & Employment Screening 6% Collections 5% Public Sector 4% Direct 27% Indirect 73% Financial Services (~$1.7 billion) Emerging Verticals (~$1.3 billion) Consumer Interactive (~$0.6 billion) Business Mix Details
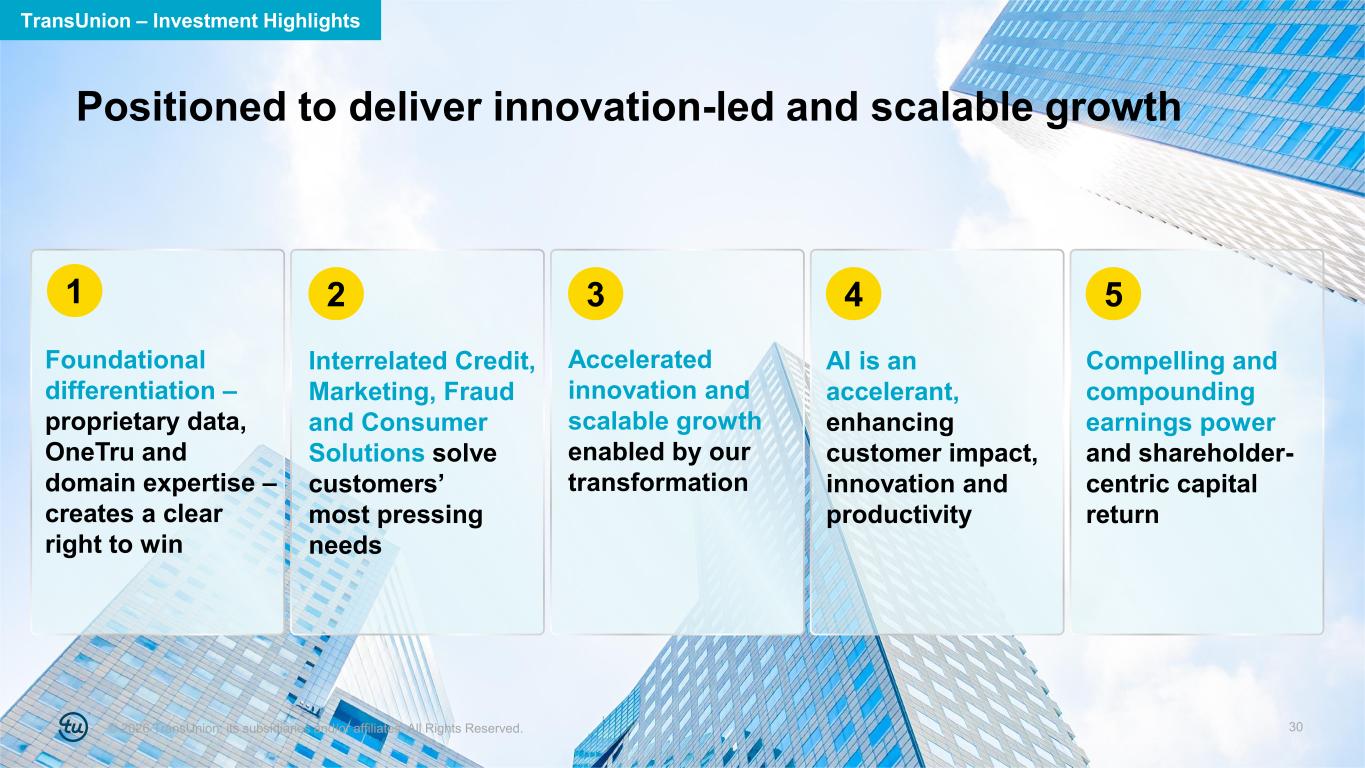
© 2026 TransUnion, its subsidiaries and/or affiliates. All Rights Reserved. 30 Foundational differentiation – proprietary data, OneTru and domain expertise – creates a clear right to win 1 Interrelated Credit, Marketing, Fraud and Consumer Solutions solve customers’ most pressing needs 2 Accelerated innovation and scalable growth enabled by our transformation 3 4 AI is an accelerant, enhancing customer impact, innovation and productivity 5 Compelling and compounding earnings power and shareholder- centric capital return Positioned to deliver innovation-led and scalable growth 30 TransUnion – Investment Highlights
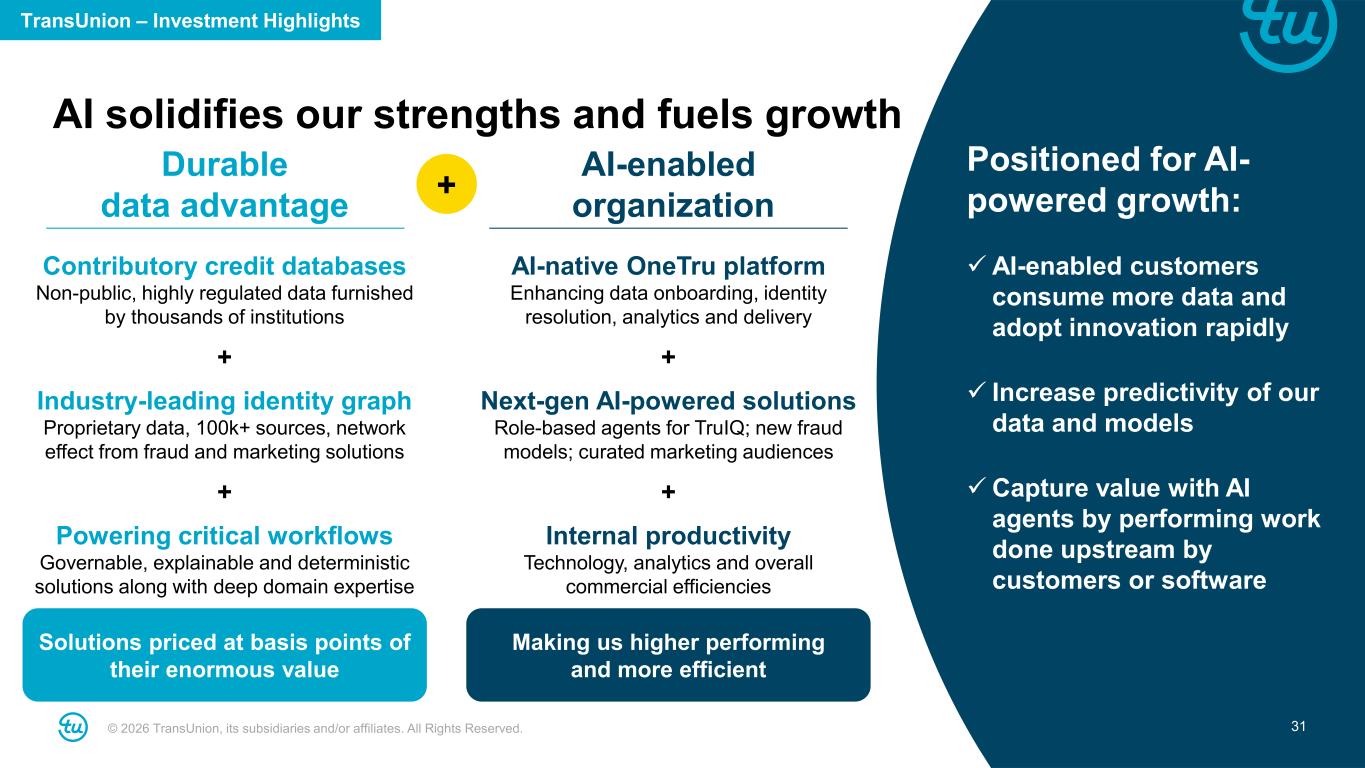
© 2026 TransUnion, its subsidiaries and/or affiliates. All Rights Reserved. 3131 AI solidifies our strengths and fuels growth ✓AI-enabled customers consume more data and adopt innovation rapidly ✓ Increase predictivity of our data and models ✓Capture value with AI agents by performing work done upstream by customers or software Contributory credit databases Non-public, highly regulated data furnished by thousands of institutions + Industry-leading identity graph Proprietary data, 100k+ sources, network effect from fraud and marketing solutions + Powering critical workflows Governable, explainable and deterministic solutions along with deep domain expertise Durable data advantage AI-enabled organization AI-native OneTru platform Enhancing data onboarding, identity resolution, analytics and delivery + Next-gen AI-powered solutions Role-based agents for TruIQ; new fraud models; curated marketing audiences + Internal productivity Technology, analytics and overall commercial efficiencies + Solutions priced at basis points of their enormous value Making us higher performing and more efficient Positioned for AI- powered growth: TransUnion – Investment Highlights
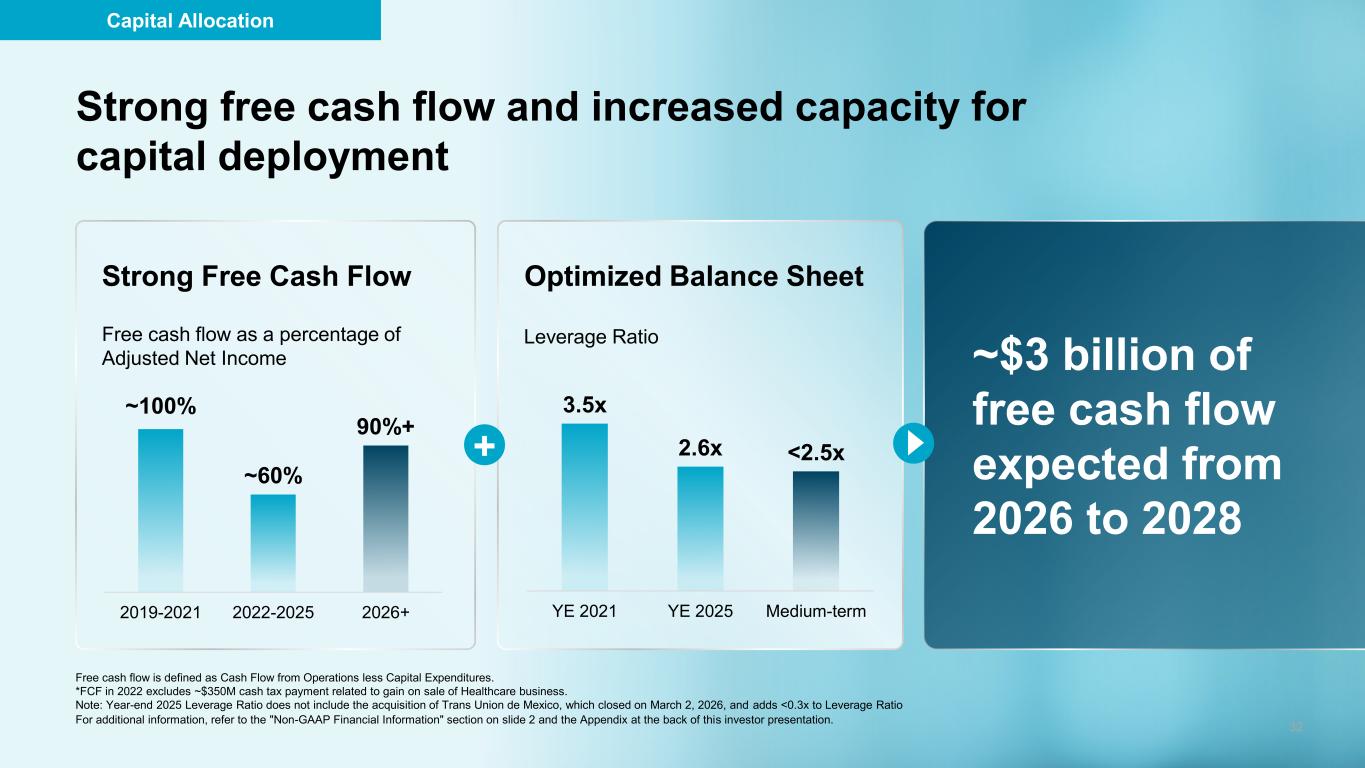
© 2026 TransUnion, its subsidiaries and/or affiliates. All Rights Reserved. 32 Free cash flow is defined as Cash Flow from Operations less Capital Expenditures. *FCF in 2022 excludes ~$350M cash tax payment related to gain on sale of Healthcare business. Note: Year-end 2025 Leverage Ratio does not include the acquisition of Trans Union de Mexico, which closed on March 2, 2026, and adds <0.3x to Leverage Ratio ~100% ~60% 90%+ 2019-2021 2022-2025 2026+ 3.5x 2.6x <2.5x YE 2021 YE 2025 Medium-term Strong Free Cash Flow Optimized Balance Sheet + Free cash flow as a percentage of Adjusted Net Income Leverage Ratio ~$3 billion of free cash flow expected from 2026 to 2028 Strong free cash flow and increased capacity for capital deployment For additional information, refer to the "Non-GAAP Financial Information" section on slide 2 and the Appendix at the back of this investor presentation. 32 Capital Allocation
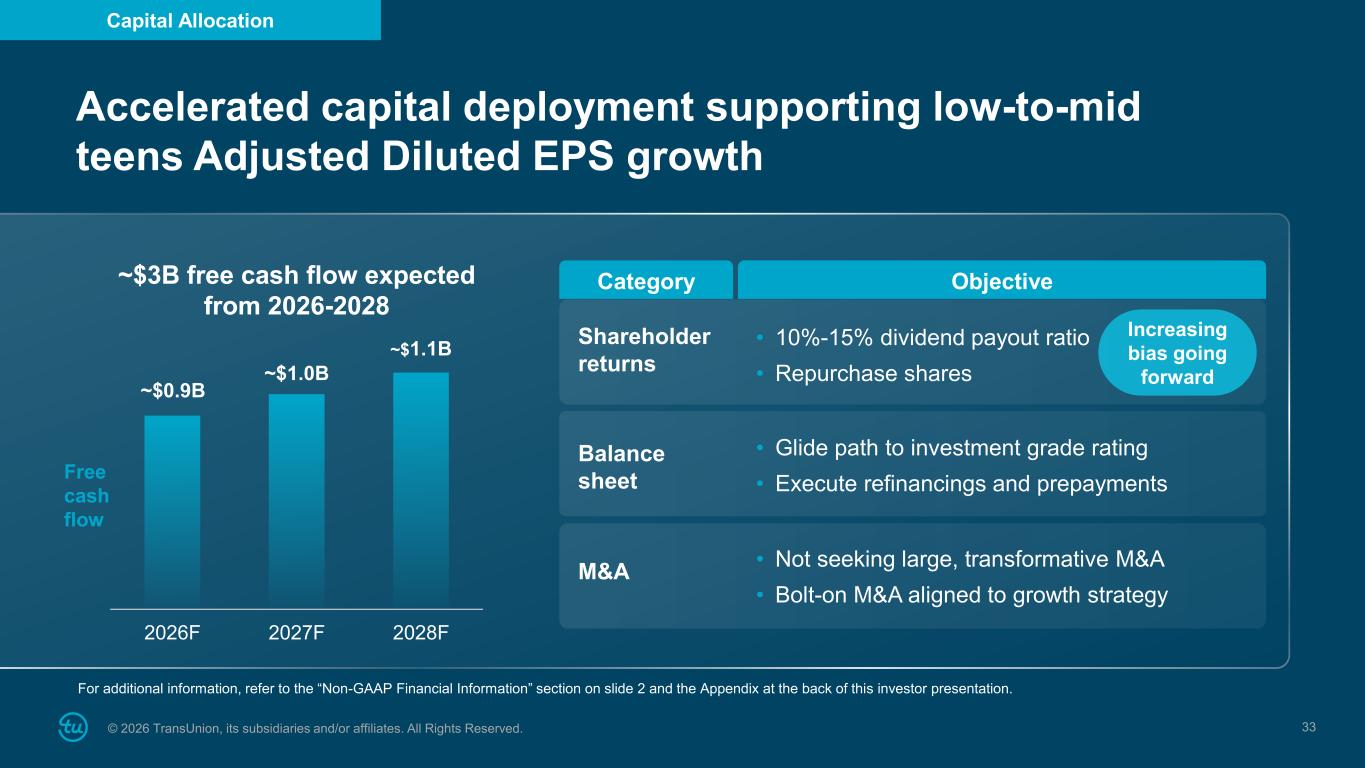
© 2026 TransUnion, its subsidiaries and/or affiliates. All Rights Reserved. 33 For additional information, refer to the “Non-GAAP Financial Information” section on slide 2 and the Appendix at the back of this investor presentation. Increasing bias going forward ~$3B free cash flow expected from 2026-2028 2026F 2027F 2028F ~$0.9B ~$1.0B ~$1.1B Free cash flow ObjectiveCategory Shareholder returns Balance sheet M&A • Not seeking large, transformative M&A • Bolt-on M&A aligned to growth strategy • Glide path to investment grade rating • Execute refinancings and prepayments • 10%-15% dividend payout ratio • Repurchase shares Accelerated capital deployment supporting low-to-mid teens Adjusted Diluted EPS growth Capital Allocation
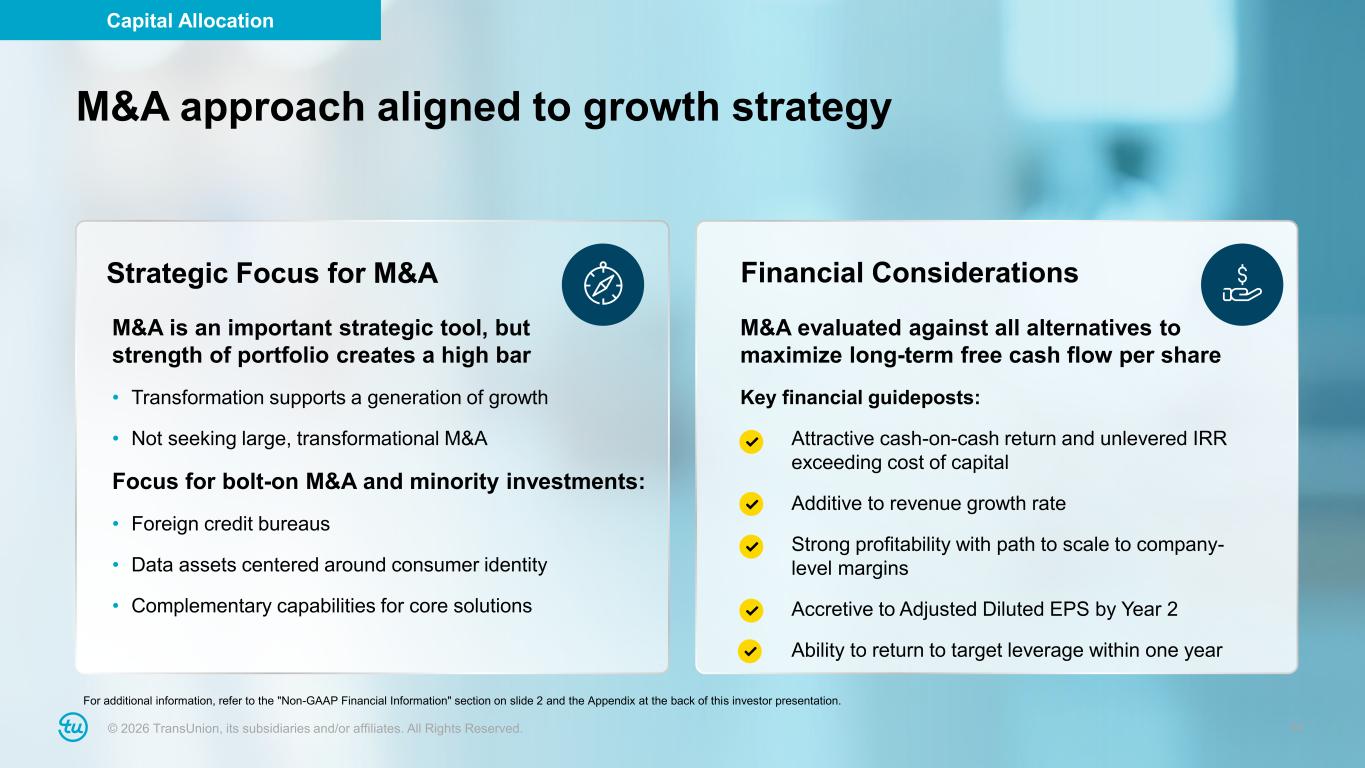
© 2026 TransUnion, its subsidiaries and/or affiliates. All Rights Reserved. 34 Strategic Focus for M&A Financial Considerations M&A is an important strategic tool, but strength of portfolio creates a high bar • Transformation supports a generation of growth • Not seeking large, transformational M&A Focus for bolt-on M&A and minority investments: • Foreign credit bureaus • Data assets centered around consumer identity • Complementary capabilities for core solutions M&A evaluated against all alternatives to maximize long-term free cash flow per share Key financial guideposts: Attractive cash-on-cash return and unlevered IRR exceeding cost of capital Additive to revenue growth rate Strong profitability with path to scale to company- level margins Accretive to Adjusted Diluted EPS by Year 2 Ability to return to target leverage within one year M&A approach aligned to growth strategy For additional information, refer to the "Non-GAAP Financial Information" section on slide 2 and the Appendix at the back of this investor presentation. 34 Capital Allocation
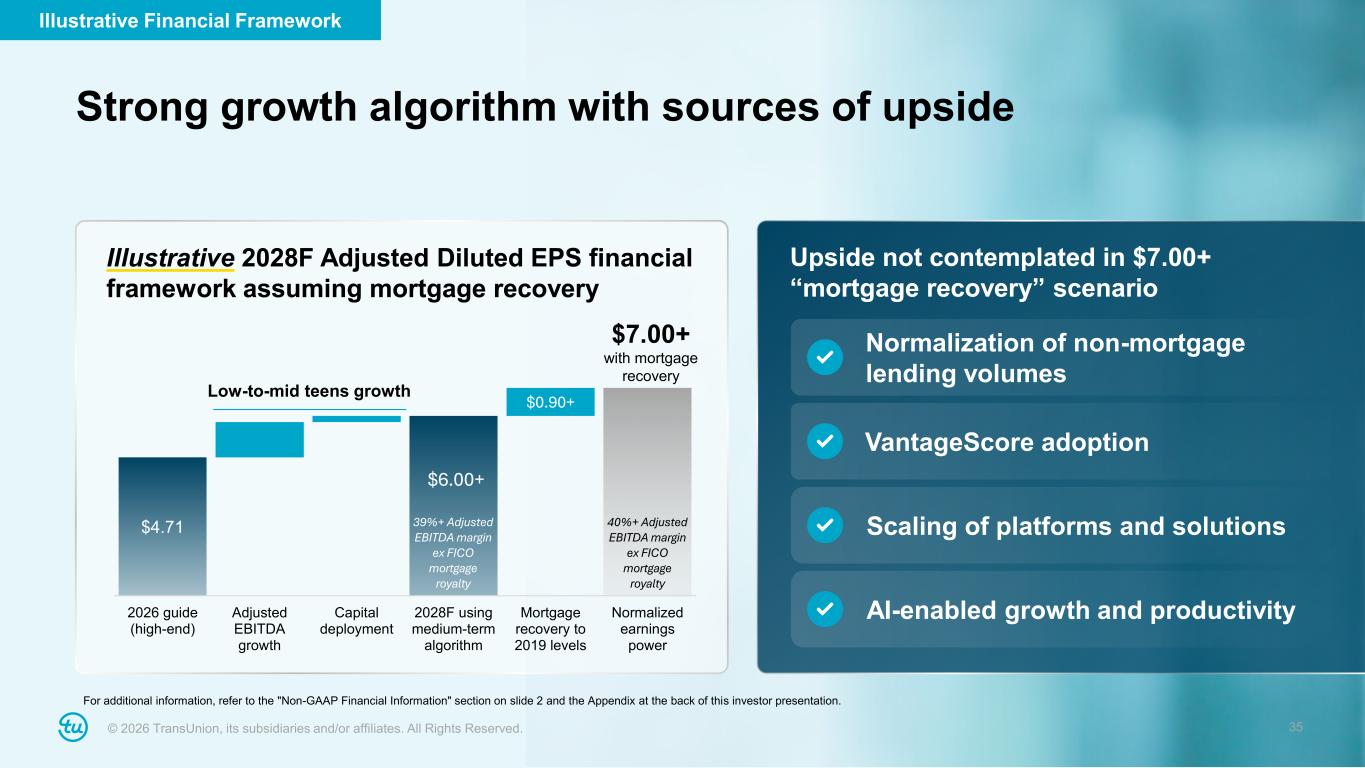
© 2026 TransUnion, its subsidiaries and/or affiliates. All Rights Reserved. 35 Low-to-mid teens growth $4.71 $0.90+ 2026 guide (high-end) Adjusted EBITDA growth Capital deployment 2028F using medium-term algorithm Mortgage recovery to 2019 levels Normalized earnings power $6.00+ 39%+ Adjusted EBITDA margin ex FICO mortgage royalty 40%+ Adjusted EBITDA margin ex FICO mortgage royalty $7.00+ with mortgage recovery Illustrative 2028F Adjusted Diluted EPS financial framework assuming mortgage recovery Upside not contemplated in $7.00+ “mortgage recovery” scenario Normalization of non-mortgage lending volumes VantageScore adoption Scaling of platforms and solutions Strong growth algorithm with sources of upside For additional information, refer to the "Non-GAAP Financial Information" section on slide 2 and the Appendix at the back of this investor presentation. 35 AI-enabled growth and productivity Illustrative Financial Framework
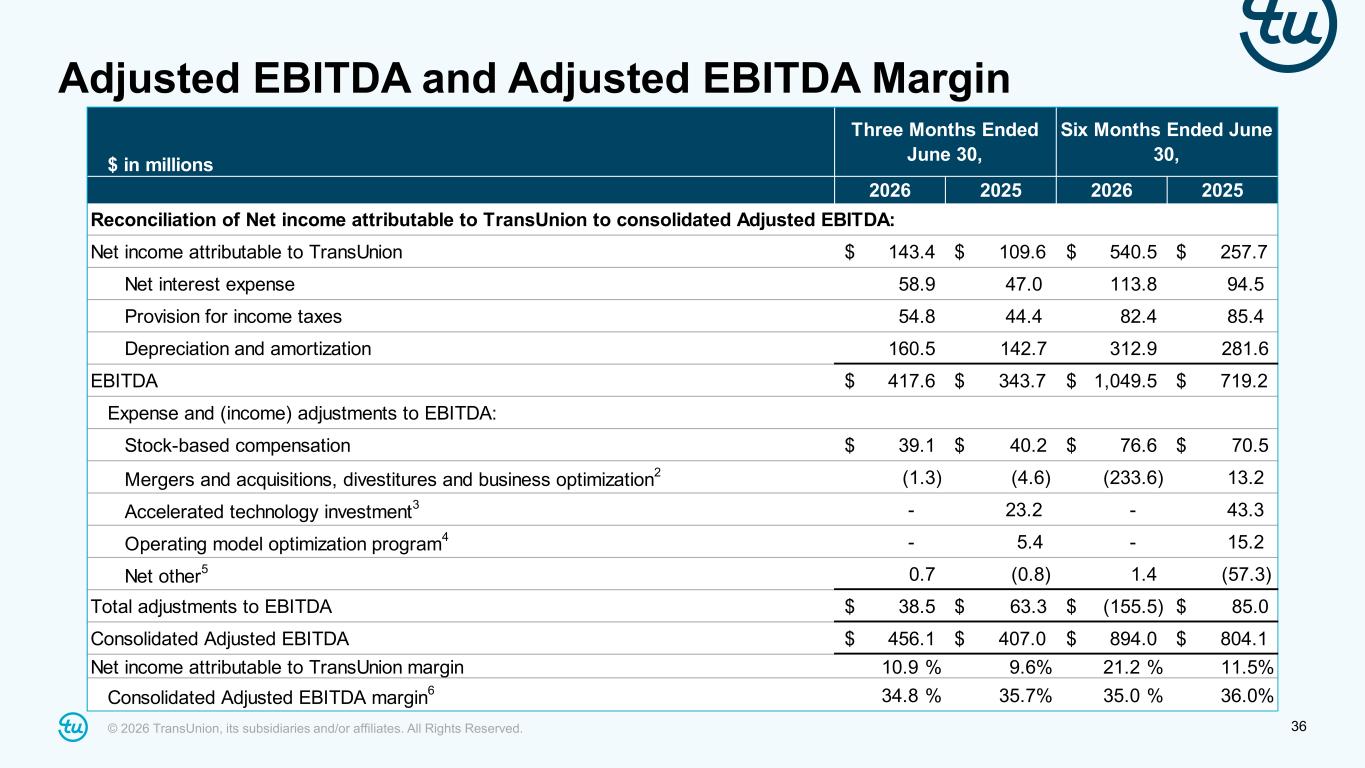
© 2026 TransUnion, its subsidiaries and/or affiliates. All Rights Reserved. 36 Adjusted EBITDA and Adjusted EBITDA Margin $ in millions 2026 2025 2026 2025 Reconciliation of Net income attributable to TransUnion to consolidated Adjusted EBITDA: Net income attributable to TransUnion 143.4$ $ 109.6 540.5$ $ 257.7 Net interest expense 58.9 47.0 113.8 94.5 Provision for income taxes 54.8 44.4 82.4 85.4 Depreciation and amortization 160.5 142.7 312.9 281.6 EBITDA 417.6$ $ 343.7 1,049.5$ $ 719.2 Expense and (income) adjustments to EBITDA: Stock-based compensation 39.1$ $ 40.2 76.6$ $ 70.5 Mergers and acquisitions, divestitures and business optimization 2 (1.3) (4.6) (233.6) 13.2 Accelerated technology investment 3 - 23.2 - 43.3 Operating model optimization program 4 - 5.4 - 15.2 Net other 5 0.7 (0.8) 1.4 (57.3) Total adjustments to EBITDA 38.5$ $ 63.3 (155.5)$ $ 85.0 Consolidated Adjusted EBITDA 456.1$ $ 407.0 894.0$ $ 804.1 Net income attributable to TransUnion margin 10.9 % 9.6% 21.2 % 11.5% Consolidated Adjusted EBITDA margin 6 34.8 % 35.7% 35.0 % 36.0% Three Months Ended June 30, Six Months Ended June 30,
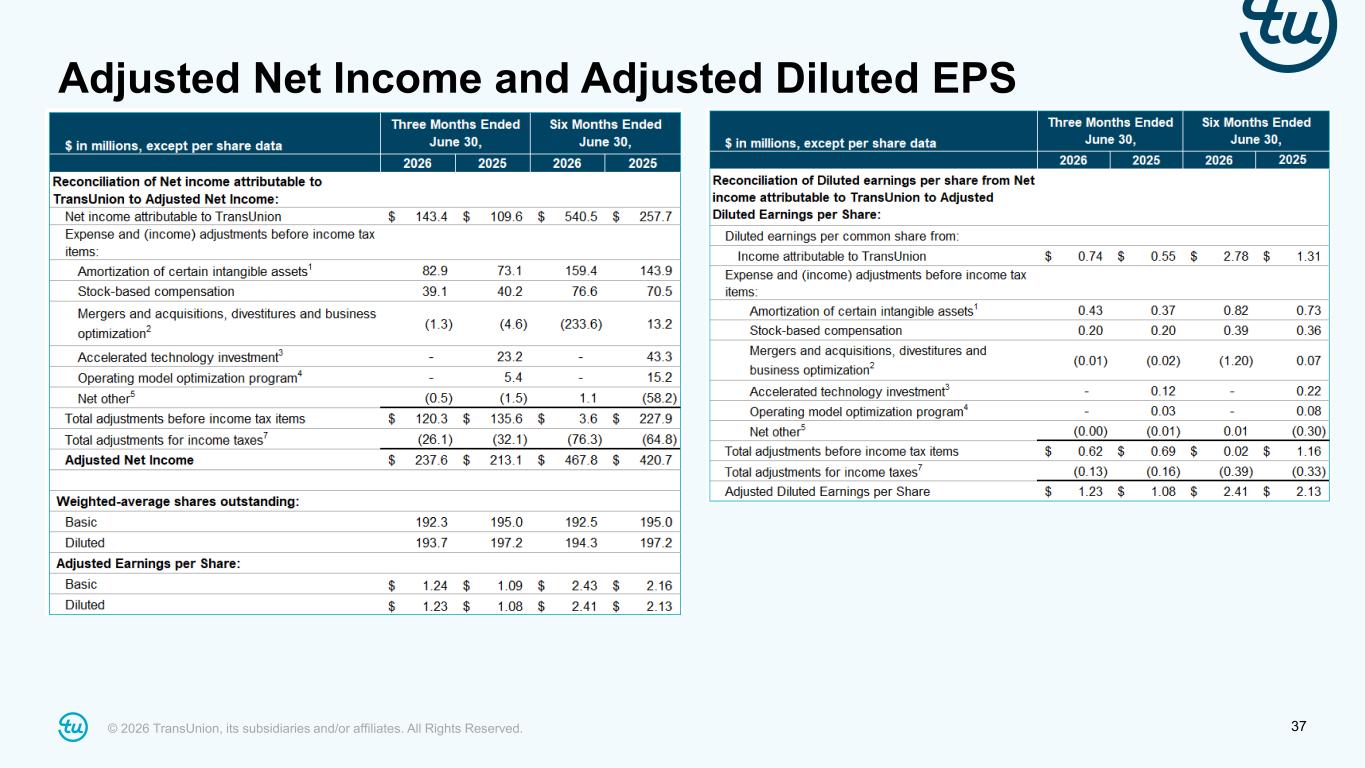
© 2026 TransUnion, its subsidiaries and/or affiliates. All Rights Reserved. 37 Adjusted Net Income and Adjusted Diluted EPS
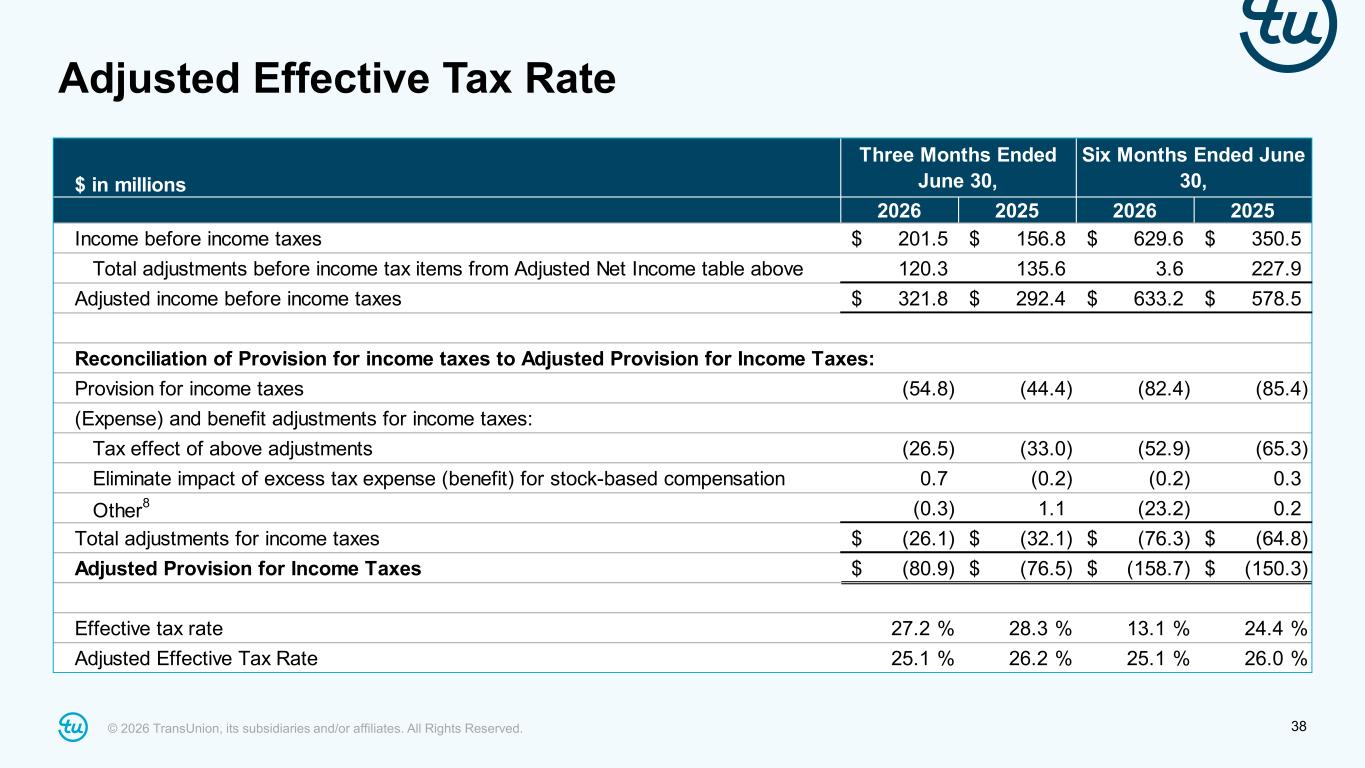
© 2026 TransUnion, its subsidiaries and/or affiliates. All Rights Reserved. 38 Adjusted Effective Tax Rate $ in millions 2026 2025 2026 2025 Income before income taxes 201.5$ 156.8$ 629.6$ 350.5$ Total adjustments before income tax items from Adjusted Net Income table above 120.3 135.6 3.6 227.9 Adjusted income before income taxes 321.8$ 292.4$ 633.2$ 578.5$ Reconciliation of Provision for income taxes to Adjusted Provision for Income Taxes: Provision for income taxes (54.8) (44.4) (82.4) (85.4) (Expense) and benefit adjustments for income taxes: Tax effect of above adjustments (26.5) (33.0) (52.9) (65.3) Eliminate impact of excess tax expense (benefit) for stock-based compensation 0.7 (0.2) (0.2) 0.3 Other 8 (0.3) 1.1 (23.2) 0.2 Total adjustments for income taxes (26.1)$ (32.1)$ (76.3)$ (64.8)$ Adjusted Provision for Income Taxes (80.9)$ (76.5)$ (158.7)$ (150.3)$ Effective tax rate 27.2 % 28.3 % 13.1 % 24.4 % Adjusted Effective Tax Rate 25.1 % 26.2 % 25.1 % 26.0 % Three Months Ended June 30, Six Months Ended June 30,
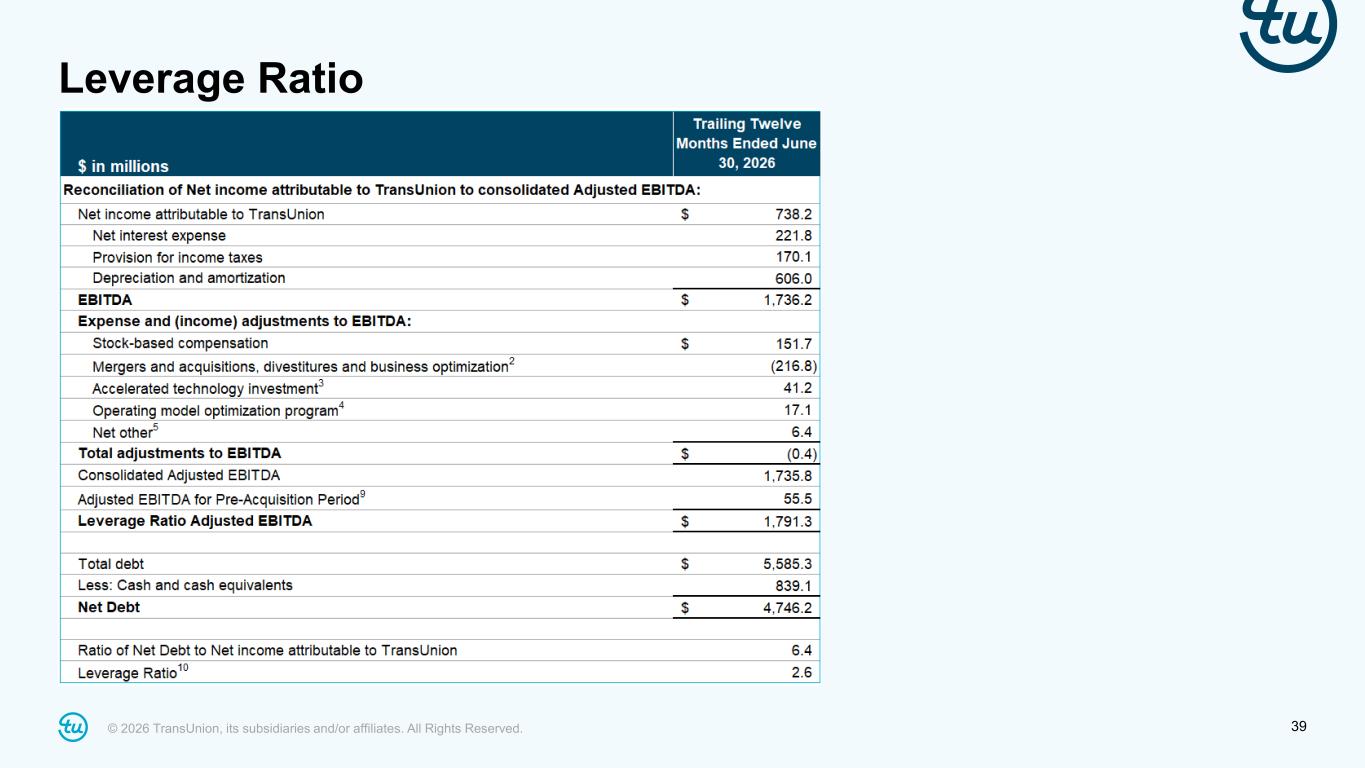
© 2026 TransUnion, its subsidiaries and/or affiliates. All Rights Reserved. 39 Leverage Ratio
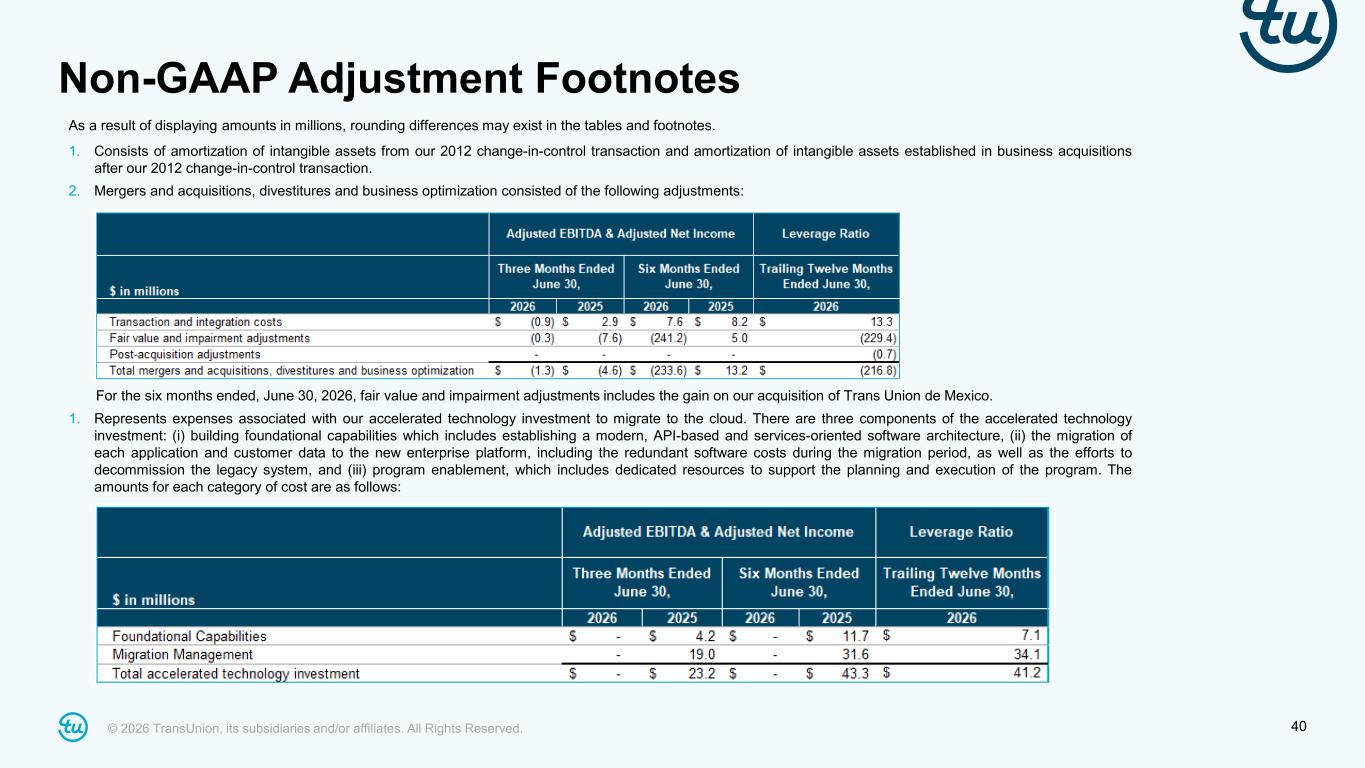
© 2026 TransUnion, its subsidiaries and/or affiliates. All Rights Reserved. 40 Non-GAAP Adjustment Footnotes As a result of displaying amounts in millions, rounding differences may exist in the tables and footnotes. 1. Consists of amortization of intangible assets from our 2012 change-in-control transaction and amortization of intangible assets established in business acquisitions after our 2012 change-in-control transaction. 2. Mergers and acquisitions, divestitures and business optimization consisted of the following adjustments: For the six months ended, June 30, 2026, fair value and impairment adjustments includes the gain on our acquisition of Trans Union de Mexico. 1. Represents expenses associated with our accelerated technology investment to migrate to the cloud. There are three components of the accelerated technology investment: (i) building foundational capabilities which includes establishing a modern, API-based and services-oriented software architecture, (ii) the migration of each application and customer data to the new enterprise platform, including the redundant software costs during the migration period, as well as the efforts to decommission the legacy system, and (iii) program enablement, which includes dedicated resources to support the planning and execution of the program. The amounts for each category of cost are as follows:
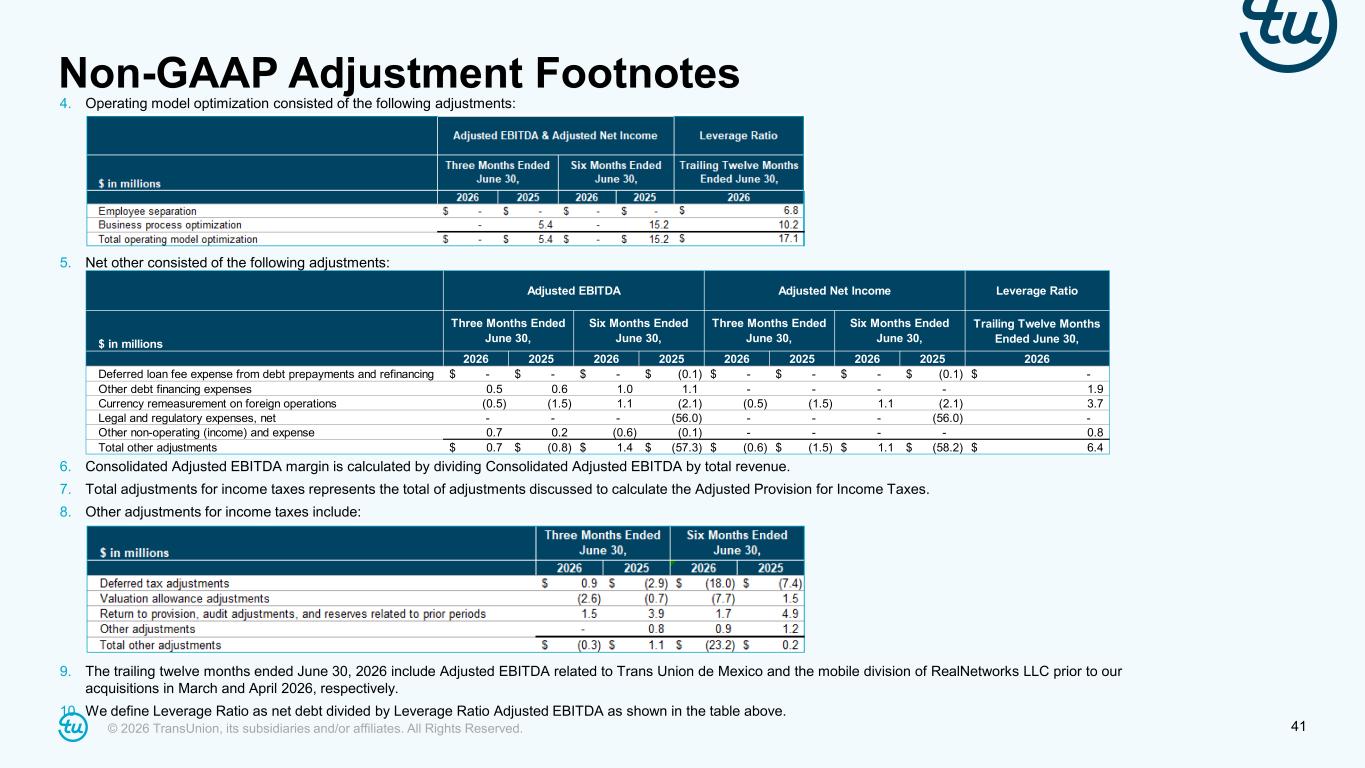
© 2026 TransUnion, its subsidiaries and/or affiliates. All Rights Reserved. 41 Non-GAAP Adjustment Footnotes 4. Operating model optimization consisted of the following adjustments: 5. Net other consisted of the following adjustments: 6. Consolidated Adjusted EBITDA margin is calculated by dividing Consolidated Adjusted EBITDA by total revenue. 7. Total adjustments for income taxes represents the total of adjustments discussed to calculate the Adjusted Provision for Income Taxes. 8. Other adjustments for income taxes include: 9. The trailing twelve months ended June 30, 2026 include Adjusted EBITDA related to Trans Union de Mexico and the mobile division of RealNetworks LLC prior to our acquisitions in March and April 2026, respectively. 10. We define Leverage Ratio as net debt divided by Leverage Ratio Adjusted EBITDA as shown in the table above. Leverage Ratio $ in millions Trailing Twelve Months Ended June 30, 2026 2025 2026 2025 2026 2025 2026 2025 2026 Deferred loan fee expense from debt prepayments and refinancing -$ -$ -$ (0.1)$ -$ -$ -$ (0.1)$ -$ Other debt financing expenses 0.5 0.6 1.0 1.1 - - - - 1.9 Currency remeasurement on foreign operations (0.5) (1.5) 1.1 (2.1) (0.5) (1.5) 1.1 (2.1) 3.7 Legal and regulatory expenses, net - - - (56.0) - - - (56.0) - Other non-operating (income) and expense 0.7 0.2 (0.6) (0.1) - - - - 0.8 Total other adjustments 0.7$ (0.8)$ 1.4$ (57.3)$ (0.6)$ (1.5)$ 1.1$ (58.2)$ 6.4$ Six Months Ended June 30, Three Months Ended June 30, Adjusted Net IncomeAdjusted EBITDA Three Months Ended June 30, Six Months Ended June 30,
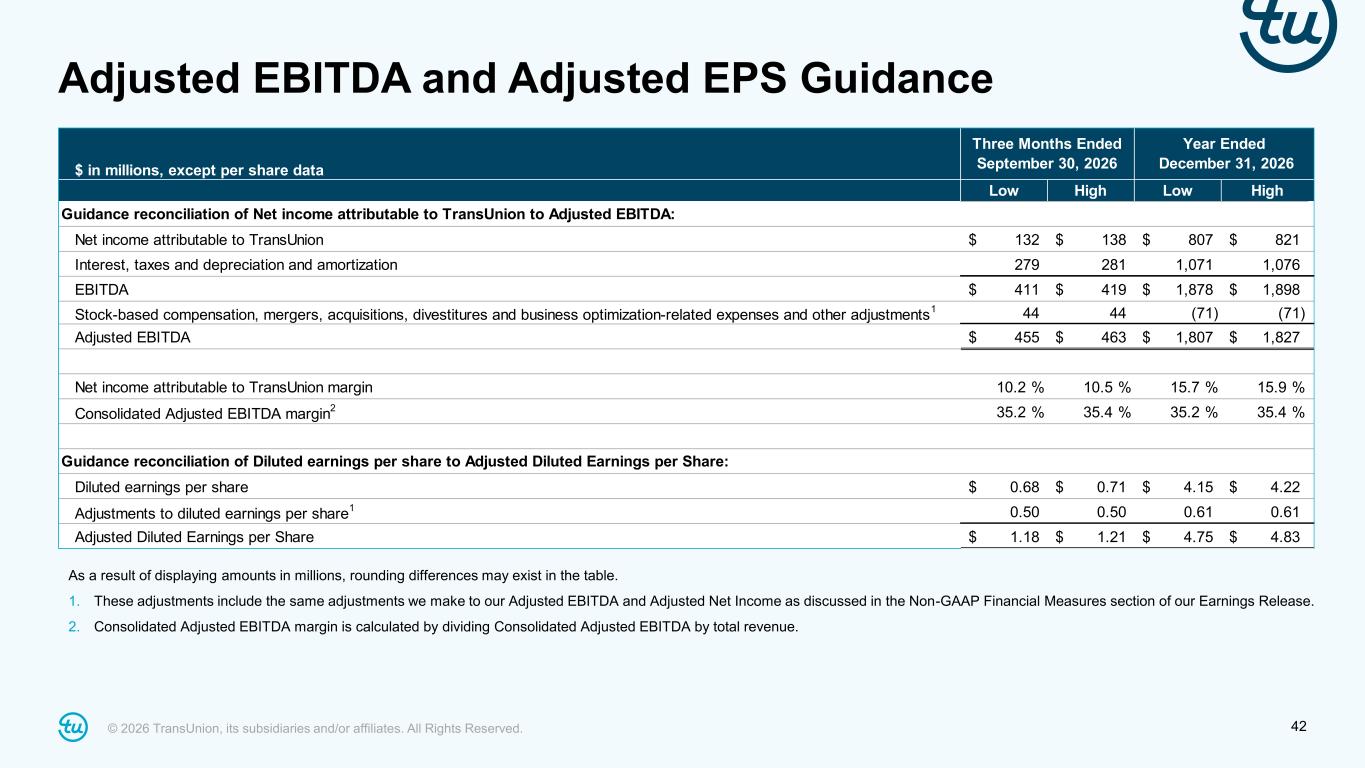
© 2026 TransUnion, its subsidiaries and/or affiliates. All Rights Reserved. 42 Adjusted EBITDA and Adjusted EPS Guidance As a result of displaying amounts in millions, rounding differences may exist in the table. 1. These adjustments include the same adjustments we make to our Adjusted EBITDA and Adjusted Net Income as discussed in the Non-GAAP Financial Measures section of our Earnings Release. 2. Consolidated Adjusted EBITDA margin is calculated by dividing Consolidated Adjusted EBITDA by total revenue. $ in millions, except per share data Low High Low Guidance reconciliation of Net income attributable to TransUnion to Adjusted EBITDA: Net income attributable to TransUnion 132$ 138$ 807$ 821$ Interest, taxes and depreciation and amortization 279 281 1,071 1,076 EBITDA 411$ 419$ 1,878$ 1,898$ Stock-based compensation, mergers, acquisitions, divestitures and business optimization-related expenses and other adjustments 1 44 44 (71) (71) Adjusted EBITDA 455$ 463$ 1,807$ 1,827$ Net income attributable to TransUnion margin 10.2 % 10.5 % 15.7 % 15.9 % Consolidated Adjusted EBITDA margin 2 35.2 % 35.4 % 35.2 % 35.4 % Guidance reconciliation of Diluted earnings per share to Adjusted Diluted Earnings per Share: Diluted earnings per share 0.68$ 0.71$ 4.15$ 4.22$ Adjustments to diluted earnings per share 1 0.50 0.50 0.61 0.61 Adjusted Diluted Earnings per Share 1.18$ 1.21$ 4.75$ 4.83$ Three Months Ended September 30, 2026 Year Ended December 31, 2026 High