1 https://ford.to/facebook https://x.com/ford https://ford.to/linkedin Ford Reports Second-Quarter 2026 Financial Results; Raises Full-Year Guidance • Second-quarter revenue of $48.3 billion, down $1.9 billion year-over-year; net loss of $1.3 billion, down $1.3 billion year-over-year, adjusted EBIT of $2.5 billion, up $0.4 billion year-over-year. As expected, the net loss includes a $3.6 billion largely non-cash special item charge tied to the previously announced disposition of the BlueOval SK (BOSK) joint venture • Operating cash flow of $4.3 billion; adjusted free cash flow of $2.1 billion • Company declares a third-quarter regular dividend of 15 cents per share • Company raises full-year adjusted EBIT guidance to $10 billion to $11 billion (from $8.5 billion to $10.5 billion) and adjusted free cash flow to $6.0 billion to $7.0 billion (from $5.0 billion to $6.0 billion) DEARBORN, Mich., July 28, 2026 – Ford Motor Company (NYSE: F) today announced its second-quarter 2026 financial results. “We delivered another strong quarter and raised our full-year guidance, but the more important story is the growing evidence that Ford is becoming a more profitable, more disciplined and genuinely different company,” said Ford President and CEO Jim Farley. “Our iconic trucks, off-roaders and hybrids are commanding real pricing power; our quality is now industry-leading in the U.S.; and profitable new adjacencies, such as Ford Energy, are opening fresh sources of growth.” “Ford delivered another solid quarter, reflecting a resilient underlying business and disciplined execution,” said CFO Sherry House. “Our team is improving the way we operate — sharpening our industrial system, fundamentally reducing costs, and partnering in global markets for speed and efficiency. We are not just executing to plan; we are building a company able to perform through a wide range of uncertainties, and that gives us confidence in the earnings power we’re creating.”
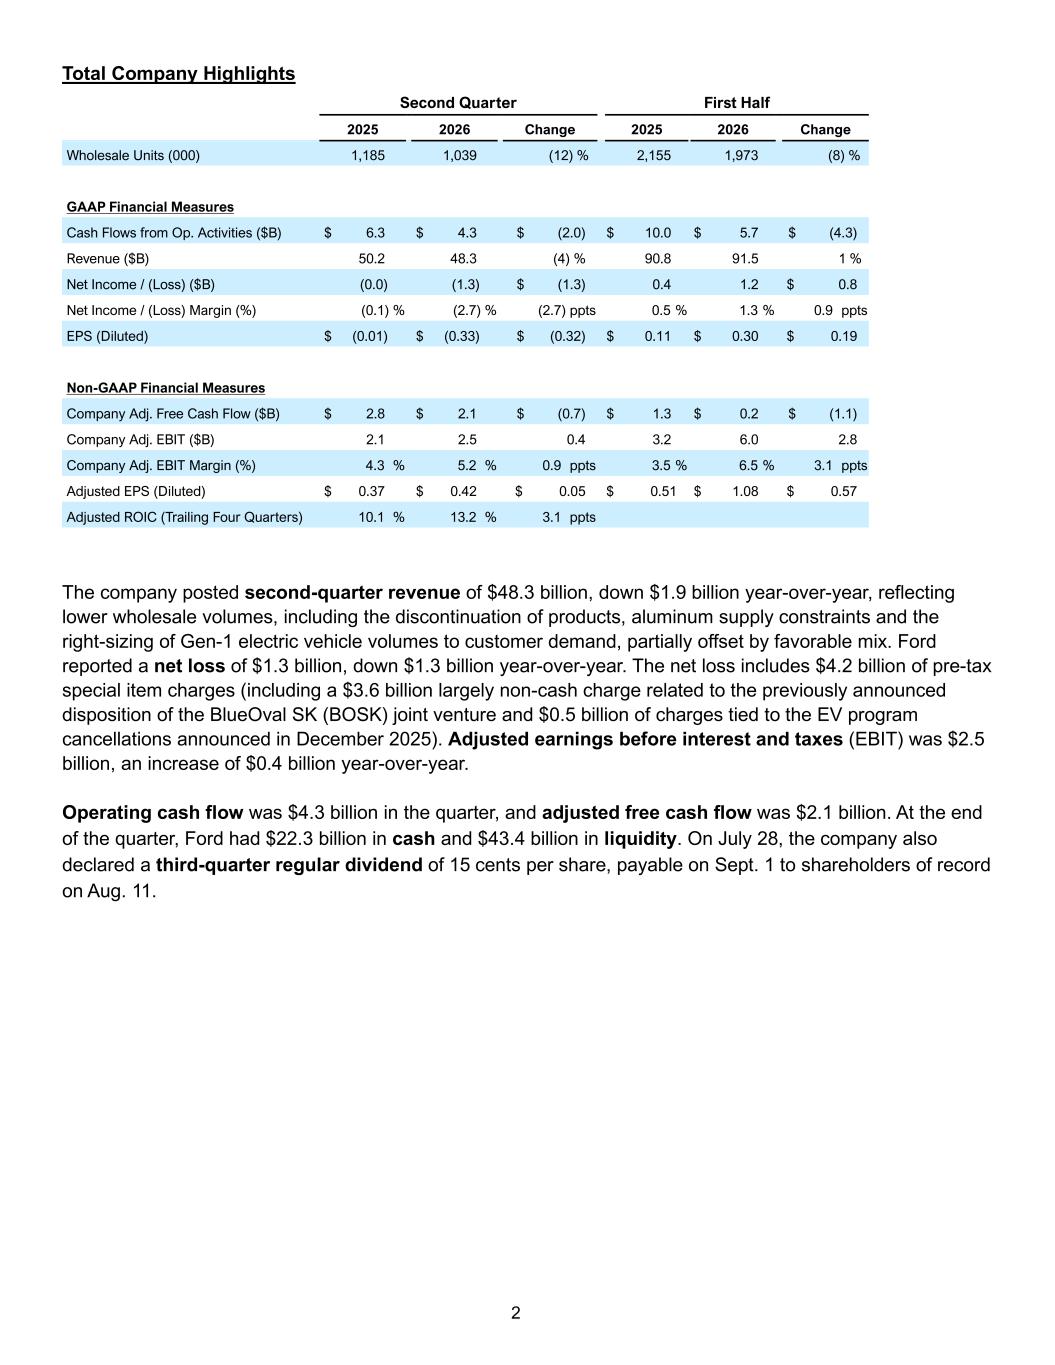
2 Total Company Highlights Second Quarter First Half 2025 2026 Change 2025 2026 Change Wholesale Units (000) 1,185 1,039 (12) % 2,155 1,973 (8) % GAAP Financial Measures Cash Flows from Op. Activities ($B) $ 6.3 $ 4.3 $ (2.0) $ 10.0 $ 5.7 $ (4.3) Revenue ($B) 50.2 48.3 (4) % 90.8 91.5 1 % Net Income / (Loss) ($B) (0.0) (1.3) $ (1.3) 0.4 1.2 $ 0.8 Net Income / (Loss) Margin (%) (0.1) % (2.7) % (2.7) ppts 0.5 % 1.3 % 0.9 ppts EPS (Diluted) $ (0.01) $ (0.33) $ (0.32) $ 0.11 $ 0.30 $ 0.19 Non-GAAP Financial Measures Company Adj. Free Cash Flow ($B) $ 2.8 $ 2.1 $ (0.7) $ 1.3 $ 0.2 $ (1.1) Company Adj. EBIT ($B) 2.1 2.5 0.4 3.2 6.0 2.8 Company Adj. EBIT Margin (%) 4.3 % 5.2 % 0.9 ppts 3.5 % 6.5 % 3.1 ppts Adjusted EPS (Diluted) $ 0.37 $ 0.42 $ 0.05 $ 0.51 $ 1.08 $ 0.57 Adjusted ROIC (Trailing Four Quarters) 10.1 % 13.2 % 3.1 ppts The company posted second-quarter revenue of $48.3 billion, down $1.9 billion year-over-year, reflecting lower wholesale volumes, including the discontinuation of products, aluminum supply constraints and the right-sizing of Gen-1 electric vehicle volumes to customer demand, partially offset by favorable mix. Ford reported a net loss of $1.3 billion, down $1.3 billion year-over-year. The net loss includes $4.2 billion of pre-tax special item charges (including a $3.6 billion largely non-cash charge related to the previously announced disposition of the BlueOval SK (BOSK) joint venture and $0.5 billion of charges tied to the EV program cancellations announced in December 2025). Adjusted earnings before interest and taxes (EBIT) was $2.5 billion, an increase of $0.4 billion year-over-year. Operating cash flow was $4.3 billion in the quarter, and adjusted free cash flow was $2.1 billion. At the end of the quarter, Ford had $22.3 billion in cash and $43.4 billion in liquidity. On July 28, the company also declared a third-quarter regular dividend of 15 cents per share, payable on Sept. 1 to shareholders of record on Aug. 11.
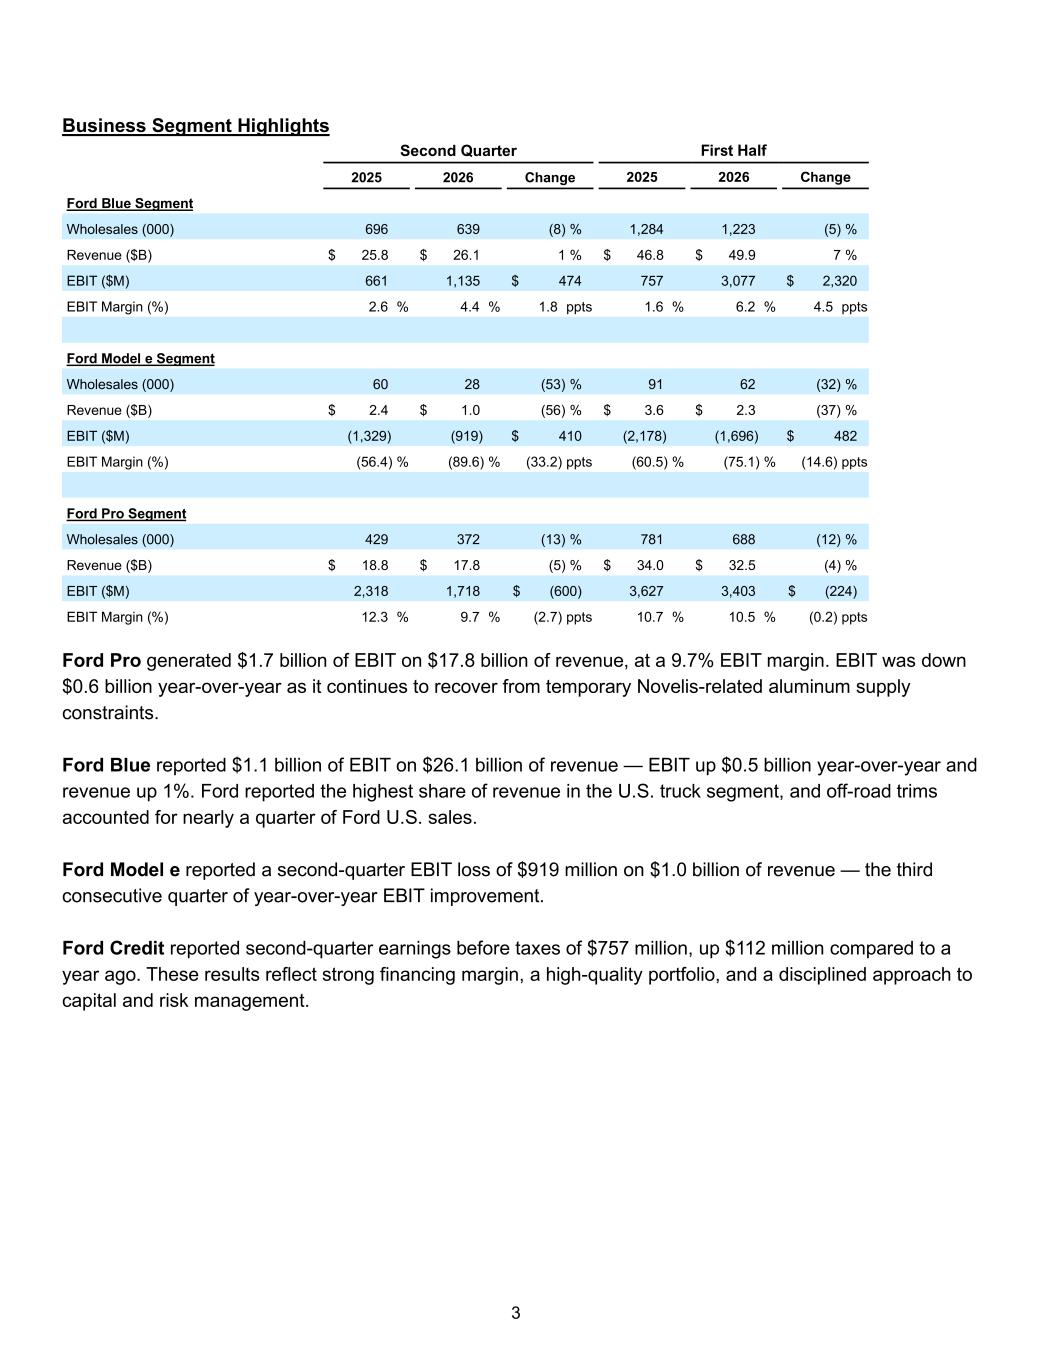
3 Business Segment Highlights Second Quarter First Half 2025 2026 Change 2025 2026 Change Ford Blue Segment Wholesales (000) 696 639 (8) % 1,284 1,223 (5) % Revenue ($B) $ 25.8 $ 26.1 1 % $ 46.8 $ 49.9 7 % EBIT ($M) 661 1,135 $ 474 757 3,077 $ 2,320 EBIT Margin (%) 2.6 % 4.4 % 1.8 ppts 1.6 % 6.2 % 4.5 ppts Ford Model e Segment Wholesales (000) 60 28 (53) % 91 62 (32) % Revenue ($B) $ 2.4 $ 1.0 (56) % $ 3.6 $ 2.3 (37) % EBIT ($M) (1,329) (919) $ 410 (2,178) (1,696) $ 482 EBIT Margin (%) (56.4) % (89.6) % (33.2) ppts (60.5) % (75.1) % (14.6) ppts Ford Pro Segment Wholesales (000) 429 372 (13) % 781 688 (12) % Revenue ($B) $ 18.8 $ 17.8 (5) % $ 34.0 $ 32.5 (4) % EBIT ($M) 2,318 1,718 $ (600) 3,627 3,403 $ (224) EBIT Margin (%) 12.3 % 9.7 % (2.7) ppts 10.7 % 10.5 % (0.2) ppts Ford Pro generated $1.7 billion of EBIT on $17.8 billion of revenue, at a 9.7% EBIT margin. EBIT was down $0.6 billion year-over-year as it continues to recover from temporary Novelis-related aluminum supply constraints. Ford Blue reported $1.1 billion of EBIT on $26.1 billion of revenue — EBIT up $0.5 billion year-over-year and revenue up 1%. Ford reported the highest share of revenue in the U.S. truck segment, and off-road trims accounted for nearly a quarter of Ford U.S. sales. Ford Model e reported a second-quarter EBIT loss of $919 million on $1.0 billion of revenue — the third consecutive quarter of year-over-year EBIT improvement. Ford Credit reported second-quarter earnings before taxes of $757 million, up $112 million compared to a year ago. These results reflect strong financing margin, a high-quality portfolio, and a disciplined approach to capital and risk management.
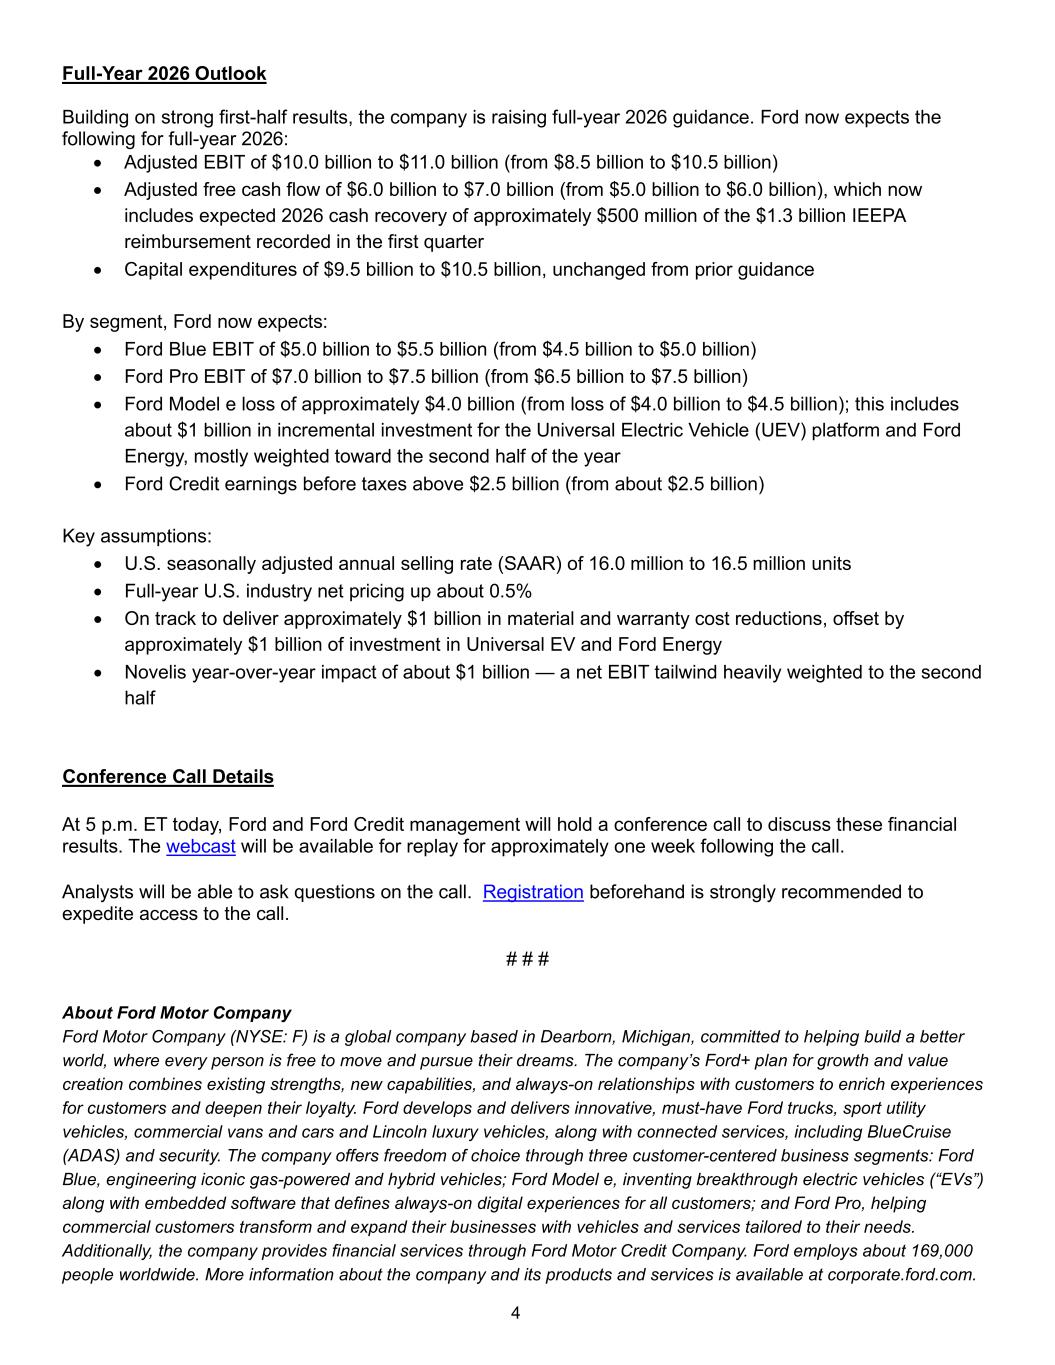
4 Full-Year 2026 Outlook Building on strong first-half results, the company is raising full-year 2026 guidance. Ford now expects the following for full-year 2026: • Adjusted EBIT of $10.0 billion to $11.0 billion (from $8.5 billion to $10.5 billion) • Adjusted free cash flow of $6.0 billion to $7.0 billion (from $5.0 billion to $6.0 billion), which now includes expected 2026 cash recovery of approximately $500 million of the $1.3 billion IEEPA reimbursement recorded in the first quarter • Capital expenditures of $9.5 billion to $10.5 billion, unchanged from prior guidance By segment, Ford now expects: • Ford Blue EBIT of $5.0 billion to $5.5 billion (from $4.5 billion to $5.0 billion) • Ford Pro EBIT of $7.0 billion to $7.5 billion (from $6.5 billion to $7.5 billion) • Ford Model e loss of approximately $4.0 billion (from loss of $4.0 billion to $4.5 billion); this includes about $1 billion in incremental investment for the Universal Electric Vehicle (UEV) platform and Ford Energy, mostly weighted toward the second half of the year • Ford Credit earnings before taxes above $2.5 billion (from about $2.5 billion) Key assumptions: • U.S. seasonally adjusted annual selling rate (SAAR) of 16.0 million to 16.5 million units • Full-year U.S. industry net pricing up about 0.5% • On track to deliver approximately $1 billion in material and warranty cost reductions, offset by approximately $1 billion of investment in Universal EV and Ford Energy • Novelis year-over-year impact of about $1 billion — a net EBIT tailwind heavily weighted to the second half Conference Call Details At 5 p.m. ET today, Ford and Ford Credit management will hold a conference call to discuss these financial results. The webcast will be available for replay for approximately one week following the call. Analysts will be able to ask questions on the call. Registration beforehand is strongly recommended to expedite access to the call. # # # About Ford Motor Company Ford Motor Company (NYSE: F) is a global company based in Dearborn, Michigan, committed to helping build a better world, where every person is free to move and pursue their dreams. The company’s Ford+ plan for growth and value creation combines existing strengths, new capabilities, and always-on relationships with customers to enrich experiences for customers and deepen their loyalty. Ford develops and delivers innovative, must-have Ford trucks, sport utility vehicles, commercial vans and cars and Lincoln luxury vehicles, along with connected services, including BlueCruise (ADAS) and security. The company offers freedom of choice through three customer-centered business segments: Ford Blue, engineering iconic gas-powered and hybrid vehicles; Ford Model e, inventing breakthrough electric vehicles (“EVs”) along with embedded software that defines always-on digital experiences for all customers; and Ford Pro, helping commercial customers transform and expand their businesses with vehicles and services tailored to their needs. Additionally, the company provides financial services through Ford Motor Credit Company. Ford employs about 169,000 people worldwide. More information about the company and its products and services is available at corporate.ford.com.
5 Contacts Media David Tovar 1.773.682.7954 dtovar9@ford.com Equity Investment Maria Ricciardone 1.248.510.9092 mariar@ford.com Fixed Income Investment Sean Moore 1.313.248.1587 smoor192@ford.com Shareholder Inquiries 1.800.555.5259 or 1.313.845.8540 fordir@ford.com The following applies to the information throughout this release: • See tables later in this release for the nature and amount of special items, and reconciliations of the non-GAAP financial measures designated as “adjusted” to the most comparable financial measures calculated in accordance with U.S. generally accepted accounting principles (“GAAP”). • Wholesale unit and production volumes include Ford and Lincoln brand vehicles produced and sold by Ford or our unconsolidated affiliates and Jiangling Motors Corporation (“JMC”) brand vehicles produced and sold in China by our unconsolidated affiliate. Revenue does not include vehicles produced and sold by our unconsolidated affiliates. Wholesales and revenue exclude transactions between the Ford Blue, Ford Model e and Ford Pro business segments. • Reported “cash” includes cash, cash equivalents, marketable securities and restricted cash (including cash held for sale), excluding Ford Credit’s cash, cash equivalents, marketable securities and restricted cash. • The guidance is based on our expectations and best estimates as of July 28, 2026, and assumes no material change to our current assumptions for inflation, logistics issues, production, or macroeconomic conditions. Our guidance does not include potential impacts of a significant escalation in the Middle East or a material downturn in the U.S. economy, which could have a substantial impact on industry demand. Moreover, our guidance has not factored in any new policy changes by the administration in the United States, including future or revised tariffs or related offsets, that have not been announced or tariffs or other policy changes that may be announced by other governments after the date hereof. Cautionary Note on Forward-Looking Statements Statements included or incorporated by reference herein may constitute “forward-looking statements” within the meaning of the Private Securities Litigation Reform Act of 1995. Forward-looking statements are based on expectations, forecasts, and assumptions by our management and involve a number of risks, uncertainties, and other factors that could cause actual results to differ materially from those stated, including, without limitation: • Ford’s long-term success depends on delivering the Ford+ plan, including improving cost competitiveness; • Ford’s products have been and could continue to be affected by defects that result in recall campaigns, increased warranty costs, or delays in new model launches, and the time it takes to improve the quality of our products and services and reduce the costs associated therewith could continue to have an adverse effect on our business; • Ford is highly dependent on its suppliers to deliver components in accordance with Ford’s production schedule and specifications, and a shortage of or inability to timely acquire key components or raw materials has previously disrupted and may, in the future, disrupt Ford’s operations; • Ford’s production, as well as Ford’s suppliers’ production, and/or the ability to deliver products to consumers could be disrupted by labor issues, public health issues, natural or man-made disasters, adverse effects of climate change, financial distress, production difficulties, capacity limitations, or other factors;
6 • Ford may not realize the anticipated benefits of existing or pending strategic alliances, joint ventures, acquisitions, divestitures, commercial relationships, or business strategies or the benefits may take longer than expected to materialize; • Ford may not realize the anticipated benefits of restructuring actions and such actions may cause Ford to incur significant charges, disrupt our operations, or harm our reputation; • Failure to develop and deploy secure digital services that appeal to customers, retain existing subscribers, and grow our subscription rates could have a negative impact on Ford’s business; • Ford’s ability to maintain a competitive cost structure could be affected by labor or other constraints; • Ford’s ability to attract, develop, grow, support, and reward talent is critical to its success and competitiveness; • Operational information systems, security systems, products, and services could be affected by cybersecurity incidents, ransomware attacks, and other disruptions and impact Ford, Ford Credit, their suppliers, and dealers; • To facilitate access to the raw materials and other components necessary for the manufacture of electrified products, Ford has entered into and may, in the future, enter into multi-year commitments to raw material and other suppliers that subject Ford to risks associated with lower future demand for such items as well as costs that fluctuate and are difficult to accurately forecast; • With a global footprint and supply chain, Ford’s results and operations have been and could continue to be adversely affected by economic or geopolitical developments, including protectionist trade policies such as tariffs, or other events; • Ford’s new and existing products and digital, software, and physical services are subject to market acceptance and face significant competition from existing and new entrants in the automotive and digital and software services industries, and Ford’s reputation may be harmed based on positions it takes or if it is unable to achieve the initiatives it has announced; • Ford may face increased price competition for its products and services, including pricing pressure resulting from industry excess capacity, currency fluctuations, competitive actions, legal and policy changes, or economic or other factors, particularly for electrified vehicles; • Inflationary pressure and fluctuations in commodity and energy prices, foreign currency exchange rates, interest rates, and market value of Ford or Ford Credit’s investments, including marketable securities, can have a significant effect on results; • Ford’s results are dependent on sales of larger, more profitable vehicles, particularly in the United States; • Industry sales volume can be volatile and could decline if there is a financial crisis, recession, public health emergency, or significant geopolitical event; • The impact of government incentives on Ford’s business has been and could continue to be significant, and Ford’s receipt of government incentives could be subject to reduction, termination, or clawback; • Ford and Ford Credit’s access to debt, securitization, or derivative markets around the world at competitive rates or in sufficient amounts could be affected by credit rating downgrades, market volatility, market disruption, regulatory requirements, asset portfolios, or other factors; • Ford Credit could experience higher-than-expected credit losses, lower-than-anticipated residual values, or higher-than-expected return volumes for leased vehicles; • Economic and demographic experience for pension and OPEB plans (e.g., discount rates or investment returns) could be worse than Ford has assumed; • Pension and other postretirement liabilities could adversely affect Ford’s liquidity and financial condition; • Ford and Ford Credit have experienced and could continue to experience unusual or significant litigation, governmental investigations, or adverse publicity arising out of alleged defects in products, services, perceived environmental impacts, or otherwise; • Ford may need to substantially modify its product plans and facilities to respond to shifting consumer sentiment and competitive dynamics as a result of policy changes affecting, or otherwise to comply with safety, emissions, fuel economy, autonomous driving technology, environmental, and other regulations; • Ford and Ford Credit could be affected by the continued development of more stringent privacy, data use, data protection, data access, and artificial intelligence laws and regulations as well as consumers’ heightened expectations to safeguard their personal information; and
7 • Ford Credit could be subject to new or increased credit regulations, consumer protection regulations, or other regulations. We cannot be certain that any expectation, forecast, or assumption made in preparing forward-looking statements will prove accurate, or that any projection will be realized. It is to be expected that there may be differences between projected and actual results. Our forward-looking statements speak only as of the date of their initial issuance, and we do not undertake, and expressly disclaim to the extent permitted by law, any obligation to update or revise publicly any forward-looking statement, whether as a result of new information, future events, or otherwise. For additional discussion, see “Item 1A. Risk Factors” in our Annual Report on Form 10-K for the year ended December 31, 2025, as updated by our subsequent Quarterly Reports on Form 10-Q and Current Reports on Form 8-K.
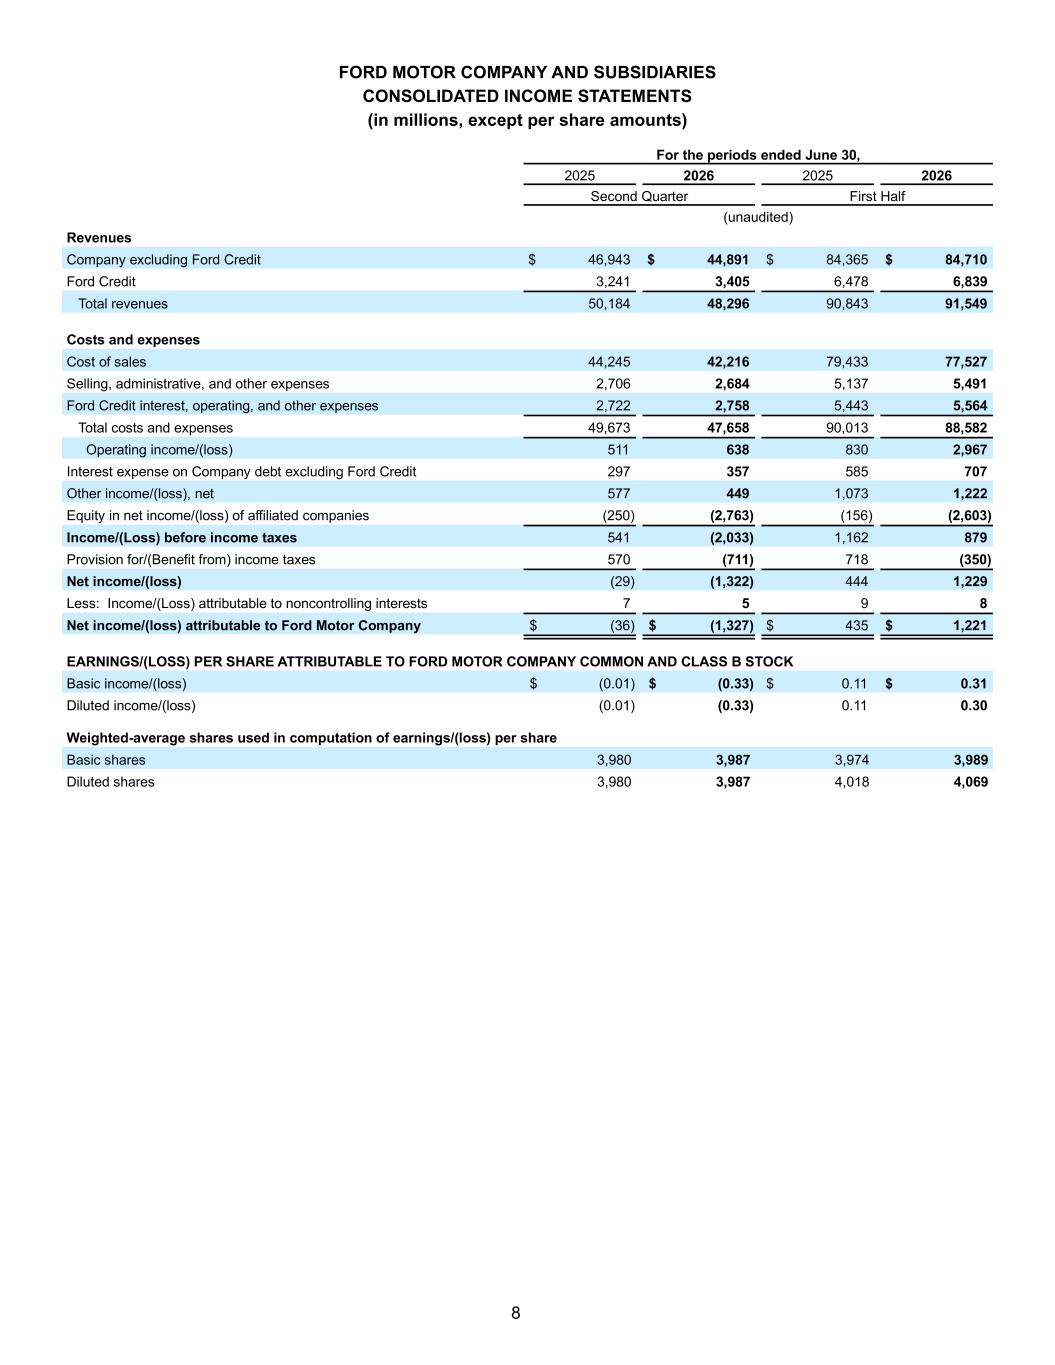
8 FORD MOTOR COMPANY AND SUBSIDIARIES CONSOLIDATED INCOME STATEMENTS (in millions, except per share amounts) For the periods ended June 30, 2025 2026 2025 2026 Second Quarter First Half (unaudited) Revenues Company excluding Ford Credit $ 46,943 $ 44,891 $ 84,365 $ 84,710 Ford Credit 3,241 3,405 6,478 6,839 Total revenues 50,184 48,296 90,843 91,549 Costs and expenses Cost of sales 44,245 42,216 79,433 77,527 Selling, administrative, and other expenses 2,706 2,684 5,137 5,491 Ford Credit interest, operating, and other expenses 2,722 2,758 5,443 5,564 Total costs and expenses 49,673 47,658 90,013 88,582 Operating income/(loss) 511 638 830 2,967 Interest expense on Company debt excluding Ford Credit 297 357 585 707 Other income/(loss), net 577 449 1,073 1,222 Equity in net income/(loss) of affiliated companies (250) (2,763) (156) (2,603) Income/(Loss) before income taxes 541 (2,033) 1,162 879 Provision for/(Benefit from) income taxes 570 (711) 718 (350) Net income/(loss) (29) (1,322) 444 1,229 Less: Income/(Loss) attributable to noncontrolling interests 7 5 9 8 Net income/(loss) attributable to Ford Motor Company $ (36) $ (1,327) $ 435 $ 1,221 EARNINGS/(LOSS) PER SHARE ATTRIBUTABLE TO FORD MOTOR COMPANY COMMON AND CLASS B STOCK Basic income/(loss) $ (0.01) $ (0.33) $ 0.11 $ 0.31 Diluted income/(loss) (0.01) (0.33) 0.11 0.30 Weighted-average shares used in computation of earnings/(loss) per share Basic shares 3,980 3,987 3,974 3,989 Diluted shares 3,980 3,987 4,018 4,069
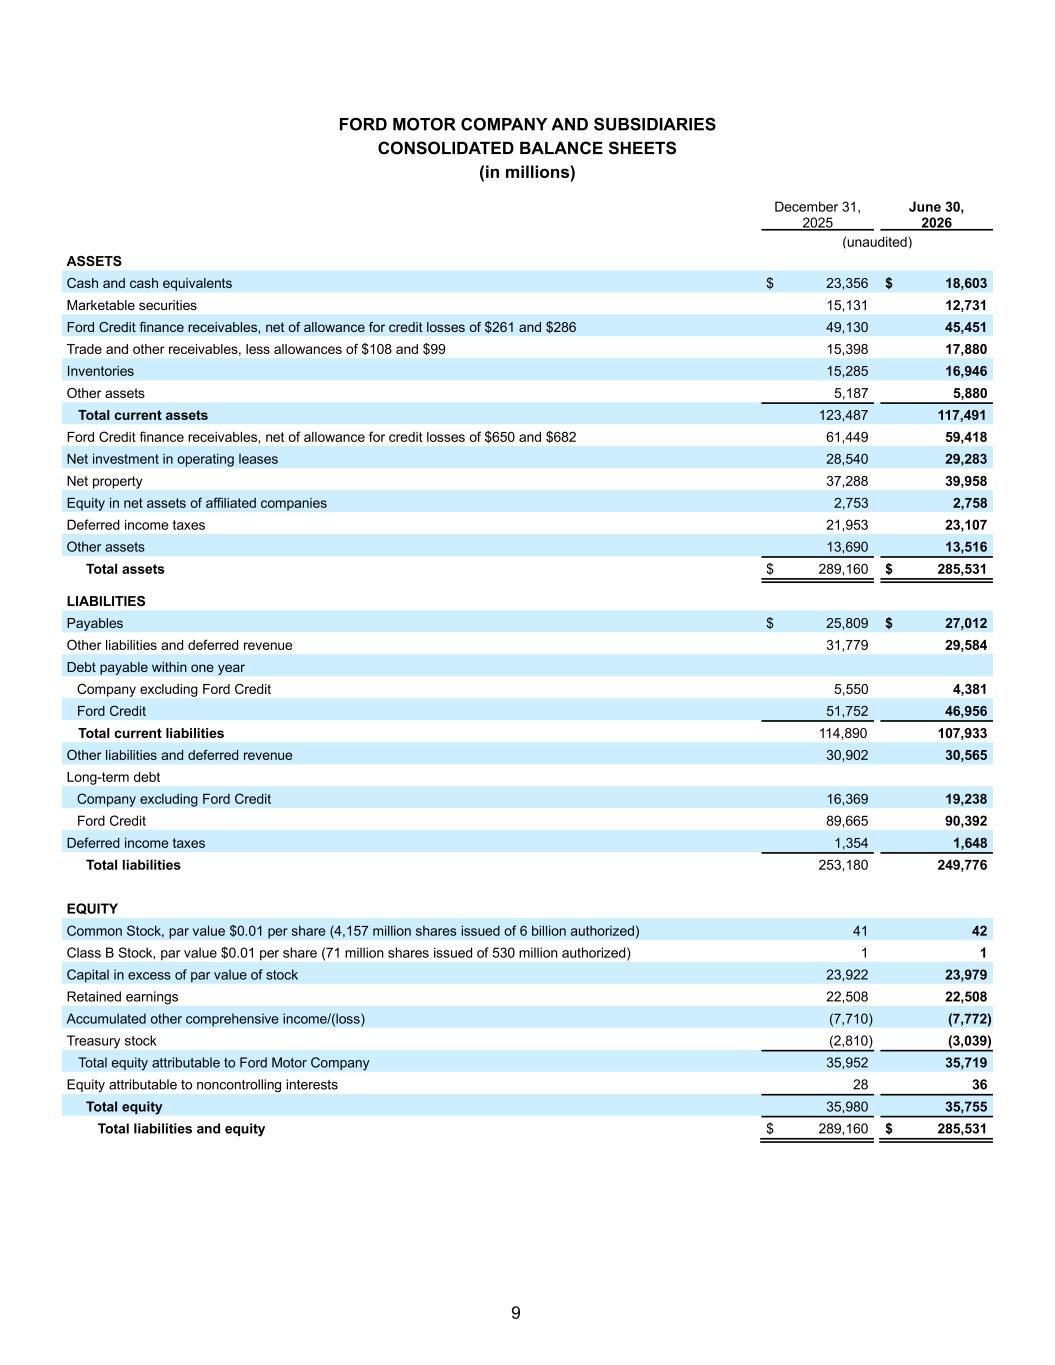
9 FORD MOTOR COMPANY AND SUBSIDIARIES CONSOLIDATED BALANCE SHEETS (in millions) December 31, 2025 June 30, 2026 (unaudited) ASSETS Cash and cash equivalents $ 23,356 $ 18,603 Marketable securities 15,131 12,731 Ford Credit finance receivables, net of allowance for credit losses of $261 and $286 49,130 45,451 Trade and other receivables, less allowances of $108 and $99 15,398 17,880 Inventories 15,285 16,946 Other assets 5,187 5,880 Total current assets 123,487 117,491 Ford Credit finance receivables, net of allowance for credit losses of $650 and $682 61,449 59,418 Net investment in operating leases 28,540 29,283 Net property 37,288 39,958 Equity in net assets of affiliated companies 2,753 2,758 Deferred income taxes 21,953 23,107 Other assets 13,690 13,516 Total assets $ 289,160 $ 285,531 LIABILITIES Payables $ 25,809 $ 27,012 Other liabilities and deferred revenue 31,779 29,584 Debt payable within one year Company excluding Ford Credit 5,550 4,381 Ford Credit 51,752 46,956 Total current liabilities 114,890 107,933 Other liabilities and deferred revenue 30,902 30,565 Long-term debt Company excluding Ford Credit 16,369 19,238 Ford Credit 89,665 90,392 Deferred income taxes 1,354 1,648 Total liabilities 253,180 249,776 EQUITY Common Stock, par value $0.01 per share (4,157 million shares issued of 6 billion authorized) 41 42 Class B Stock, par value $0.01 per share (71 million shares issued of 530 million authorized) 1 1 Capital in excess of par value of stock 23,922 23,979 Retained earnings 22,508 22,508 Accumulated other comprehensive income/(loss) (7,710) (7,772) Treasury stock (2,810) (3,039) Total equity attributable to Ford Motor Company 35,952 35,719 Equity attributable to noncontrolling interests 28 36 Total equity 35,980 35,755 Total liabilities and equity $ 289,160 $ 285,531
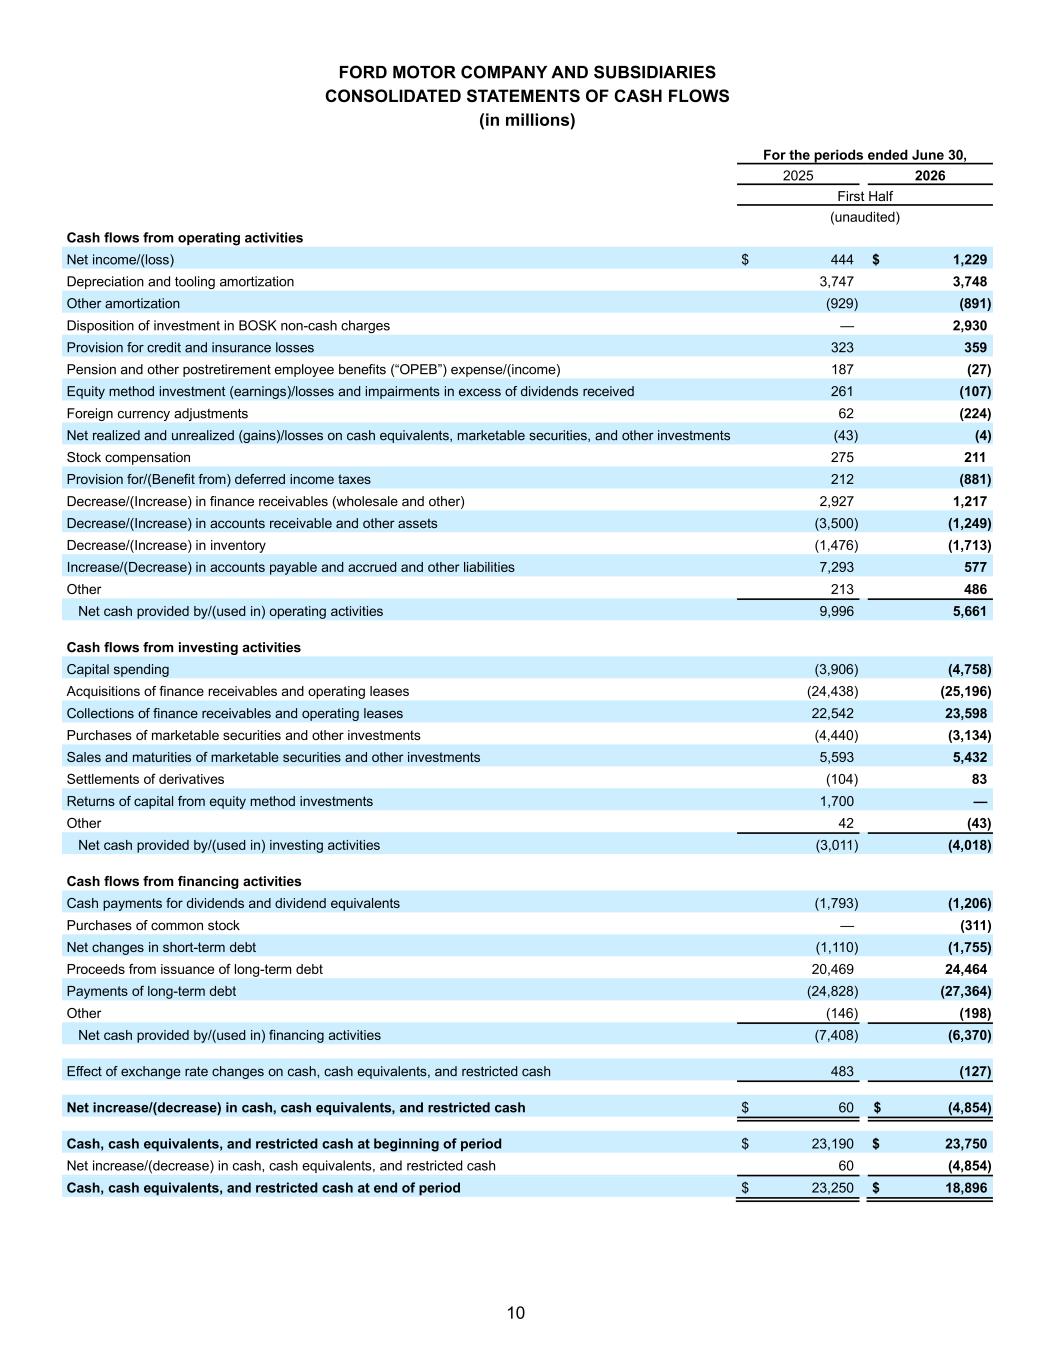
10 FORD MOTOR COMPANY AND SUBSIDIARIES CONSOLIDATED STATEMENTS OF CASH FLOWS (in millions) For the periods ended June 30, 2025 2026 First Half (unaudited) Cash flows from operating activities Net income/(loss) $ 444 $ 1,229 Depreciation and tooling amortization 3,747 3,748 Other amortization (929) (891) Disposition of investment in BOSK non-cash charges — 2,930 Provision for credit and insurance losses 323 359 Pension and other postretirement employee benefits (“OPEB”) expense/(income) 187 (27) Equity method investment (earnings)/losses and impairments in excess of dividends received 261 (107) Foreign currency adjustments 62 (224) Net realized and unrealized (gains)/losses on cash equivalents, marketable securities, and other investments (43) (4) Stock compensation 275 211 Provision for/(Benefit from) deferred income taxes 212 (881) Decrease/(Increase) in finance receivables (wholesale and other) 2,927 1,217 Decrease/(Increase) in accounts receivable and other assets (3,500) (1,249) Decrease/(Increase) in inventory (1,476) (1,713) Increase/(Decrease) in accounts payable and accrued and other liabilities 7,293 577 Other 213 486 Net cash provided by/(used in) operating activities 9,996 5,661 Cash flows from investing activities Capital spending (3,906) (4,758) Acquisitions of finance receivables and operating leases (24,438) (25,196) Collections of finance receivables and operating leases 22,542 23,598 Purchases of marketable securities and other investments (4,440) (3,134) Sales and maturities of marketable securities and other investments 5,593 5,432 Settlements of derivatives (104) 83 Returns of capital from equity method investments 1,700 — Other 42 (43) Net cash provided by/(used in) investing activities (3,011) (4,018) Cash flows from financing activities Cash payments for dividends and dividend equivalents (1,793) (1,206) Purchases of common stock — (311) Net changes in short-term debt (1,110) (1,755) Proceeds from issuance of long-term debt 20,469 24,464 Payments of long-term debt (24,828) (27,364) Other (146) (198) Net cash provided by/(used in) financing activities (7,408) (6,370) Effect of exchange rate changes on cash, cash equivalents, and restricted cash 483 (127) Net increase/(decrease) in cash, cash equivalents, and restricted cash $ 60 $ (4,854) Cash, cash equivalents, and restricted cash at beginning of period $ 23,190 $ 23,750 Net increase/(decrease) in cash, cash equivalents, and restricted cash 60 (4,854) Cash, cash equivalents, and restricted cash at end of period $ 23,250 $ 18,896
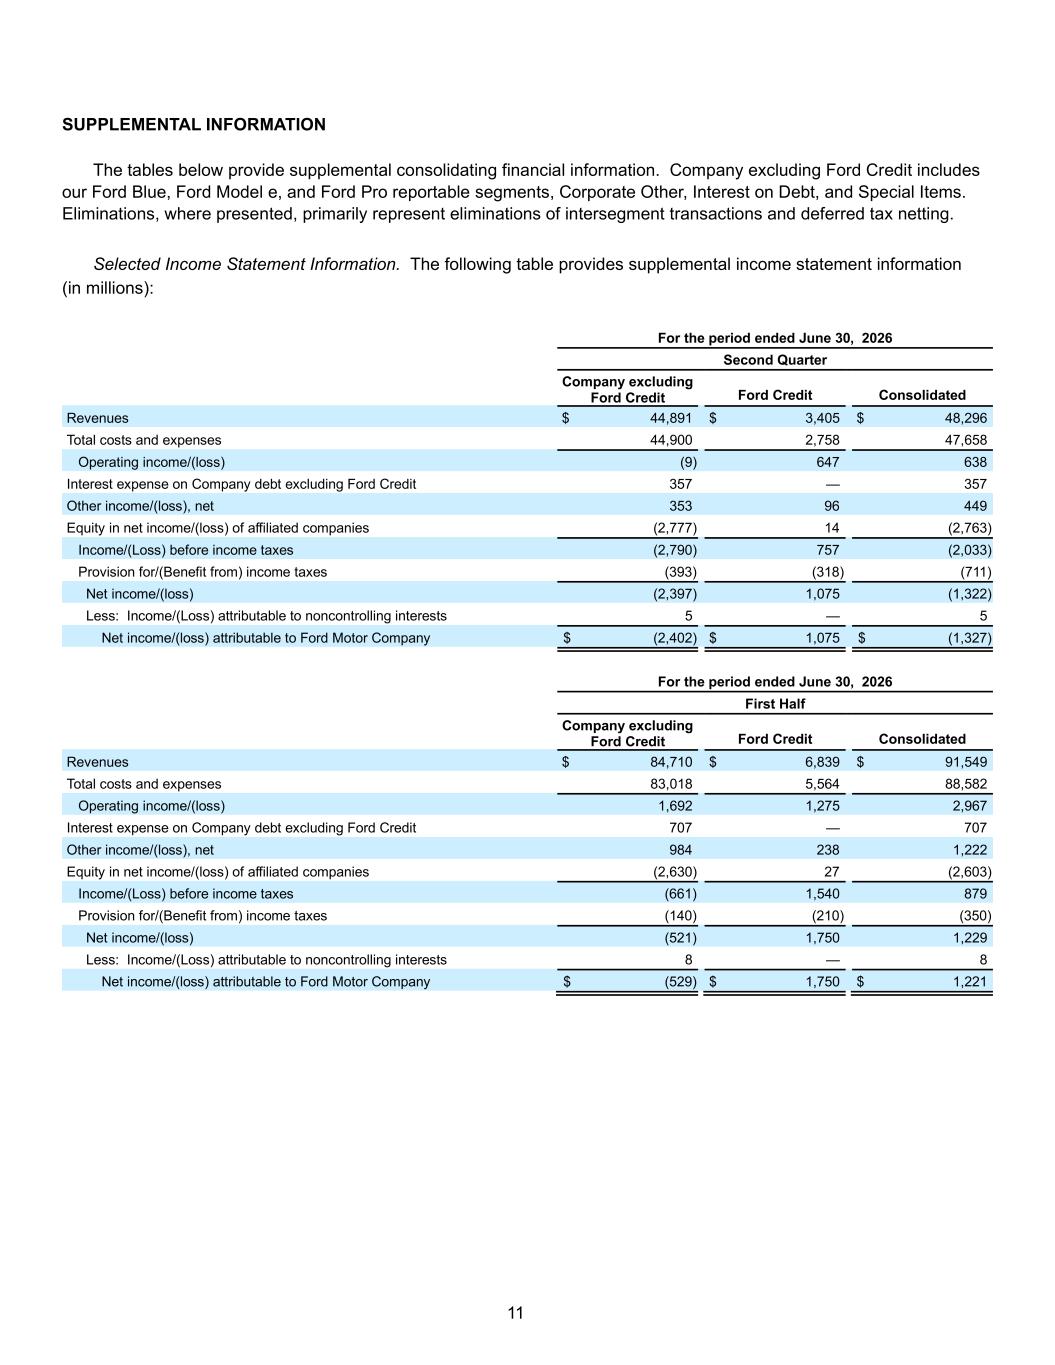
11 SUPPLEMENTAL INFORMATION The tables below provide supplemental consolidating financial information. Company excluding Ford Credit includes our Ford Blue, Ford Model e, and Ford Pro reportable segments, Corporate Other, Interest on Debt, and Special Items. Eliminations, where presented, primarily represent eliminations of intersegment transactions and deferred tax netting. Selected Income Statement Information. The following table provides supplemental income statement information (in millions): For the period ended June 30, 2026 Second Quarter Company excluding Ford Credit Ford Credit Consolidated Revenues $ 44,891 $ 3,405 $ 48,296 Total costs and expenses 44,900 2,758 47,658 Operating income/(loss) (9) 647 638 Interest expense on Company debt excluding Ford Credit 357 — 357 Other income/(loss), net 353 96 449 Equity in net income/(loss) of affiliated companies (2,777) 14 (2,763) Income/(Loss) before income taxes (2,790) 757 (2,033) Provision for/(Benefit from) income taxes (393) (318) (711) Net income/(loss) (2,397) 1,075 (1,322) Less: Income/(Loss) attributable to noncontrolling interests 5 — 5 Net income/(loss) attributable to Ford Motor Company $ (2,402) $ 1,075 $ (1,327) For the period ended June 30, 2026 First Half Company excluding Ford Credit Ford Credit Consolidated Revenues $ 84,710 $ 6,839 $ 91,549 Total costs and expenses 83,018 5,564 88,582 Operating income/(loss) 1,692 1,275 2,967 Interest expense on Company debt excluding Ford Credit 707 — 707 Other income/(loss), net 984 238 1,222 Equity in net income/(loss) of affiliated companies (2,630) 27 (2,603) Income/(Loss) before income taxes (661) 1,540 879 Provision for/(Benefit from) income taxes (140) (210) (350) Net income/(loss) (521) 1,750 1,229 Less: Income/(Loss) attributable to noncontrolling interests 8 — 8 Net income/(loss) attributable to Ford Motor Company $ (529) $ 1,750 $ 1,221
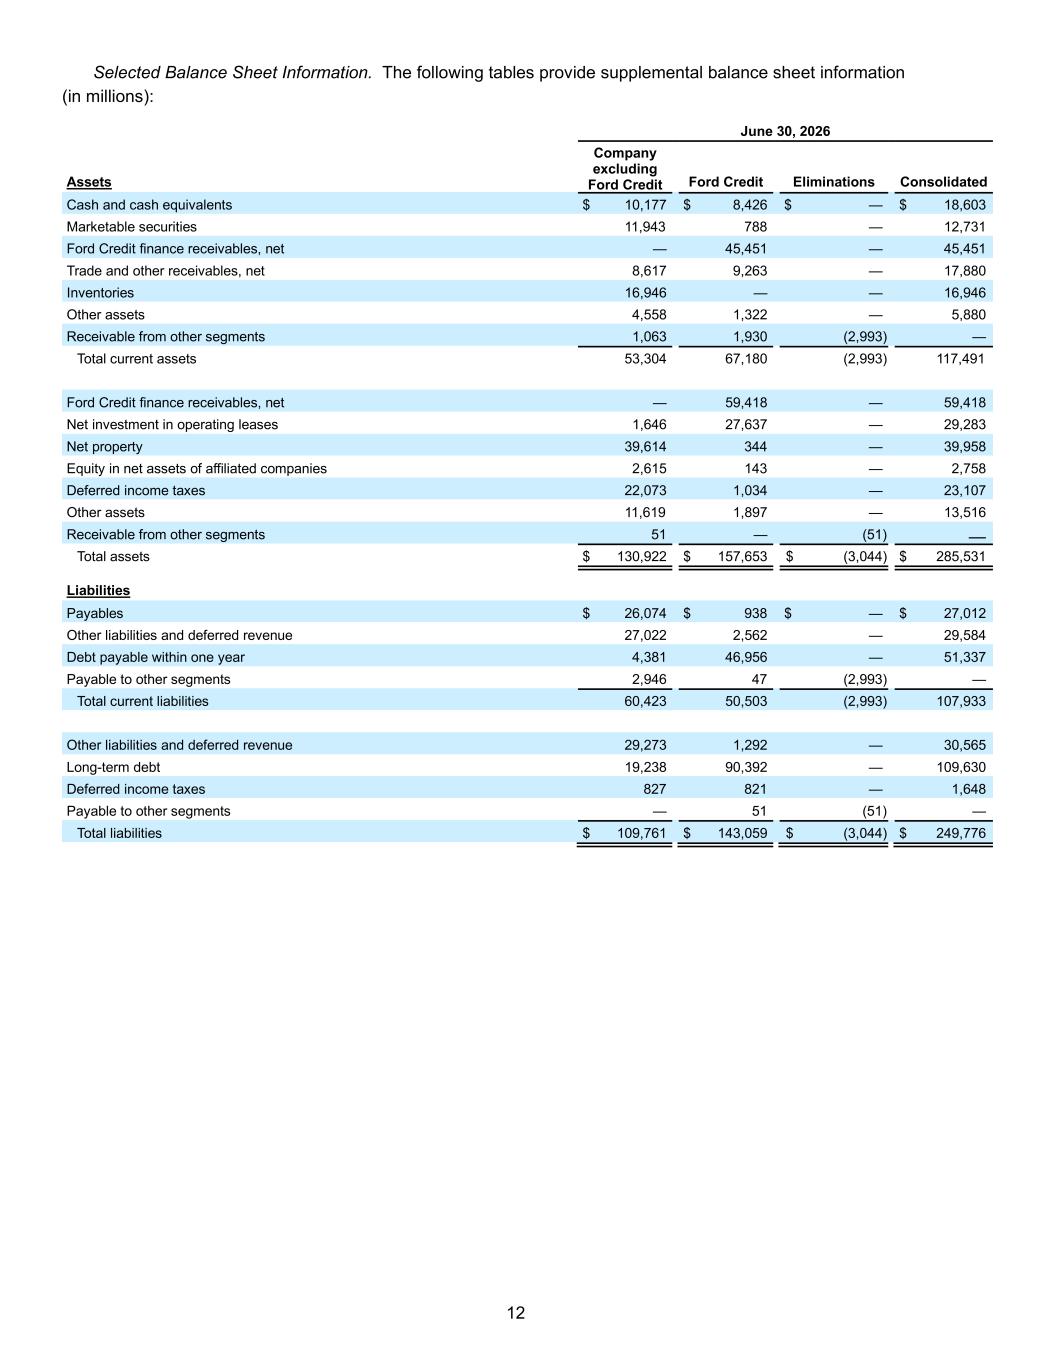
12 Selected Balance Sheet Information. The following tables provide supplemental balance sheet information (in millions): June 30, 2026 Assets Company excluding Ford Credit Ford Credit Eliminations Consolidated Cash and cash equivalents $ 10,177 $ 8,426 $ — $ 18,603 Marketable securities 11,943 788 — 12,731 Ford Credit finance receivables, net — 45,451 — 45,451 Trade and other receivables, net 8,617 9,263 — 17,880 Inventories 16,946 — — 16,946 Other assets 4,558 1,322 — 5,880 Receivable from other segments 1,063 1,930 (2,993) — Total current assets 53,304 67,180 (2,993) 117,491 Ford Credit finance receivables, net — 59,418 — 59,418 Net investment in operating leases 1,646 27,637 — 29,283 Net property 39,614 344 — 39,958 Equity in net assets of affiliated companies 2,615 143 — 2,758 Deferred income taxes 22,073 1,034 — 23,107 Other assets 11,619 1,897 — 13,516 Receivable from other segments 51 — (51) — Total assets $ 130,922 $ 157,653 $ (3,044) $ 285,531 Liabilities Payables $ 26,074 $ 938 $ — $ 27,012 Other liabilities and deferred revenue 27,022 2,562 — 29,584 Debt payable within one year 4,381 46,956 — 51,337 Payable to other segments 2,946 47 (2,993) — Total current liabilities 60,423 50,503 (2,993) 107,933 Other liabilities and deferred revenue 29,273 1,292 — 30,565 Long-term debt 19,238 90,392 — 109,630 Deferred income taxes 827 821 — 1,648 Payable to other segments — 51 (51) — Total liabilities $ 109,761 $ 143,059 $ (3,044) $ 249,776
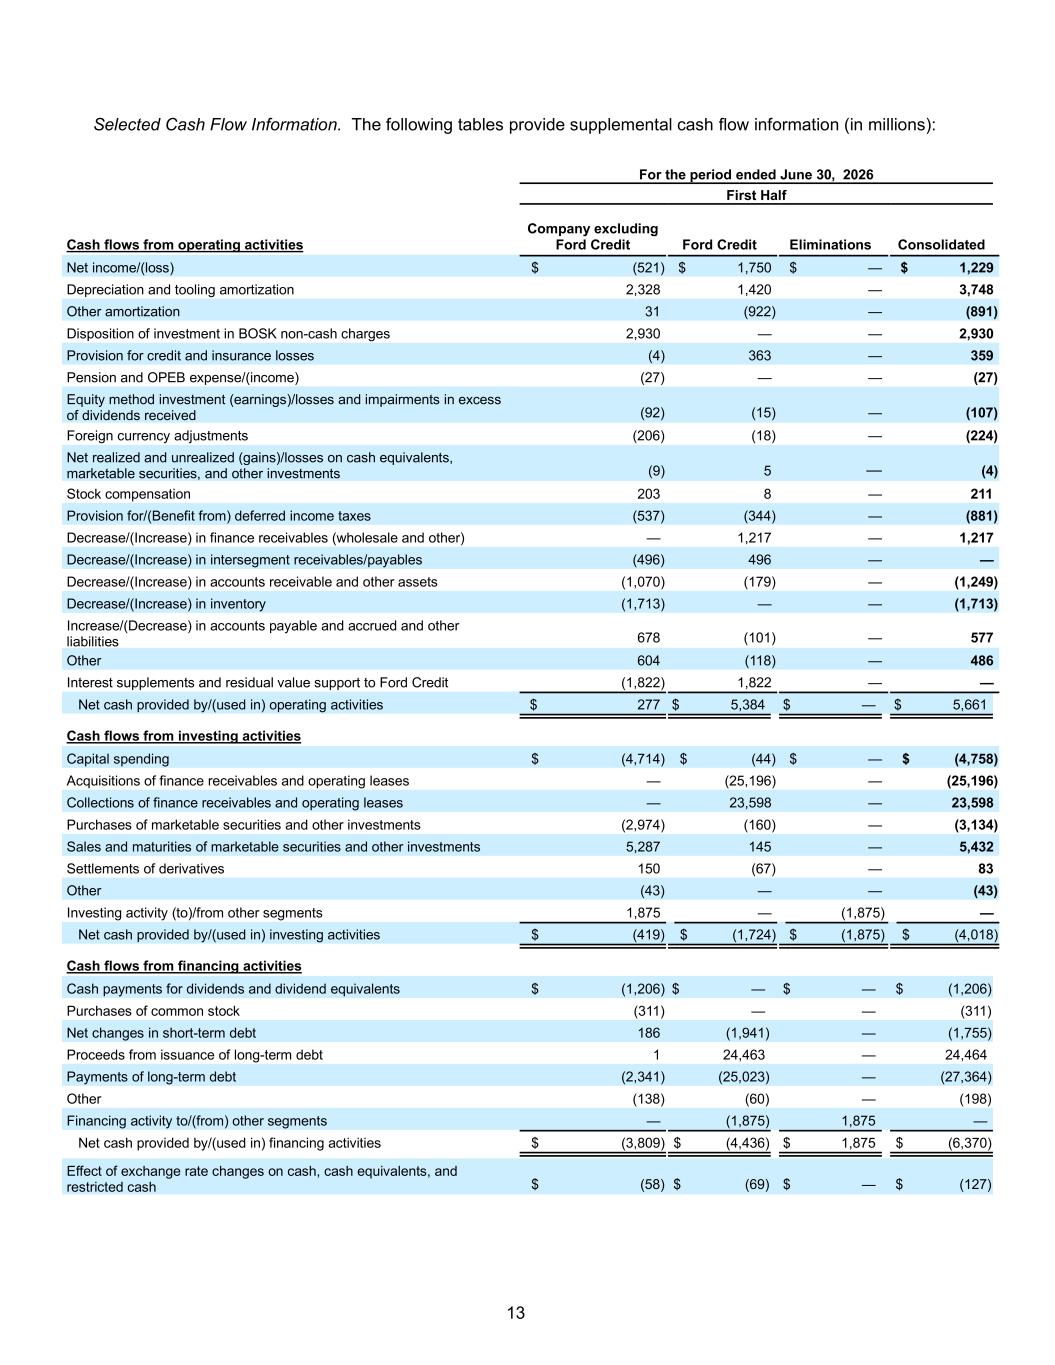
13 Selected Cash Flow Information. The following tables provide supplemental cash flow information (in millions): For the period ended June 30, 2026 First Half Cash flows from operating activities Company excluding Ford Credit Ford Credit Eliminations Consolidated Net income/(loss) $ (521) $ 1,750 $ — $ 1,229 Depreciation and tooling amortization 2,328 1,420 — 3,748 Other amortization 31 (922) — (891) Disposition of investment in BOSK non-cash charges 2,930 — — 2,930 Provision for credit and insurance losses (4) 363 — 359 Pension and OPEB expense/(income) (27) — — (27) Equity method investment (earnings)/losses and impairments in excess of dividends received (92) (15) — (107) Foreign currency adjustments (206) (18) — (224) Net realized and unrealized (gains)/losses on cash equivalents, marketable securities, and other investments (9) 5 — (4) Stock compensation 203 8 — 211 Provision for/(Benefit from) deferred income taxes (537) (344) — (881) Decrease/(Increase) in finance receivables (wholesale and other) — 1,217 — 1,217 Decrease/(Increase) in intersegment receivables/payables (496) 496 — — Decrease/(Increase) in accounts receivable and other assets (1,070) (179) — (1,249) Decrease/(Increase) in inventory (1,713) — — (1,713) Increase/(Decrease) in accounts payable and accrued and other liabilities 678 (101) — 577 Other 604 (118) — 486 Interest supplements and residual value support to Ford Credit (1,822) 1,822 — — Net cash provided by/(used in) operating activities $ 277 $ 5,384 $ — $ 5,661 Cash flows from investing activities Capital spending $ (4,714) $ (44) $ — $ (4,758) Acquisitions of finance receivables and operating leases — (25,196) — (25,196) Collections of finance receivables and operating leases — 23,598 — 23,598 Purchases of marketable securities and other investments (2,974) (160) — (3,134) Sales and maturities of marketable securities and other investments 5,287 145 — 5,432 Settlements of derivatives 150 (67) — 83 Other (43) — — (43) Investing activity (to)/from other segments 1,875 — (1,875) — Net cash provided by/(used in) investing activities $ (419) $ (1,724) $ (1,875) $ (4,018) Cash flows from financing activities Cash payments for dividends and dividend equivalents $ (1,206) $ — $ — $ (1,206) Purchases of common stock (311) — — (311) Net changes in short-term debt 186 (1,941) — (1,755) Proceeds from issuance of long-term debt 1 24,463 — 24,464 Payments of long-term debt (2,341) (25,023) — (27,364) Other (138) (60) — (198) Financing activity to/(from) other segments — (1,875) 1,875 — Net cash provided by/(used in) financing activities $ (3,809) $ (4,436) $ 1,875 $ (6,370) Effect of exchange rate changes on cash, cash equivalents, and restricted cash $ (58) $ (69) $ — $ (127)
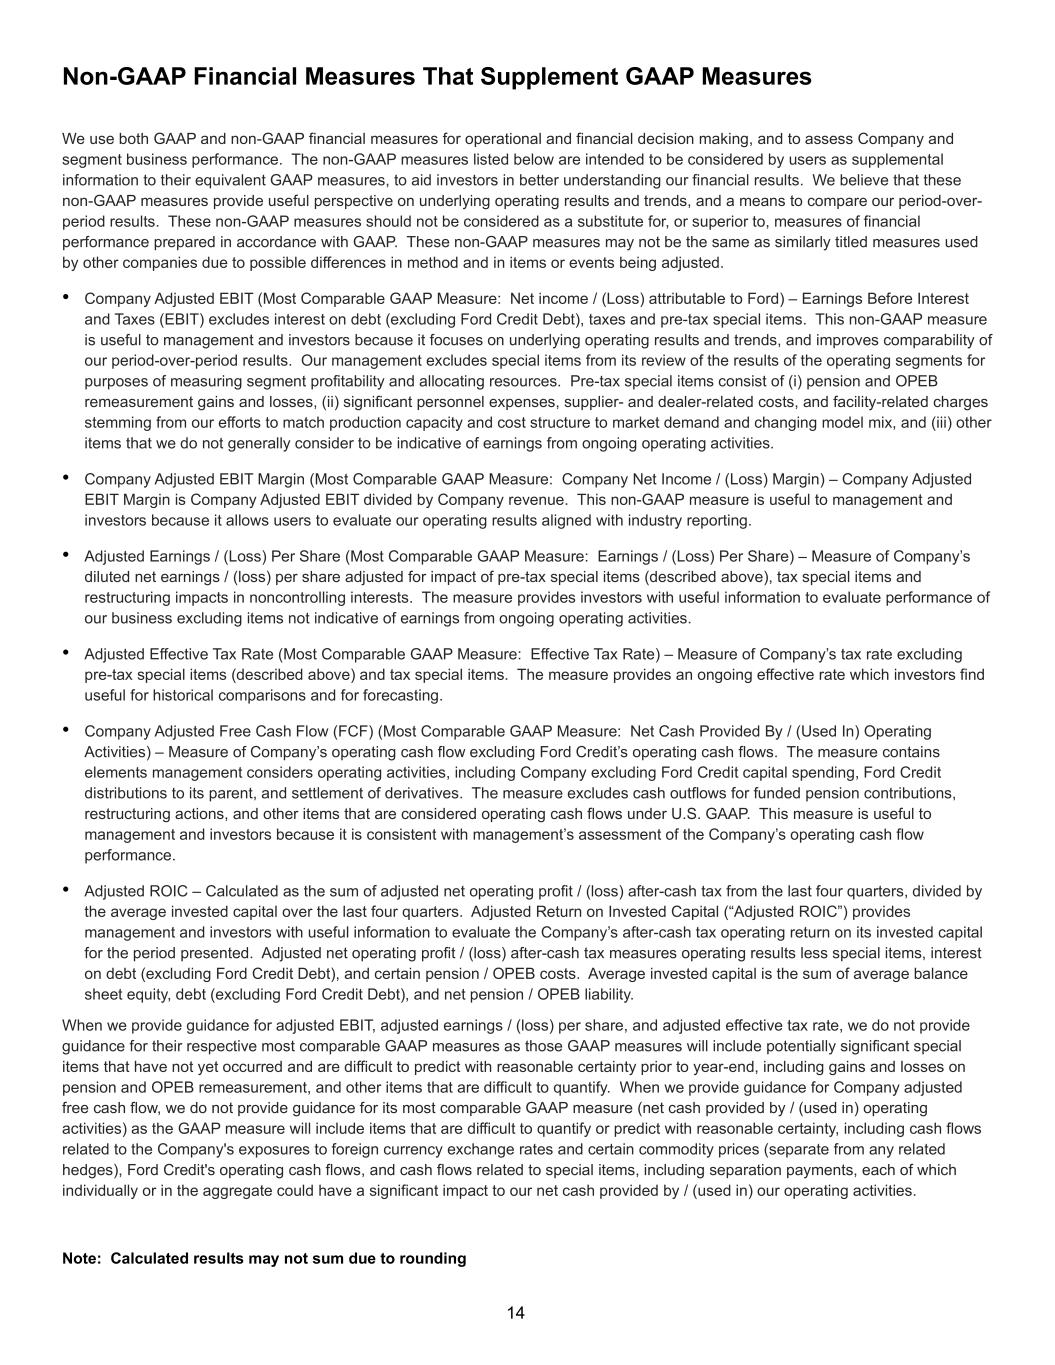
14 Non-GAAP Financial Measures That Supplement GAAP Measures We use both GAAP and non-GAAP financial measures for operational and financial decision making, and to assess Company and segment business performance. The non-GAAP measures listed below are intended to be considered by users as supplemental information to their equivalent GAAP measures, to aid investors in better understanding our financial results. We believe that these non-GAAP measures provide useful perspective on underlying operating results and trends, and a means to compare our period-over- period results. These non-GAAP measures should not be considered as a substitute for, or superior to, measures of financial performance prepared in accordance with GAAP. These non-GAAP measures may not be the same as similarly titled measures used by other companies due to possible differences in method and in items or events being adjusted. • Company Adjusted EBIT (Most Comparable GAAP Measure: Net income / (Loss) attributable to Ford) – Earnings Before Interest and Taxes (EBIT) excludes interest on debt (excluding Ford Credit Debt), taxes and pre-tax special items. This non-GAAP measure is useful to management and investors because it focuses on underlying operating results and trends, and improves comparability of our period-over-period results. Our management excludes special items from its review of the results of the operating segments for purposes of measuring segment profitability and allocating resources. Pre-tax special items consist of (i) pension and OPEB remeasurement gains and losses, (ii) significant personnel expenses, supplier- and dealer-related costs, and facility-related charges stemming from our efforts to match production capacity and cost structure to market demand and changing model mix, and (iii) other items that we do not generally consider to be indicative of earnings from ongoing operating activities. • Company Adjusted EBIT Margin (Most Comparable GAAP Measure: Company Net Income / (Loss) Margin) – Company Adjusted EBIT Margin is Company Adjusted EBIT divided by Company revenue. This non-GAAP measure is useful to management and investors because it allows users to evaluate our operating results aligned with industry reporting. • Adjusted Earnings / (Loss) Per Share (Most Comparable GAAP Measure: Earnings / (Loss) Per Share) – Measure of Company’s diluted net earnings / (loss) per share adjusted for impact of pre-tax special items (described above), tax special items and restructuring impacts in noncontrolling interests. The measure provides investors with useful information to evaluate performance of our business excluding items not indicative of earnings from ongoing operating activities. • Adjusted Effective Tax Rate (Most Comparable GAAP Measure: Effective Tax Rate) – Measure of Company’s tax rate excluding pre-tax special items (described above) and tax special items. The measure provides an ongoing effective rate which investors find useful for historical comparisons and for forecasting. • Company Adjusted Free Cash Flow (FCF) (Most Comparable GAAP Measure: Net Cash Provided By / (Used In) Operating Activities) – Measure of Company’s operating cash flow excluding Ford Credit’s operating cash flows. The measure contains elements management considers operating activities, including Company excluding Ford Credit capital spending, Ford Credit distributions to its parent, and settlement of derivatives. The measure excludes cash outflows for funded pension contributions, restructuring actions, and other items that are considered operating cash flows under U.S. GAAP. This measure is useful to management and investors because it is consistent with management’s assessment of the Company’s operating cash flow performance. • Adjusted ROIC – Calculated as the sum of adjusted net operating profit / (loss) after-cash tax from the last four quarters, divided by the average invested capital over the last four quarters. Adjusted Return on Invested Capital (“Adjusted ROIC”) provides management and investors with useful information to evaluate the Company’s after-cash tax operating return on its invested capital for the period presented. Adjusted net operating profit / (loss) after-cash tax measures operating results less special items, interest on debt (excluding Ford Credit Debt), and certain pension / OPEB costs. Average invested capital is the sum of average balance sheet equity, debt (excluding Ford Credit Debt), and net pension / OPEB liability. When we provide guidance for adjusted EBIT, adjusted earnings / (loss) per share, and adjusted effective tax rate, we do not provide guidance for their respective most comparable GAAP measures as those GAAP measures will include potentially significant special items that have not yet occurred and are difficult to predict with reasonable certainty prior to year-end, including gains and losses on pension and OPEB remeasurement, and other items that are difficult to quantify. When we provide guidance for Company adjusted free cash flow, we do not provide guidance for its most comparable GAAP measure (net cash provided by / (used in) operating activities) as the GAAP measure will include items that are difficult to quantify or predict with reasonable certainty, including cash flows related to the Company's exposures to foreign currency exchange rates and certain commodity prices (separate from any related hedges), Ford Credit's operating cash flows, and cash flows related to special items, including separation payments, each of which individually or in the aggregate could have a significant impact to our net cash provided by / (used in) our operating activities. Note: Calculated results may not sum due to rounding
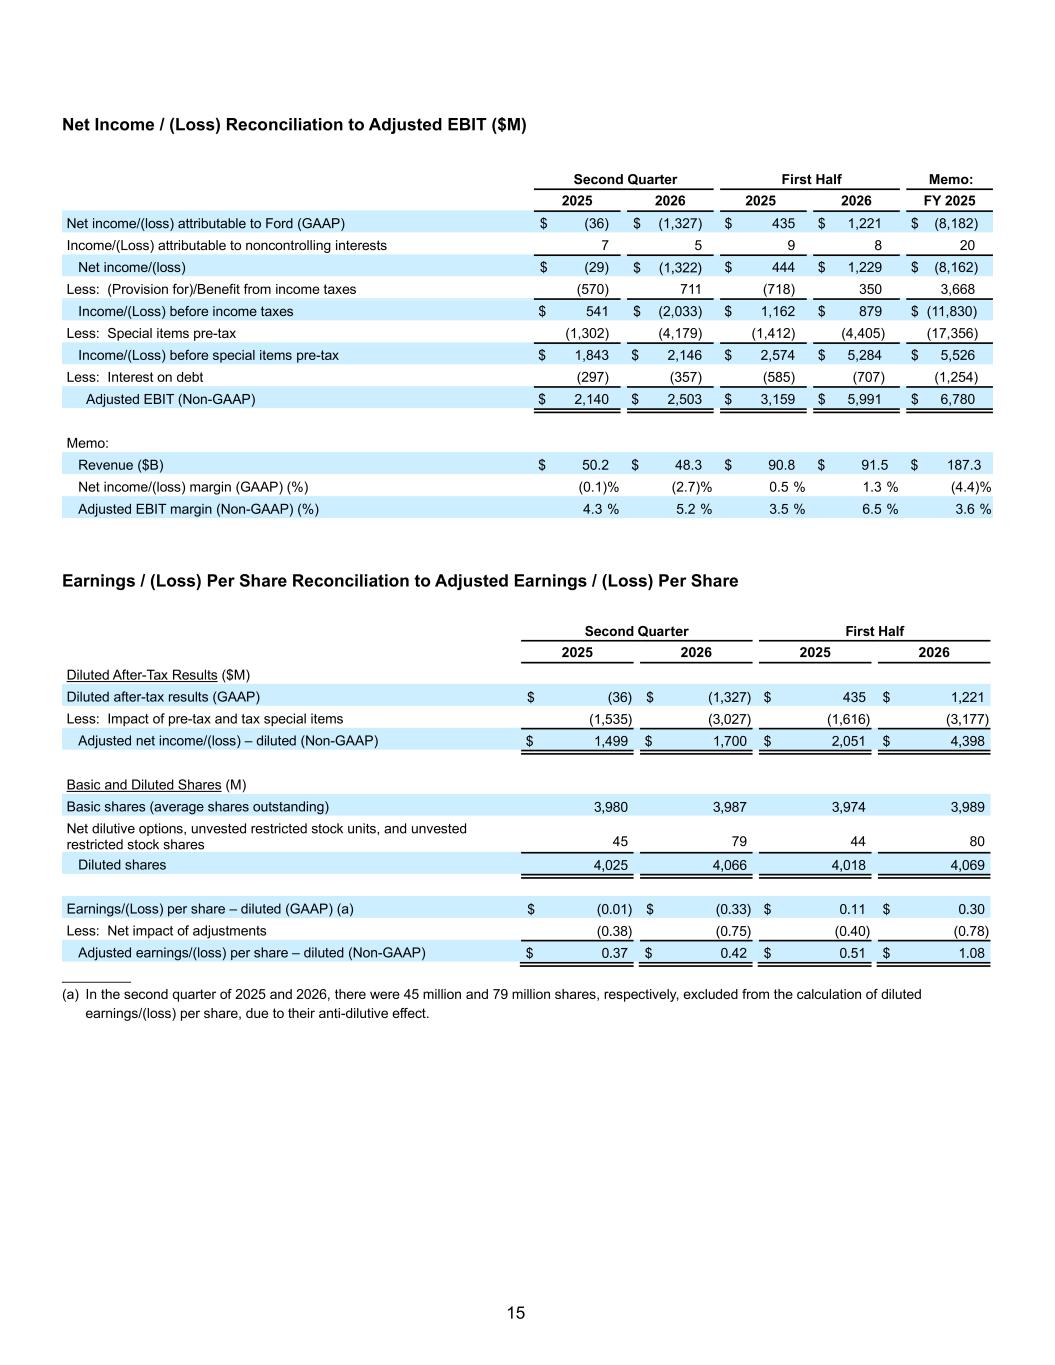
15 Net Income / (Loss) Reconciliation to Adjusted EBIT ($M) Second Quarter First Half Memo: 2025 2026 2025 2026 FY 2025 Net income/(loss) attributable to Ford (GAAP) $ (36) $ (1,327) $ 435 $ 1,221 $ (8,182) Income/(Loss) attributable to noncontrolling interests 7 5 9 8 20 Net income/(loss) $ (29) $ (1,322) $ 444 $ 1,229 $ (8,162) Less: (Provision for)/Benefit from income taxes (570) 711 (718) 350 3,668 Income/(Loss) before income taxes $ 541 $ (2,033) $ 1,162 $ 879 $ (11,830) Less: Special items pre-tax (1,302) (4,179) (1,412) (4,405) (17,356) Income/(Loss) before special items pre-tax $ 1,843 $ 2,146 $ 2,574 $ 5,284 $ 5,526 Less: Interest on debt (297) (357) (585) (707) (1,254) Adjusted EBIT (Non-GAAP) $ 2,140 $ 2,503 $ 3,159 $ 5,991 $ 6,780 Memo: Revenue ($B) $ 50.2 $ 48.3 $ 90.8 $ 91.5 $ 187.3 Net income/(loss) margin (GAAP) (%) (0.1) % (2.7) % 0.5 % 1.3 % (4.4) % Adjusted EBIT margin (Non-GAAP) (%) 4.3 % 5.2 % 3.5 % 6.5 % 3.6 % Earnings / (Loss) Per Share Reconciliation to Adjusted Earnings / (Loss) Per Share Second Quarter First Half 2025 2026 2025 2026 Diluted After-Tax Results ($M) Diluted after-tax results (GAAP) $ (36) $ (1,327) $ 435 $ 1,221 Less: Impact of pre-tax and tax special items (1,535) (3,027) (1,616) (3,177) Adjusted net income/(loss) – diluted (Non-GAAP) $ 1,499 $ 1,700 $ 2,051 $ 4,398 Basic and Diluted Shares (M) Basic shares (average shares outstanding) 3,980 3,987 3,974 3,989 Net dilutive options, unvested restricted stock units, and unvested restricted stock shares 45 79 44 80 Diluted shares 4,025 4,066 4,018 4,069 Earnings/(Loss) per share – diluted (GAAP) (a) $ (0.01) $ (0.33) $ 0.11 $ 0.30 Less: Net impact of adjustments (0.38) (0.75) (0.40) (0.78) Adjusted earnings/(loss) per share – diluted (Non-GAAP) $ 0.37 $ 0.42 $ 0.51 $ 1.08 _________ (a) In the second quarter of 2025 and 2026, there were 45 million and 79 million shares, respectively, excluded from the calculation of diluted earnings/(loss) per share, due to their anti-dilutive effect.
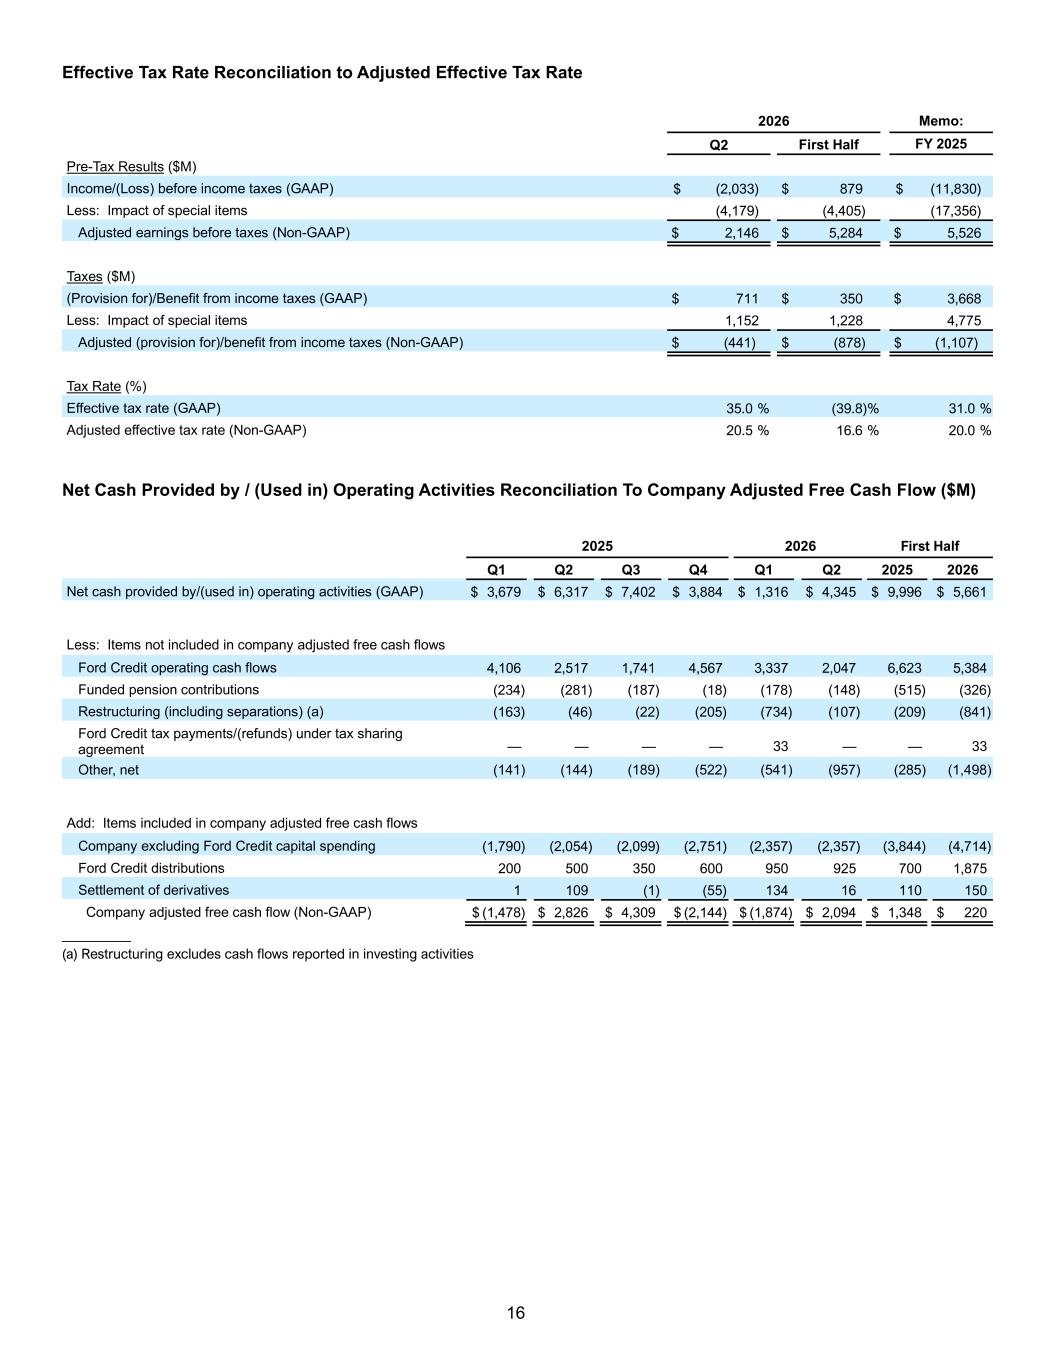
16 Effective Tax Rate Reconciliation to Adjusted Effective Tax Rate 2026 Memo: Q2 First Half FY 2025 Pre-Tax Results ($M) Income/(Loss) before income taxes (GAAP) $ (2,033) $ 879 $ (11,830) Less: Impact of special items (4,179) (4,405) (17,356) Adjusted earnings before taxes (Non-GAAP) $ 2,146 $ 5,284 $ 5,526 Taxes ($M) (Provision for)/Benefit from income taxes (GAAP) $ 711 $ 350 $ 3,668 Less: Impact of special items 1,152 1,228 4,775 Adjusted (provision for)/benefit from income taxes (Non-GAAP) $ (441) $ (878) $ (1,107) Tax Rate (%) Effective tax rate (GAAP) 35.0 % (39.8) % 31.0 % Adjusted effective tax rate (Non-GAAP) 20.5 % 16.6 % 20.0 % Net Cash Provided by / (Used in) Operating Activities Reconciliation To Company Adjusted Free Cash Flow ($M) 2025 2026 First Half Q1 Q2 Q3 Q4 Q1 Q2 2025 2026 Net cash provided by/(used in) operating activities (GAAP) $ 3,679 $ 6,317 $ 7,402 $ 3,884 $ 1,316 $ 4,345 $ 9,996 $ 5,661 Less: Items not included in company adjusted free cash flows Ford Credit operating cash flows 4,106 2,517 1,741 4,567 3,337 2,047 6,623 5,384 Funded pension contributions (234) (281) (187) (18) (178) (148) (515) (326) Restructuring (including separations) (a) (163) (46) (22) (205) (734) (107) (209) (841) Ford Credit tax payments/(refunds) under tax sharing agreement — — — — 33 — — 33 Other, net (141) (144) (189) (522) (541) (957) (285) (1,498) Add: Items included in company adjusted free cash flows Company excluding Ford Credit capital spending (1,790) (2,054) (2,099) (2,751) (2,357) (2,357) (3,844) (4,714) Ford Credit distributions 200 500 350 600 950 925 700 1,875 Settlement of derivatives 1 109 (1) (55) 134 16 110 150 Company adjusted free cash flow (Non-GAAP) $ (1,478) $ 2,826 $ 4,309 $ (2,144) $ (1,874) $ 2,094 $ 1,348 $ 220 _________ (a) Restructuring excludes cash flows reported in investing activities
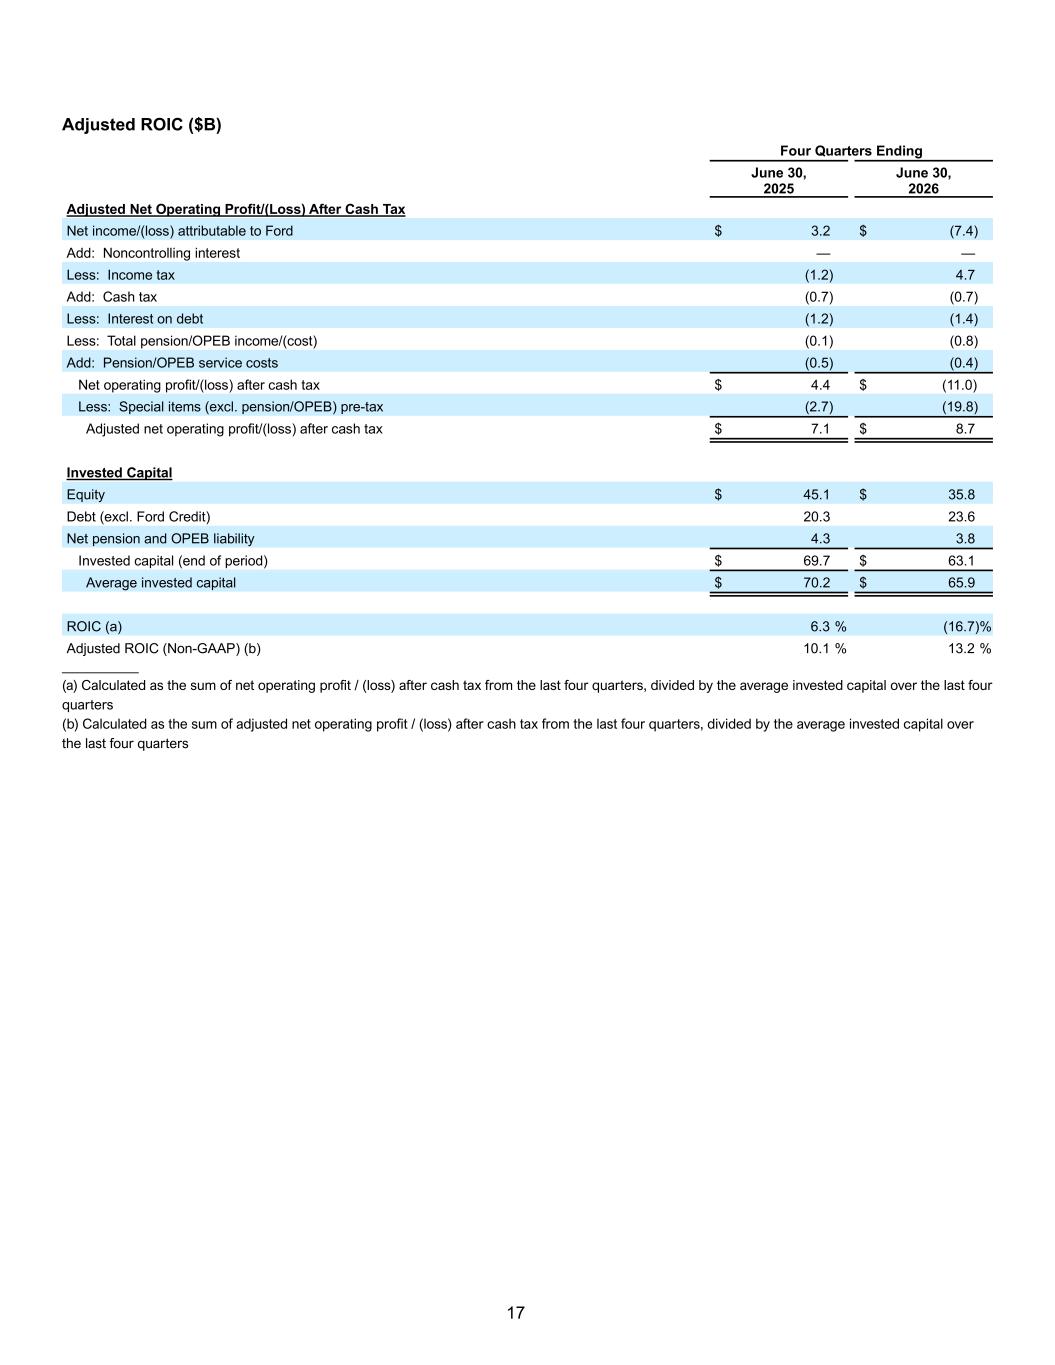
17 Adjusted ROIC ($B) Four Quarters Ending June 30, 2025 June 30, 2026 Adjusted Net Operating Profit/(Loss) After Cash Tax Net income/(loss) attributable to Ford $ 3.2 $ (7.4) Add: Noncontrolling interest — — Less: Income tax (1.2) 4.7 Add: Cash tax (0.7) (0.7) Less: Interest on debt (1.2) (1.4) Less: Total pension/OPEB income/(cost) (0.1) (0.8) Add: Pension/OPEB service costs (0.5) (0.4) Net operating profit/(loss) after cash tax $ 4.4 $ (11.0) Less: Special items (excl. pension/OPEB) pre-tax (2.7) (19.8) Adjusted net operating profit/(loss) after cash tax $ 7.1 $ 8.7 Invested Capital Equity $ 45.1 $ 35.8 Debt (excl. Ford Credit) 20.3 23.6 Net pension and OPEB liability 4.3 3.8 Invested capital (end of period) $ 69.7 $ 63.1 Average invested capital $ 70.2 $ 65.9 ROIC (a) 6.3 % (16.7) % Adjusted ROIC (Non-GAAP) (b) 10.1 % 13.2 % __________ (a) Calculated as the sum of net operating profit / (loss) after cash tax from the last four quarters, divided by the average invested capital over the last four quarters (b) Calculated as the sum of adjusted net operating profit / (loss) after cash tax from the last four quarters, divided by the average invested capital over the last four quarters
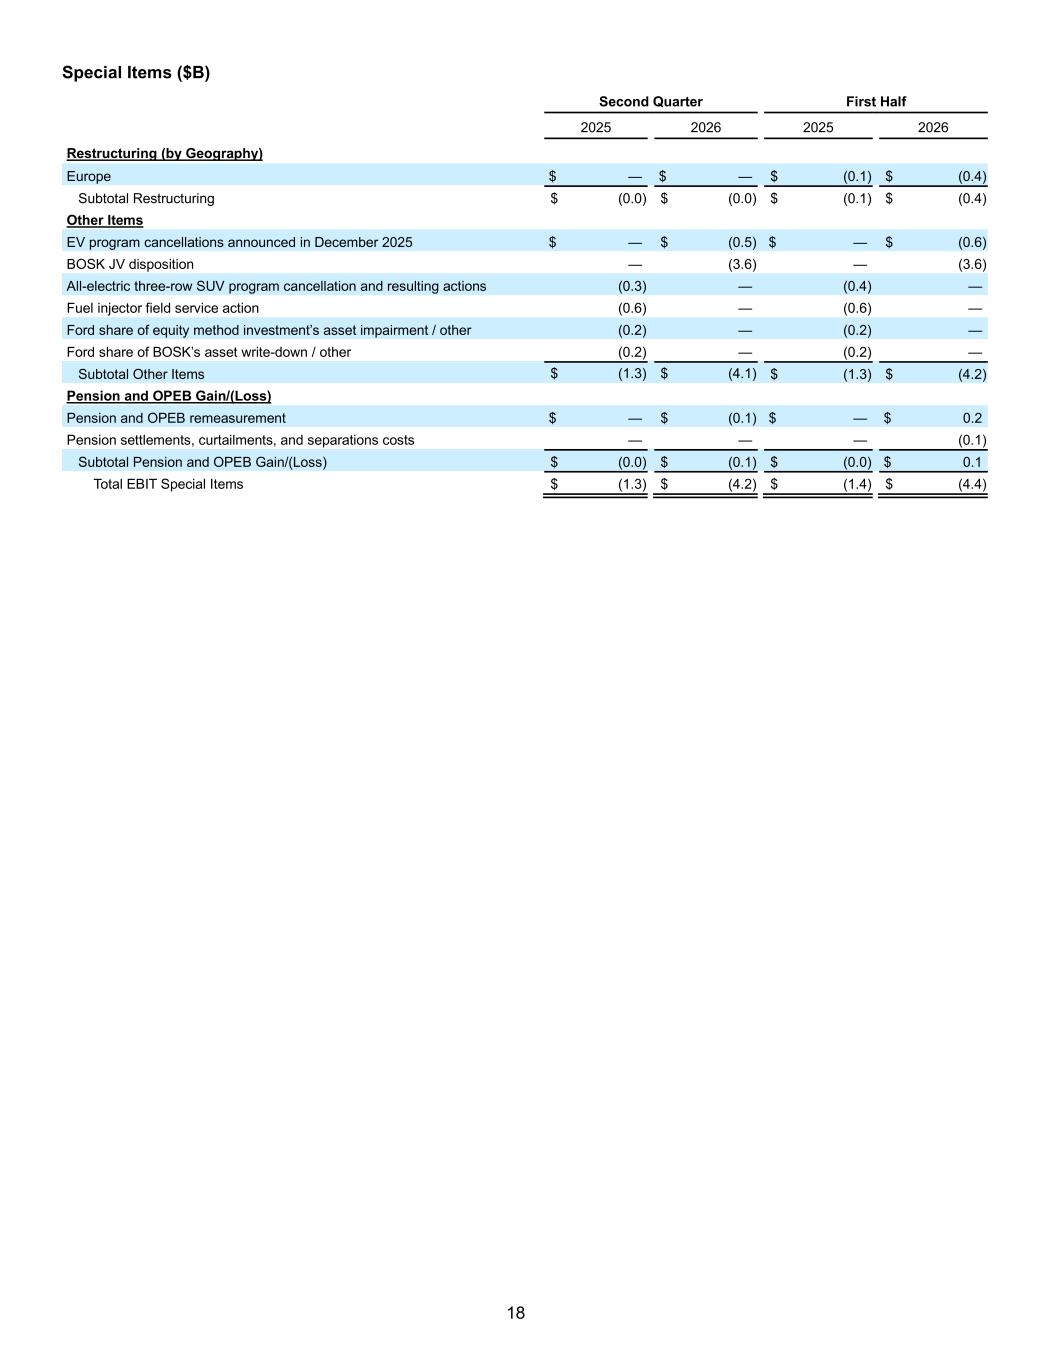
18 Special Items ($B) Second Quarter First Half 2025 2026 2025 2026 Restructuring (by Geography) Europe $ — $ — $ (0.1) $ (0.4) Subtotal Restructuring $ (0.0) $ (0.0) $ (0.1) $ (0.4) Other Items EV program cancellations announced in December 2025 $ — $ (0.5) $ — $ (0.6) BOSK JV disposition — (3.6) — (3.6) All-electric three-row SUV program cancellation and resulting actions (0.3) — (0.4) — Fuel injector field service action (0.6) — (0.6) — Ford share of equity method investment’s asset impairment / other (0.2) — (0.2) — Ford share of BOSK’s asset write-down / other (0.2) — (0.2) — Subtotal Other Items $ (1.3) $ (4.1) $ (1.3) $ (4.2) Pension and OPEB Gain/(Loss) Pension and OPEB remeasurement $ — $ (0.1) $ — $ 0.2 Pension settlements, curtailments, and separations costs — — — (0.1) Subtotal Pension and OPEB Gain/(Loss) $ (0.0) $ (0.1) $ (0.0) $ 0.1 Total EBIT Special Items $ (1.3) $ (4.2) $ (1.4) $ (4.4)
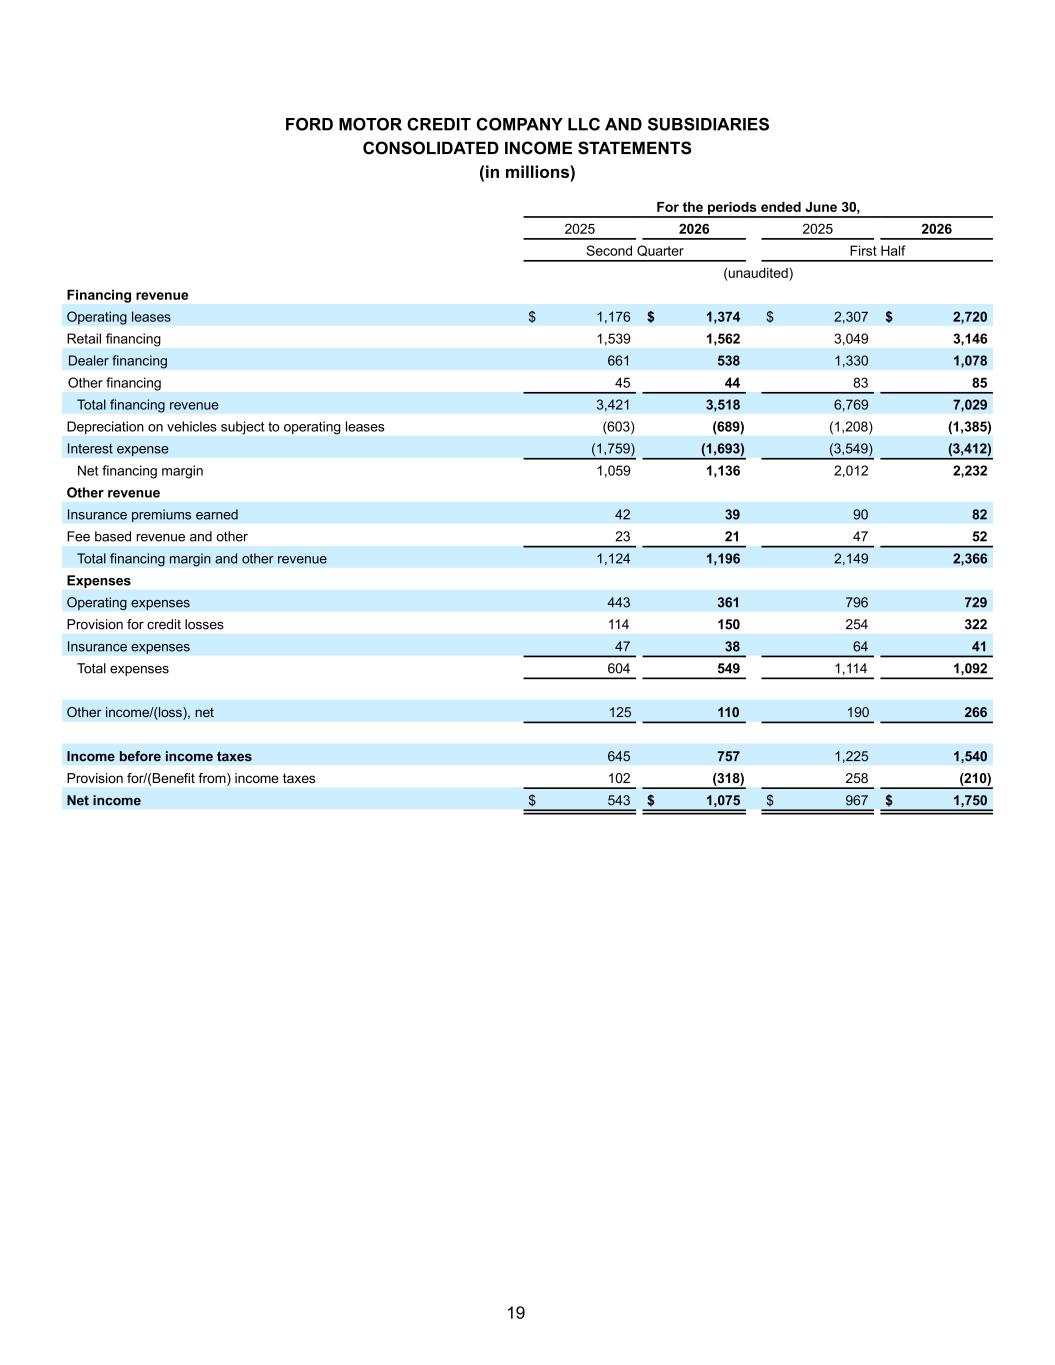
19 FORD MOTOR CREDIT COMPANY LLC AND SUBSIDIARIES CONSOLIDATED INCOME STATEMENTS (in millions) For the periods ended June 30, 2025 2026 2025 2026 Second Quarter First Half (unaudited) Financing revenue Operating leases $ 1,176 $ 1,374 $ 2,307 $ 2,720 Retail financing 1,539 1,562 3,049 3,146 Dealer financing 661 538 1,330 1,078 Other financing 45 44 83 85 Total financing revenue 3,421 3,518 6,769 7,029 Depreciation on vehicles subject to operating leases (603) (689) (1,208) (1,385) Interest expense (1,759) (1,693) (3,549) (3,412) Net financing margin 1,059 1,136 2,012 2,232 Other revenue Insurance premiums earned 42 39 90 82 Fee based revenue and other 23 21 47 52 Total financing margin and other revenue 1,124 1,196 2,149 2,366 Expenses Operating expenses 443 361 796 729 Provision for credit losses 114 150 254 322 Insurance expenses 47 38 64 41 Total expenses 604 549 1,114 1,092 Other income/(loss), net 125 110 190 266 Income before income taxes 645 757 1,225 1,540 Provision for/(Benefit from) income taxes 102 (318) 258 (210) Net income $ 543 $ 1,075 $ 967 $ 1,750
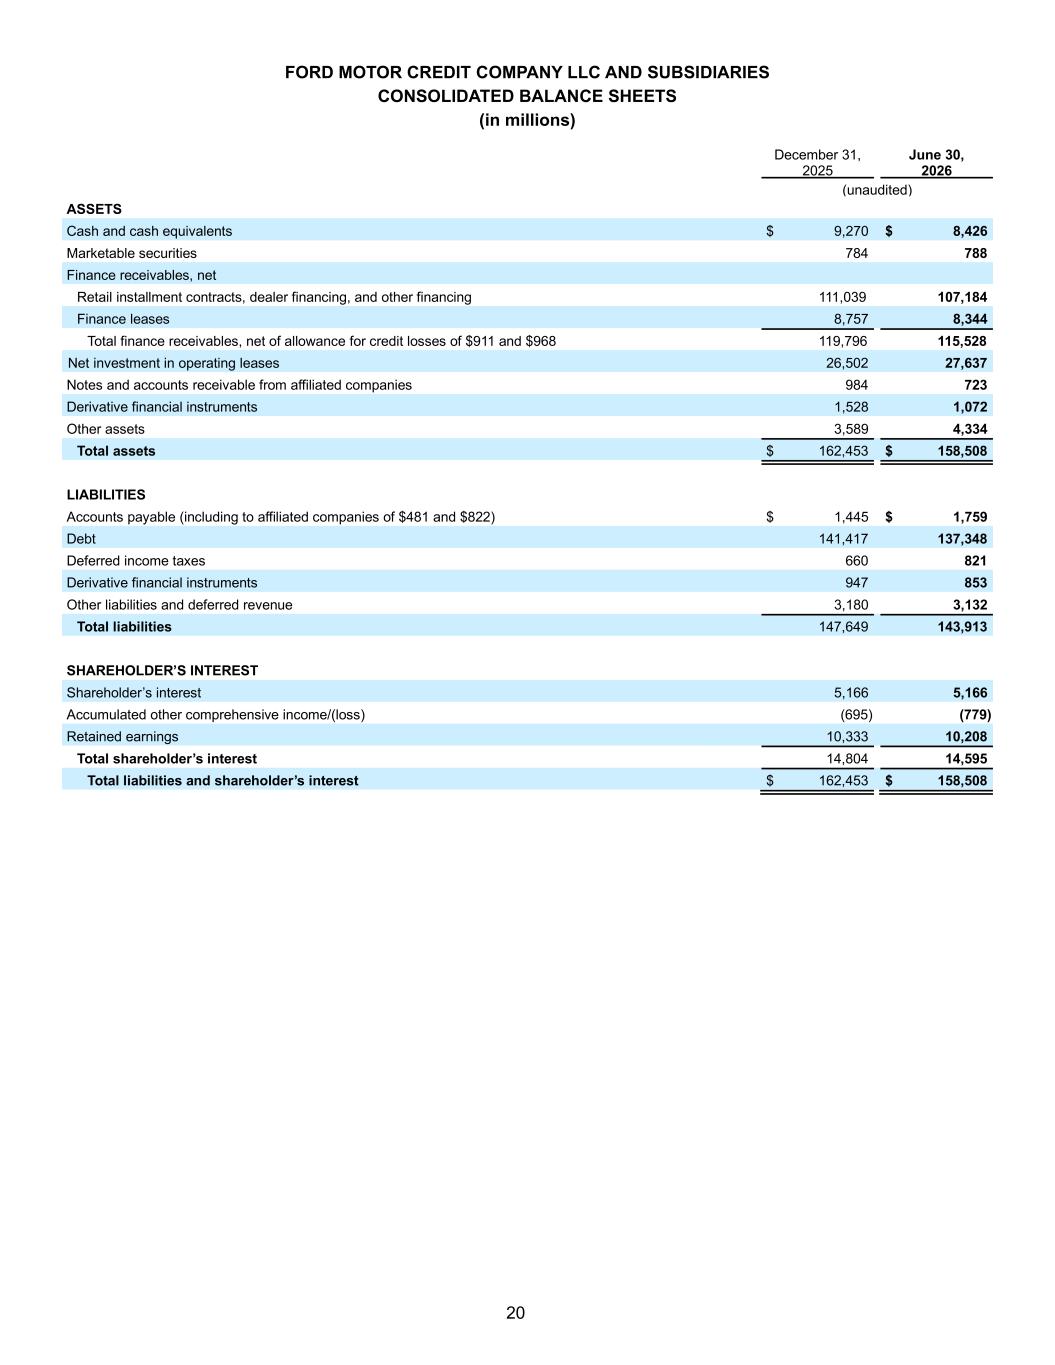
20 FORD MOTOR CREDIT COMPANY LLC AND SUBSIDIARIES CONSOLIDATED BALANCE SHEETS (in millions) December 31, 2025 June 30, 2026 (unaudited) ASSETS Cash and cash equivalents $ 9,270 $ 8,426 Marketable securities 784 788 Finance receivables, net Retail installment contracts, dealer financing, and other financing 111,039 107,184 Finance leases 8,757 8,344 Total finance receivables, net of allowance for credit losses of $911 and $968 119,796 115,528 Net investment in operating leases 26,502 27,637 Notes and accounts receivable from affiliated companies 984 723 Derivative financial instruments 1,528 1,072 Other assets 3,589 4,334 Total assets $ 162,453 $ 158,508 LIABILITIES Accounts payable (including to affiliated companies of $481 and $822) $ 1,445 $ 1,759 Debt 141,417 137,348 Deferred income taxes 660 821 Derivative financial instruments 947 853 Other liabilities and deferred revenue 3,180 3,132 Total liabilities 147,649 143,913 SHAREHOLDER’S INTEREST Shareholder’s interest 5,166 5,166 Accumulated other comprehensive income/(loss) (695) (779) Retained earnings 10,333 10,208 Total shareholder’s interest 14,804 14,595 Total liabilities and shareholder’s interest $ 162,453 $ 158,508
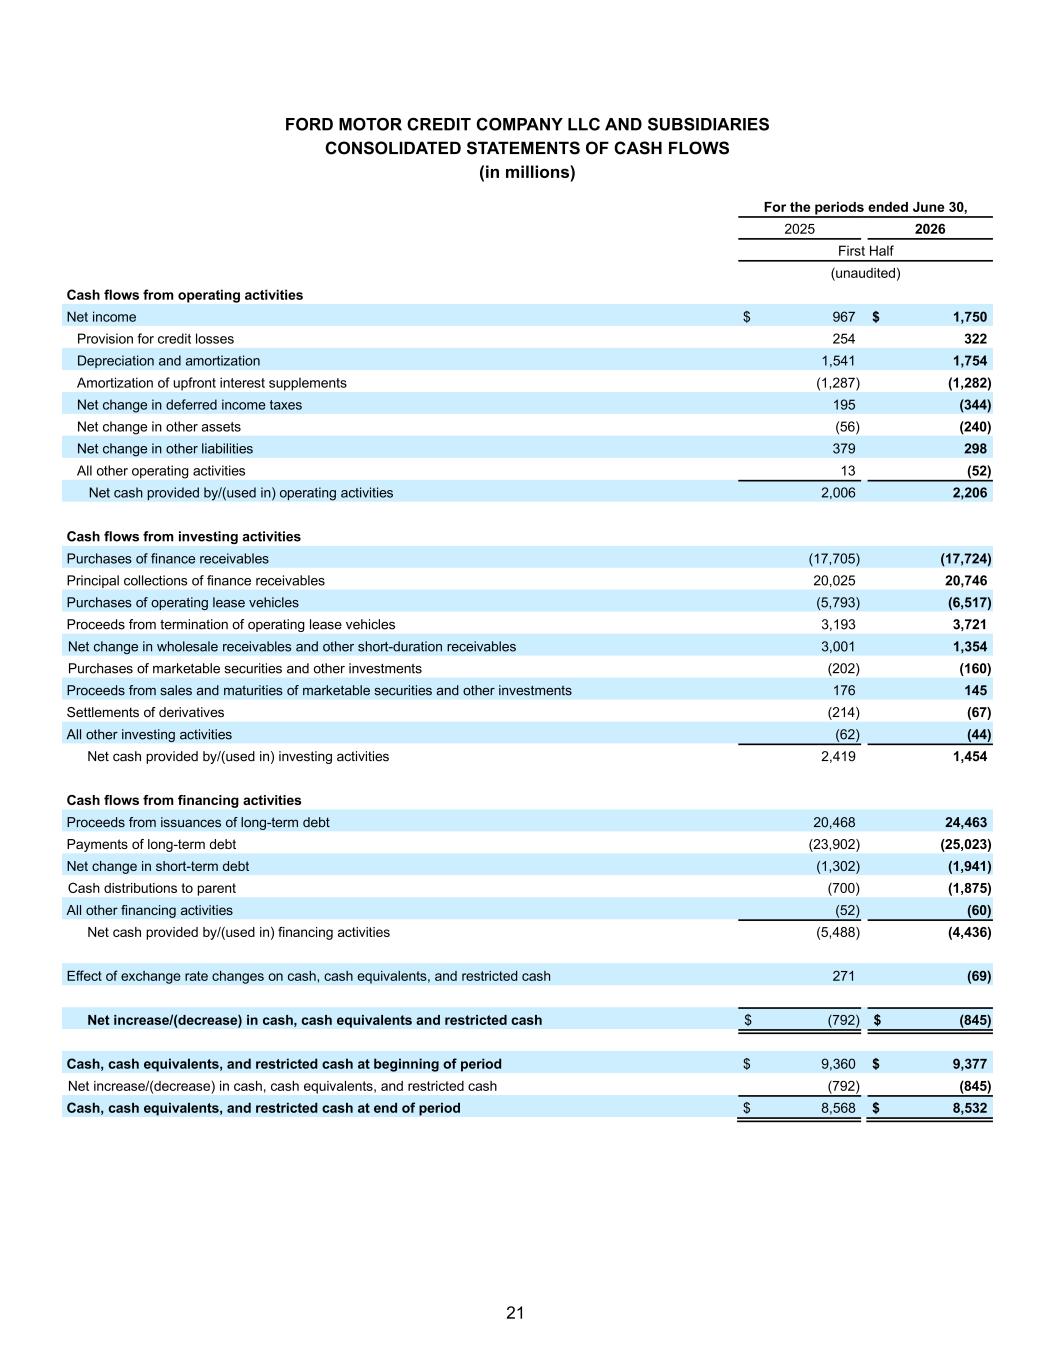
21 FORD MOTOR CREDIT COMPANY LLC AND SUBSIDIARIES CONSOLIDATED STATEMENTS OF CASH FLOWS (in millions) For the periods ended June 30, 2025 2026 First Half (unaudited) Cash flows from operating activities Net income $ 967 $ 1,750 Provision for credit losses 254 322 Depreciation and amortization 1,541 1,754 Amortization of upfront interest supplements (1,287) (1,282) Net change in deferred income taxes 195 (344) Net change in other assets (56) (240) Net change in other liabilities 379 298 All other operating activities 13 (52) Net cash provided by/(used in) operating activities 2,006 2,206 Cash flows from investing activities Purchases of finance receivables (17,705) (17,724) Principal collections of finance receivables 20,025 20,746 Purchases of operating lease vehicles (5,793) (6,517) Proceeds from termination of operating lease vehicles 3,193 3,721 Net change in wholesale receivables and other short-duration receivables 3,001 1,354 Purchases of marketable securities and other investments (202) (160) Proceeds from sales and maturities of marketable securities and other investments 176 145 Settlements of derivatives (214) (67) All other investing activities (62) (44) Net cash provided by/(used in) investing activities 2,419 1,454 Cash flows from financing activities Proceeds from issuances of long-term debt 20,468 24,463 Payments of long-term debt (23,902) (25,023) Net change in short-term debt (1,302) (1,941) Cash distributions to parent (700) (1,875) All other financing activities (52) (60) Net cash provided by/(used in) financing activities (5,488) (4,436) Effect of exchange rate changes on cash, cash equivalents, and restricted cash 271 (69) Net increase/(decrease) in cash, cash equivalents and restricted cash $ (792) $ (845) Cash, cash equivalents, and restricted cash at beginning of period $ 9,360 $ 9,377 Net increase/(decrease) in cash, cash equivalents, and restricted cash (792) (845) Cash, cash equivalents, and restricted cash at end of period $ 8,568 $ 8,532