Second Quarter 2026 Earnings Call
Forward-Looking Statements This presentation may contain various statements about Renasant Corporation (“Renasant,” the “Company,” “we,” “our,” or “us”) that constitute “forward-looking statements” within the meaning of Section 27A of the Securities Act of 1933, as amended, and Section 21E of the Securities Exchange Act of 1934, as amended. Statements preceded by, followed by or that otherwise include the words “believes,” “expects,” “projects,” “anticipates,” “intends,” “estimates,” “plans,” “potential,” “focus,” “possible,” “may increase,” “may fluctuate,” “will likely result,” or similar expressions, or future or conditional verbs such as “will,” “should,” “would” and “could,” are generally forward-looking in nature and not historical facts. Forward-looking statements include information about our future financial performance, business strategy, projected plans and objectives and are based on the current beliefs and expectations of management. We believe these forward-looking statements are reasonable, but they are all inherently subject to significant business, economic and competitive risks and uncertainties, many of which are beyond our control. In addition, these forward-looking statements are subject to assumptions about future business strategies and decisions that are subject to change. Actual results may differ from those indicated or implied in the forward-looking statements; such differences may be material. Prospective investors are cautioned that any forward-looking statements are not guarantees of future performance and involve risks and uncertainties. Investors should not place undue reliance on these forward-looking statements, which speak only as of the date they are made. Important factors currently known to management that could cause the Company’s actual results to differ materially from those in forward-looking statements include the following: (i) the Company’s ability to efficiently integrate acquisitions into its operations, retain the customers of these businesses, grow the acquired operations and realize the cost savings expected from an acquisition to the extent and in the timeframe anticipated by management (including the possibility that such cost savings will not be realized when expected, or at all, as a result of the impact of, or challenges arising from, the integration of the acquired assets and assumed liabilities into the Company, potential adverse reactions or changes to business or employee relationships, or as a result of other unexpected factors or events); (ii) potential exposure to unknown or contingent risks and liabilities the Company has acquired or may acquire; (iii) the effect of economic conditions and interest rates on a national, regional or international basis; (iv) timing and success of the implementation of changes in operations to achieve enhanced earnings or effect cost savings; (v) our ability to remediate the material weakness in the Company’s internal control over financial reporting identified in the Company’s Annual Report on Form 10-K for the year ended December 1, 2025 filed with the Securities and Exchange Commission (the “SEC”) on March 2, 2026; (vi) competitive pressures in the consumer finance, commercial finance, financial services, asset management, retail banking, factoring and mortgage lending and auto lending industries; (vii) the financial resources of, and products available from, competitors; (viii) changes in laws and regulations as well as changes in accounting standards; (ix) changes in governmental and regulatory policy, whether applicable specifically to financial institutions or impacting the United States generally (such as, for example, changes in trade policy); (x) changes in the securities and foreign exchange markets; (xi) the Company’s potential growth, including its entrance or expansion into new markets, and the need for sufficient capital to support that growth; (xii) changes in the quality or composition of the Company’s loan or investment portfolios, including adverse developments in borrower industries or in the repayment ability of individual borrowers or issuers of investment securities, or the impact of interest rates on the value of the Company’s investment securities portfolio; (xiii) an insufficient allowance for credit losses as a result of inaccurate assumptions; (xiv) changes in the sources and costs of the capital the Company uses to make loans and otherwise fund the Company’s operations, due to deposit outflows, changes in the mix of deposits and the cost and availability of borrowings; (xv) general economic, market or business conditions, including the impact of inflation; (xvi) changes in demand for loan and deposit products and other financial services; (xvii) concentrations of credit or deposit exposure; (xviii) changes or the lack of changes in interest rates, yield curves and interest rate spread relationships; (xix) losses resulting from fraudulent activity, including loan and deposit fraud and social engineering attacks targeting our customers, employees and third party vendors; (xx) increased cybersecurity risk, including potential network breaches, business disruptions or financial losses, including as a result of sophisticated attacks using artificial intelligence (“AI”) and similar tools; (xxi) civil unrest, natural disasters, epidemics and other catastrophic events in the Company’s geographic area; (xxii) geopolitical conditions, including acts or threats of terrorism and actions taken by the United States or other governments in response to acts or threats of terrorism and/or military conflicts, which could impact business and economic conditions in the United States and abroad; (xxiii) the impact, extent and timing of technological changes, including the rapid development of AI technologies; and (xxiv) other circumstances, many of which are beyond management’s control. Management believes that the assumptions underlying our forward-looking statements are reasonable, but any of the assumptions could prove to be inaccurate. Investors are urged to carefully consider the risks described in Renasant’s filings with the SEC from time to time, including its most recent Annual Report on Form 10-K and subsequent Quarterly Reports on Form 10-Q, which are available at www.renasant.com and the SEC’s website at www.sec.gov. We undertake no obligation, and specifically disclaim any obligation, to update or revise our forward-looking statements, whether as a result of new information or to reflect changed assumptions, the occurrence of unanticipated events or changes to future operating results over time, except as required by federal securities laws. 2
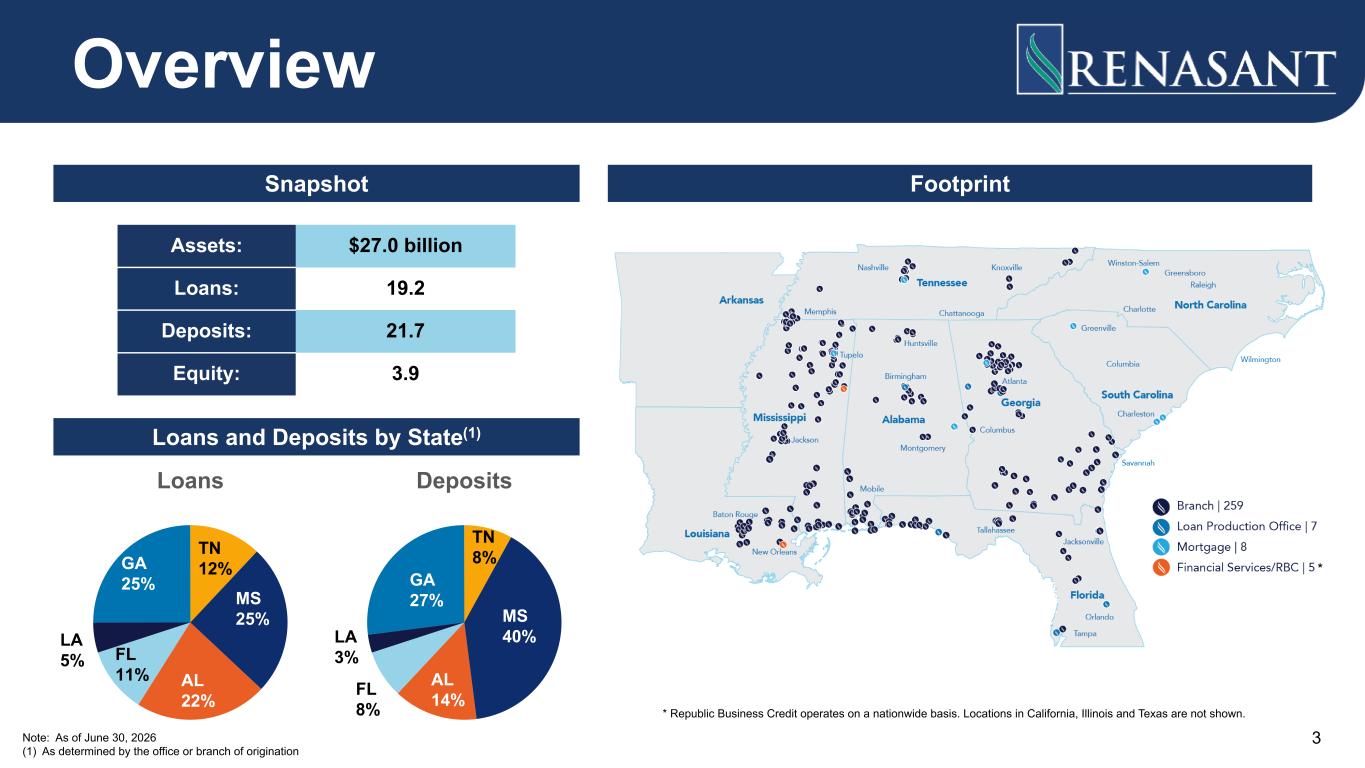
Loans TN 12% MS 25% AL 22% FL 11% LA 5% GA 25% Deposits TN 8% MS 40% AL 14%FL 8% LA 3% GA 27% * Overview * Republic Business Credit operates on a nationwide basis. Locations in California, Illinois and Texas are not shown. Snapshot Footprint Loans and Deposits by State(1) Note: As of June 30, 2026 (1) As determined by the office or branch of origination 3 Assets: $27.0 billion Loans: 19.2 Deposits: 21.7 Equity: 3.9
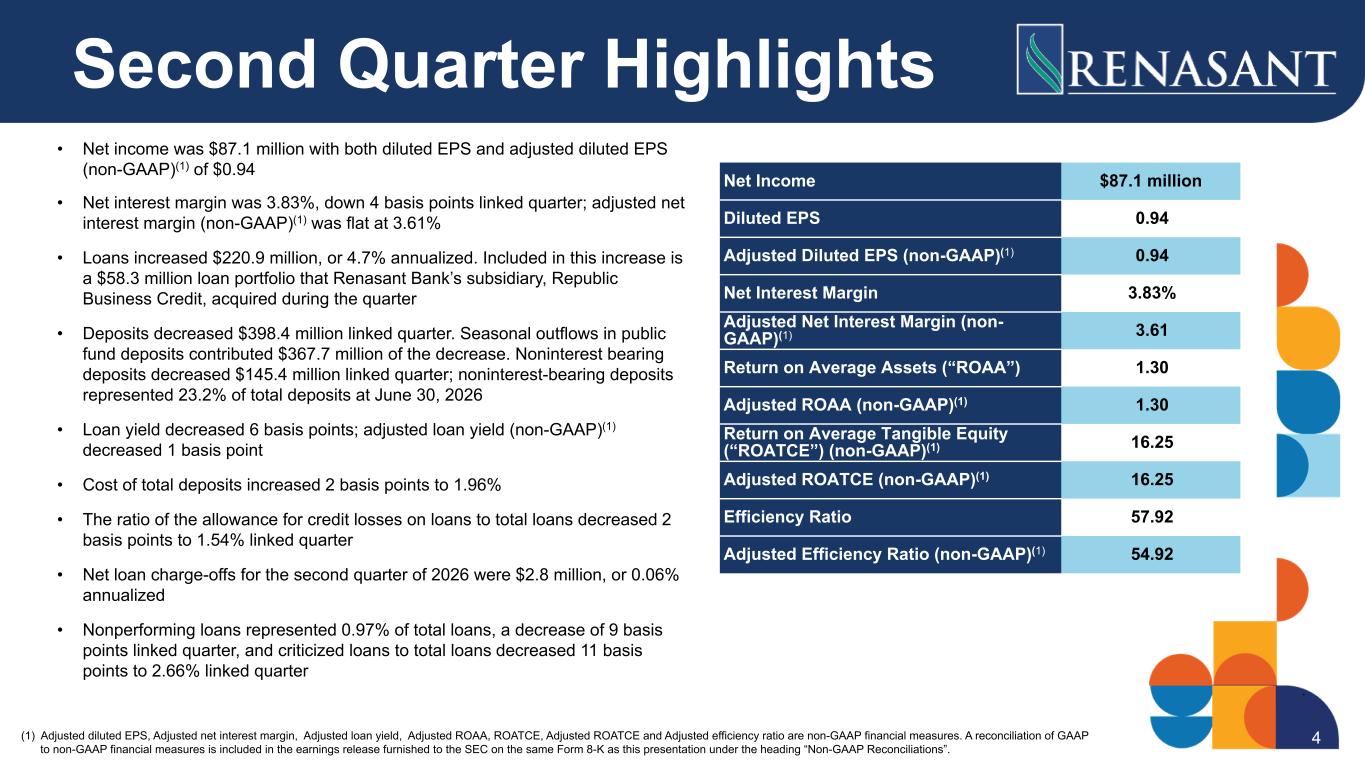
Second Quarter Highlights • Net income was $87.1 million with both diluted EPS and adjusted diluted EPS (non-GAAP)(1) of $0.94 • Net interest margin was 3.83%, down 4 basis points linked quarter; adjusted net interest margin (non-GAAP)(1) was flat at 3.61% • Loans increased $220.9 million, or 4.7% annualized. Included in this increase is a $58.3 million loan portfolio that Renasant Bank’s subsidiary, Republic Business Credit, acquired during the quarter • Deposits decreased $398.4 million linked quarter. Seasonal outflows in public fund deposits contributed $367.7 million of the decrease. Noninterest bearing deposits decreased $145.4 million linked quarter; noninterest-bearing deposits represented 23.2% of total deposits at June 30, 2026 • Loan yield decreased 6 basis points; adjusted loan yield (non-GAAP)(1) decreased 1 basis point • Cost of total deposits increased 2 basis points to 1.96% • The ratio of the allowance for credit losses on loans to total loans decreased 2 basis points to 1.54% linked quarter • Net loan charge-offs for the second quarter of 2026 were $2.8 million, or 0.06% annualized • Nonperforming loans represented 0.97% of total loans, a decrease of 9 basis points linked quarter, and criticized loans to total loans decreased 11 basis points to 2.66% linked quarter (1) Adjusted diluted EPS, Adjusted net interest margin, Adjusted loan yield, Adjusted ROAA, ROATCE, Adjusted ROATCE and Adjusted efficiency ratio are non-GAAP financial measures. A reconciliation of GAAP to non-GAAP financial measures is included in the earnings release furnished to the SEC on the same Form 8-K as this presentation under the heading “Non-GAAP Reconciliations”. 4 Net Income $87.1 million Diluted EPS 0.94 Adjusted Diluted EPS (non-GAAP)(1) 0.94 Net Interest Margin 3.83% Adjusted Net Interest Margin (non- GAAP)(1) 3.61 Return on Average Assets (“ROAA”) 1.30 Adjusted ROAA (non-GAAP)(1) 1.30 Return on Average Tangible Equity (“ROATCE”) (non-GAAP)(1) 16.25 Adjusted ROATCE (non-GAAP)(1) 16.25 Efficiency Ratio 57.92 Adjusted Efficiency Ratio (non-GAAP)(1) 54.92
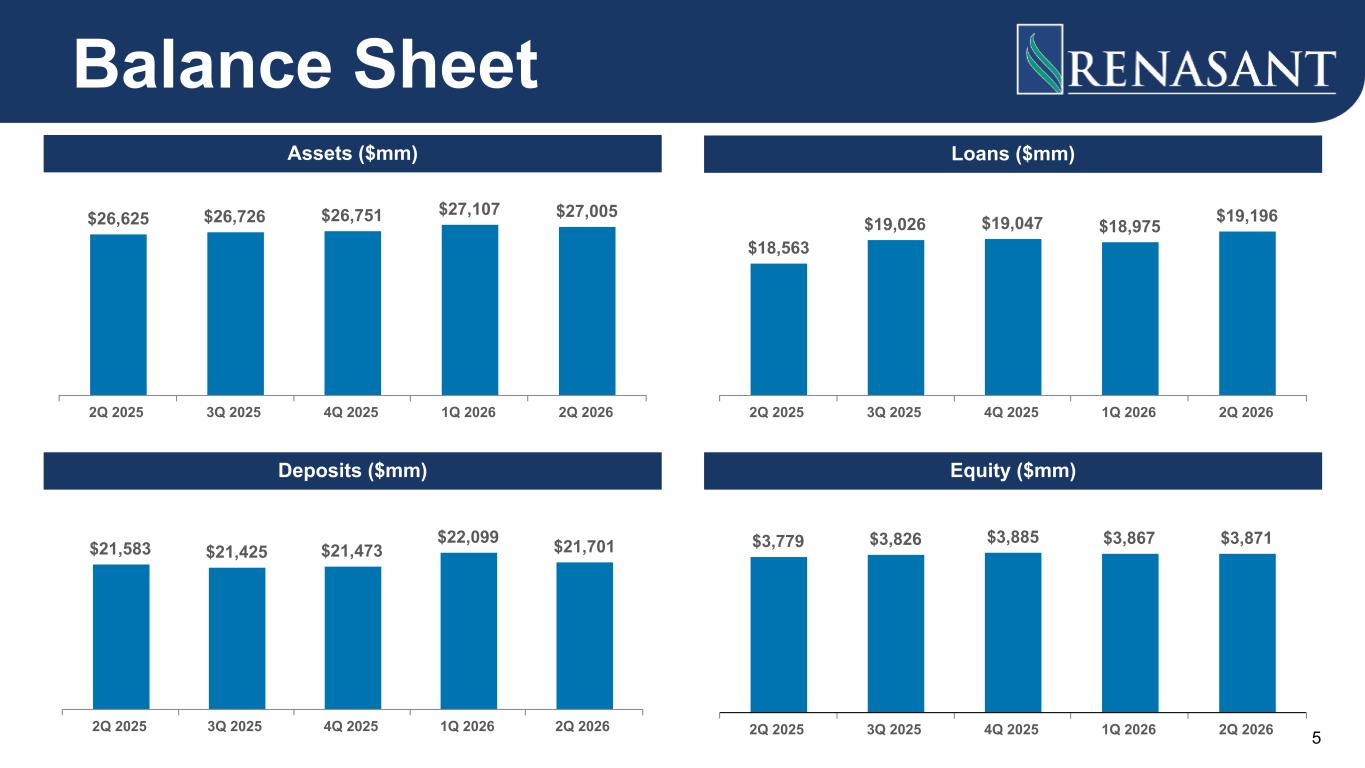
$26,625 $26,726 $26,751 $27,107 $27,005 2Q 2025 3Q 2025 4Q 2025 1Q 2026 2Q 2026 $18,563 $19,026 $19,047 $18,975 $19,196 2Q 2025 3Q 2025 4Q 2025 1Q 2026 2Q 2026 $21,583 $21,425 $21,473 $22,099 $21,701 2Q 2025 3Q 2025 4Q 2025 1Q 2026 2Q 2026 $3,779 $3,826 $3,885 $3,867 $3,871 2Q 2025 3Q 2025 4Q 2025 1Q 2026 2Q 2026 Balance Sheet Assets ($mm) Loans ($mm) Deposits ($mm) Equity ($mm) 5
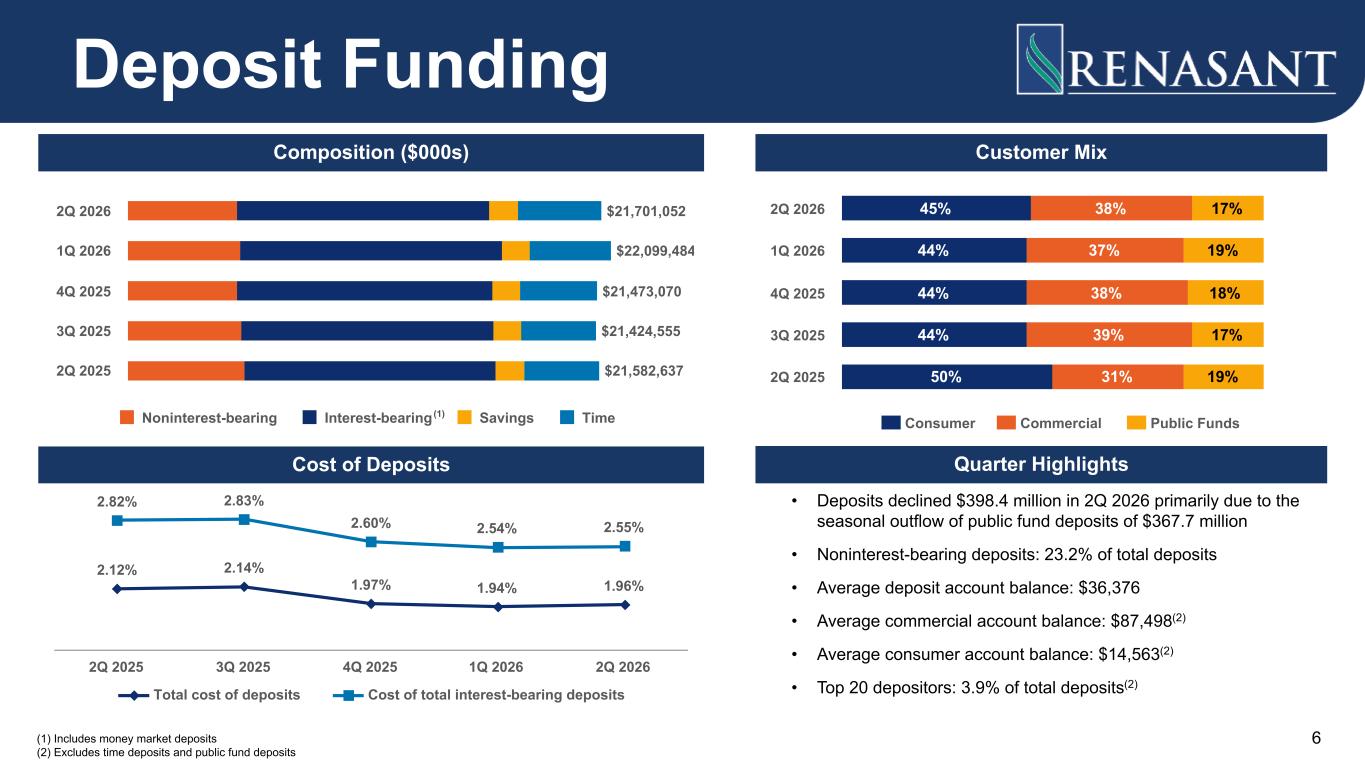
(1) Includes money market deposits (2) Excludes time deposits and public fund deposits Composition ($000s) Quarter Highlights $21,701,052 $22,099,484 $21,473,070 $21,424,555 $21,582,637 Noninterest-bearing Interest-bearing Savings Time 2Q 2026 1Q 2026 4Q 2025 3Q 2025 2Q 2025 Deposit Funding • Deposits declined $398.4 million in 2Q 2026 primarily due to the seasonal outflow of public fund deposits of $367.7 million • Noninterest-bearing deposits: 23.2% of total deposits • Average deposit account balance: $36,376 • Average commercial account balance: $87,498(2) • Average consumer account balance: $14,563(2) • Top 20 depositors: 3.9% of total deposits(2) Customer Mix 45% 44% 44% 44% 50% 38% 37% 38% 39% 31% 17% 19% 18% 17% 19% Consumer Commercial Public Funds 2Q 2026 1Q 2026 4Q 2025 3Q 2025 2Q 2025 2.12% 2.14% 1.97% 1.94% 1.96% 2.82% 2.83% 2.60% 2.54% 2.55% Total cost of deposits Cost of total interest-bearing deposits 2Q 2025 3Q 2025 4Q 2025 1Q 2026 2Q 2026 Cost of Deposits 6 (1)
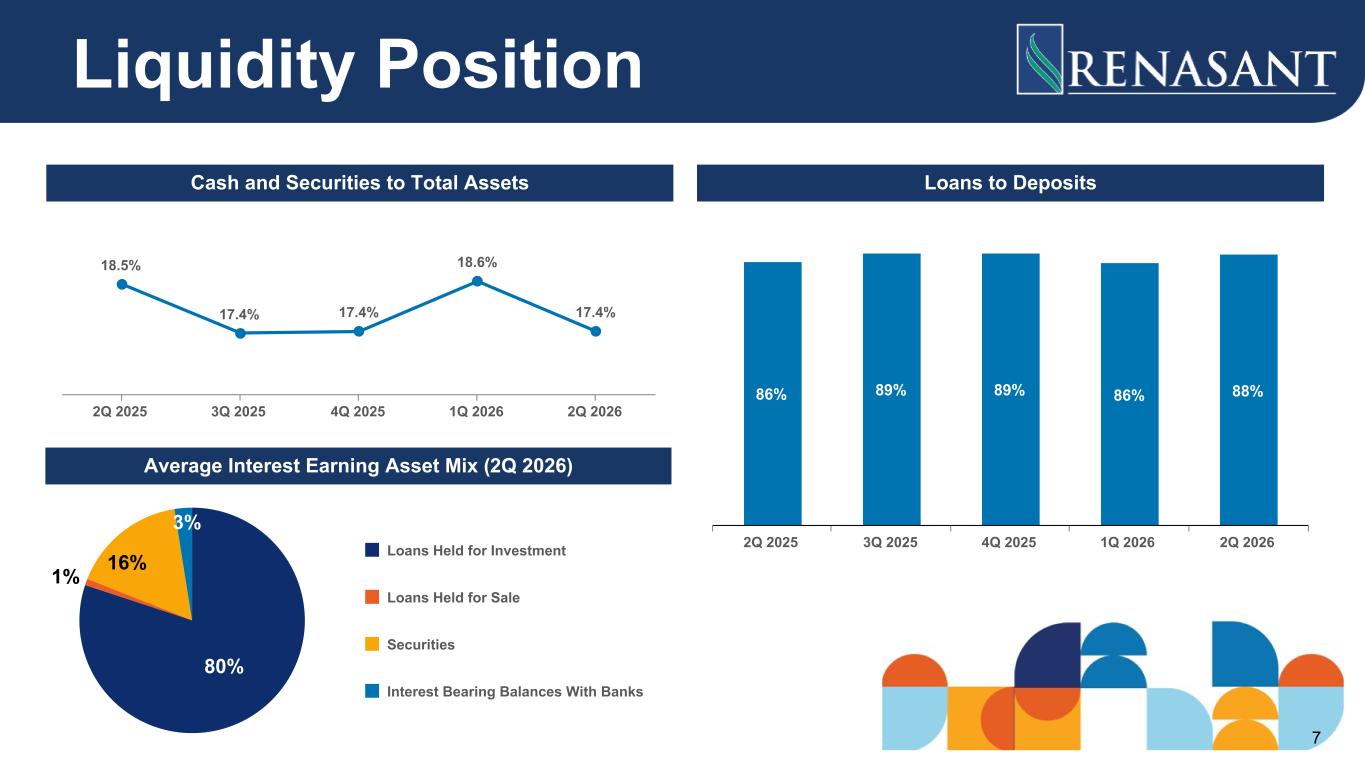
Cash and Securities to Total Assets Loans to Deposits Average Interest Earning Asset Mix (2Q 2026) 18.5% 17.4% 17.4% 18.6% 17.4% 2Q 2025 3Q 2025 4Q 2025 1Q 2026 2Q 2026 86% 89% 89% 86% 88% 2Q 2025 3Q 2025 4Q 2025 1Q 2026 2Q 2026 80% 1% 16% 3% Loans Held for Investment Loans Held for Sale Securities Interest Bearing Balances With Banks Liquidity Position 7
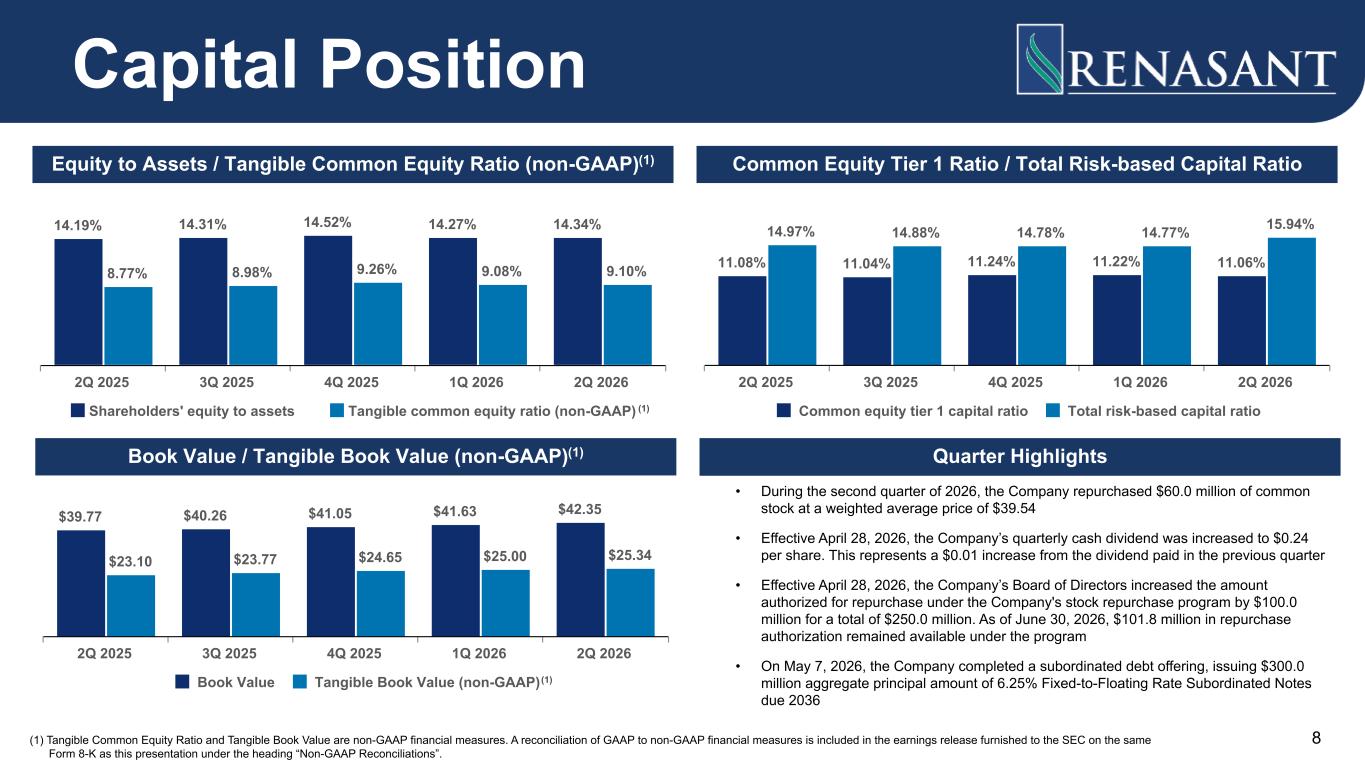
14.19% 14.31% 14.52% 14.27% 14.34% 8.77% 8.98% 9.26% 9.08% 9.10% Shareholders' equity to assets Tangible common equity ratio (non-GAAP) 2Q 2025 3Q 2025 4Q 2025 1Q 2026 2Q 2026 11.08% 11.04% 11.24% 11.22% 11.06% 14.97% 14.88% 14.78% 14.77% 15.94% Common equity tier 1 capital ratio Total risk-based capital ratio 2Q 2025 3Q 2025 4Q 2025 1Q 2026 2Q 2026 Quarter Highlights • During the second quarter of 2026, the Company repurchased $60.0 million of common stock at a weighted average price of $39.54 • Effective April 28, 2026, the Company’s quarterly cash dividend was increased to $0.24 per share. This represents a $0.01 increase from the dividend paid in the previous quarter • Effective April 28, 2026, the Company’s Board of Directors increased the amount authorized for repurchase under the Company's stock repurchase program by $100.0 million for a total of $250.0 million. As of June 30, 2026, $101.8 million in repurchase authorization remained available under the program • On May 7, 2026, the Company completed a subordinated debt offering, issuing $300.0 million aggregate principal amount of 6.25% Fixed-to-Floating Rate Subordinated Notes due 2036 (1) Tangible Common Equity Ratio and Tangible Book Value are non-GAAP financial measures. A reconciliation of GAAP to non-GAAP financial measures is included in the earnings release furnished to the SEC on the same Form 8-K as this presentation under the heading “Non-GAAP Reconciliations”. $39.77 $40.26 $41.05 $41.63 $42.35 $23.10 $23.77 $24.65 $25.00 $25.34 Book Value Tangible Book Value (non-GAAP) 2Q 2025 3Q 2025 4Q 2025 1Q 2026 2Q 2026 Capital Position Equity to Assets / Tangible Common Equity Ratio (non-GAAP)(1) Common Equity Tier 1 Ratio / Total Risk-based Capital Ratio Book Value / Tangible Book Value (non-GAAP)(1) 8 (1) (1)
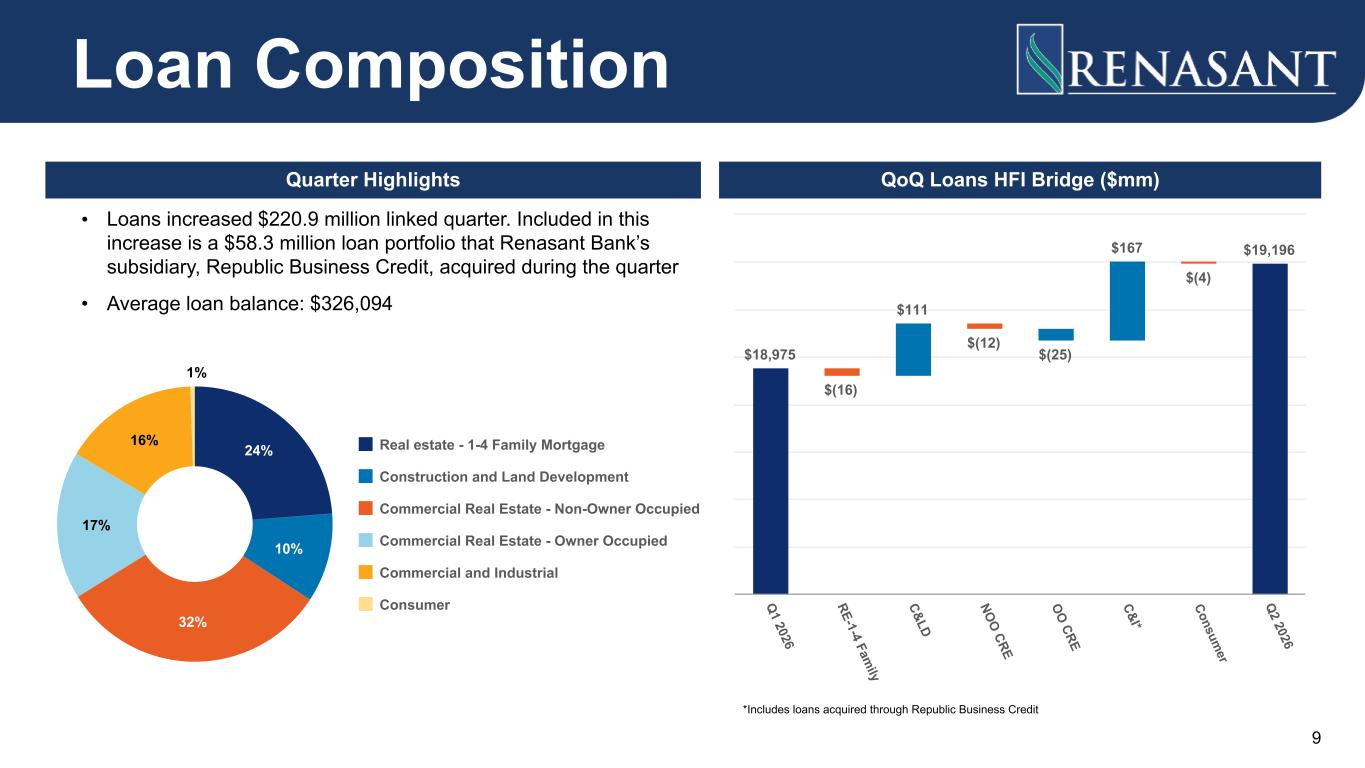
QoQ Loans HFI Bridge ($mm) $18,975 $(16) $111 $(12) $(25) $167 $(4) $19,196 Q 1 2026 RE-1-4 Fam ily C&LD NO O CRE O O CRE C&I* Consum er Q 2 2026 Quarter Highlights • Loans increased $220.9 million linked quarter. Included in this increase is a $58.3 million loan portfolio that Renasant Bank’s subsidiary, Republic Business Credit, acquired during the quarter • Average loan balance: $326,094 24% 10% 32% 17% 16% 1% Real estate - 1-4 Family Mortgage Construction and Land Development Commercial Real Estate - Non-Owner Occupied Commercial Real Estate - Owner Occupied Commercial and Industrial Consumer Loan Composition 9 *Includes loans acquired through Republic Business Credit
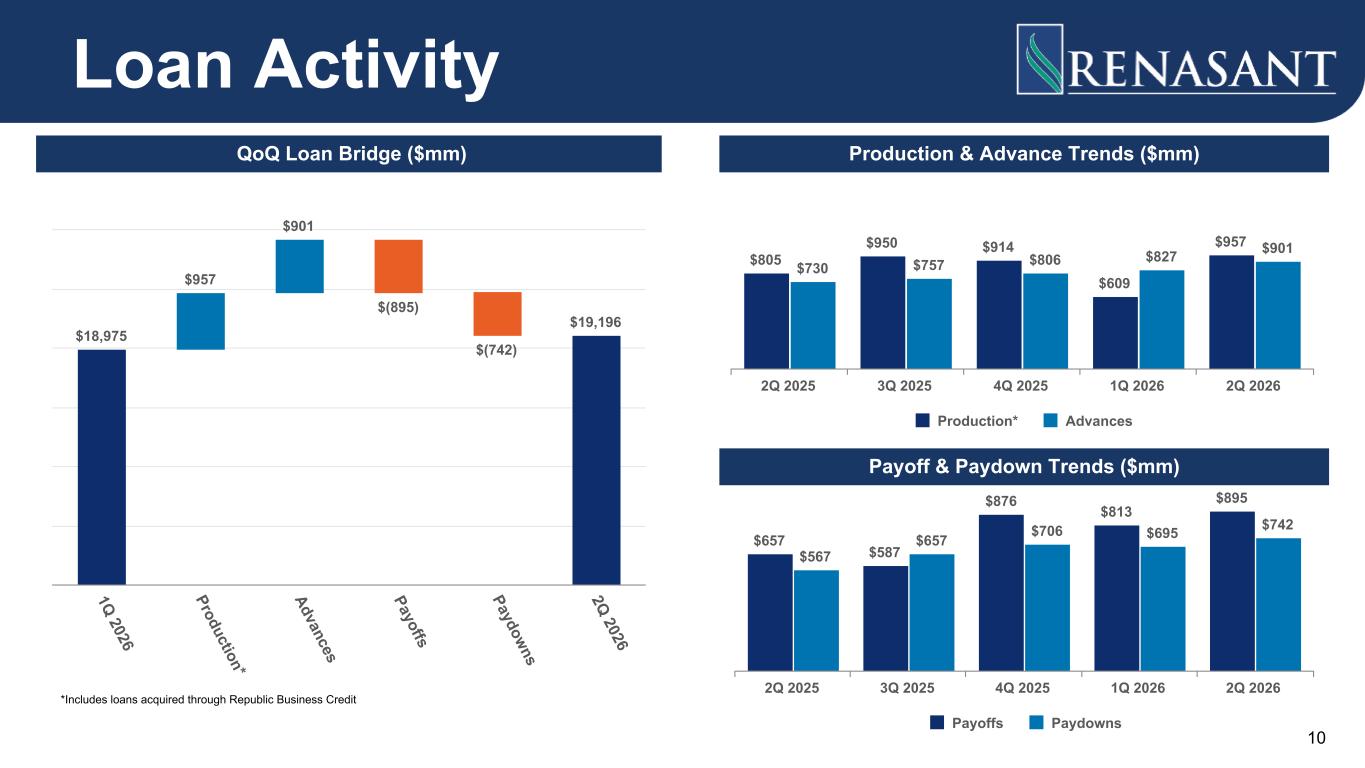
$805 $950 $914 $609 $957 $730 $757 $806 $827 $901 Production* Advances 2Q 2025 3Q 2025 4Q 2025 1Q 2026 2Q 2026 $657 $587 $876 $813 $895 $567 $657 $706 $695 $742 Payoffs Paydowns 2Q 2025 3Q 2025 4Q 2025 1Q 2026 2Q 2026 $18,975 $957 $901 $(895) $(742) $19,196 1Q 2026 Production* Advances Payoffs Paydowns 2Q 2026 Loan Activity QoQ Loan Bridge ($mm) Production & Advance Trends ($mm) Payoff & Paydown Trends ($mm) 10 *Includes loans acquired through Republic Business Credit
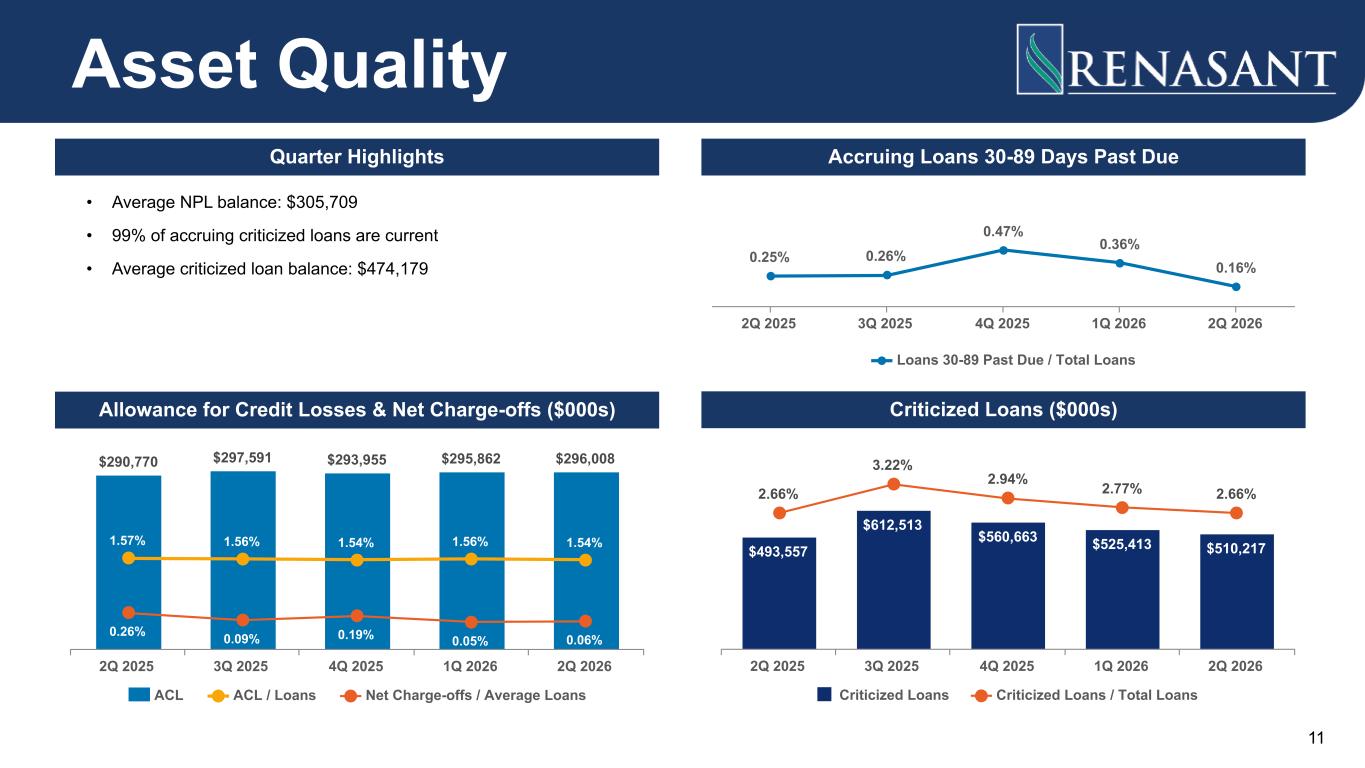
$290,770 $297,591 $293,955 $295,862 $296,008 1.57% 1.56% 1.54% 1.56% 1.54% 0.26% 0.09% 0.19% 0.05% 0.06% ACL ACL / Loans Net Charge-offs / Average Loans 2Q 2025 3Q 2025 4Q 2025 1Q 2026 2Q 2026 $493,557 $612,513 $560,663 $525,413 $510,217 2.66% 3.22% 2.94% 2.77% 2.66% Criticized Loans Criticized Loans / Total Loans 2Q 2025 3Q 2025 4Q 2025 1Q 2026 2Q 2026 Asset Quality Criticized Loans ($000s)Allowance for Credit Losses & Net Charge-offs ($000s) 0.25% 0.26% 0.47% 0.36% 0.16% Loans 30-89 Past Due / Total Loans 2Q 2025 3Q 2025 4Q 2025 1Q 2026 2Q 2026 Accruing Loans 30-89 Days Past DueQuarter Highlights • Average NPL balance: $305,709 • 99% of accruing criticized loans are current • Average criticized loan balance: $474,179 11
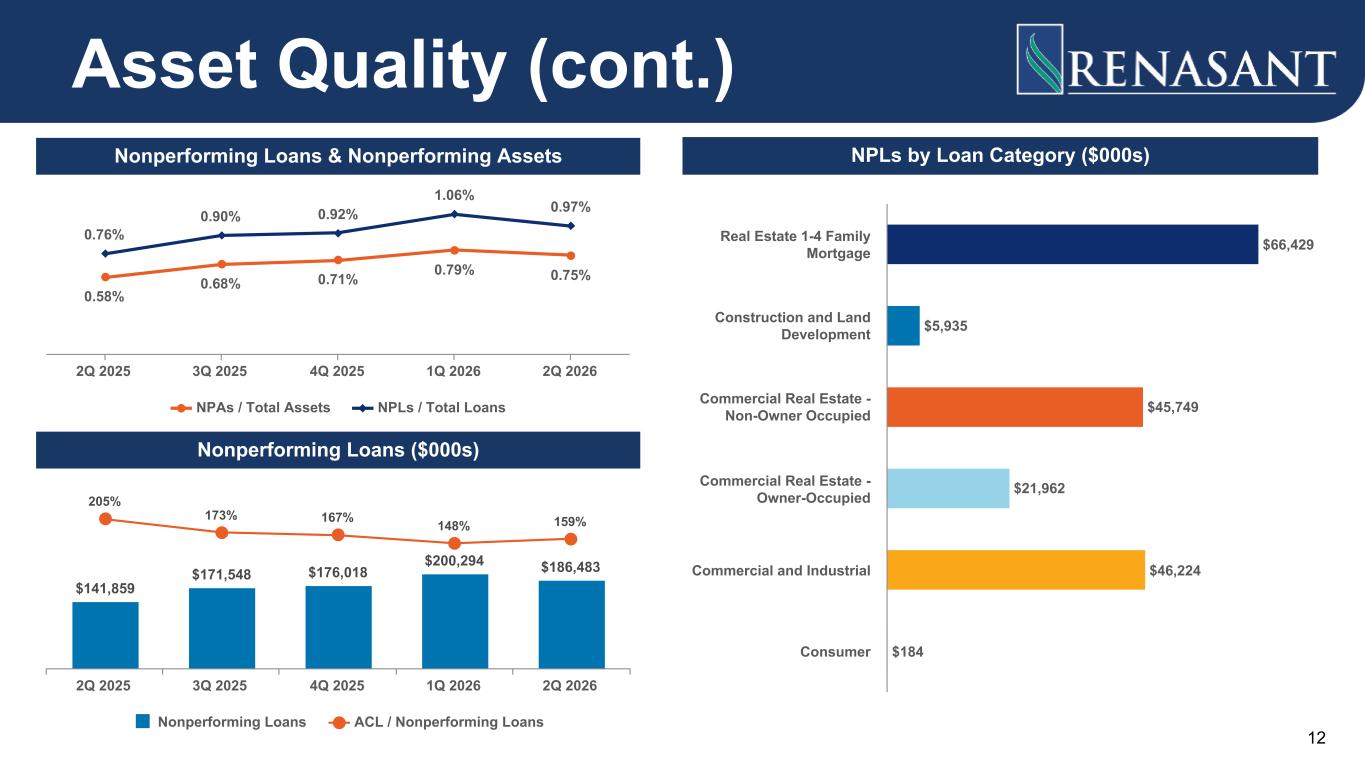
0.58% 0.68% 0.71% 0.79% 0.75% 0.76% 0.90% 0.92% 1.06% 0.97% NPAs / Total Assets NPLs / Total Loans 2Q 2025 3Q 2025 4Q 2025 1Q 2026 2Q 2026 $66,429 $5,935 $45,749 $21,962 $46,224 $184 Real Estate 1-4 Family Mortgage Construction and Land Development Commercial Real Estate - Non-Owner Occupied Commercial Real Estate - Owner-Occupied Commercial and Industrial Consumer NPLs by Loan Category ($000s) Asset Quality (cont.) Nonperforming Loans & Nonperforming Assets $141,859 $171,548 $176,018 $200,294 $186,483 205% 173% 167% 148% 159% Nonperforming Loans ACL / Nonperforming Loans 2Q 2025 3Q 2025 4Q 2025 1Q 2026 2Q 2026 Nonperforming Loans ($000s) 12
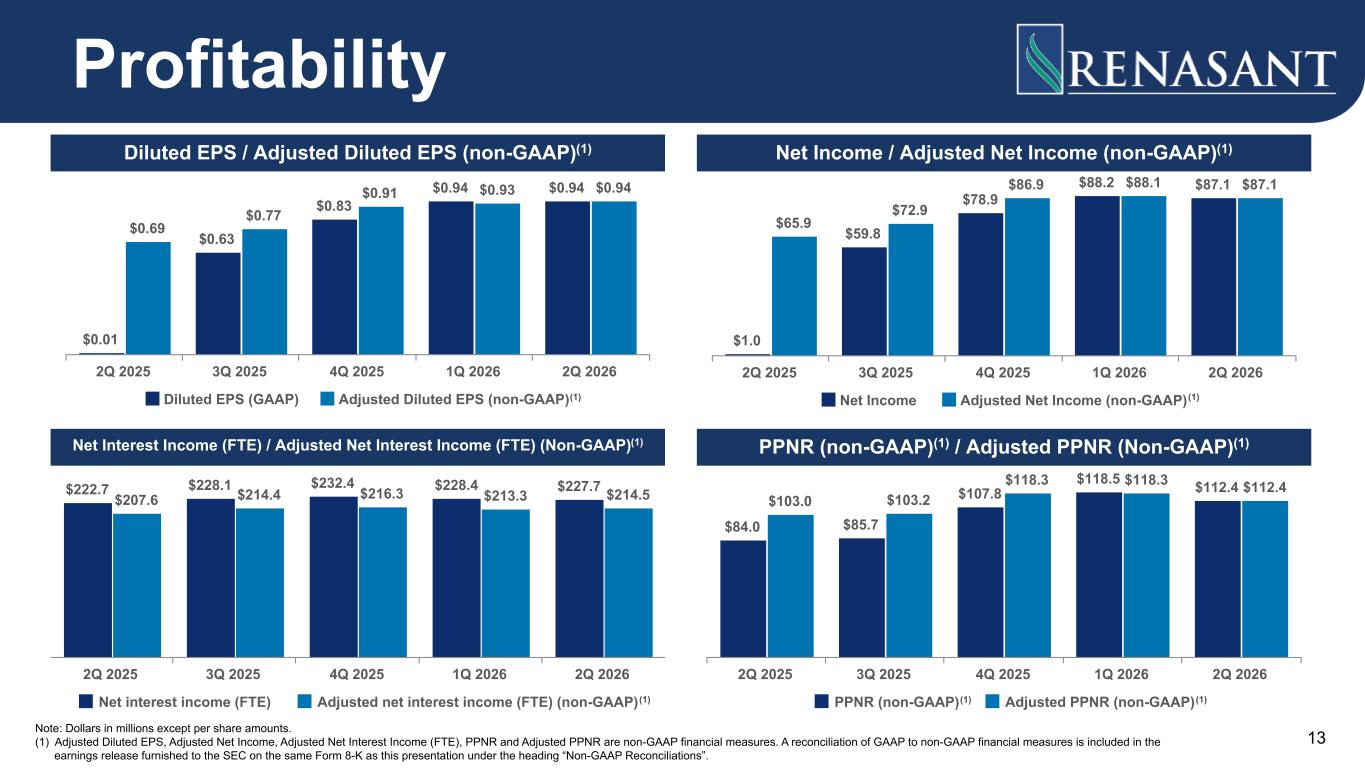
$0.01 $0.63 $0.83 $0.94 $0.94 $0.69 $0.77 $0.91 $0.93 $0.94 Diluted EPS (GAAP) Adjusted Diluted EPS (non-GAAP) 2Q 2025 3Q 2025 4Q 2025 1Q 2026 2Q 2026 $222.7 $228.1 $232.4 $228.4 $227.7 $207.6 $214.4 $216.3 $213.3 $214.5 Net interest income (FTE) Adjusted net interest income (FTE) (non-GAAP) 2Q 2025 3Q 2025 4Q 2025 1Q 2026 2Q 2026 Note: Dollars in millions except per share amounts. (1) Adjusted Diluted EPS, Adjusted Net Income, Adjusted Net Interest Income (FTE), PPNR and Adjusted PPNR are non-GAAP financial measures. A reconciliation of GAAP to non-GAAP financial measures is included in the earnings release furnished to the SEC on the same Form 8-K as this presentation under the heading “Non-GAAP Reconciliations”. $84.0 $85.7 $107.8 $118.5 $112.4 $103.0 $103.2 $118.3 $118.3 $112.4 PPNR (non-GAAP) Adjusted PPNR (non-GAAP) 2Q 2025 3Q 2025 4Q 2025 1Q 2026 2Q 2026 $1.0 $59.8 $78.9 $88.2 $87.1 $65.9 $72.9 $86.9 $88.1 $87.1 Net Income Adjusted Net Income (non-GAAP) 2Q 2025 3Q 2025 4Q 2025 1Q 2026 2Q 2026 Profitability Diluted EPS / Adjusted Diluted EPS (non-GAAP)(1) Net Income / Adjusted Net Income (non-GAAP)(1) PPNR (non-GAAP)(1) / Adjusted PPNR (Non-GAAP)(1)Net Interest Income (FTE) / Adjusted Net Interest Income (FTE) (Non-GAAP)(1) 13 (1) (1) (1) (1) (1)
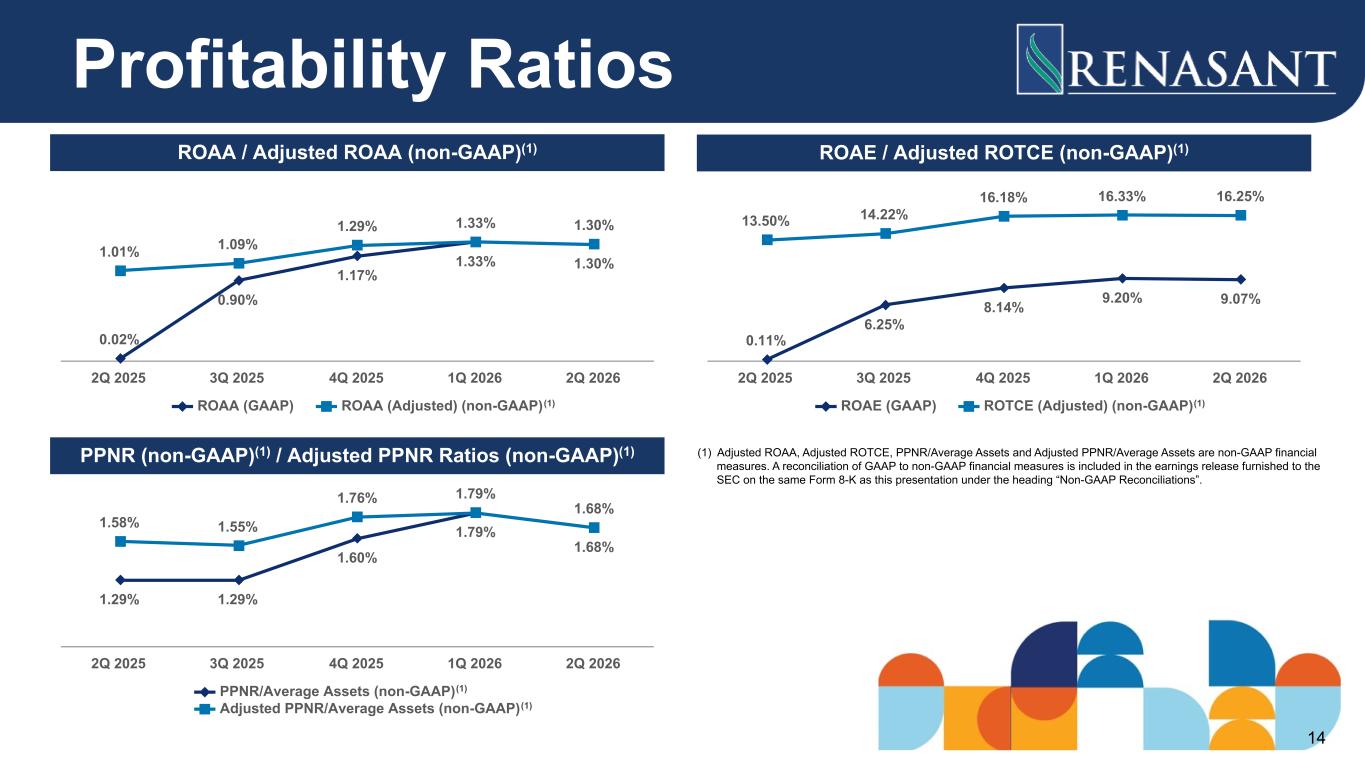
(1) Adjusted ROAA, Adjusted ROTCE, PPNR/Average Assets and Adjusted PPNR/Average Assets are non-GAAP financial measures. A reconciliation of GAAP to non-GAAP financial measures is included in the earnings release furnished to the SEC on the same Form 8-K as this presentation under the heading “Non-GAAP Reconciliations”. 0.02% 0.90% 1.17% 1.33% 1.30% 1.01% 1.09% 1.29% 1.33% 1.30% ROAA (GAAP) ROAA (Adjusted) (non-GAAP) 2Q 2025 3Q 2025 4Q 2025 1Q 2026 2Q 2026 0.11% 6.25% 8.14% 9.20% 9.07% 13.50% 14.22% 16.18% 16.33% 16.25% ROAE (GAAP) ROTCE (Adjusted) (non-GAAP) 2Q 2025 3Q 2025 4Q 2025 1Q 2026 2Q 2026 1.29% 1.29% 1.60% 1.79% 1.68% 1.58% 1.55% 1.76% 1.79% 1.68% PPNR/Average Assets (non-GAAP) Adjusted PPNR/Average Assets (non-GAAP) 2Q 2025 3Q 2025 4Q 2025 1Q 2026 2Q 2026 Profitability Ratios ROAA / Adjusted ROAA (non-GAAP)(1) ROAE / Adjusted ROTCE (non-GAAP)(1) PPNR (non-GAAP)(1) / Adjusted PPNR Ratios (non-GAAP)(1) 14 (1) (1) (1) (1)
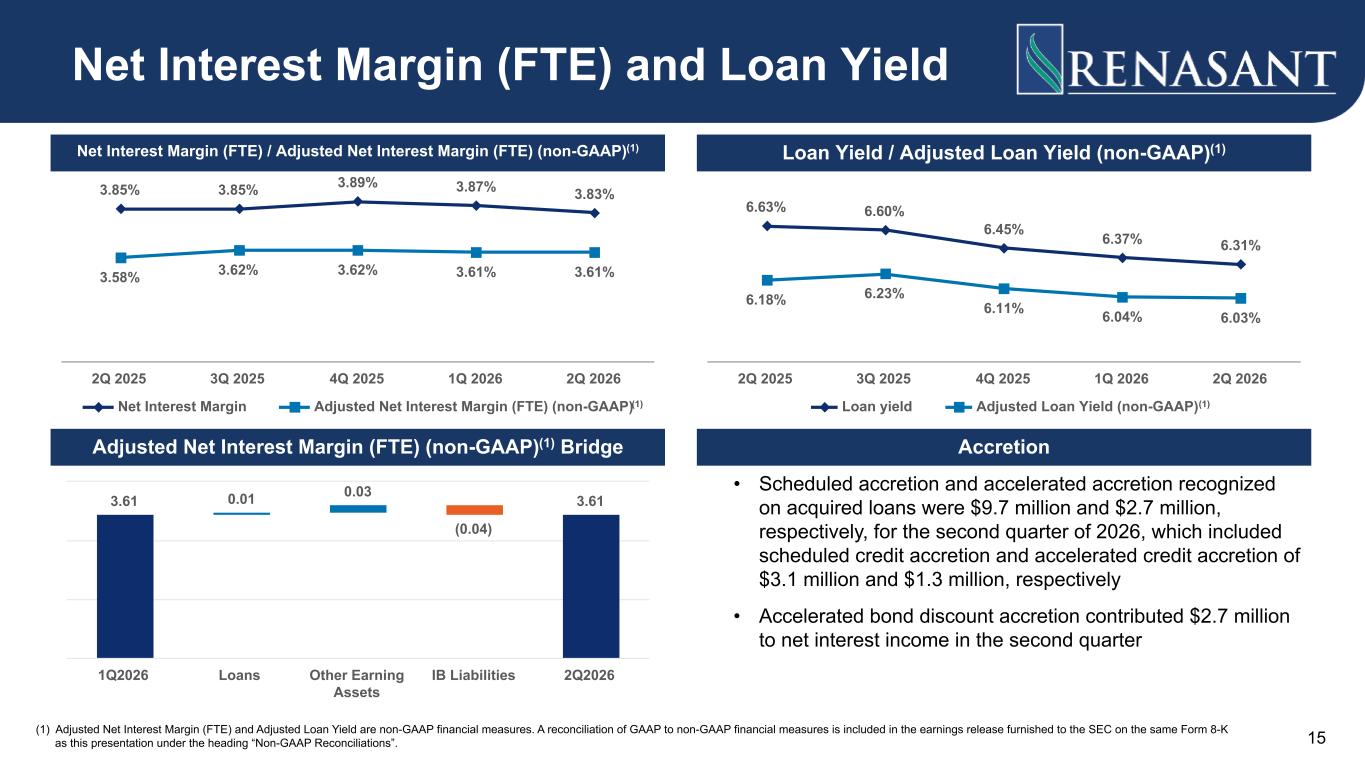
3.85% 3.85% 3.89% 3.87% 3.83% 3.58% 3.62% 3.62% 3.61% 3.61% Net Interest Margin Adjusted Net Interest Margin (FTE) (non-GAAP) 2Q 2025 3Q 2025 4Q 2025 1Q 2026 2Q 2026 (1) Adjusted Net Interest Margin (FTE) and Adjusted Loan Yield are non-GAAP financial measures. A reconciliation of GAAP to non-GAAP financial measures is included in the earnings release furnished to the SEC on the same Form 8-K as this presentation under the heading “Non-GAAP Reconciliations”. 6.63% 6.60% 6.45% 6.37% 6.31% 6.18% 6.23% 6.11% 6.04% 6.03% Loan yield Adjusted Loan Yield (non-GAAP) 2Q 2025 3Q 2025 4Q 2025 1Q 2026 2Q 2026 • Scheduled accretion and accelerated accretion recognized on acquired loans were $9.7 million and $2.7 million, respectively, for the second quarter of 2026, which included scheduled credit accretion and accelerated credit accretion of $3.1 million and $1.3 million, respectively • Accelerated bond discount accretion contributed $2.7 million to net interest income in the second quarter Net Interest Margin (FTE) and Loan Yield Net Interest Margin (FTE) / Adjusted Net Interest Margin (FTE) (non-GAAP)(1) Loan Yield / Adjusted Loan Yield (non-GAAP)(1) Adjusted Net Interest Margin (FTE) (non-GAAP)(1) Bridge Accretion 3.61 0.01 0.03 (0.04) 3.61 1Q2026 Loans Other Earning Assets IB Liabilities 2Q2026 15 (1) (1)
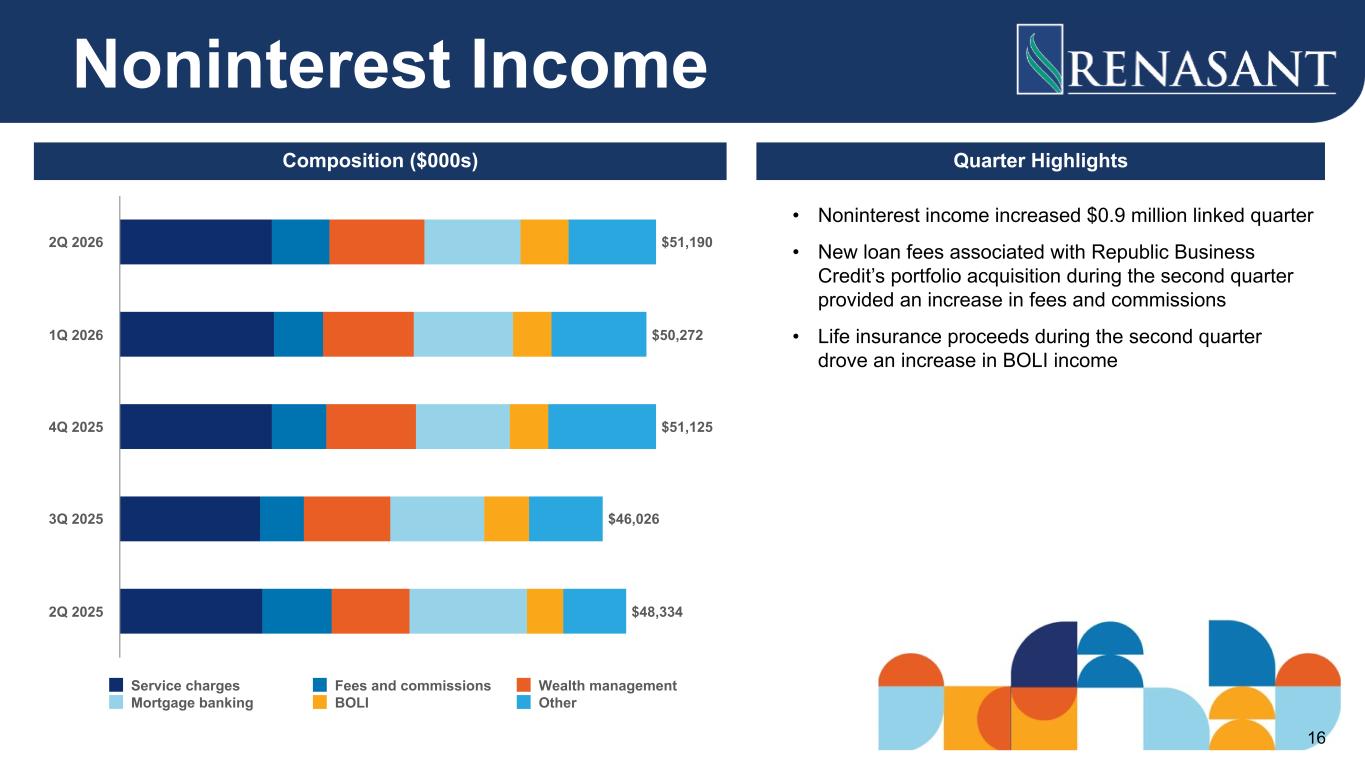
• Noninterest income increased $0.9 million linked quarter • New loan fees associated with Republic Business Credit’s portfolio acquisition during the second quarter provided an increase in fees and commissions • Life insurance proceeds during the second quarter drove an increase in BOLI income $51,190 $50,272 $51,125 $46,026 $48,334 Service charges Fees and commissions Wealth management Mortgage banking BOLI Other 2Q 2026 1Q 2026 4Q 2025 3Q 2025 2Q 2025 Noninterest Income Composition ($000s) Quarter Highlights 16
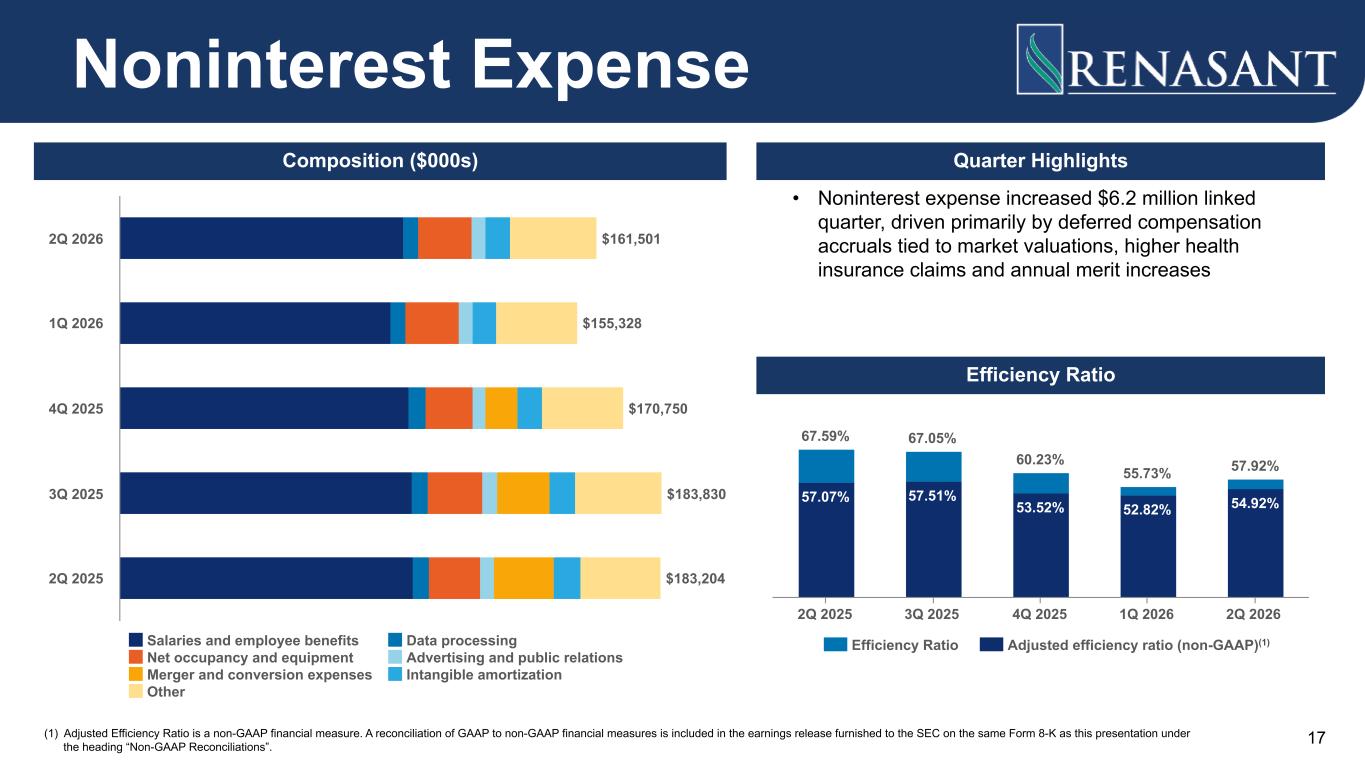
• Noninterest expense increased $6.2 million linked quarter, driven primarily by deferred compensation accruals tied to market valuations, higher health insurance claims and annual merit increases Quarter Highlights 57.07% 57.51% 53.52% 52.82% 54.92% 67.59% 67.05% 60.23% 55.73% 57.92% Efficiency Ratio Adjusted efficiency ratio (non-GAAP) 2Q 2025 3Q 2025 4Q 2025 1Q 2026 2Q 2026 $161,501 $155,328 $170,750 $183,830 $183,204 Salaries and employee benefits Data processing Net occupancy and equipment Advertising and public relations Merger and conversion expenses Intangible amortization Other 2Q 2026 1Q 2026 4Q 2025 3Q 2025 2Q 2025 Noninterest Expense Efficiency Ratio Composition ($000s) (1) Adjusted Efficiency Ratio is a non-GAAP financial measure. A reconciliation of GAAP to non-GAAP financial measures is included in the earnings release furnished to the SEC on the same Form 8-K as this presentation under the heading “Non-GAAP Reconciliations”. 17 (1)
Appendix
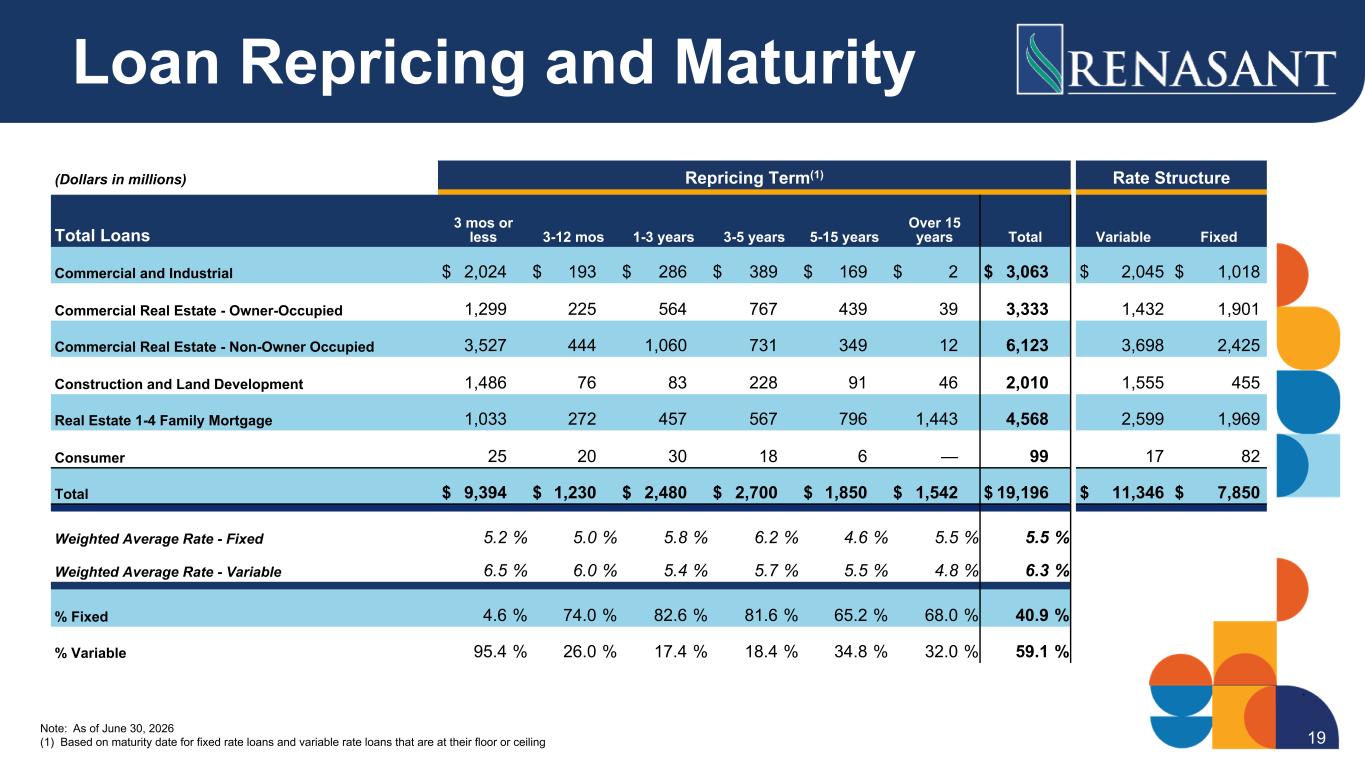
(Dollars in millions) Repricing Term(1) Rate Structure Total Loans 3 mos or less 3-12 mos 1-3 years 3-5 years 5-15 years Over 15 years Total Variable Fixed Commercial and Industrial $ 2,024 $ 193 $ 286 $ 389 $ 169 $ 2 $ 3,063 $ 2,045 $ 1,018 Commercial Real Estate - Owner-Occupied 1,299 225 564 767 439 39 3,333 1,432 1,901 Commercial Real Estate - Non-Owner Occupied 3,527 444 1,060 731 349 12 6,123 3,698 2,425 Construction and Land Development 1,486 76 83 228 91 46 2,010 1,555 455 Real Estate 1-4 Family Mortgage 1,033 272 457 567 796 1,443 4,568 2,599 1,969 Consumer 25 20 30 18 6 — 99 17 82 Total $ 9,394 $ 1,230 $ 2,480 $ 2,700 $ 1,850 $ 1,542 $ 19,196 $ 11,346 $ 7,850 Weighted Average Rate - Fixed 5.2 % 5.0 % 5.8 % 6.2 % 4.6 % 5.5 % 5.5 % Weighted Average Rate - Variable 6.5 % 6.0 % 5.4 % 5.7 % 5.5 % 4.8 % 6.3 % % Fixed 4.6 % 74.0 % 82.6 % 81.6 % 65.2 % 68.0 % 40.9 % % Variable 95.4 % 26.0 % 17.4 % 18.4 % 34.8 % 32.0 % 59.1 % Note: As of June 30, 2026 (1) Based on maturity date for fixed rate loans and variable rate loans that are at their floor or ceiling Loan Repricing and Maturity 19
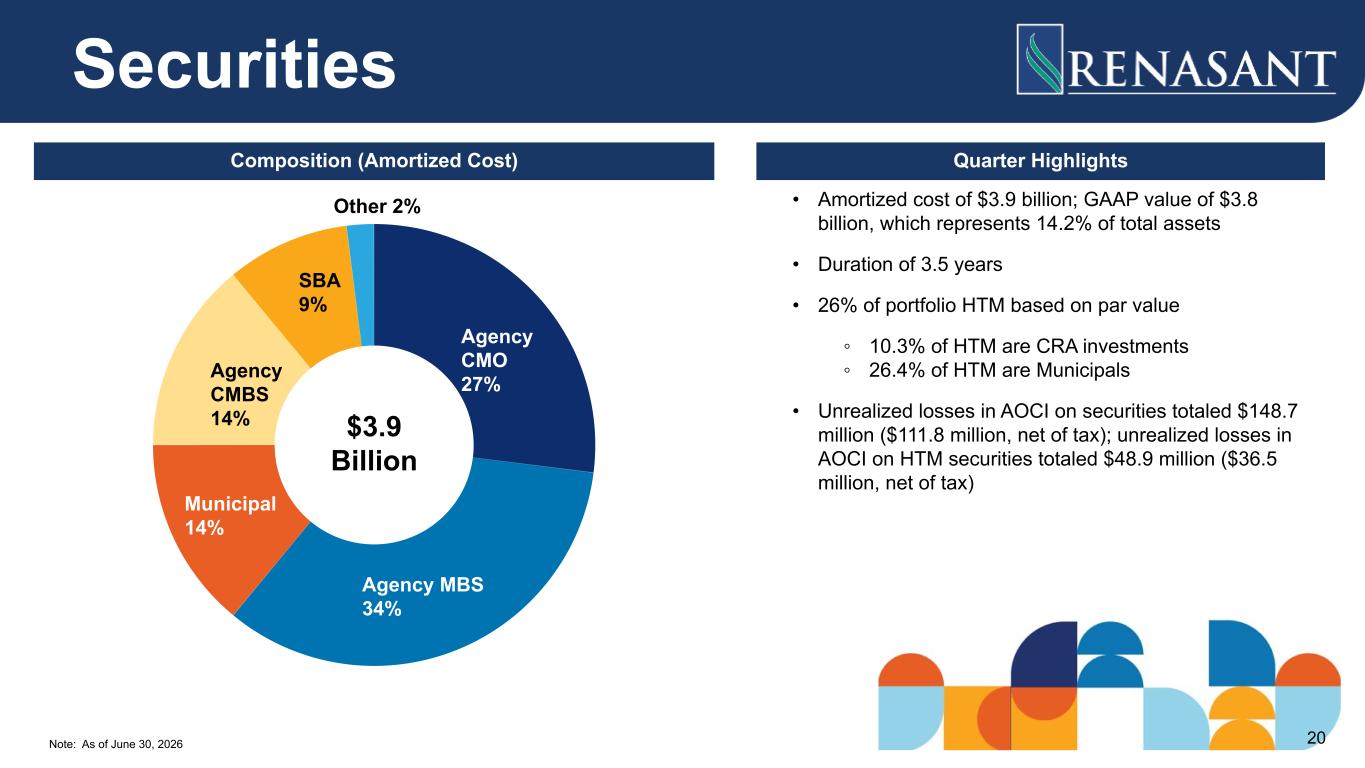
Note: As of June 30, 2026 Agency CMO 27% Agency MBS 34% Municipal 14% Agency CMBS 14% SBA 9% Other 2% • Amortized cost of $3.9 billion; GAAP value of $3.8 billion, which represents 14.2% of total assets • Duration of 3.5 years • 26% of portfolio HTM based on par value ◦ 10.3% of HTM are CRA investments ◦ 26.4% of HTM are Municipals • Unrealized losses in AOCI on securities totaled $148.7 million ($111.8 million, net of tax); unrealized losses in AOCI on HTM securities totaled $48.9 million ($36.5 million, net of tax) $3.9 Billion Securities Composition (Amortized Cost) Quarter Highlights 20
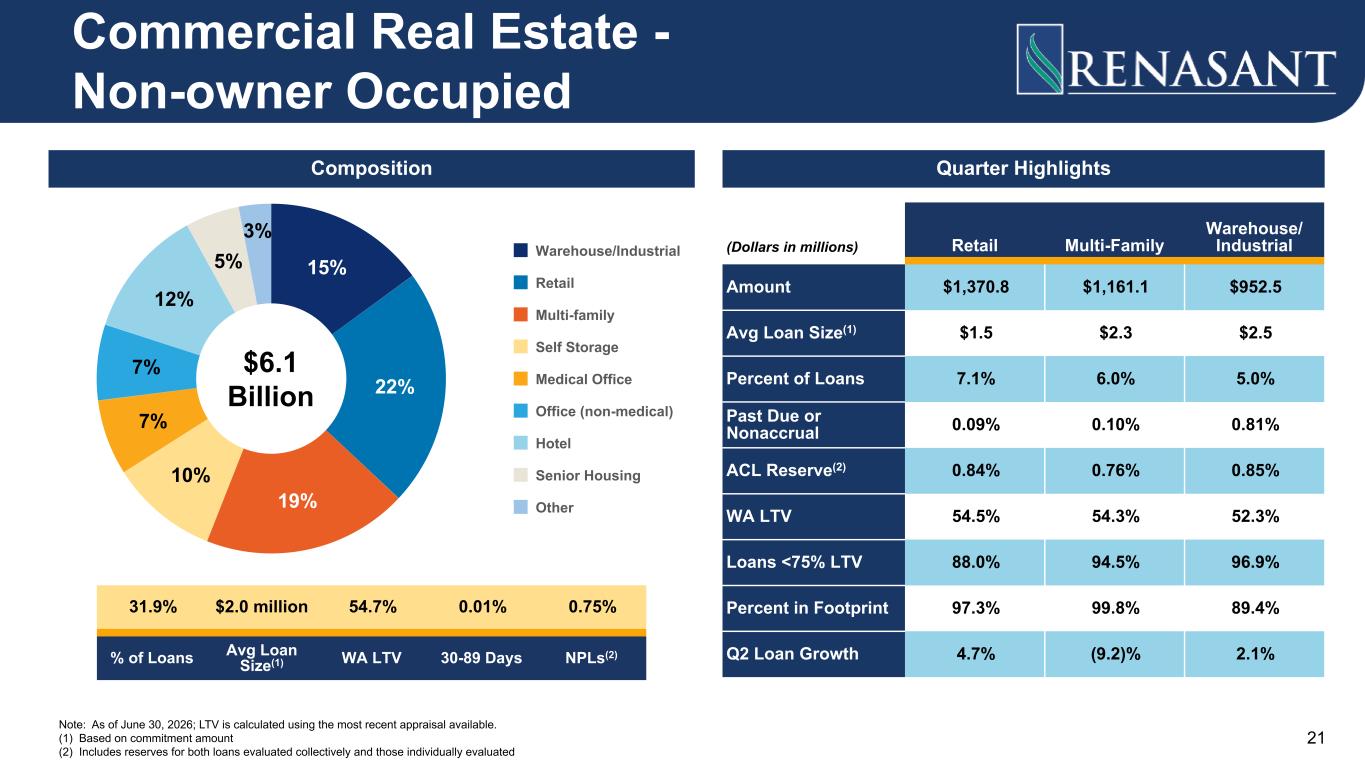
15% 22% 19% 10% 7% 7% 12% 5% 3% Warehouse/Industrial Retail Multi-family Self Storage Medical Office Office (non-medical) Hotel Senior Housing Other Quarter Highlights Note: As of June 30, 2026; LTV is calculated using the most recent appraisal available. (1) Based on commitment amount (2) Includes reserves for both loans evaluated collectively and those individually evaluated (Dollars in millions) Retail Multi-Family Warehouse/ Industrial Amount $1,370.8 $1,161.1 $952.5 Avg Loan Size(1) $1.5 $2.3 $2.5 Percent of Loans 7.1% 6.0% 5.0% Past Due or Nonaccrual 0.09% 0.10% 0.81% ACL Reserve(2) 0.84% 0.76% 0.85% WA LTV 54.5% 54.3% 52.3% Loans <75% LTV 88.0% 94.5% 96.9% Percent in Footprint 97.3% 99.8% 89.4% Q2 Loan Growth 4.7% (9.2)% 2.1% Commercial Real Estate - Non-owner Occupied $6.1 Billion Composition 31.9% $2.0 million 54.7% 0.01% 0.75% % of Loans Avg Loan Size(1) WA LTV 30-89 Days NPLs(2) 21
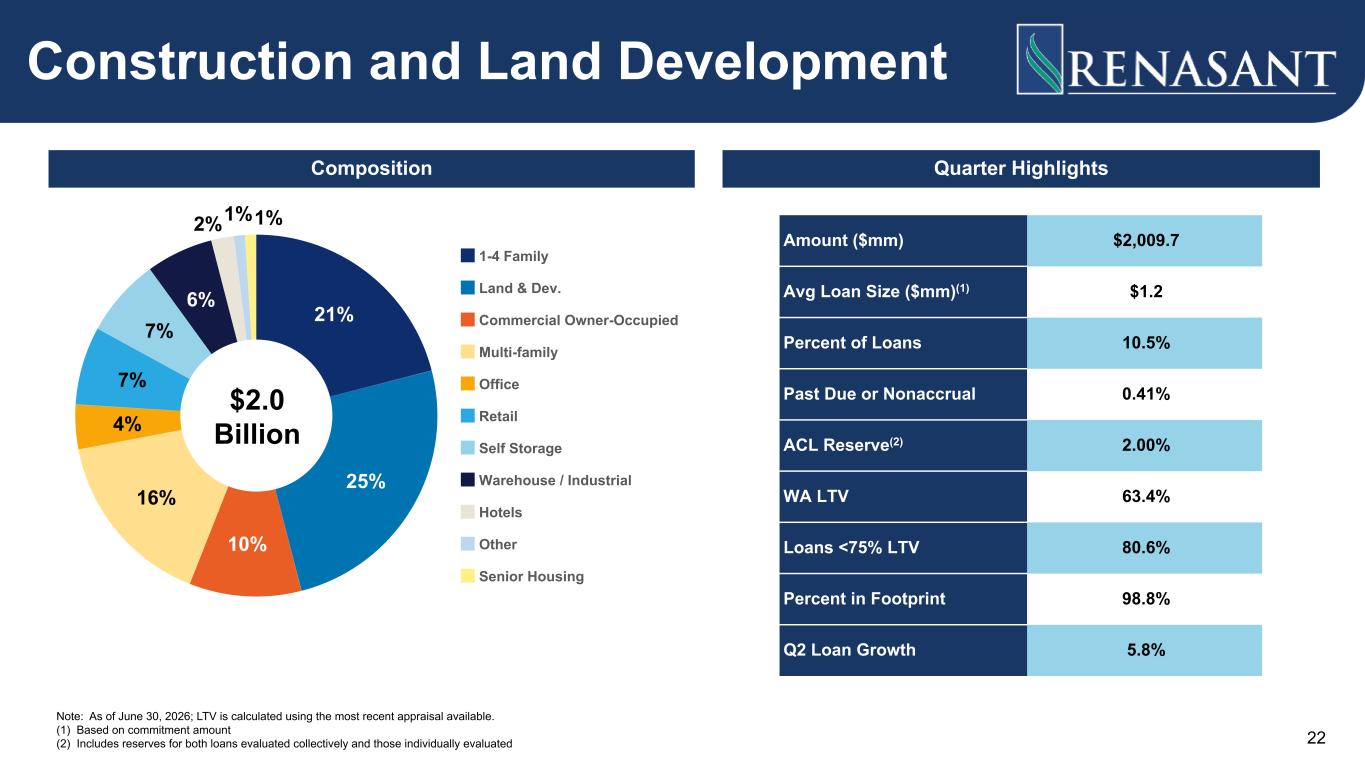
Note: As of June 30, 2026; LTV is calculated using the most recent appraisal available. (1) Based on commitment amount (2) Includes reserves for both loans evaluated collectively and those individually evaluated 21% 25% 10% 16% 4% 7% 7% 6% 2%1%1% 1-4 Family Land & Dev. Commercial Owner-Occupied Multi-family Office Retail Self Storage Warehouse / Industrial Hotels Other Senior Housing Amount ($mm) $2,009.7 Avg Loan Size ($mm)(1) $1.2 Percent of Loans 10.5% Past Due or Nonaccrual 0.41% ACL Reserve(2) 2.00% WA LTV 63.4% Loans <75% LTV 80.6% Percent in Footprint 98.8% Q2 Loan Growth 5.8% Construction and Land Development $2.0 Billion Composition Quarter Highlights 22
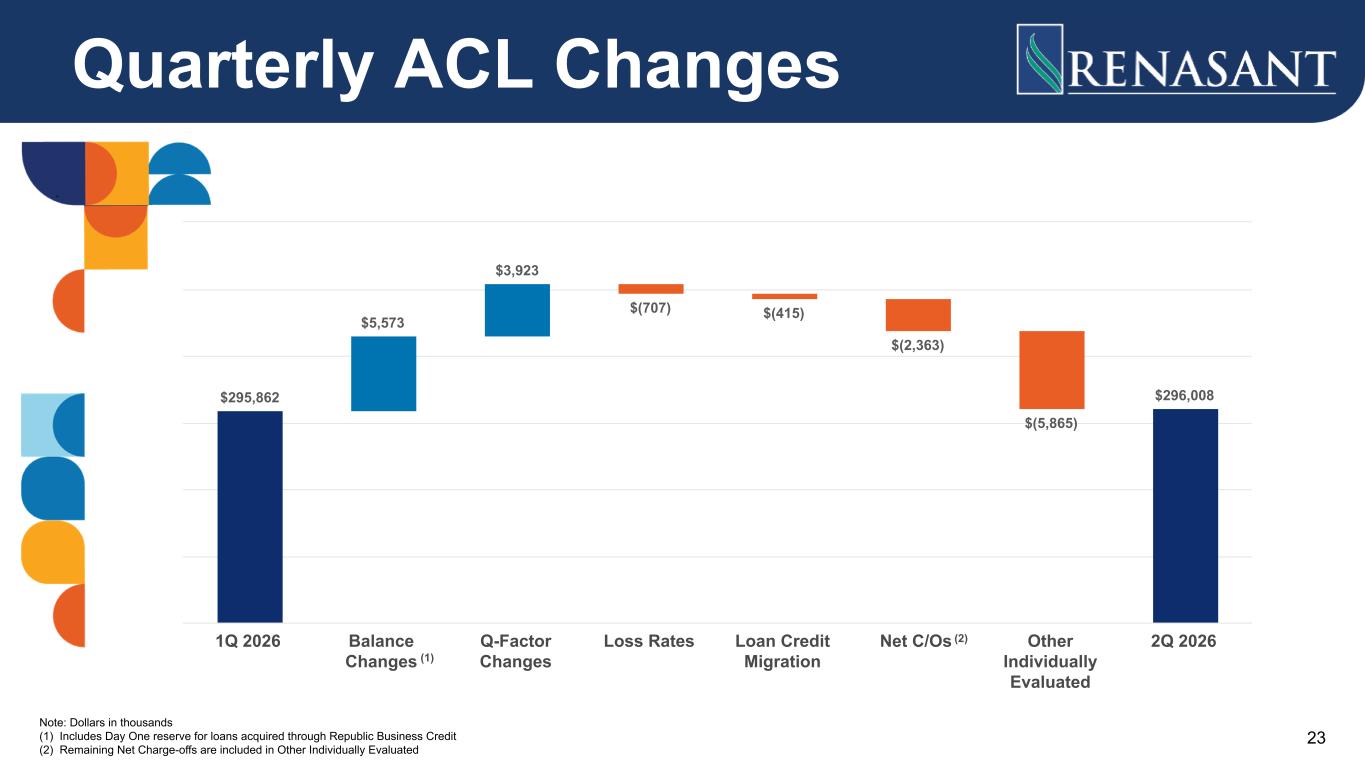
Quarterly ACL Changes $295,862 $5,573 $3,923 $(707) $(415) $(2,363) $(5,865) $296,008 1Q 2026 Balance Changes Q-Factor Changes Loss Rates Loan Credit Migration Net C/Os Other Individually Evaluated 2Q 2026 Note: Dollars in thousands (1) Includes Day One reserve for loans acquired through Republic Business Credit (2) Remaining Net Charge-offs are included in Other Individually Evaluated 23 (2) (1)
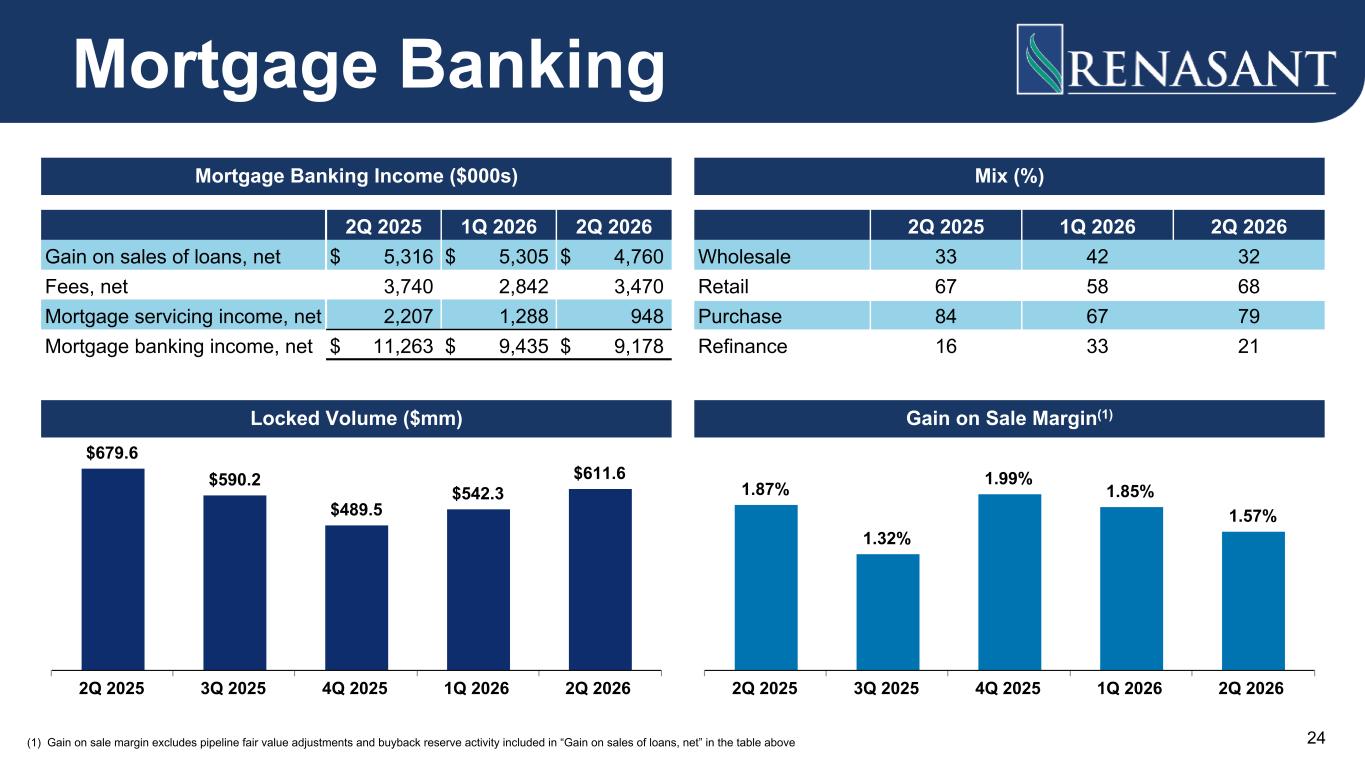
2Q 2025 1Q 2026 2Q 2026 Gain on sales of loans, net $ 5,316 $ 5,305 $ 4,760 Fees, net 3,740 2,842 3,470 Mortgage servicing income, net 2,207 1,288 948 Mortgage banking income, net $ 11,263 $ 9,435 $ 9,178 2Q 2025 1Q 2026 2Q 2026 Wholesale 33 42 32 Retail 67 58 68 Purchase 84 67 79 Refinance 16 33 21 $679.6 $590.2 $489.5 $542.3 $611.6 2Q 2025 3Q 2025 4Q 2025 1Q 2026 2Q 2026 (1) Gain on sale margin excludes pipeline fair value adjustments and buyback reserve activity included in “Gain on sales of loans, net” in the table above 1.87% 1.32% 1.99% 1.85% 1.57% 2Q 2025 3Q 2025 4Q 2025 1Q 2026 2Q 2026 Mortgage Banking Mortgage Banking Income ($000s) Mix (%) Locked Volume ($mm) Gain on Sale Margin(1) 24