July 28, 2026 2nd Quarter 2026 Earnings Presentation Exhibit 99.2
Safe Harbor Statement Disclosures in this presentation contain forward-looking statements within the meaning of the Private Securities Litigation Reform Act of 1995, including without limitation, those relating to future financial and operational results, market and broader economic conditions and guidance. Those statements provide our future expectations or forecasts and can be identified by our use of words such as “anticipate,” “estimate,” “expect,” “project,” “intend,” “plan,” “believe,” “outlook,” “target,” “predict,” “may,” “will,” “would,” “could,” “should,” “seek,” and other words or phrases of similar meaning in connection with any discussion of future operating or financial performance. This includes annual guidance. Forward-looking statements, by their nature, address matters that are uncertain and involve risks because they relate to events and depend on circumstances that may or may not occur in the future. As a result, our actual results may differ materially from our expected results and from those expressed in our forward-looking statements. A more detailed discussion of the risks and uncertainties that could cause our actual results to differ materially from those projected, anticipated or implied is included in the “Risk Factors” and “Management’s Discussion and Analysis” sections of our reports on Form 10-K and Form 10-Q filed with the U.S. Securities and Exchange Commission (“SEC”), including our quarterly report for the quarterly period ended June 30, 2026, that the Company expects to file with the SEC today. Forward-looking statements speak only as of the date they are made. We undertake no obligation to update any forward-looking statements beyond what is required under applicable securities law. In addition, we will be referring to non-Generally Accepted Accounting Principles (“GAAP”) financial measures within the meaning of SEC Regulation G. A reconciliation of the differences between these measures with the most directly comparable financial measures calculated in accordance with GAAP are included within this presentation and available on the Investor Relations page of our website at www.armstrong.com. The guidance in this presentation is only effective as of the date given, July 28, 2026, and will not be updated or affirmed unless and until we publicly announce updated or affirmed guidance.
Basis of Presentation Explanation Results throughout this presentation are presented on a normalized basis. We remove the impact of certain discrete expenses and income in certain measures including adjusted Earnings Before Interest, Taxes, Depreciation and Amortization (“EBITDA”), adjusted diluted earnings per share (“EPS”) and adjusted free cash flow. The Company excludes certain acquisition related expenses (i.e. – impact of adjustments related to the fair value of inventory, third-party professional fees and changes in the fair value of contingent consideration for acquisitions). The Company also excludes all acquisition-related intangible amortization from adjusted net earnings and in calculations of adjusted diluted EPS. Examples of other excluded items have included plant closures, restructuring charges and related costs, impairments, separation costs and other cost reduction initiatives, environmental site expenses and environmental insurance recoveries, endowment level charitable contributions, the impact of defined benefit plan settlements, gains and losses on sales or impairment of fixed assets, and certain other gains and losses. The Company also excludes income/expense from its U.S. Retirement Income Plan (“RIP”) in the non-GAAP results as it represents the actuarial net periodic benefit credit/cost recorded. For all periods presented, the Company was not required to and did not make cash contributions to the RIP based on guidelines established by the Pension Benefit Guaranty Corporation, nor does the Company expect to make cash contributions to the plan in 2026. Adjusted free cash flow is defined as cash from operating and investing activities, adjusted to remove the impact of cash used or proceeds received for acquisitions and divestitures, environmental site expenses and environmental insurance recoveries. Management's adjusted free cash flow measure includes returns of investment from the Worthington Armstrong Venture (“WAVE”) and cash proceeds received from the settlement of company-owned life insurance policies, which are presented within investing activities on our consolidated statement of cash flows. Investors should not consider non-GAAP measures as a substitute for GAAP measures. Excluding adjusted diluted EPS, non-GAAP figures are rounded to the nearest million and corresponding percentages are based on unrounded figures. Operating Segments: “MF”: Mineral Fiber, “AS”: Architectural Specialties, “UC”: Unallocated Corporate. We define “organic” as total company and/or AS results excluding the impact of the February 2026 acquisition of Event Scape Inc. and Eventscape U.S. Holdings Inc. (collectively, “Eventscape”), the December 2025 acquisition of FGM-Parallel LLC (“Parallel”) and the September 2025 acquisition of Geometrik Manufacturing, Inc. (“Geometrik”). All dollar figures throughout the presentation are in $ millions, expect per share data, and all comparisons are versus prior year unless otherwise noted. Figures may not sum due to rounding.
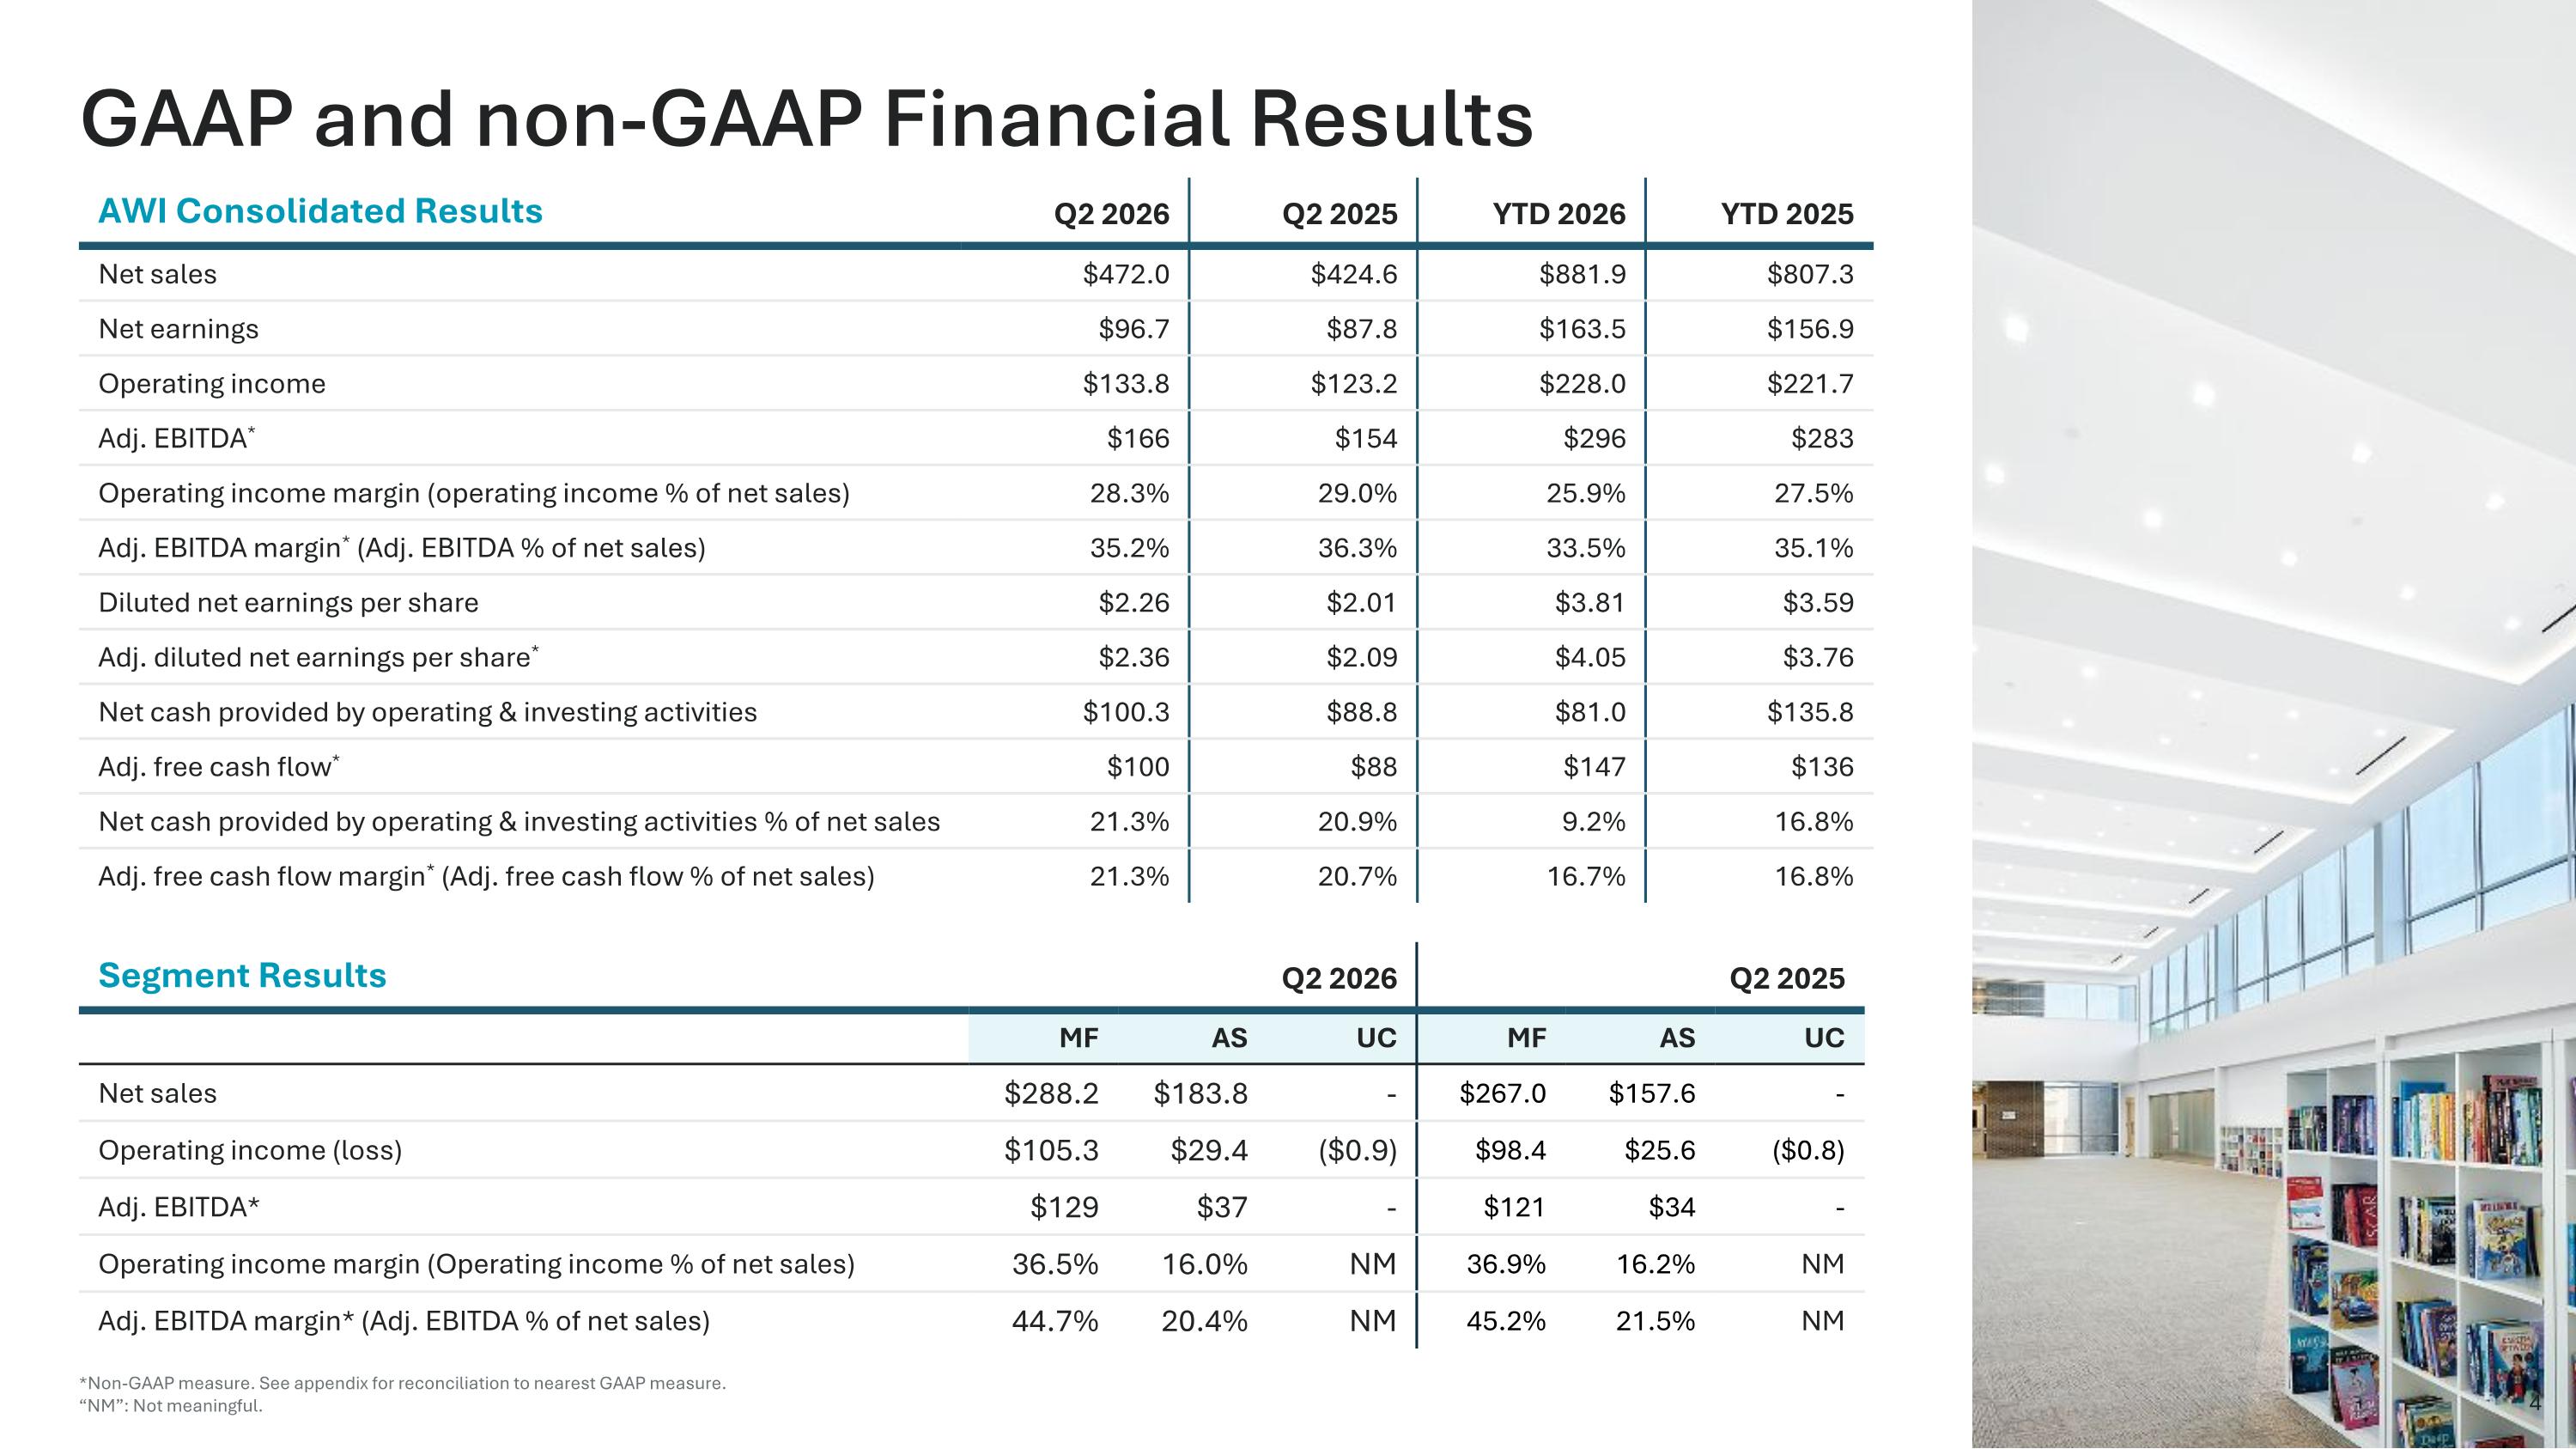
GAAP and non-GAAP Financial Results AWI Consolidated Results Q2 2026 Q2 2025 YTD 2026 YTD 2025 Net sales $472.0 $424.6 $881.9 $807.3 Net earnings $96.7 $87.8 $163.5 $156.9 Operating income $133.8 $123.2 $228.0 $221.7 Adj. EBITDA* $166 $154 $296 $283 Operating income margin (operating income % of net sales) 28.3% 29.0% 25.9% 27.5% Adj. EBITDA margin* (Adj. EBITDA % of net sales) 35.2% 36.3% 33.5% 35.1% Diluted net earnings per share $2.26 $2.01 $3.81 $3.59 Adj. diluted net earnings per share* $2.36 $2.09 $4.05 $3.76 Net cash provided by operating & investing activities $100.3 $88.8 $81.0 $135.8 Adj. free cash flow* $100 $88 $147 $136 Net cash provided by operating & investing activities % of net sales 21.3% 20.9% 9.2% 16.8% Adj. free cash flow margin* (Adj. free cash flow % of net sales) 21.3% 20.7% 16.7% 16.8% Segment Results Q2 2026 Q2 2025 MF AS UC MF AS UC Net sales $288.2 $183.8 - $267.0 $157.6 - Operating income (loss) $105.3 $29.4 ($0.9) $98.4 $25.6 ($0.8) Adj. EBITDA* $129 $37 - $121 $34 - Operating income margin (Operating income % of net sales) 36.5% 16.0% NM 36.9% 16.2% NM Adj. EBITDA margin* (Adj. EBITDA % of net sales) 44.7% 20.4% NM 45.2% 21.5% NM 4 *Non-GAAP measure. See appendix for reconciliation to nearest GAAP measure. “NM”: Not meaningful.
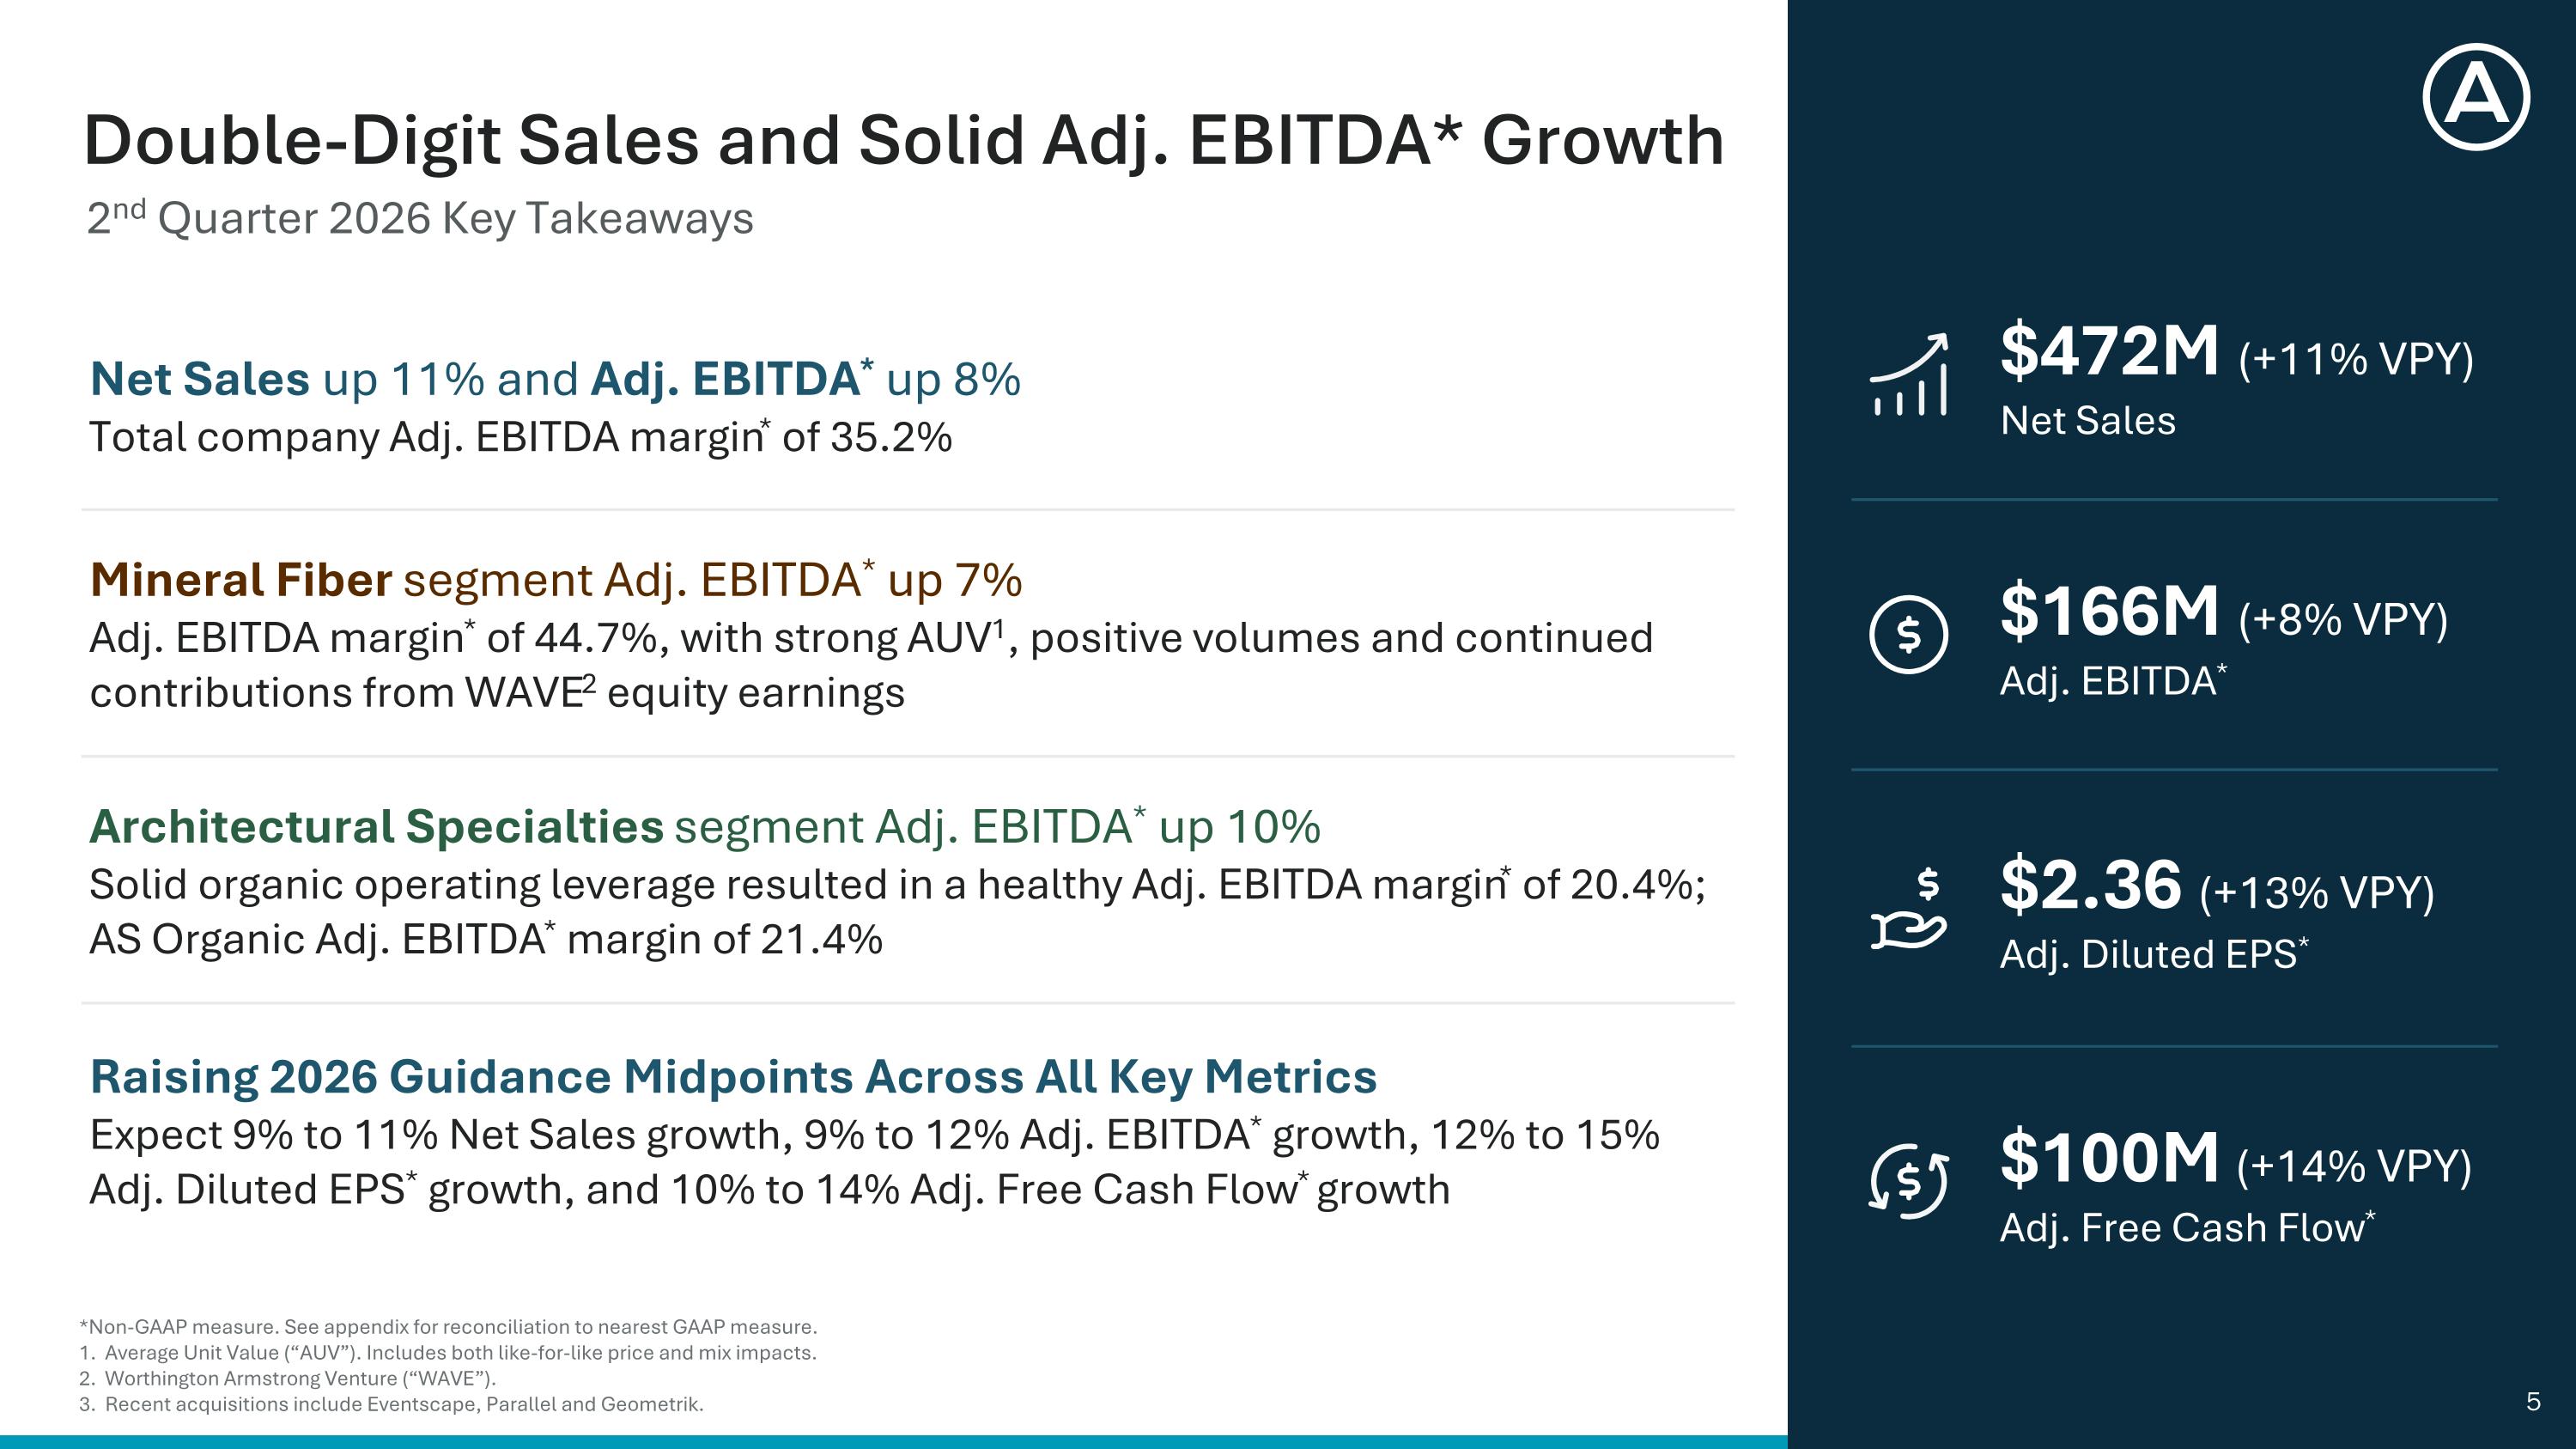
$472M (+11% VPY) Net Sales $166M (+8% VPY) Adj. EBITDA* $2.36 (+13% VPY) Adj. Diluted EPS* $100M (+14% VPY) Adj. Free Cash Flow* 2nd Quarter 2026 Key Takeaways Double-Digit Sales and Solid Adj. EBITDA* Growth Net Sales up 11% and Adj. EBITDA* up 8% Total company Adj. EBITDA margin* of 35.2% Mineral Fiber segment Adj. EBITDA* up 7% Adj. EBITDA margin* of 44.7%, with strong AUV1, positive volumes and continued contributions from WAVE2 equity earnings Architectural Specialties segment Adj. EBITDA* up 10% Solid organic operating leverage resulted in a healthy Adj. EBITDA margin* of 20.4%; AS Organic Adj. EBITDA* margin of 21.4% Raising 2026 Guidance Midpoints Across All Key Metrics Expect 9% to 11% Net Sales growth, 9% to 12% Adj. EBITDA* growth, 12% to 15% Adj. Diluted EPS* growth, and 10% to 14% Adj. Free Cash Flow* growth *Non-GAAP measure. See appendix for reconciliation to nearest GAAP measure. 1. Average Unit Value (“AUV”). Includes both like-for-like price and mix impacts. 2. Worthington Armstrong Venture (“WAVE”). 3. Recent acquisitions include Eventscape, Parallel and Geometrik.
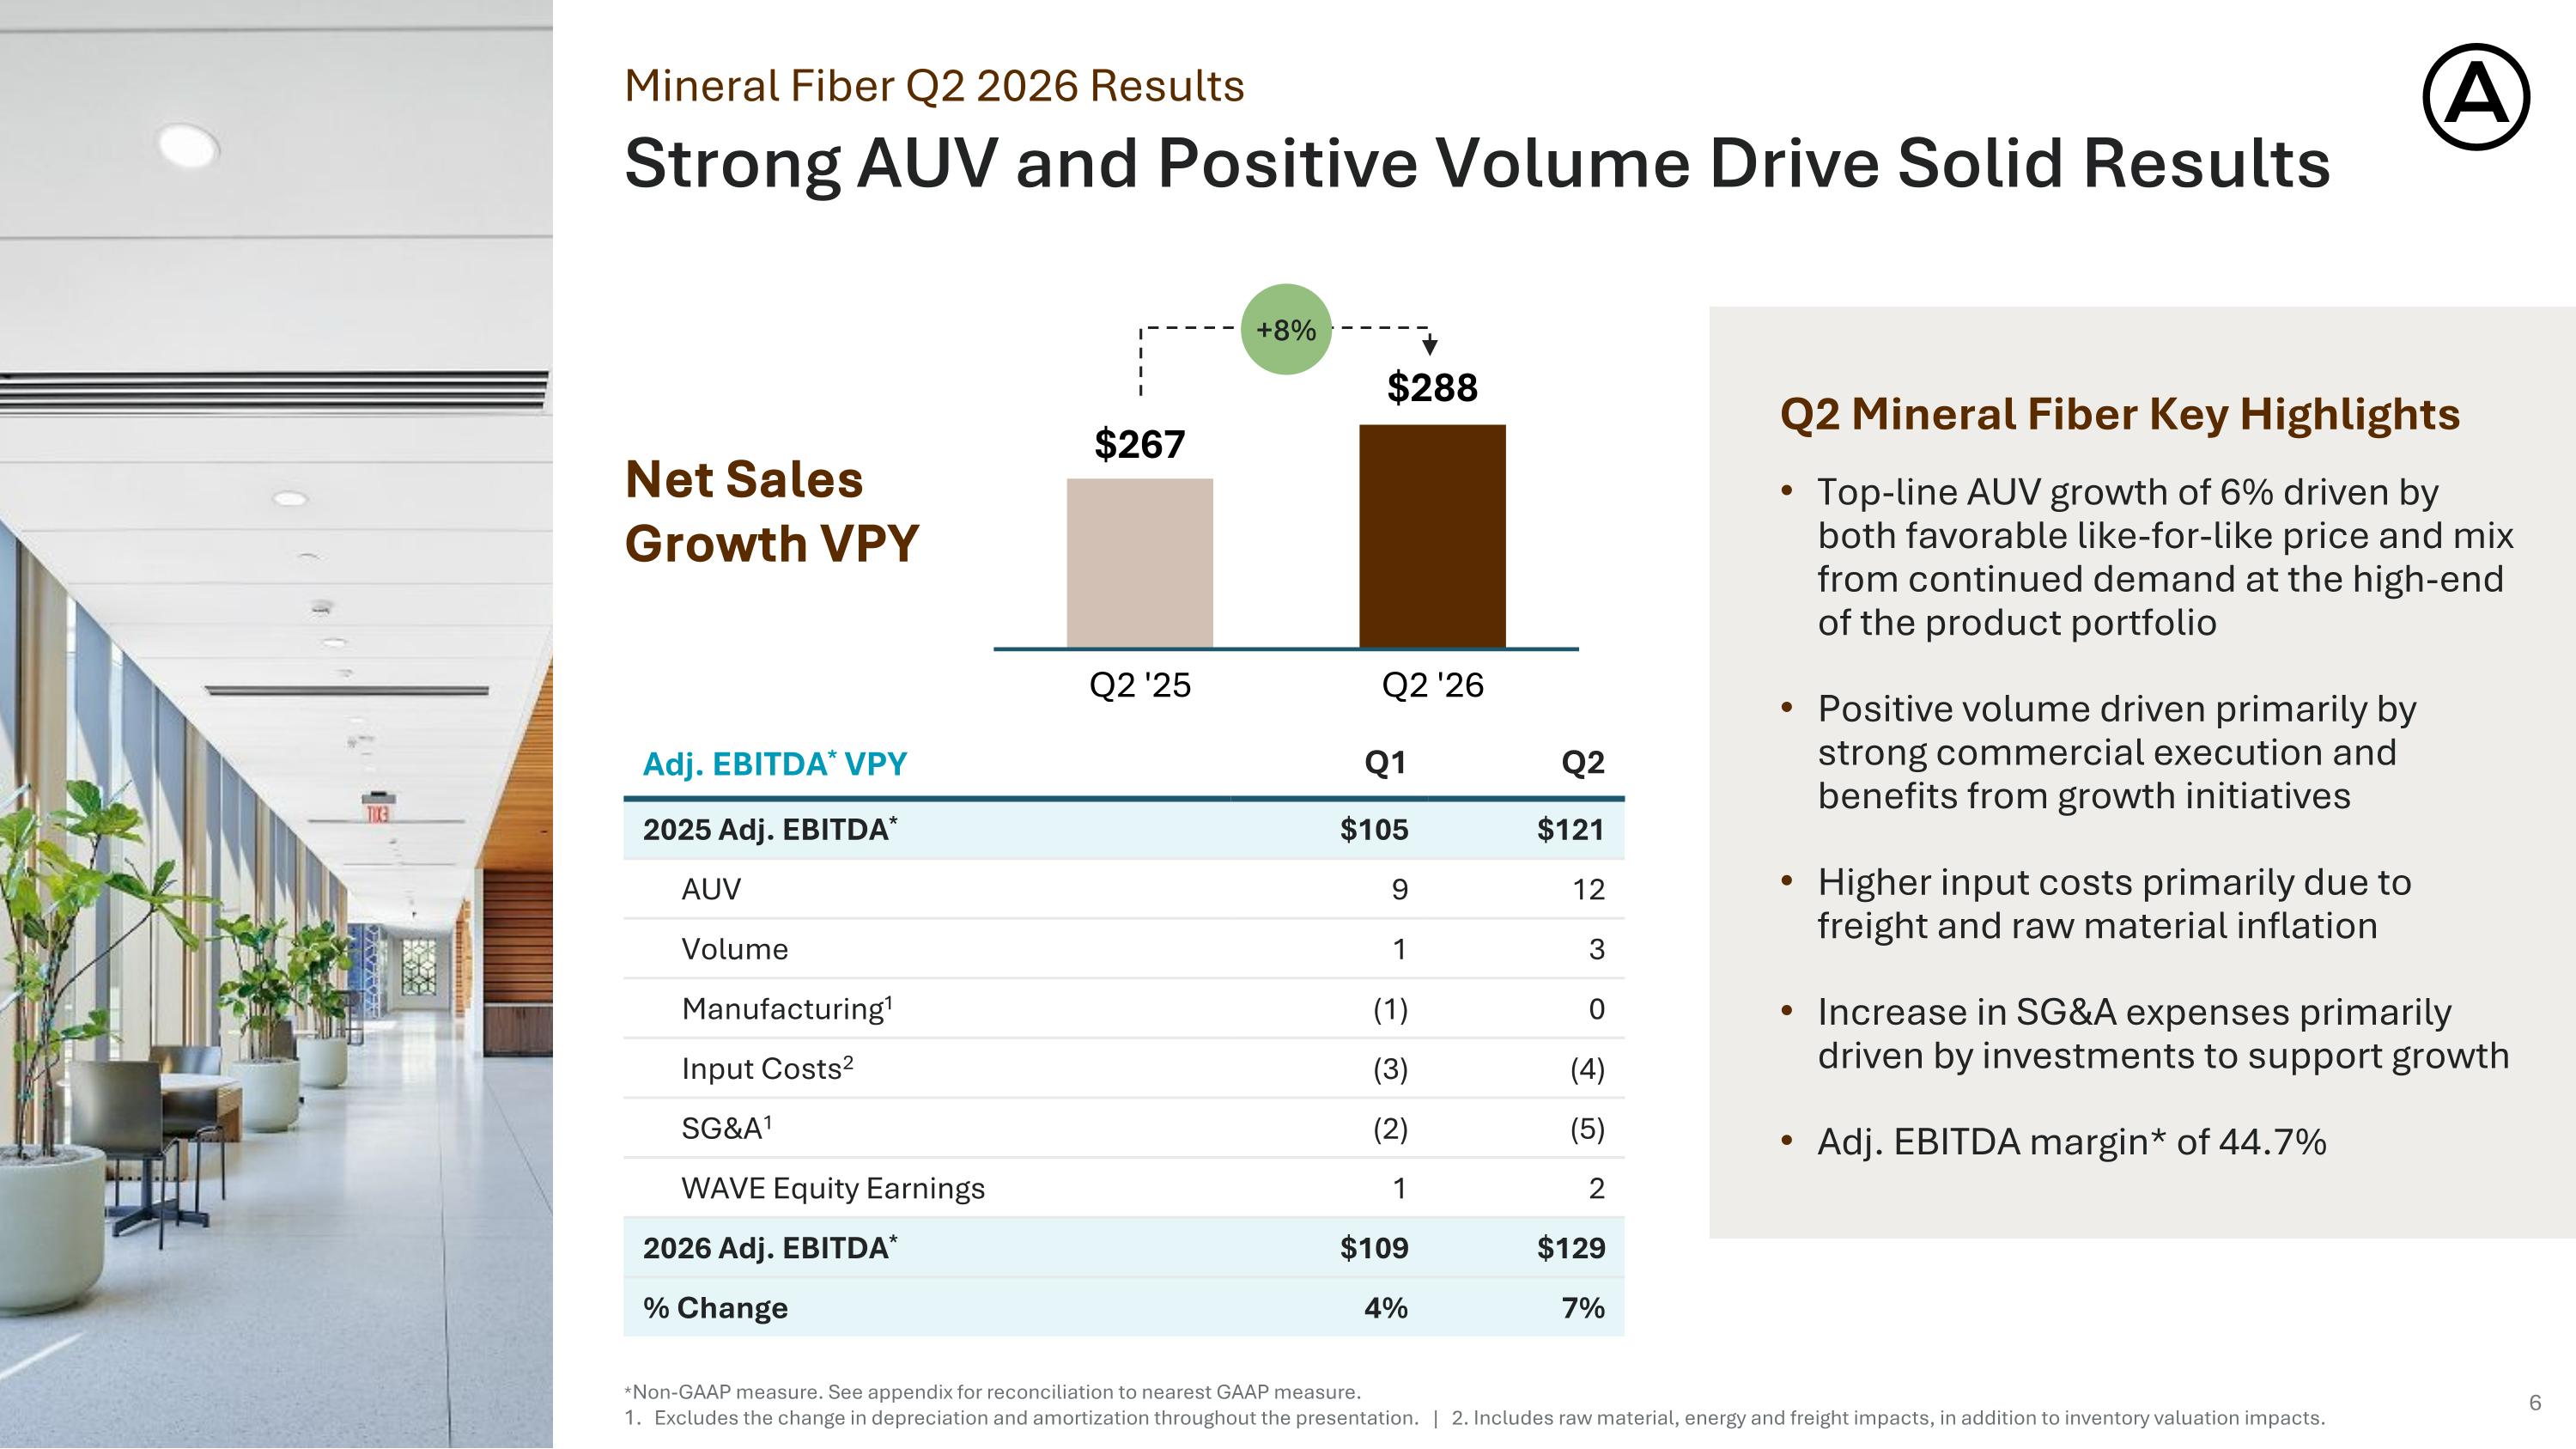
*Non-GAAP measure. See appendix for reconciliation to nearest GAAP measure. Excludes the change in depreciation and amortization throughout the presentation. | 2. Includes raw material, energy and freight impacts, in addition to inventory valuation impacts. Mineral Fiber Q2 2026 Results Strong AUV and Positive Volume Drive Solid Results Top-line AUV growth of 6% driven by both favorable like-for-like price and mix from continued demand at the high-end of the product portfolio Positive volume driven primarily by strong commercial execution and benefits from growth initiatives Higher input costs primarily due to freight and raw material inflation Increase in SG&A expenses primarily driven by investments to support growth Adj. EBITDA margin* of 44.7% Q2 Mineral Fiber Key Highlights Adj. EBITDA* VPY Q1 Q2 2025 Adj. EBITDA* $105 $121 AUV 9 12 Volume 1 3 Manufacturing1 (1) 0 Input Costs2 (3) (4) SG&A1 (2) (5) WAVE Equity Earnings 1 2 2026 Adj. EBITDA* $109 $129 % Change 4% 7% Net Sales Growth VPY +8%
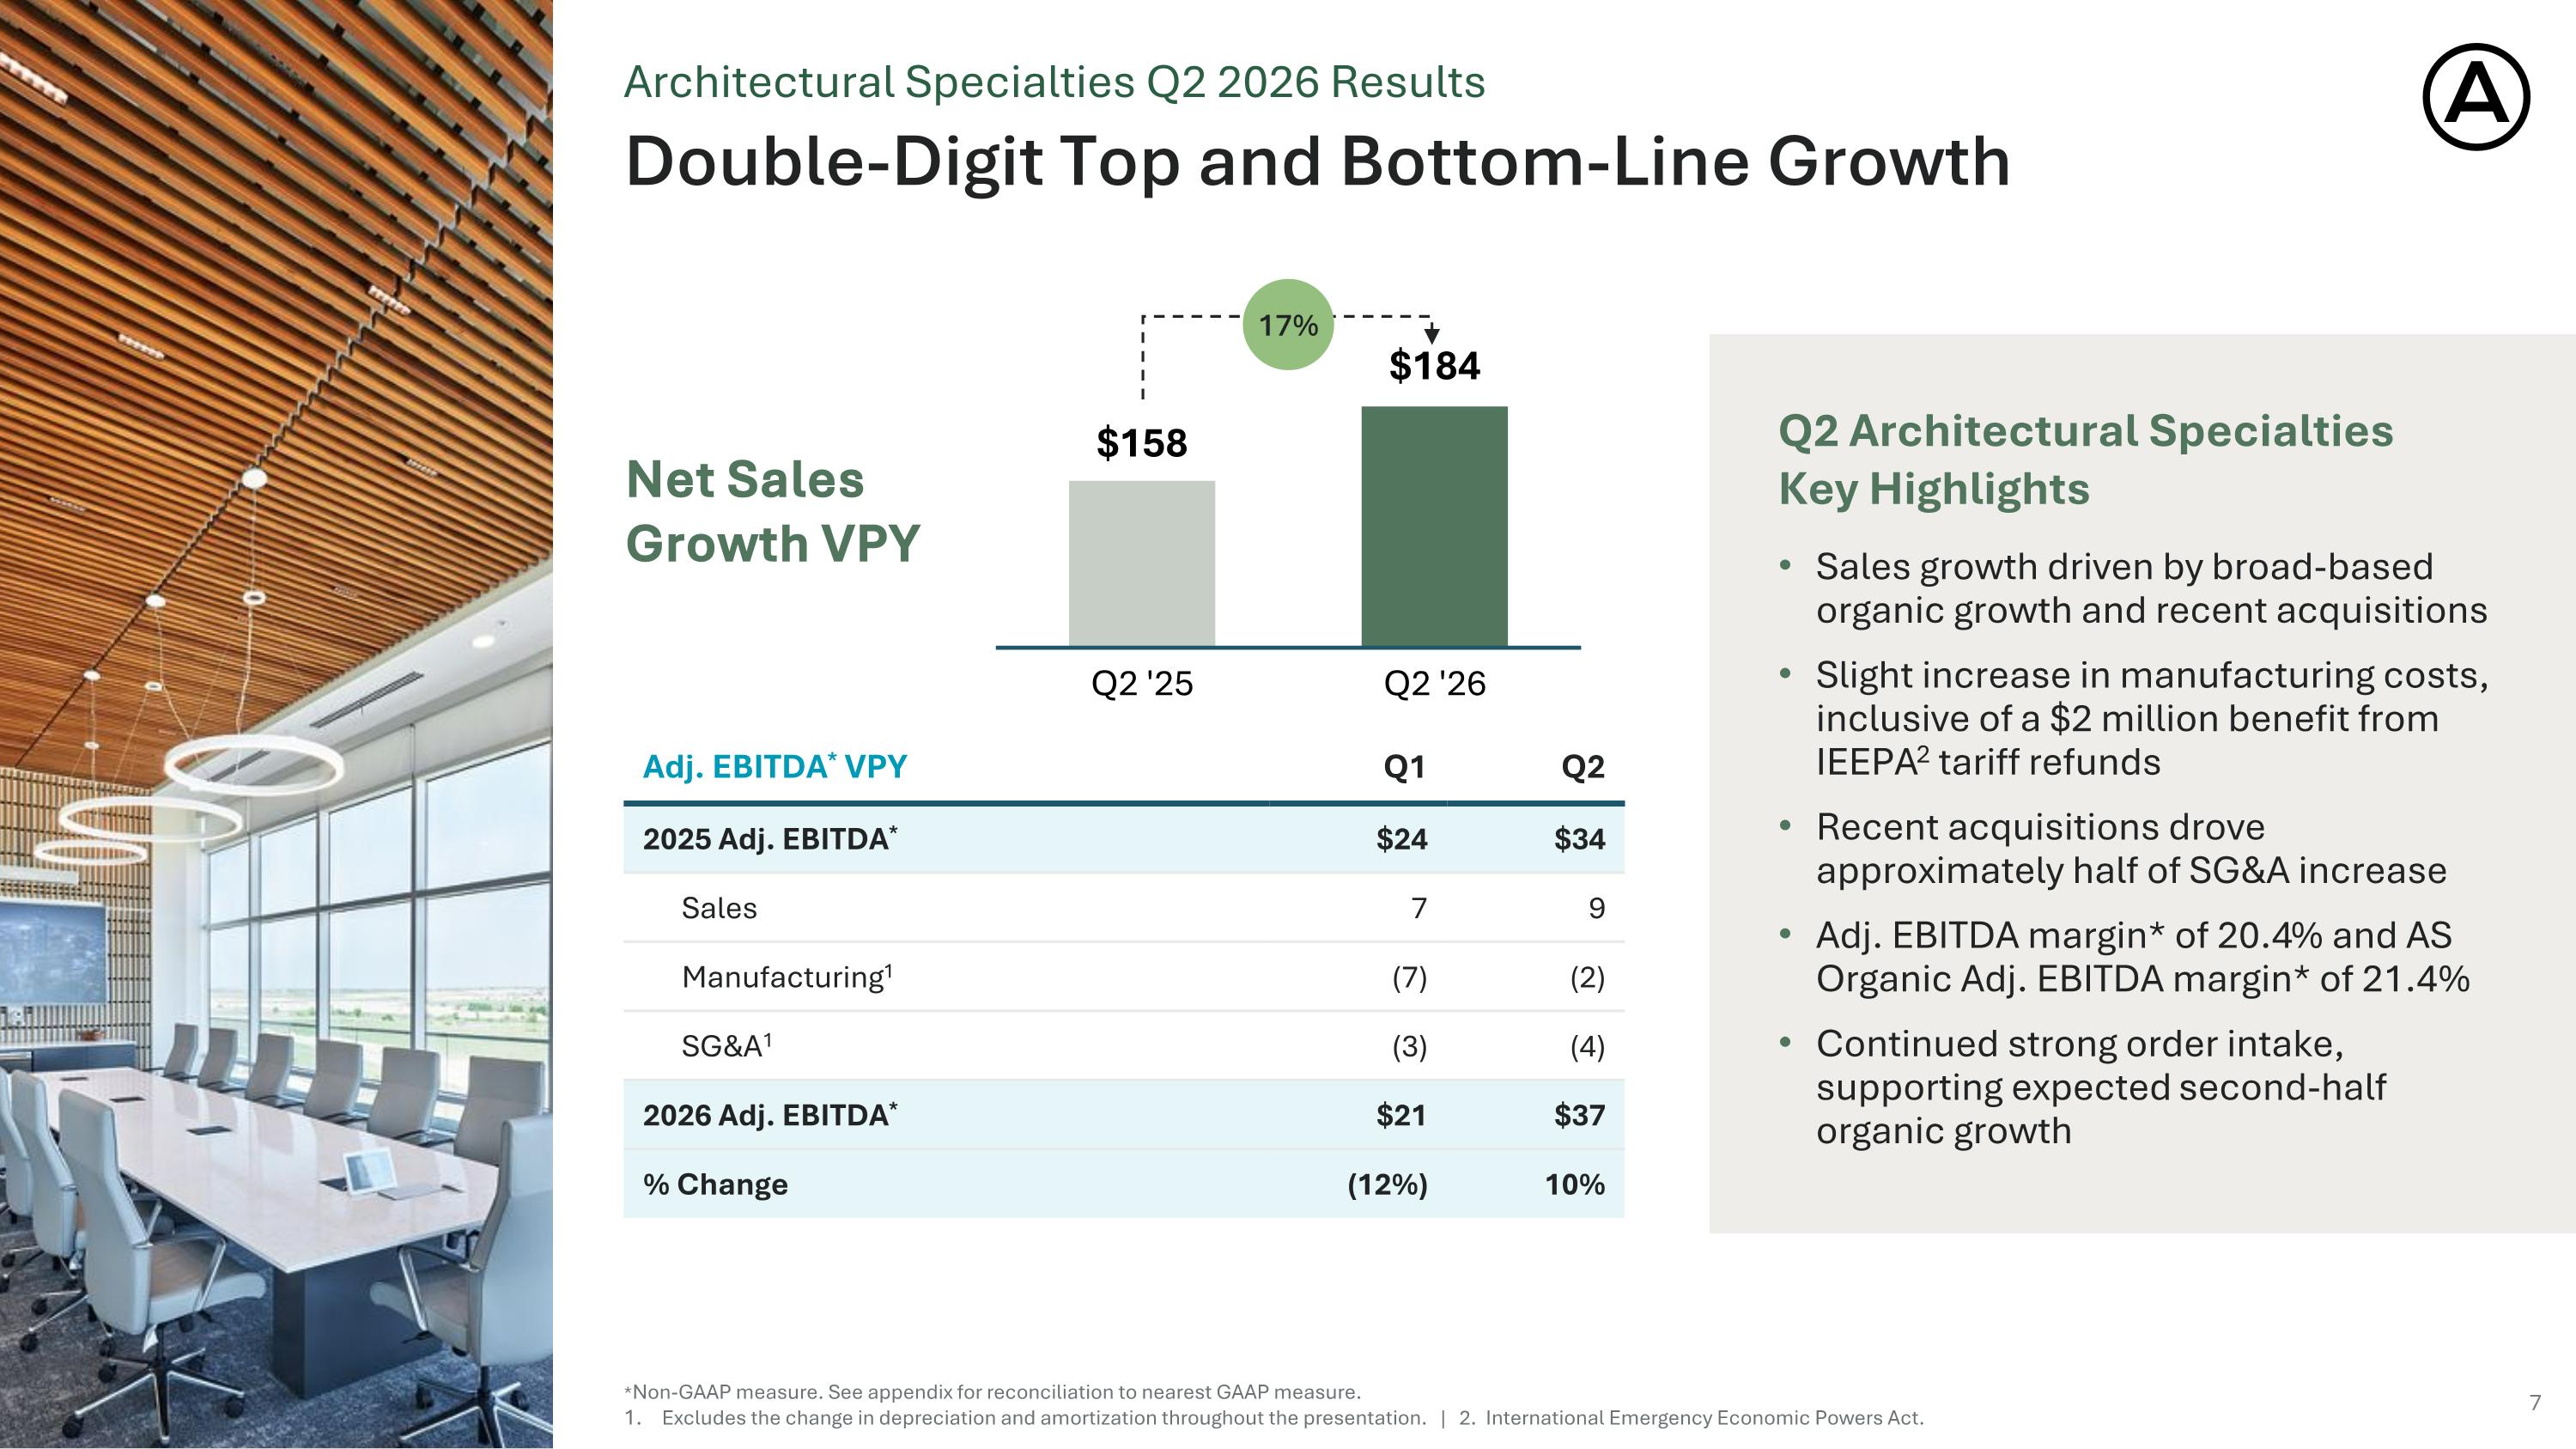
*Non-GAAP measure. See appendix for reconciliation to nearest GAAP measure. Excludes the change in depreciation and amortization throughout the presentation. | 2. International Emergency Economic Powers Act. Architectural Specialties Q2 2026 Results Double-Digit Top and Bottom-Line Growth Sales growth driven by broad-based organic growth and recent acquisitions Slight increase in manufacturing costs, inclusive of a $2 million benefit from IEEPA2 tariff refunds Recent acquisitions drove approximately half of SG&A increase Adj. EBITDA margin* of 20.4% and AS Organic Adj. EBITDA margin* of 21.4% Continued strong order intake, supporting expected second-half organic growth Q2 Architectural Specialties Key Highlights Net Sales Growth VPY 17% Adj. EBITDA* VPY Q1 Q2 2025 Adj. EBITDA* $24 $34 Sales 7 9 Manufacturing1 (7) (2) SG&A1 (3) (4) 2026 Adj. EBITDA* $21 $37 % Change (12%) 10%
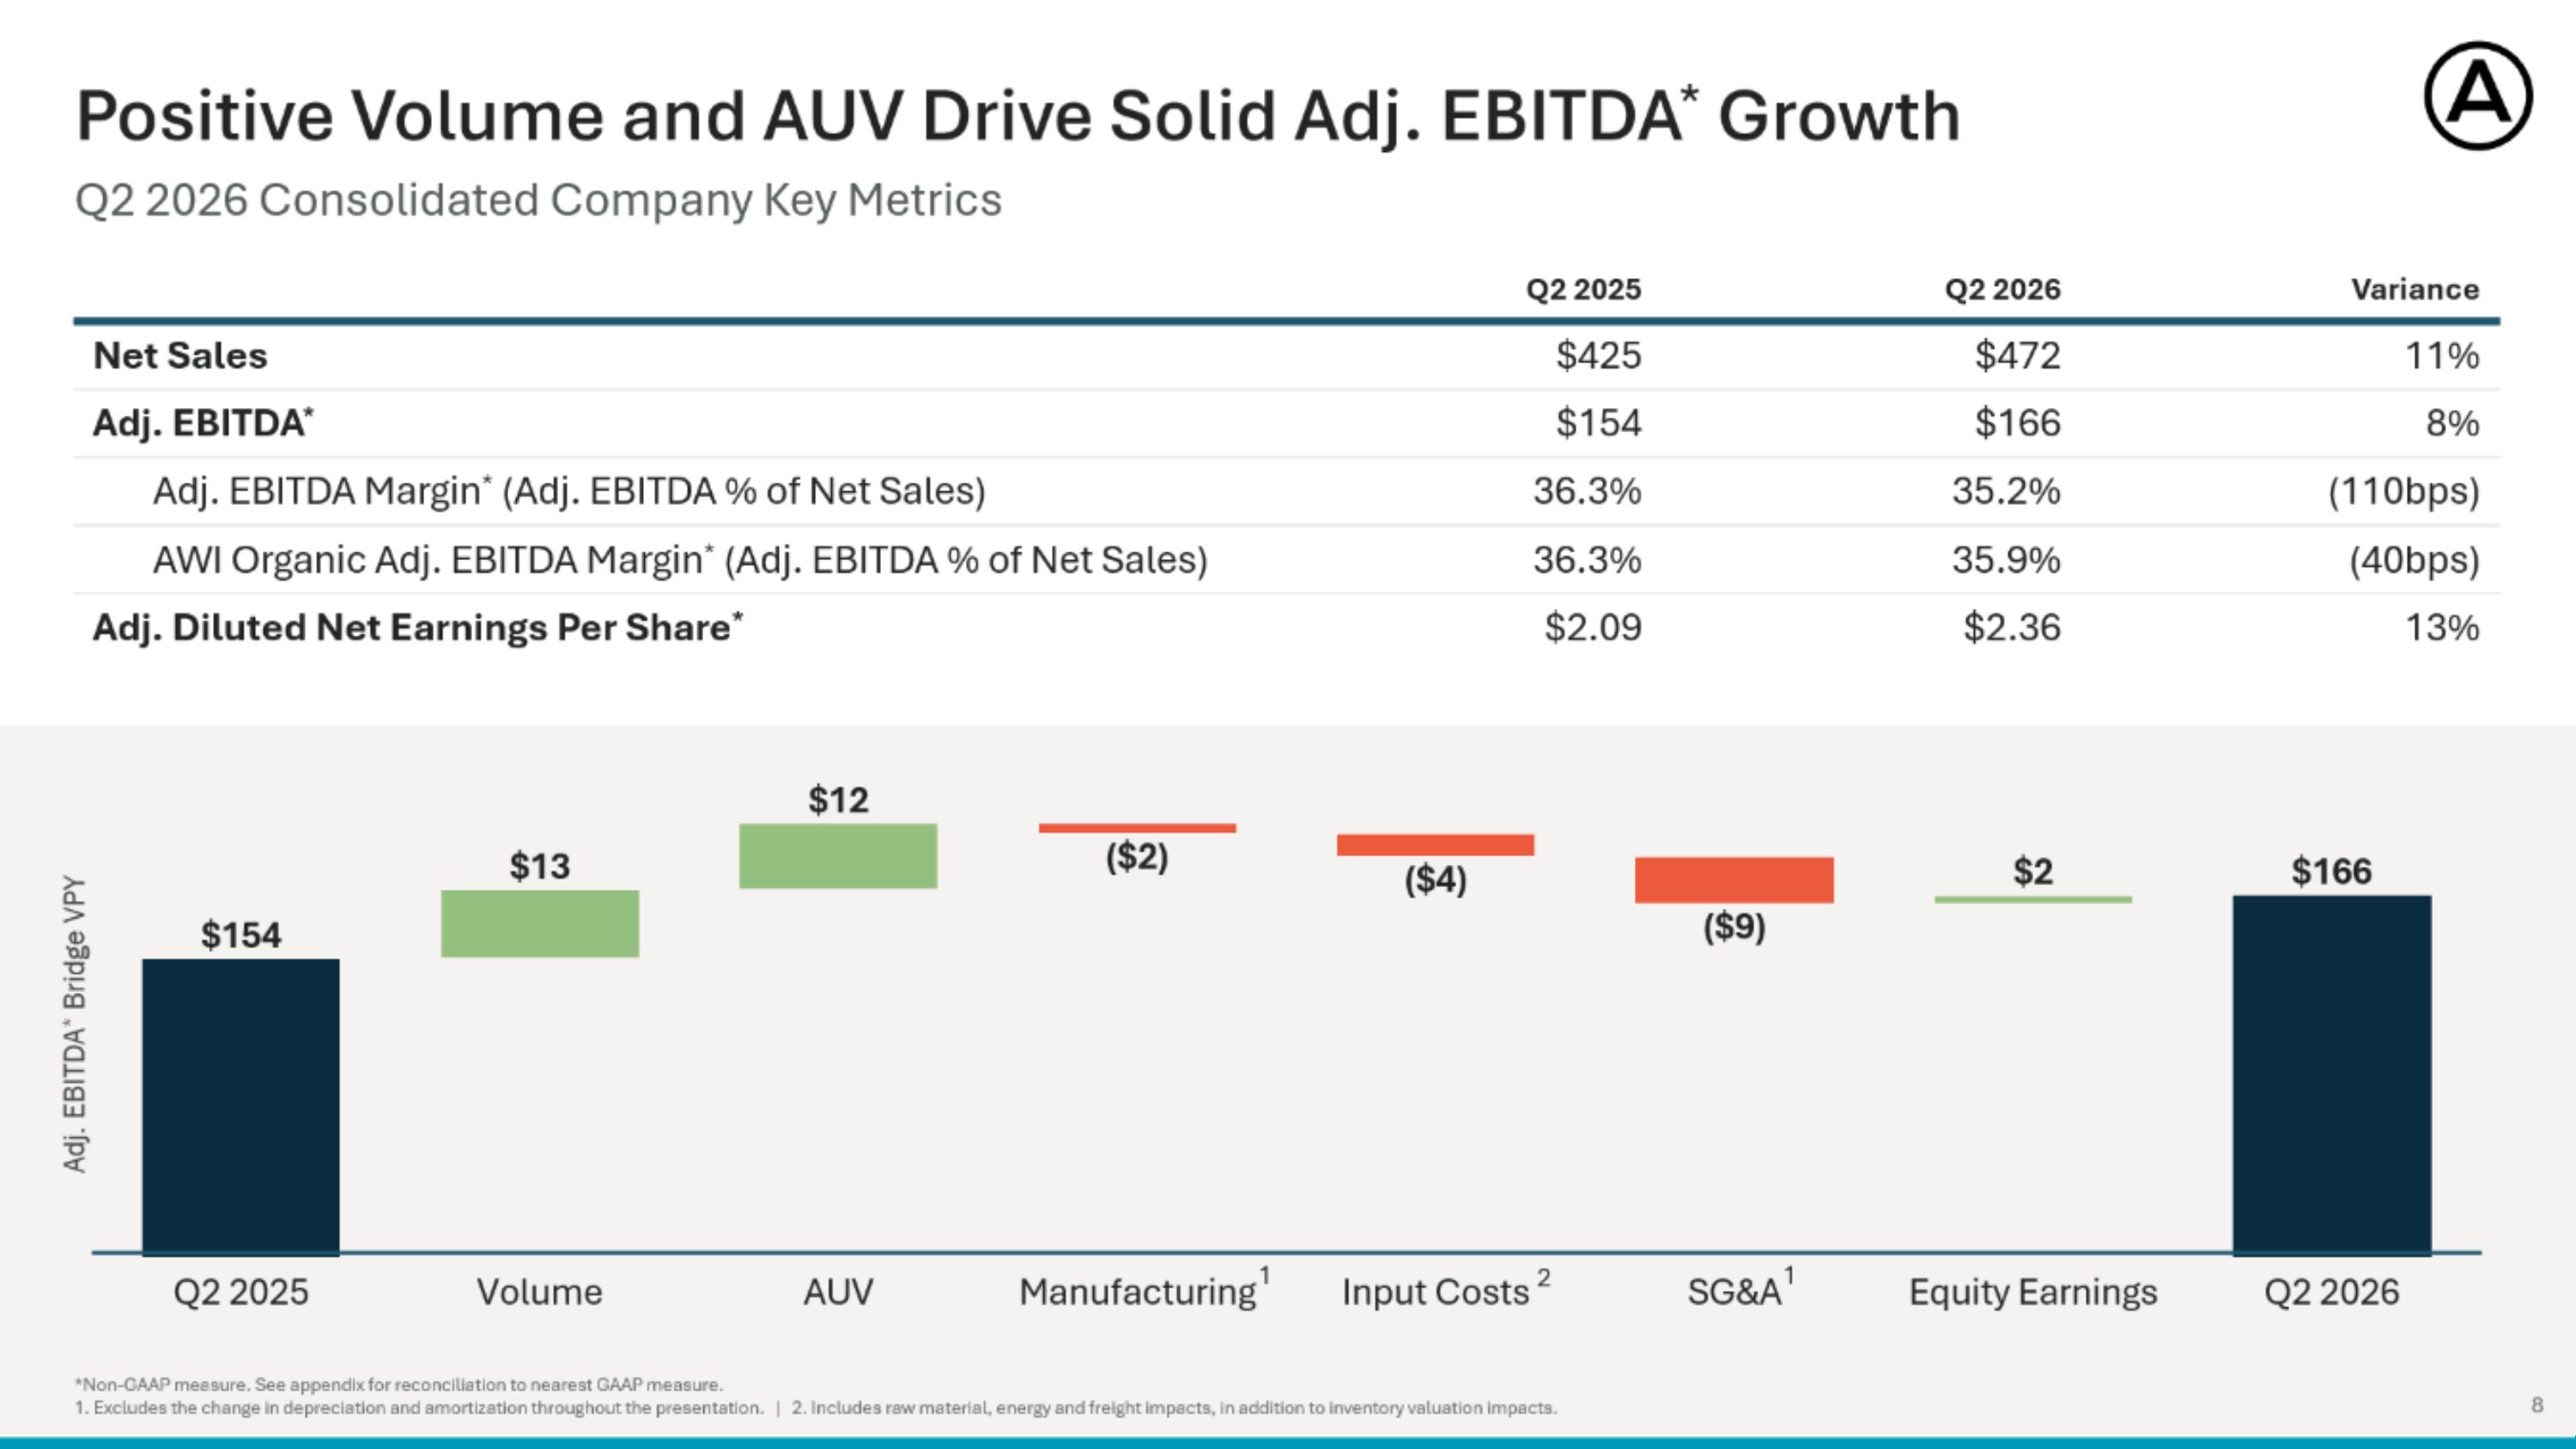
*Non-GAAP measure. See appendix for reconciliation to nearest GAAP measure. 1. Excludes the change in depreciation and amortization throughout the presentation. | 2. Includes raw material, energy and freight impacts, in addition to inventory valuation impacts. Q2 2026 Consolidated Company Key Metrics Positive Volume and AUV Drive Solid Adj. EBITDA* Growth Q2 2025 Q2 2026 Variance Net Sales $425 $472 11% Adj. EBITDA* $154 $166 8% Adj. EBITDA Margin* (Adj. EBITDA % of Net Sales) 36.3% 35.2% (110bps) AWI Organic Adj. EBITDA Margin* (Adj. EBITDA % of Net Sales) 36.3% 35.9% (40bps) Adj. Diluted Net Earnings Per Share* $2.09 $2.36 13% Adj. EBITDA* Bridge VPY 1 1 2
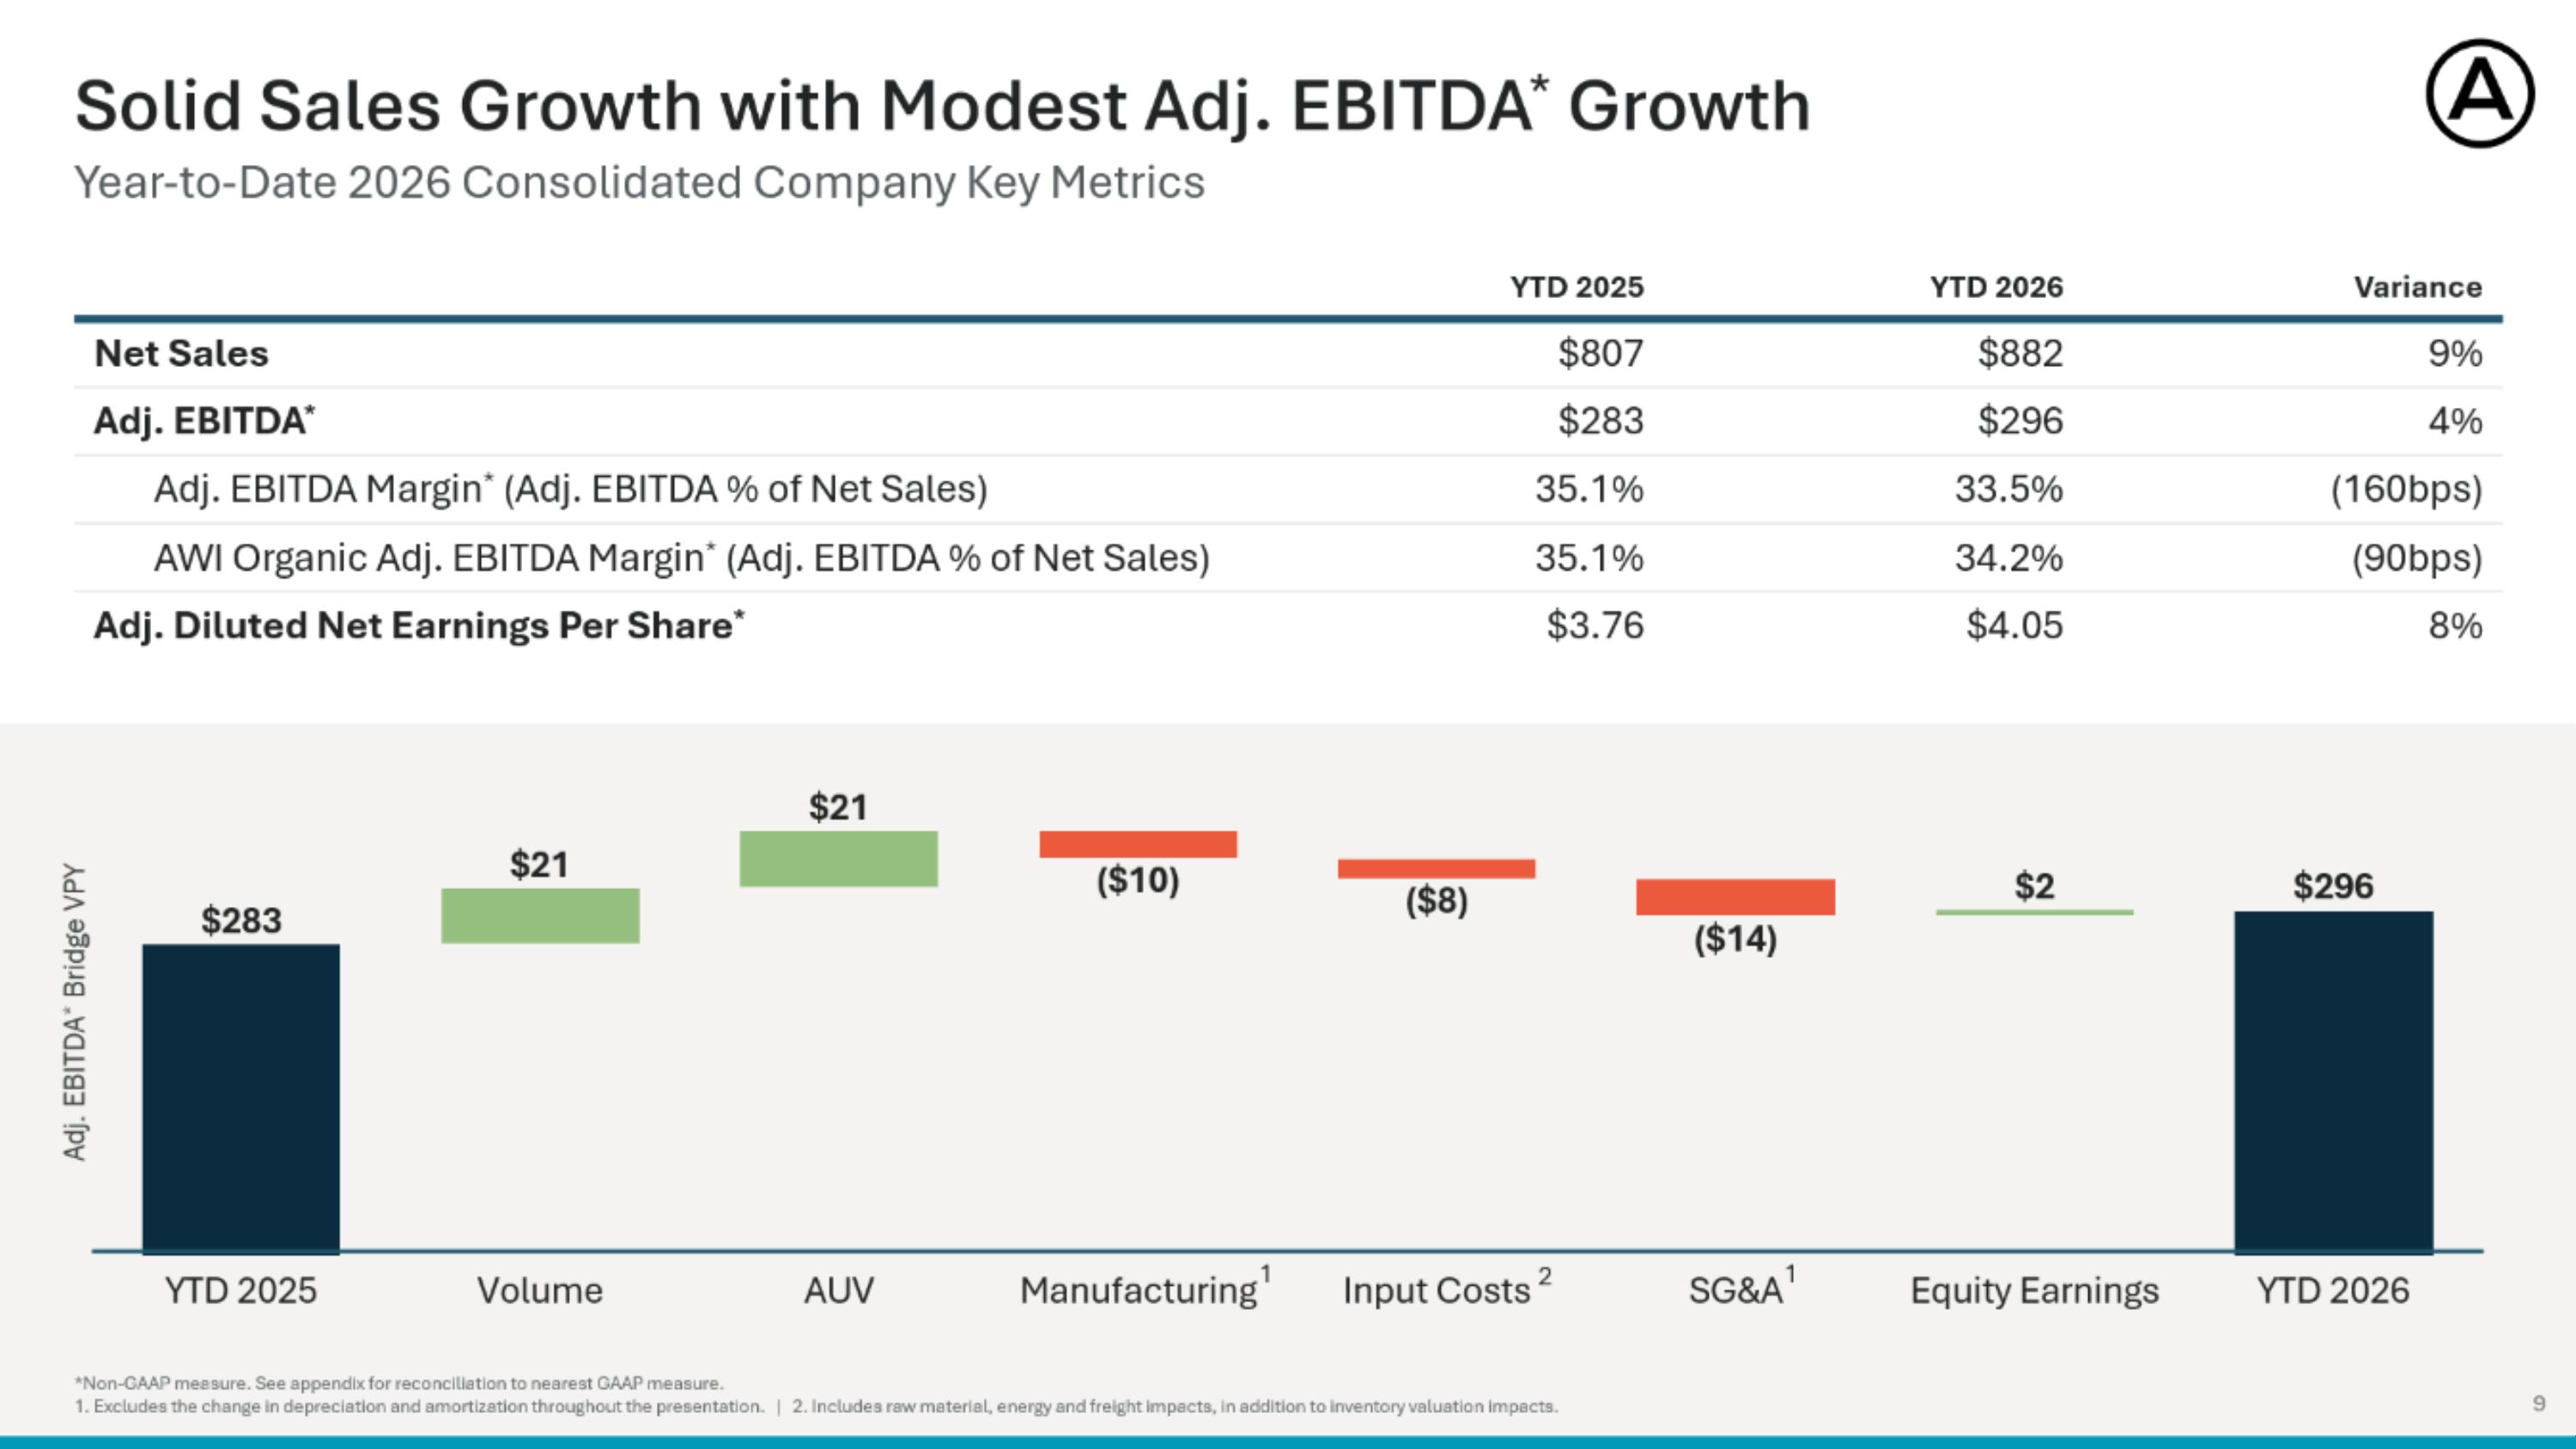
*Non-GAAP measure. See appendix for reconciliation to nearest GAAP measure. 1. Excludes the change in depreciation and amortization throughout the presentation. | 2. Includes raw material, energy and freight impacts, in addition to inventory valuation impacts. Year-to-Date 2026 Consolidated Company Key Metrics Solid Sales Growth with Modest Adj. EBITDA* Growth YTD 2025 YTD 2026 Variance Net Sales $807 $882 9% Adj. EBITDA* $283 $296 4% Adj. EBITDA Margin* (Adj. EBITDA % of Net Sales) 35.1% 33.5% (160bps) AWI Organic Adj. EBITDA Margin* (Adj. EBITDA % of Net Sales) 35.1% 34.2% (90bps) Adj. Diluted Net Earnings Per Share* $3.76 $4.05 8% Adj. EBITDA* Bridge VPY 1 1 2
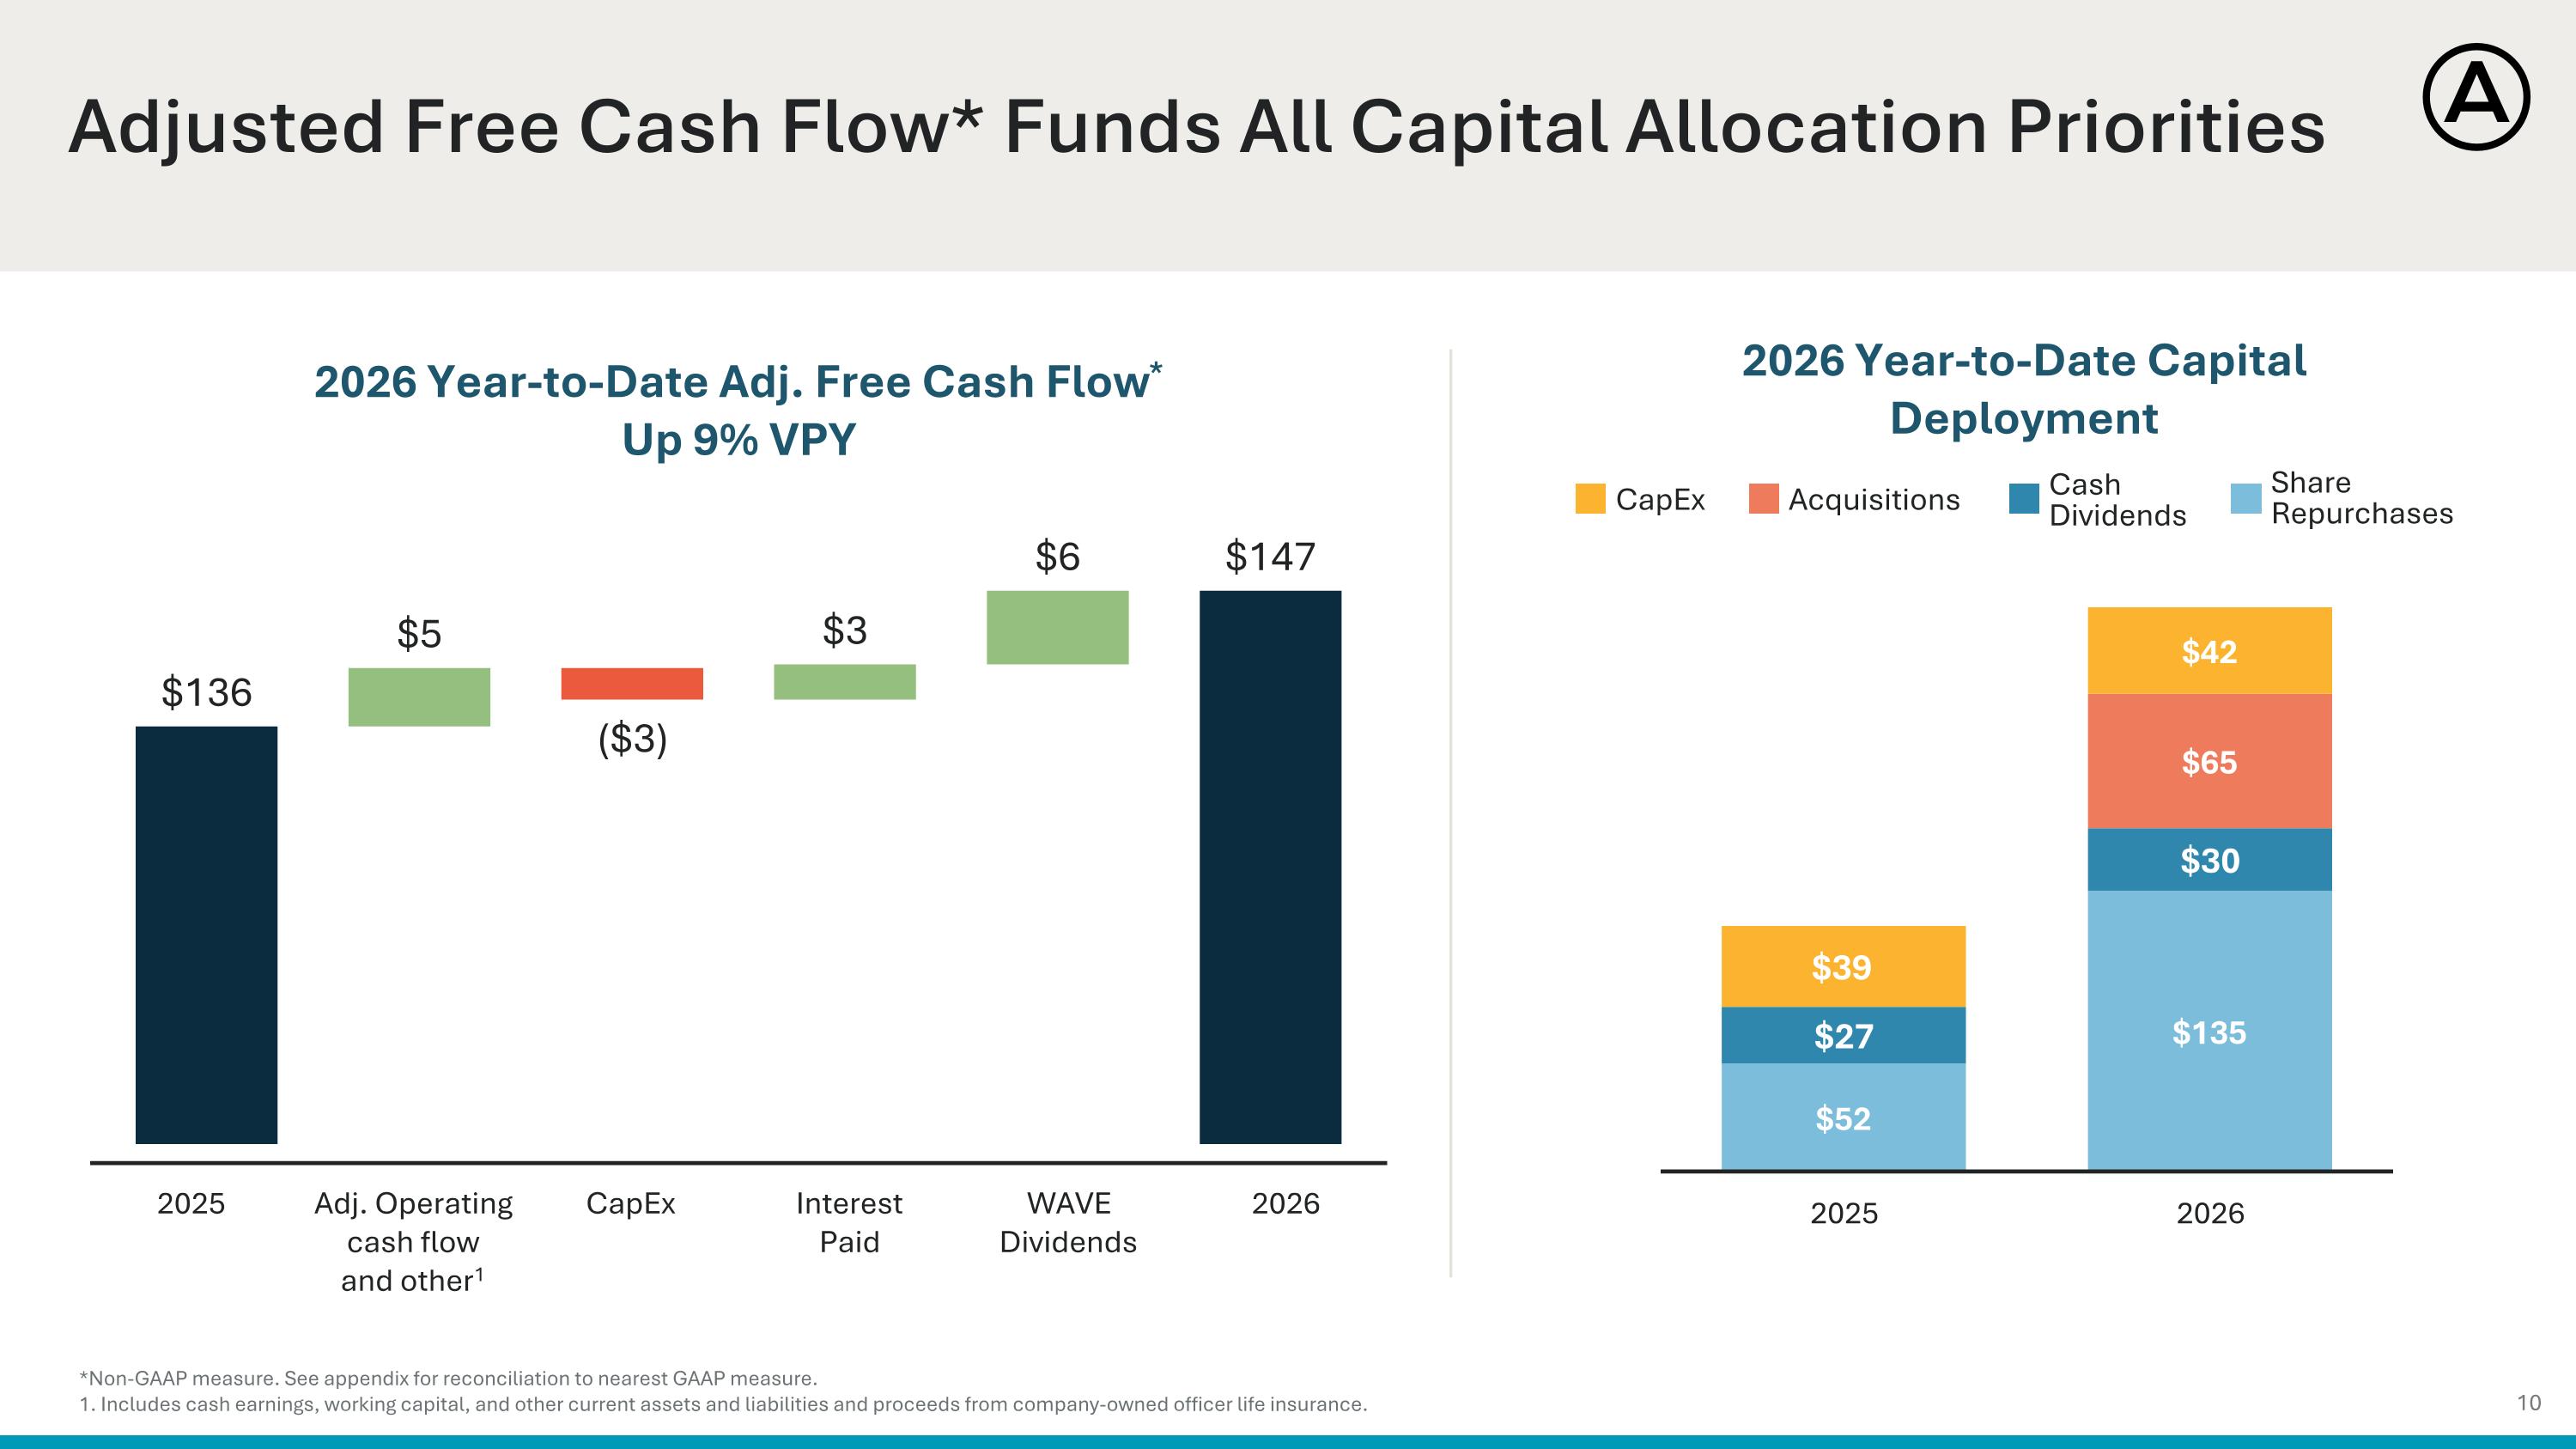
*Non-GAAP measure. See appendix for reconciliation to nearest GAAP measure. 1. Includes cash earnings, working capital, and other current assets and liabilities and proceeds from company-owned officer life insurance. Adjusted Free Cash Flow* Funds All Capital Allocation Priorities 2026 Year-to-Date Capital Deployment 2026 Year-to-Date Adj. Free Cash Flow* Up 9% VPY 2025 Adj. Operating cash flow and other1 CapEx Interest Paid WAVE Dividends 2026 CapEx Acquisitions Share Repurchases Cash Dividends
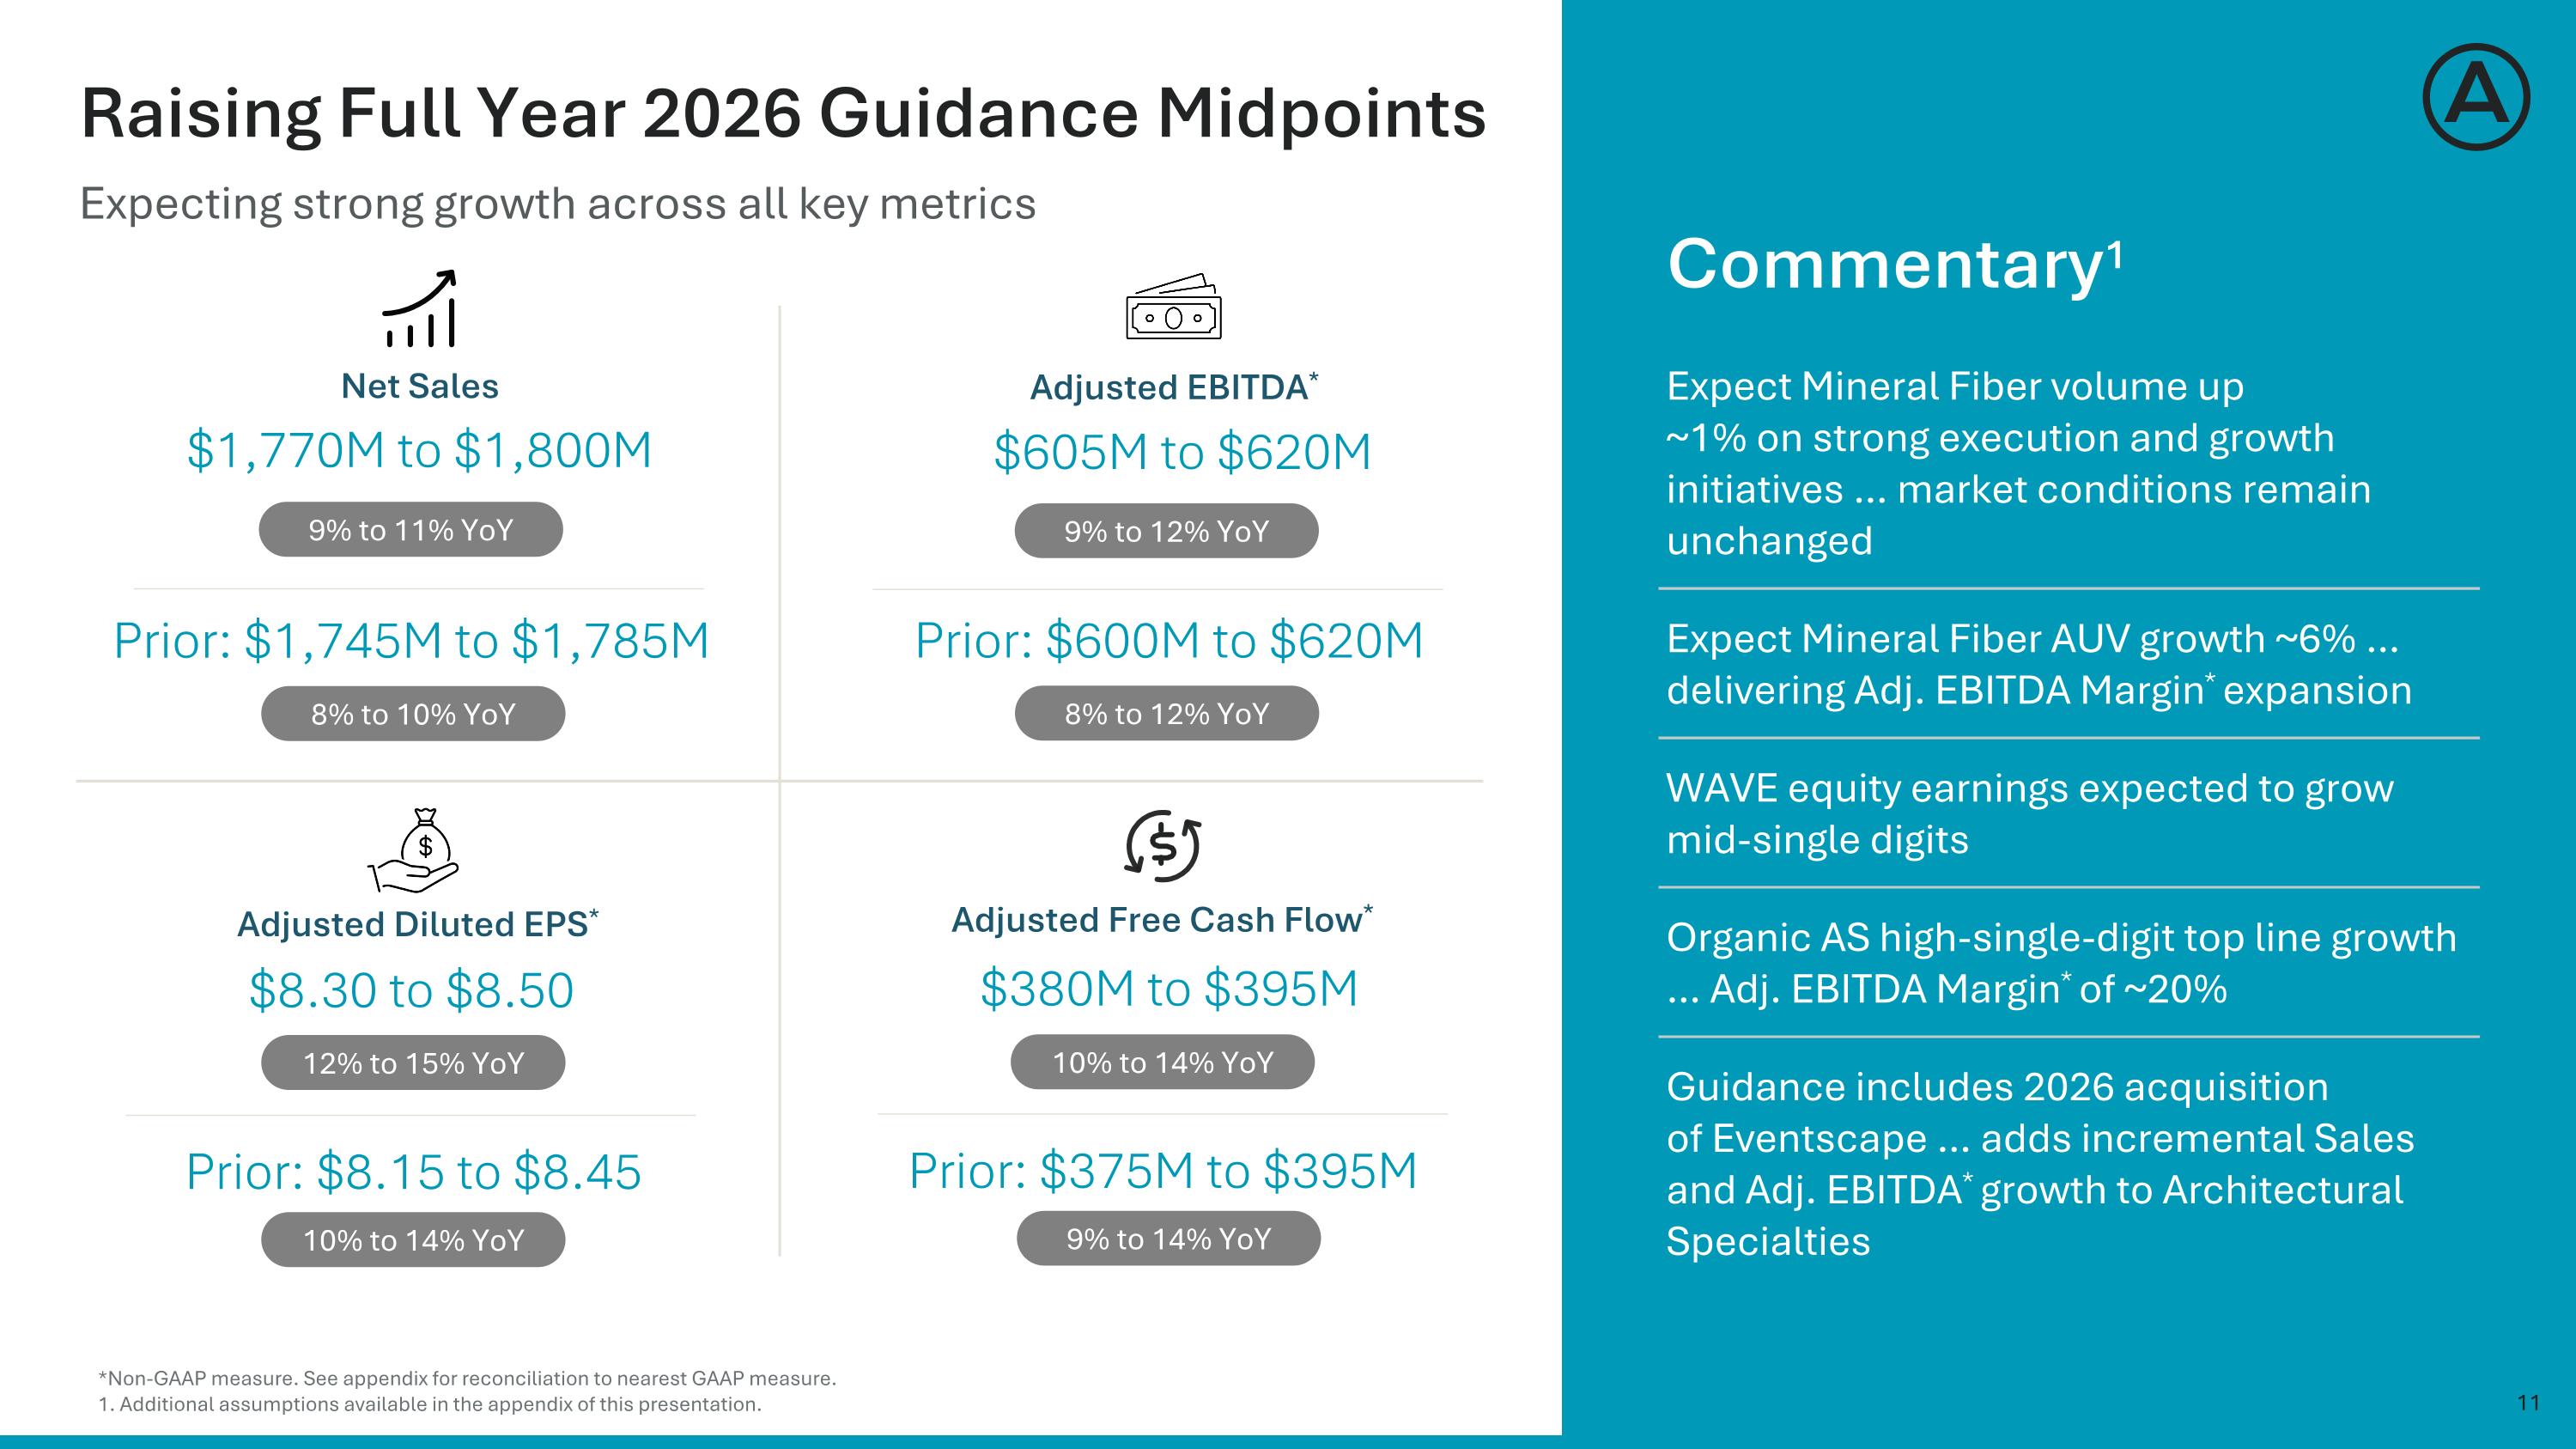
Expecting strong growth across all key metrics Raising Full Year 2026 Guidance Midpoints Commentary1 Expect Mineral Fiber volume up ~1% on strong execution and growth initiatives … market conditions remain unchanged Expect Mineral Fiber AUV growth ~6% … delivering Adj. EBITDA Margin* expansion WAVE equity earnings expected to grow mid-single digits Organic AS high-single-digit top line growth … Adj. EBITDA Margin* of ~20% Guidance includes 2026 acquisition of Eventscape … adds incremental Sales and Adj. EBITDA* growth to Architectural Specialties $1,770M to $1,800M Net Sales 9% to 11% YoY Prior: $600M to $620M Adjusted EBITDA* 8% to 12% YoY Adjusted Diluted EPS* Prior: $8.15 to $8.45 10% to 14% YoY $8.30 to $8.50 12% to 15% YoY Adjusted Free Cash Flow* 9% to 14% YoY Prior: $1,745M to $1,785M 8% to 10% YoY $605M to $620M 9% to 12% YoY Prior: $375M to $395M $380M to $395M 10% to 14% YoY *Non-GAAP measure. See appendix for reconciliation to nearest GAAP measure. 1. Additional assumptions available in the appendix of this presentation.
Appendix
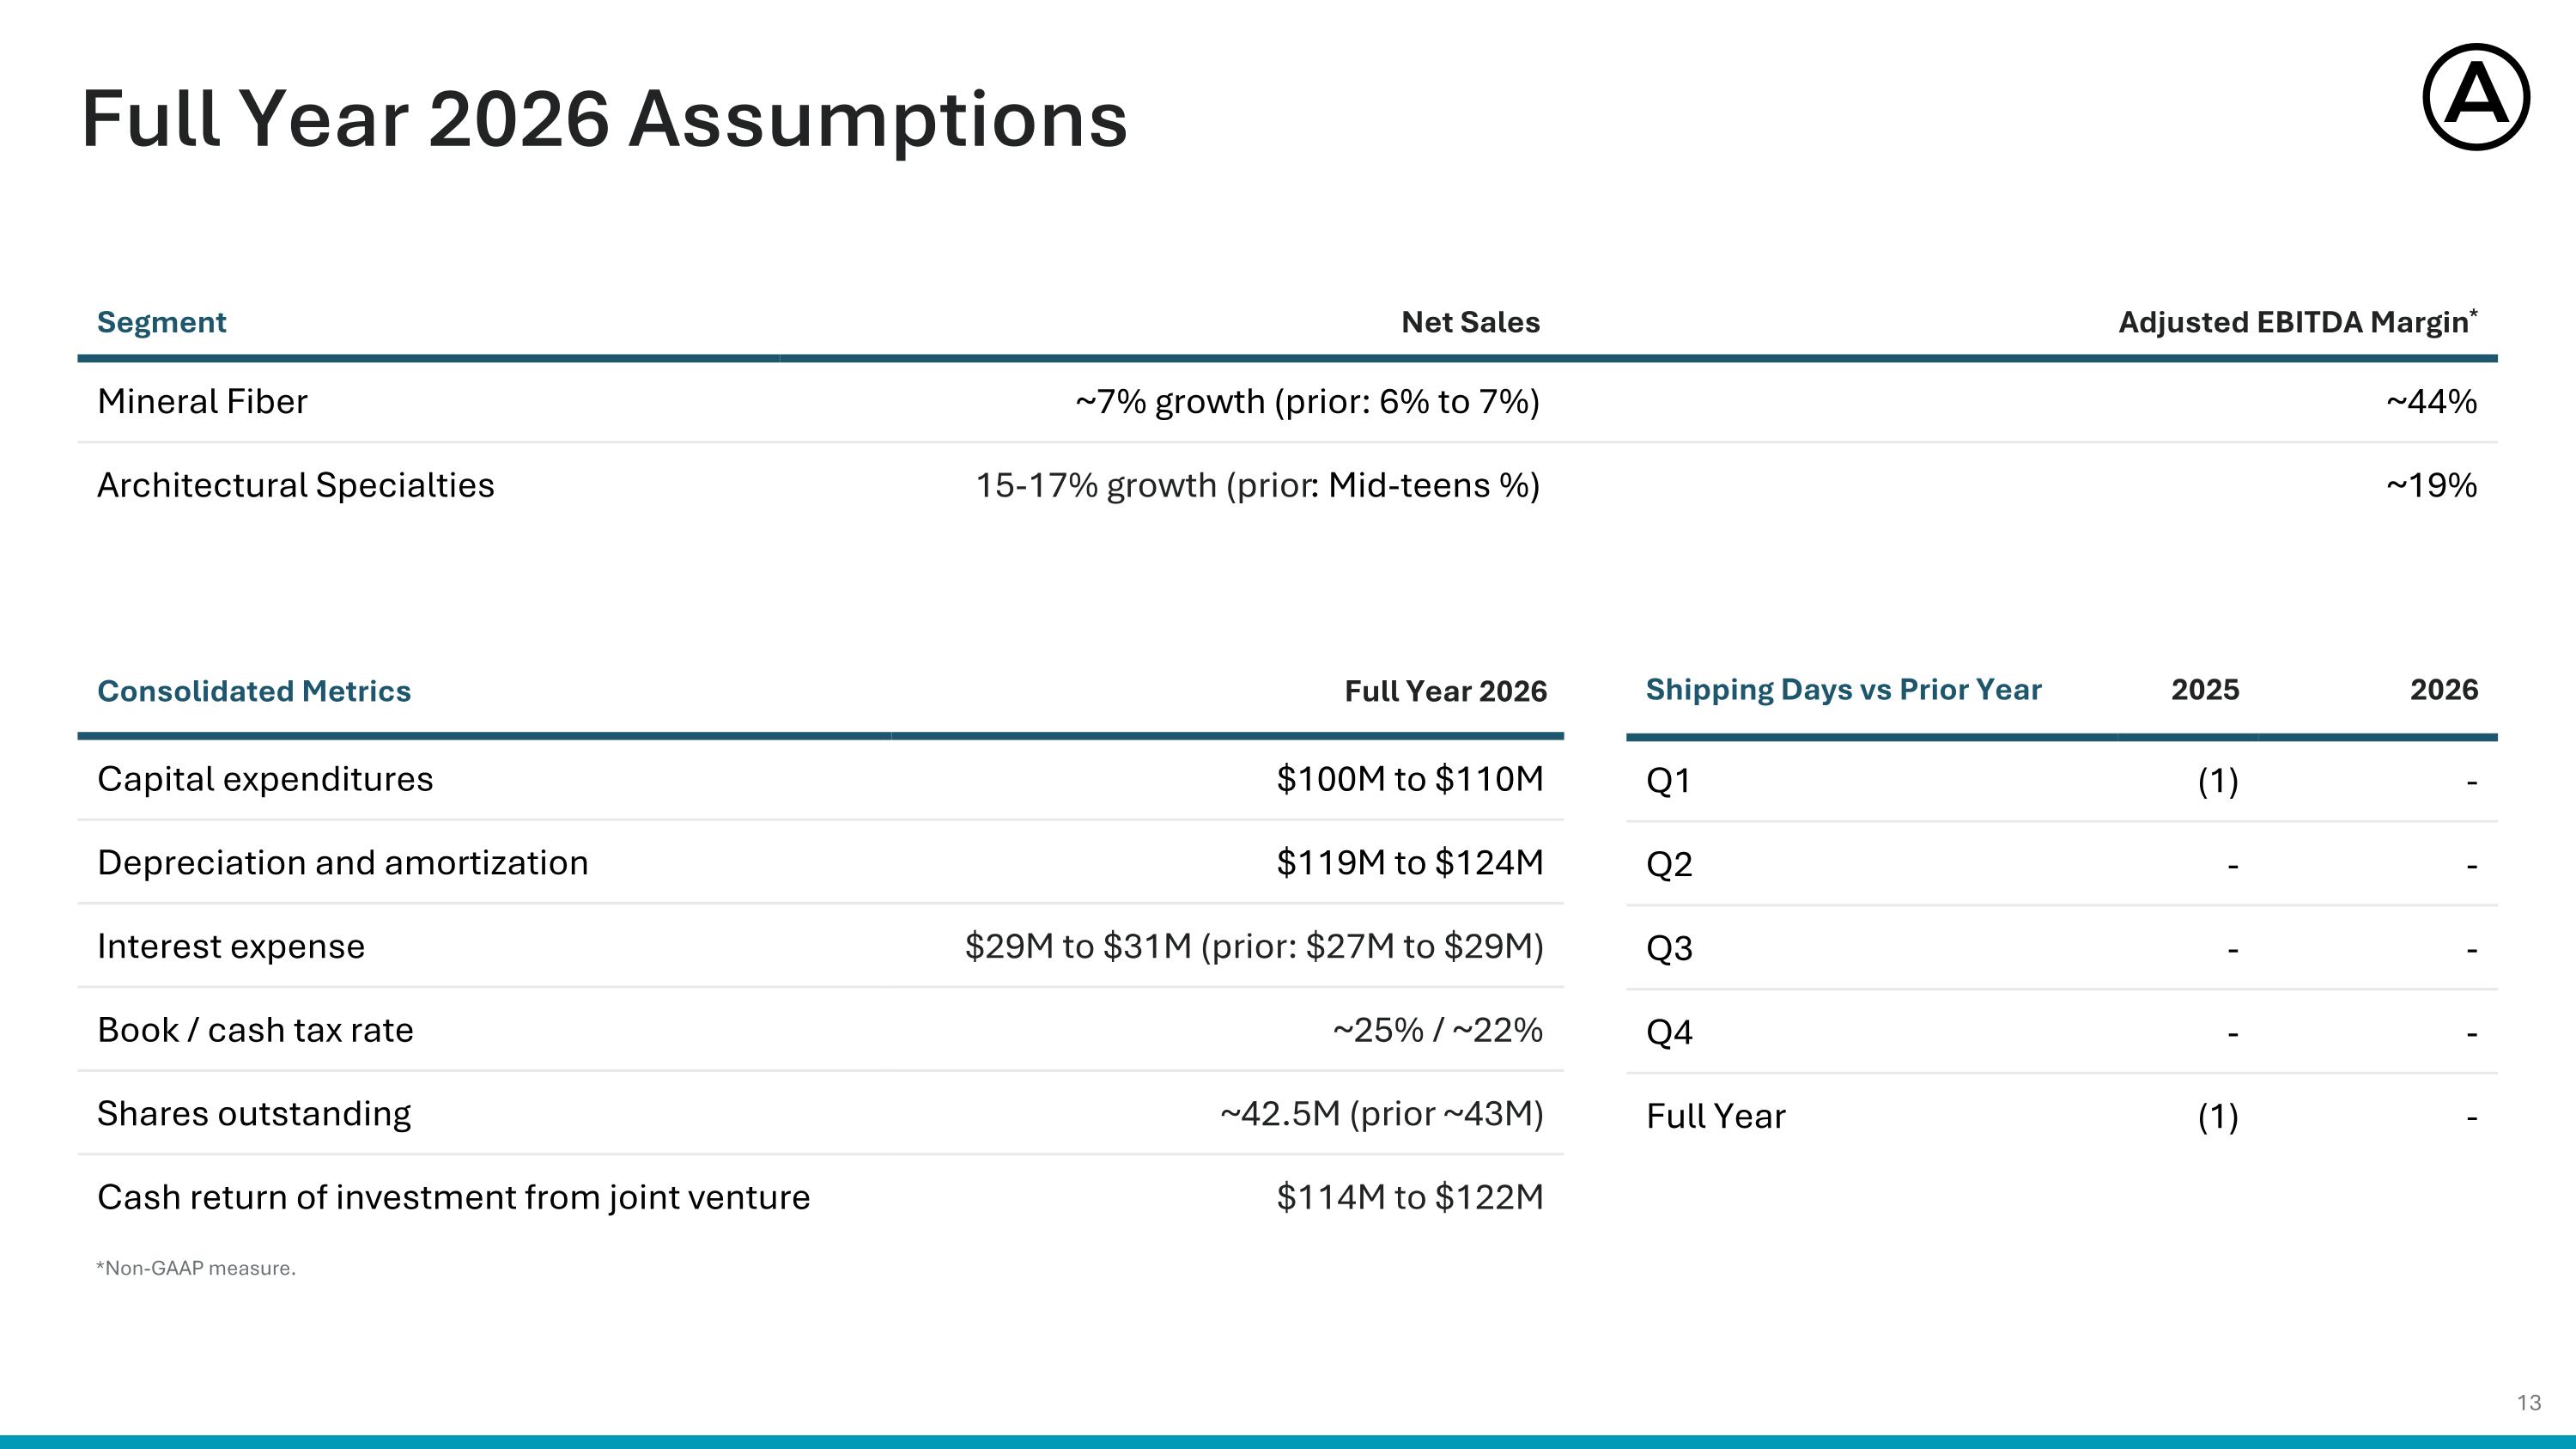
Full Year 2026 Assumptions Segment Net Sales Adjusted EBITDA Margin* Mineral Fiber ~7% growth (prior: 6% to 7%) ~44% Architectural Specialties 15-17% growth (prior: Mid-teens %) ~19% Consolidated Metrics Full Year 2026 Capital expenditures $100M to $110M Depreciation and amortization $119M to $124M Interest expense $29M to $31M (prior: $27M to $29M) Book / cash tax rate ~25% / ~22% Shares outstanding ~42.5M (prior ~43M) Cash return of investment from joint venture $114M to $122M Shipping Days vs Prior Year 2025 2026 Q1 (1) - Q2 - - Q3 - - Q4 - - Full Year (1) - *Non-GAAP measure.
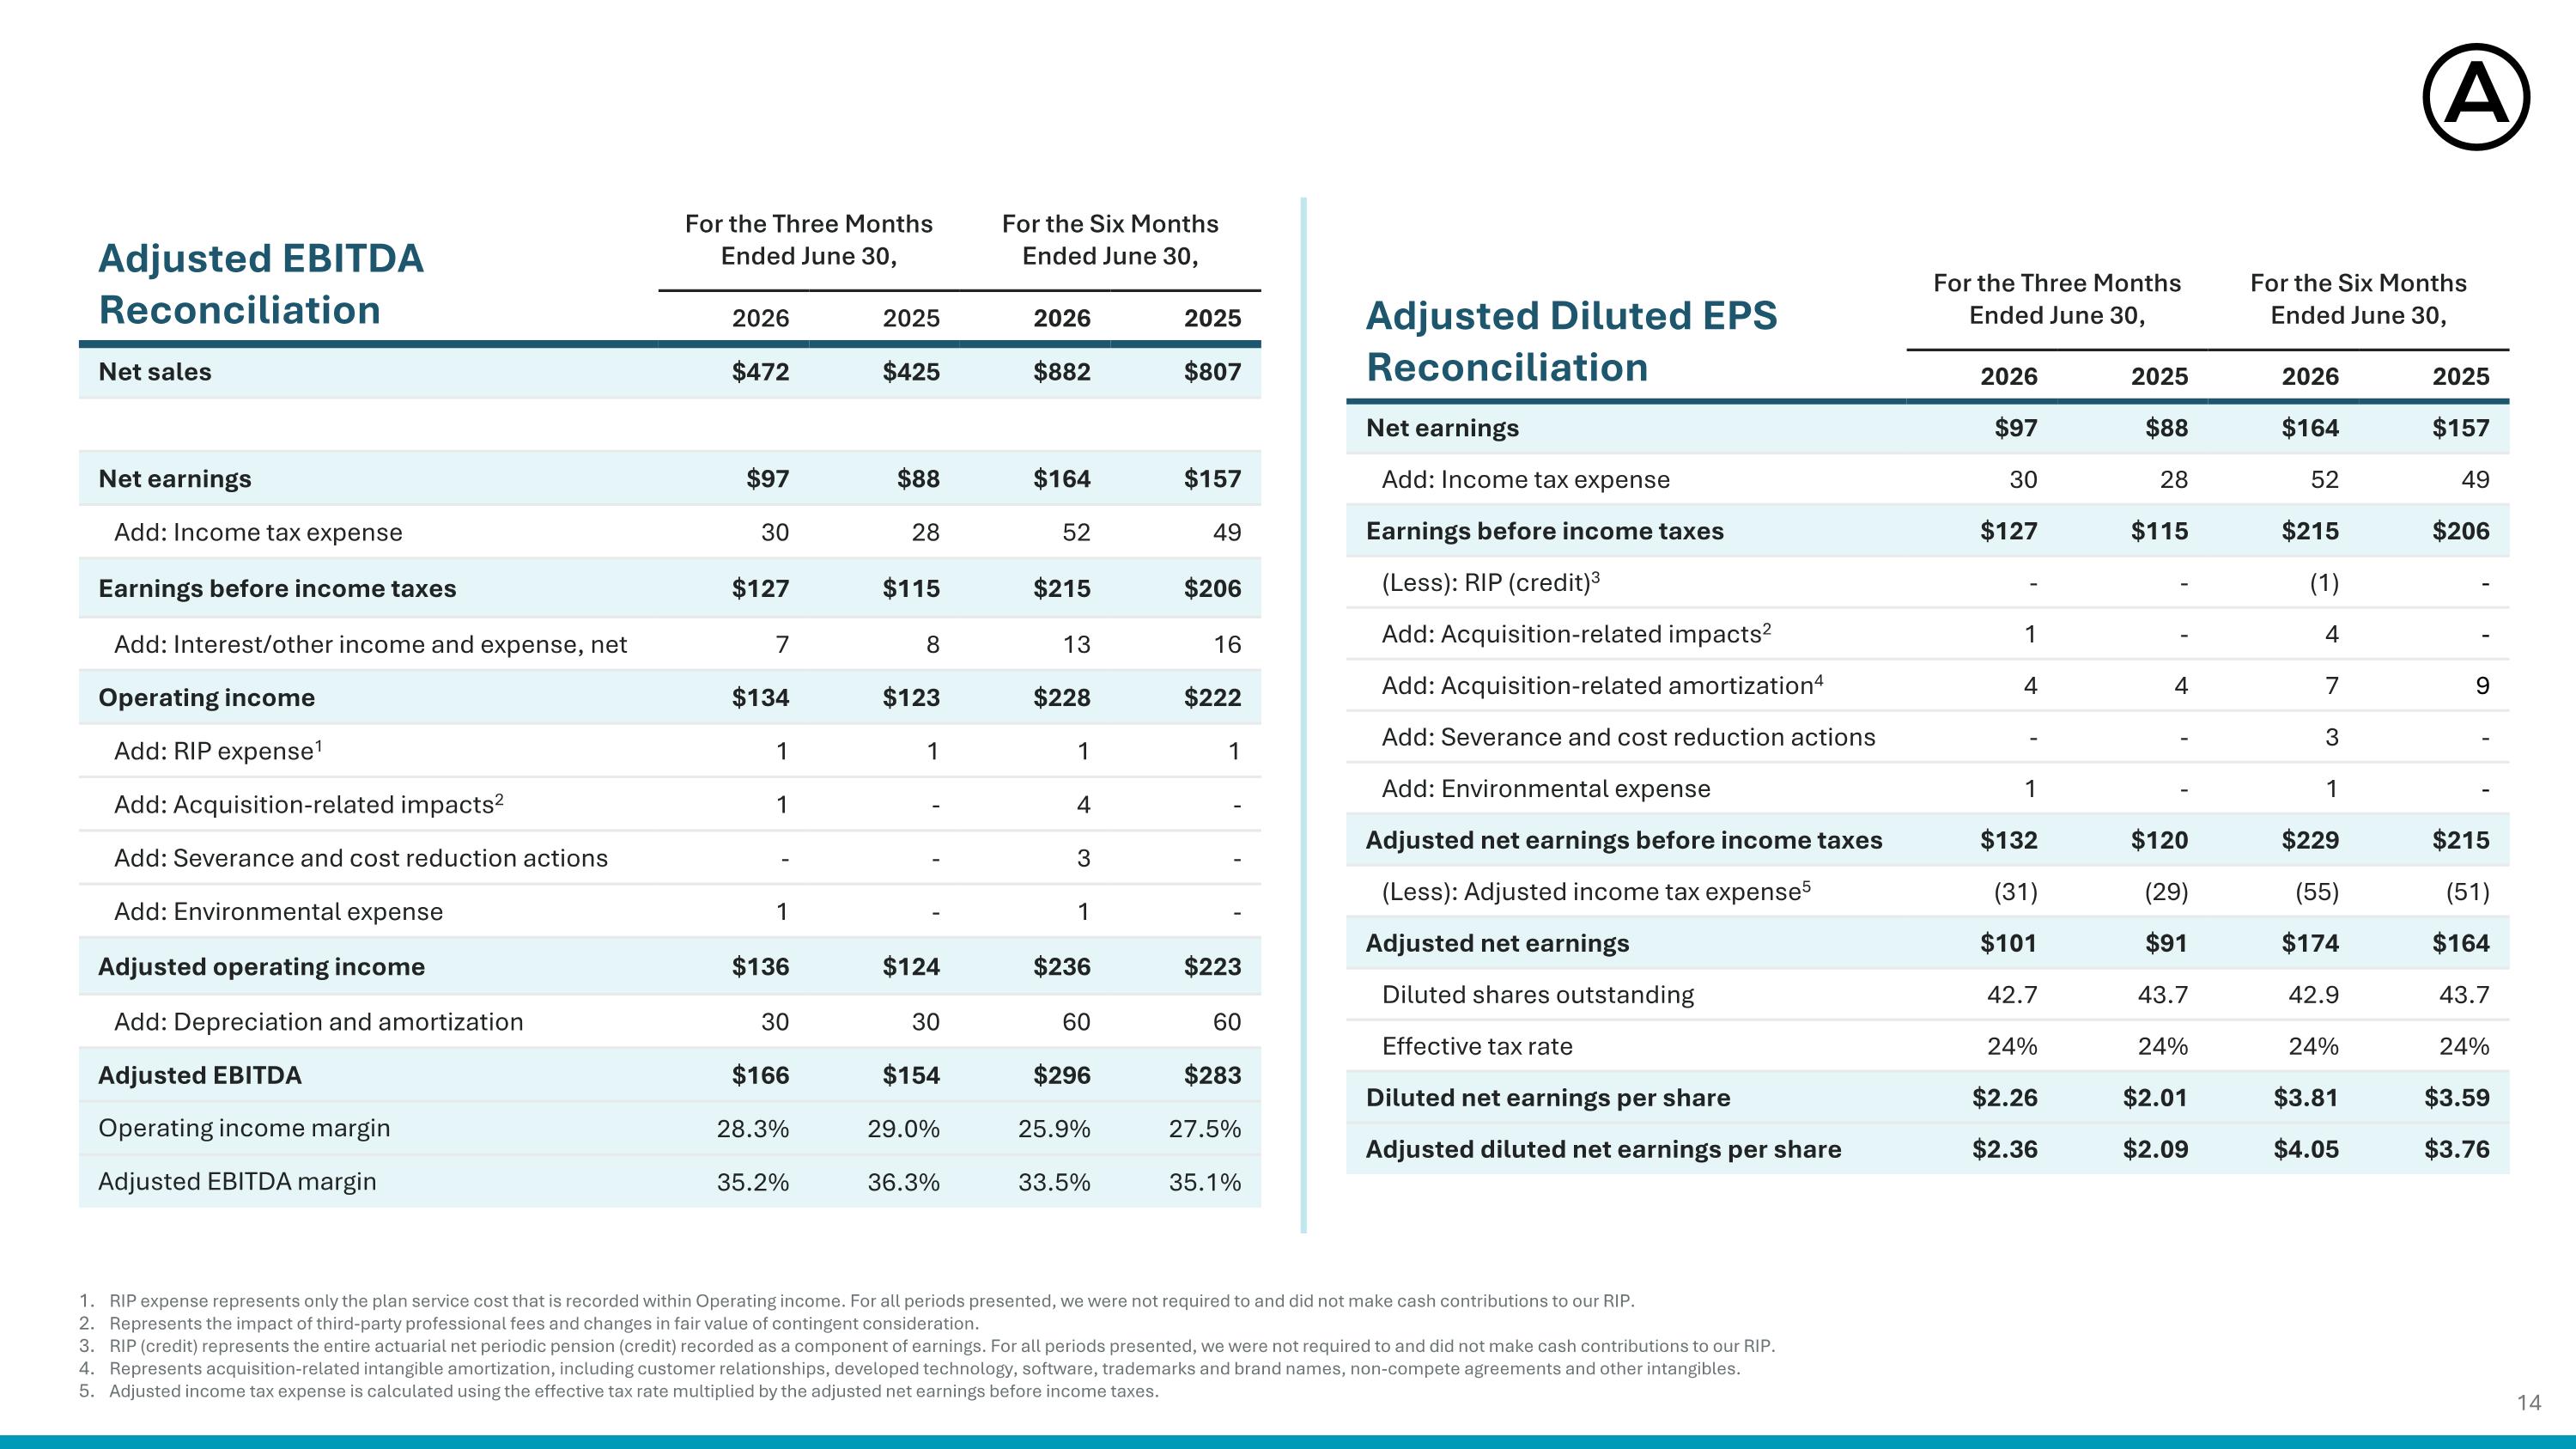
Adjusted EBITDA Reconciliation For the Three Months Ended June 30, For the Six Months Ended June 30, 2026 2025 2026 2025 Net sales $472 $425 $882 $807 Net earnings $97 $88 $164 $157 Add: Income tax expense 30 28 52 49 Earnings before income taxes $127 $115 $215 $206 Add: Interest/other income and expense, net 7 8 13 16 Operating income $134 $123 $228 $222 Add: RIP expense1 1 1 1 1 Add: Acquisition-related impacts2 1 - 4 - Add: Severance and cost reduction actions - - 3 - Add: Environmental expense 1 - 1 - Adjusted operating income $136 $124 $236 $223 Add: Depreciation and amortization 30 30 60 60 Adjusted EBITDA $166 $154 $296 $283 Operating income margin 28.3% 29.0% 25.9% 27.5% Adjusted EBITDA margin 35.2% 36.3% 33.5% 35.1% Adjusted Diluted EPS Reconciliation For the Three Months Ended June 30, For the Six Months Ended June 30, 2026 2025 2026 2025 Net earnings $97 $88 $164 $157 Add: Income tax expense 30 28 52 49 Earnings before income taxes $127 $115 $215 $206 (Less): RIP (credit)3 - - (1) - Add: Acquisition-related impacts2 1 - 4 - Add: Acquisition-related amortization4 4 4 7 9 Add: Severance and cost reduction actions - - 3 - Add: Environmental expense 1 - 1 - Adjusted net earnings before income taxes $132 $120 $229 $215 (Less): Adjusted income tax expense5 (31) (29) (55) (51) Adjusted net earnings $101 $91 $174 $164 Diluted shares outstanding 42.7 43.7 42.9 43.7 Effective tax rate 24% 24% 24% 24% Diluted net earnings per share $2.26 $2.01 $3.81 $3.59 Adjusted diluted net earnings per share $2.36 $2.09 $4.05 $3.76 RIP expense represents only the plan service cost that is recorded within Operating income. For all periods presented, we were not required to and did not make cash contributions to our RIP. Represents the impact of third-party professional fees and changes in fair value of contingent consideration. RIP (credit) represents the entire actuarial net periodic pension (credit) recorded as a component of earnings. For all periods presented, we were not required to and did not make cash contributions to our RIP. Represents acquisition-related intangible amortization, including customer relationships, developed technology, software, trademarks and brand names, non-compete agreements and other intangibles. Adjusted income tax expense is calculated using the effective tax rate multiplied by the adjusted net earnings before income taxes.
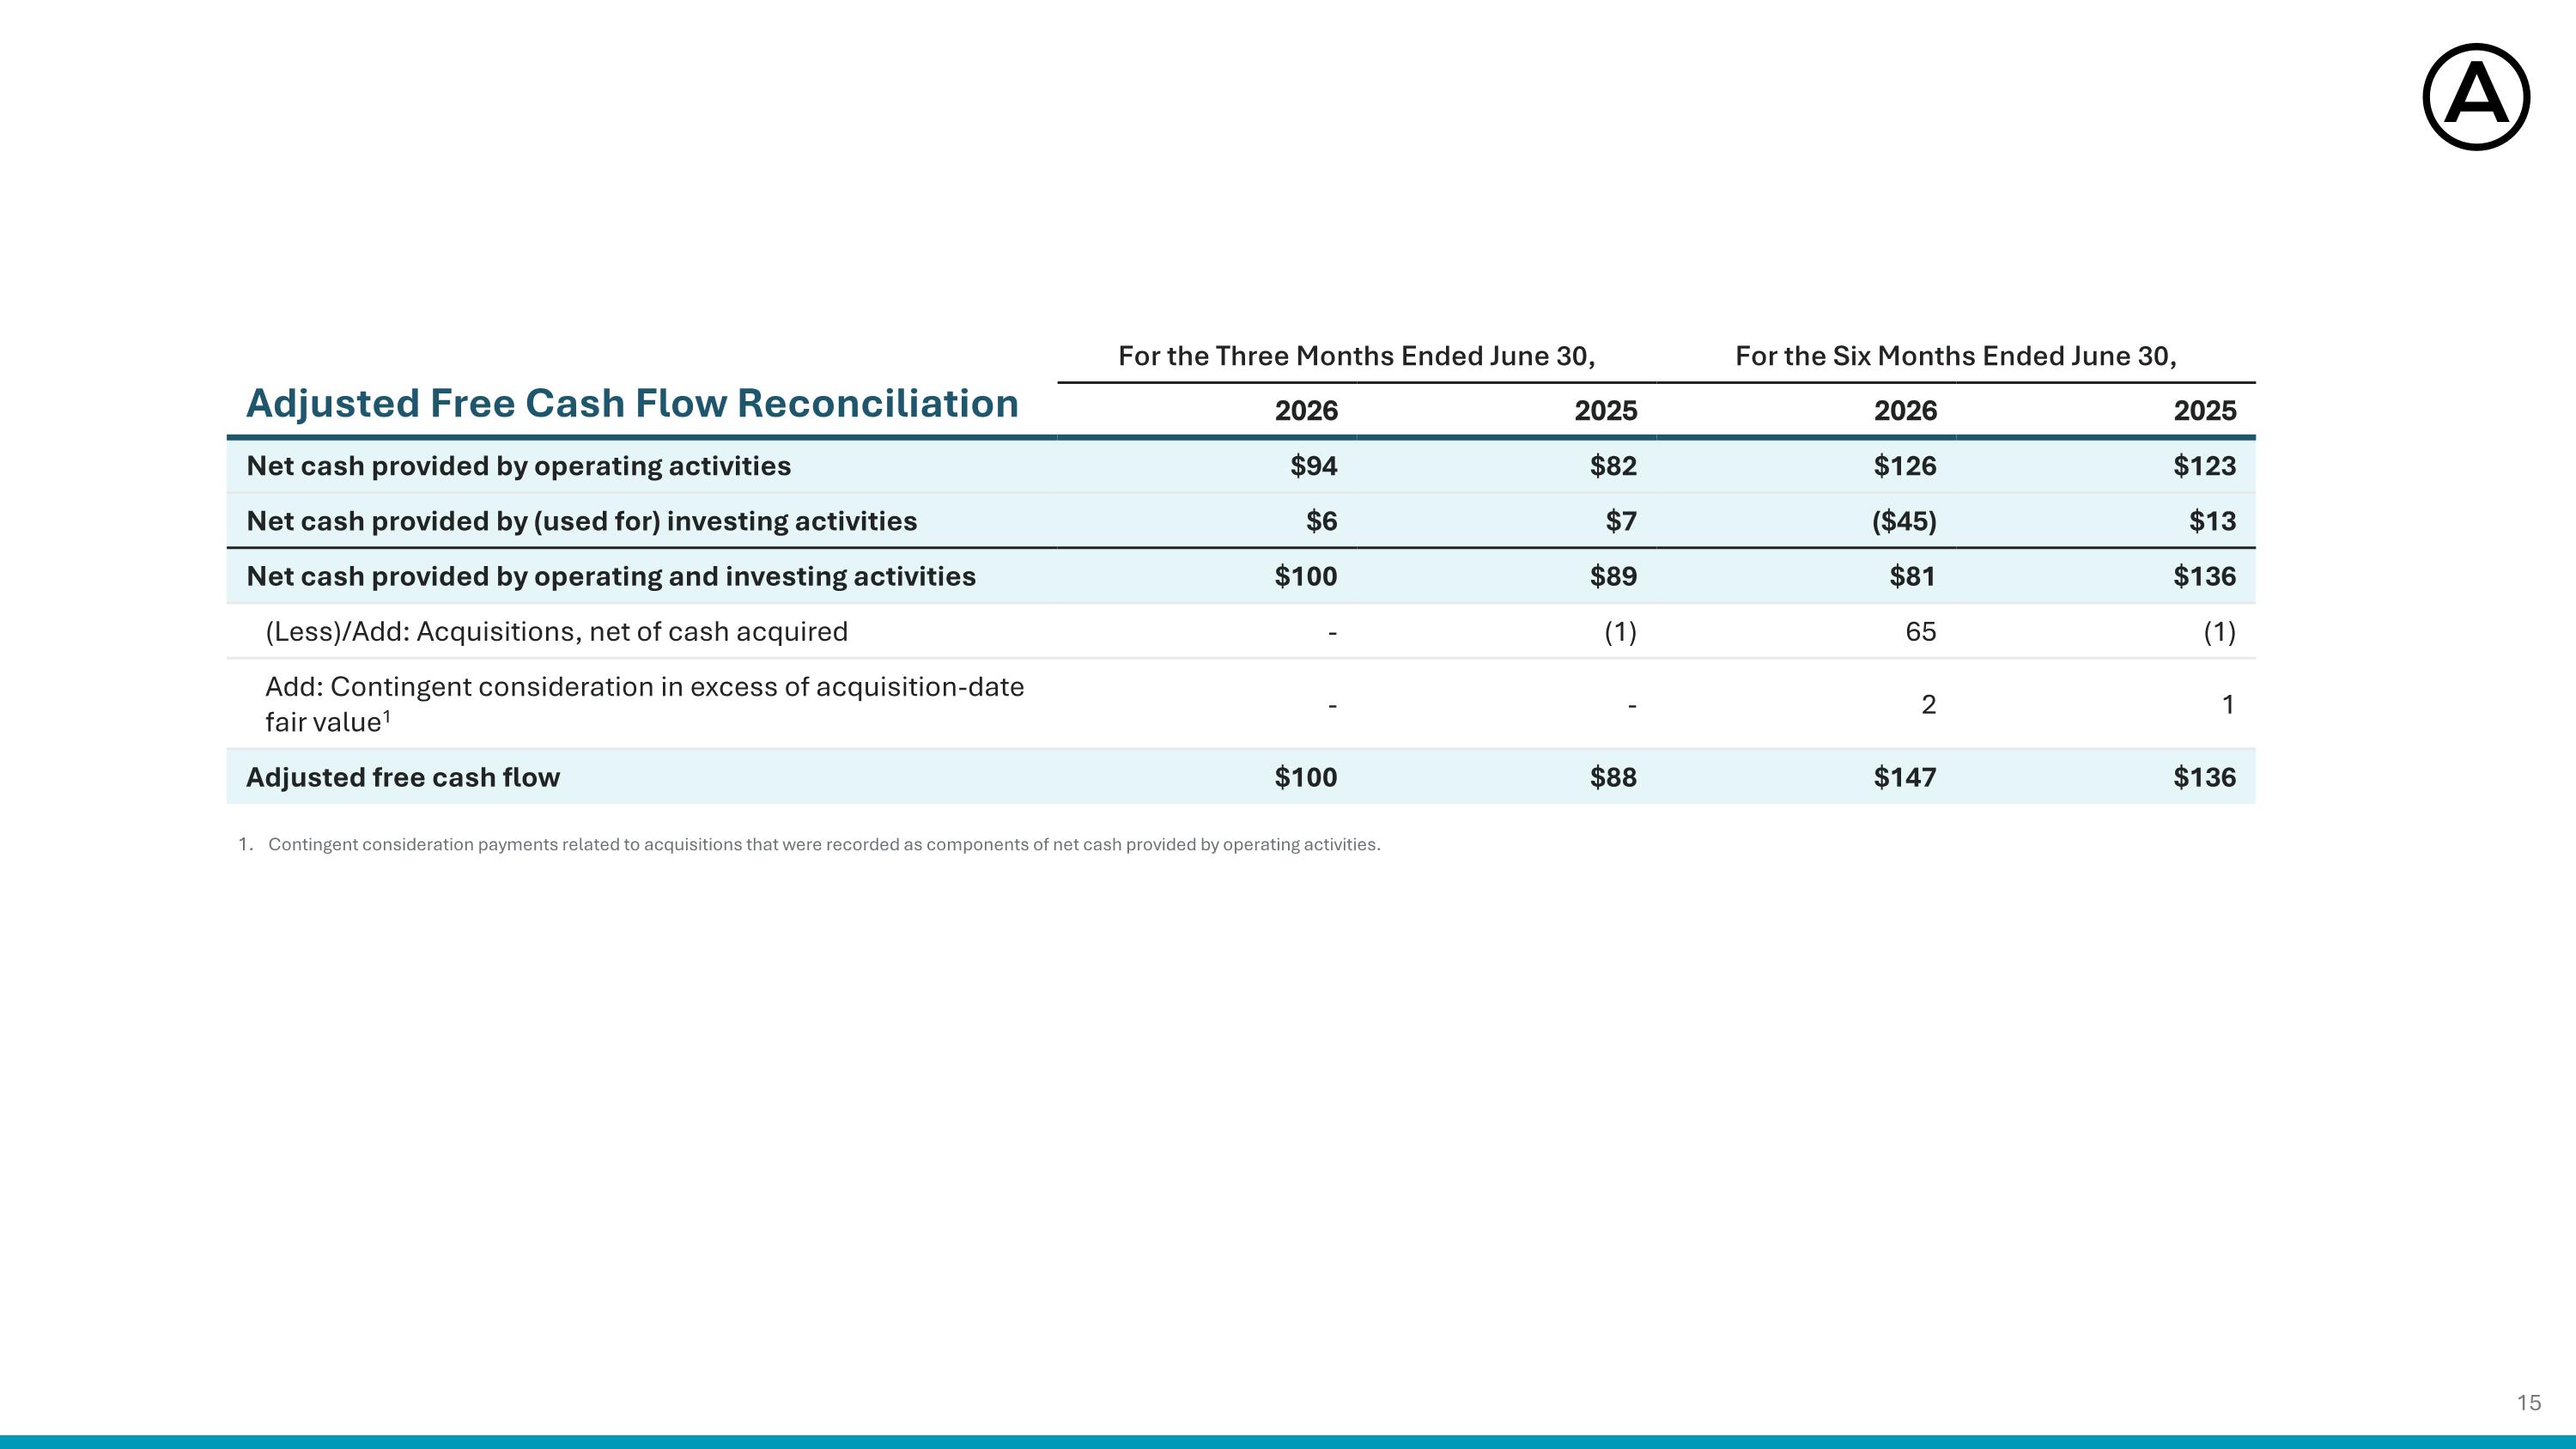
Adjusted Free Cash Flow Reconciliation For the Three Months Ended June 30, For the Six Months Ended June 30, 2026 2025 2026 2025 Net cash provided by operating activities $94 $82 $126 $123 Net cash provided by (used for) investing activities $6 $7 ($45) $13 Net cash provided by operating and investing activities $100 $89 $81 $136 (Less)/Add: Acquisitions, net of cash acquired - (1) 65 (1) Add: Contingent consideration in excess of acquisition-date fair value1 - - 2 1 Adjusted free cash flow $100 $88 $147 $136 Contingent consideration payments related to acquisitions that were recorded as components of net cash provided by operating activities.
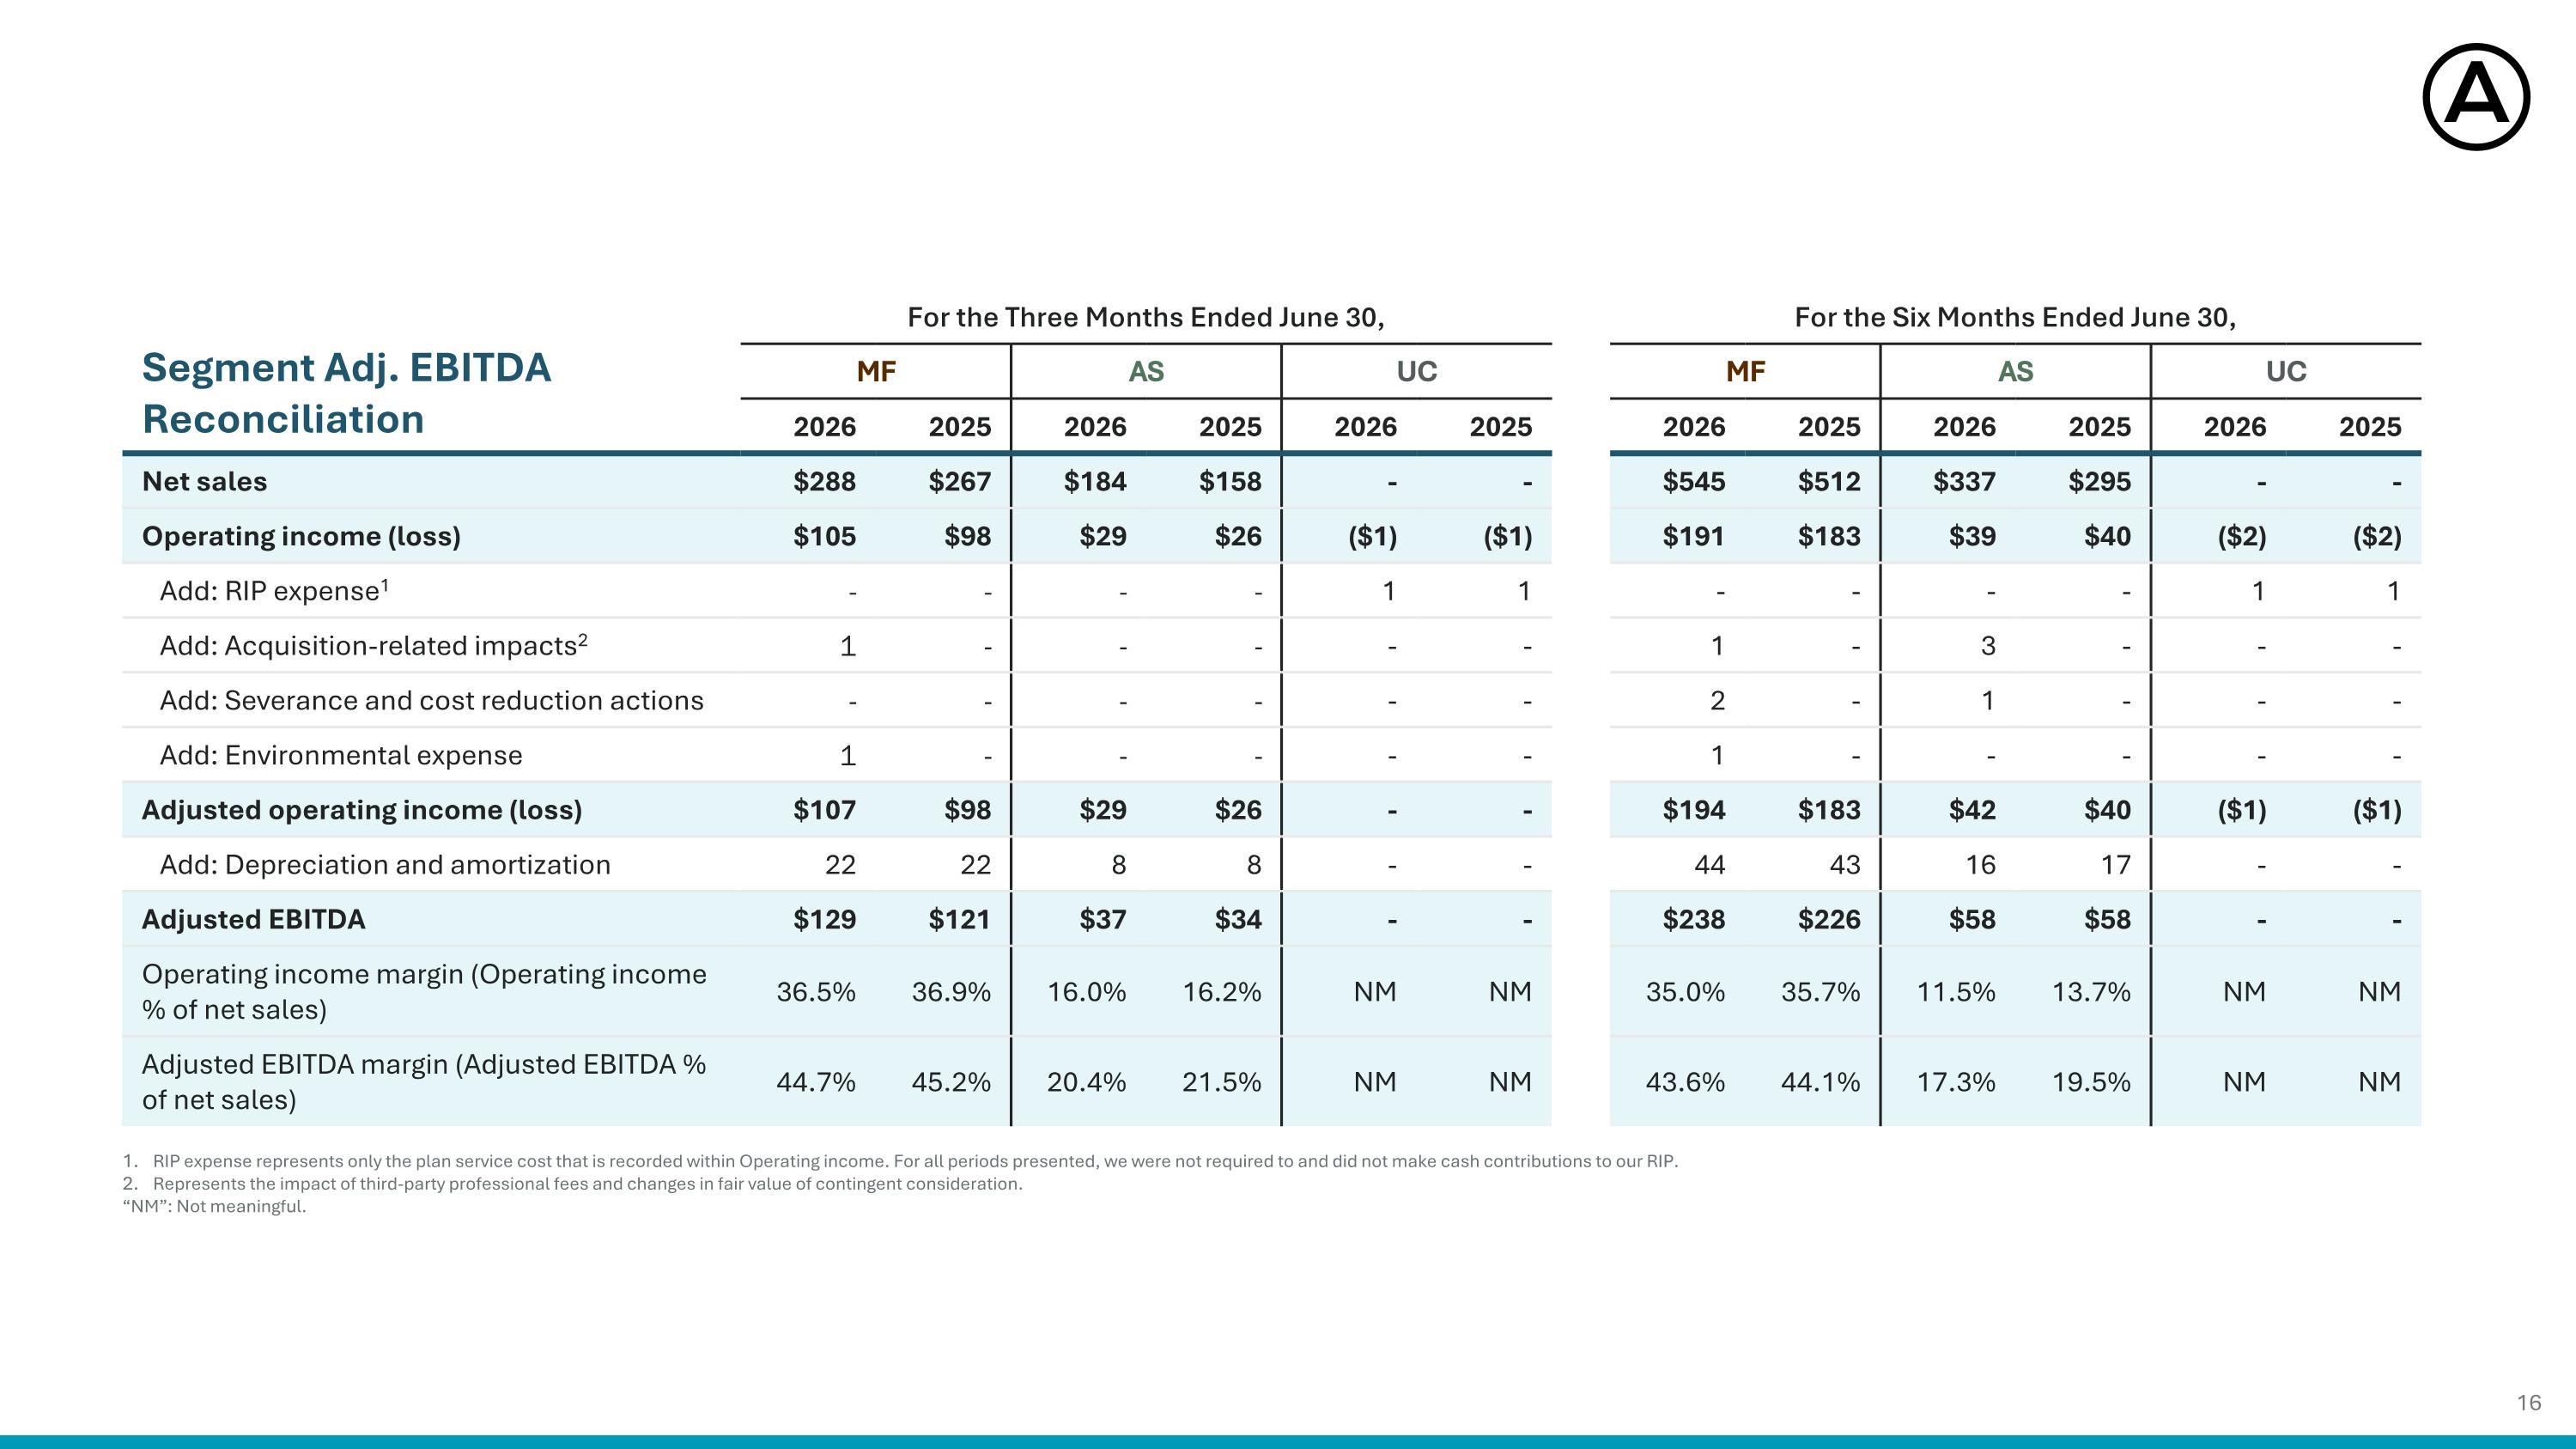
Segment Adj. EBITDA Reconciliation For the Three Months Ended June 30, For the Six Months Ended June 30, MF AS UC UNALLOCATED CORPORATE MF AS UC UNALLOCATED CORPORATE 2026 2025 2026 2025 2026 2025 2026 2025 2026 2025 2026 2025 Net sales $288 $267 $184 $158 - - $545 $512 $337 $295 - - Operating income (loss) $105 $98 $29 $26 ($1) ($1) $191 $183 $39 $40 ($2) ($2) Add: RIP expense1 - - - - 1 1 - - - - 1 1 Add: Acquisition-related impacts2 1 - - - - - 1 - 3 - - - Add: Severance and cost reduction actions - - - - - - 2 - 1 - - - Add: Environmental expense 1 - - - - - 1 - - - - - Adjusted operating income (loss) $107 $98 $29 $26 - - $194 $183 $42 $40 ($1) ($1) Add: Depreciation and amortization 22 22 8 8 - - 44 43 16 17 - - Adjusted EBITDA $129 $121 $37 $34 - - $238 $226 $58 $58 - - Operating income margin (Operating income % of net sales) 36.5% 36.9% 16.0% 16.2% NM NM 35.0% 35.7% 11.5% 13.7% NM NM Adjusted EBITDA margin (Adjusted EBITDA % of net sales) 44.7% 45.2% 20.4% 21.5% NM NM 43.6% 44.1% 17.3% 19.5% NM NM RIP expense represents only the plan service cost that is recorded within Operating income. For all periods presented, we were not required to and did not make cash contributions to our RIP. Represents the impact of third-party professional fees and changes in fair value of contingent consideration. “NM”: Not meaningful.
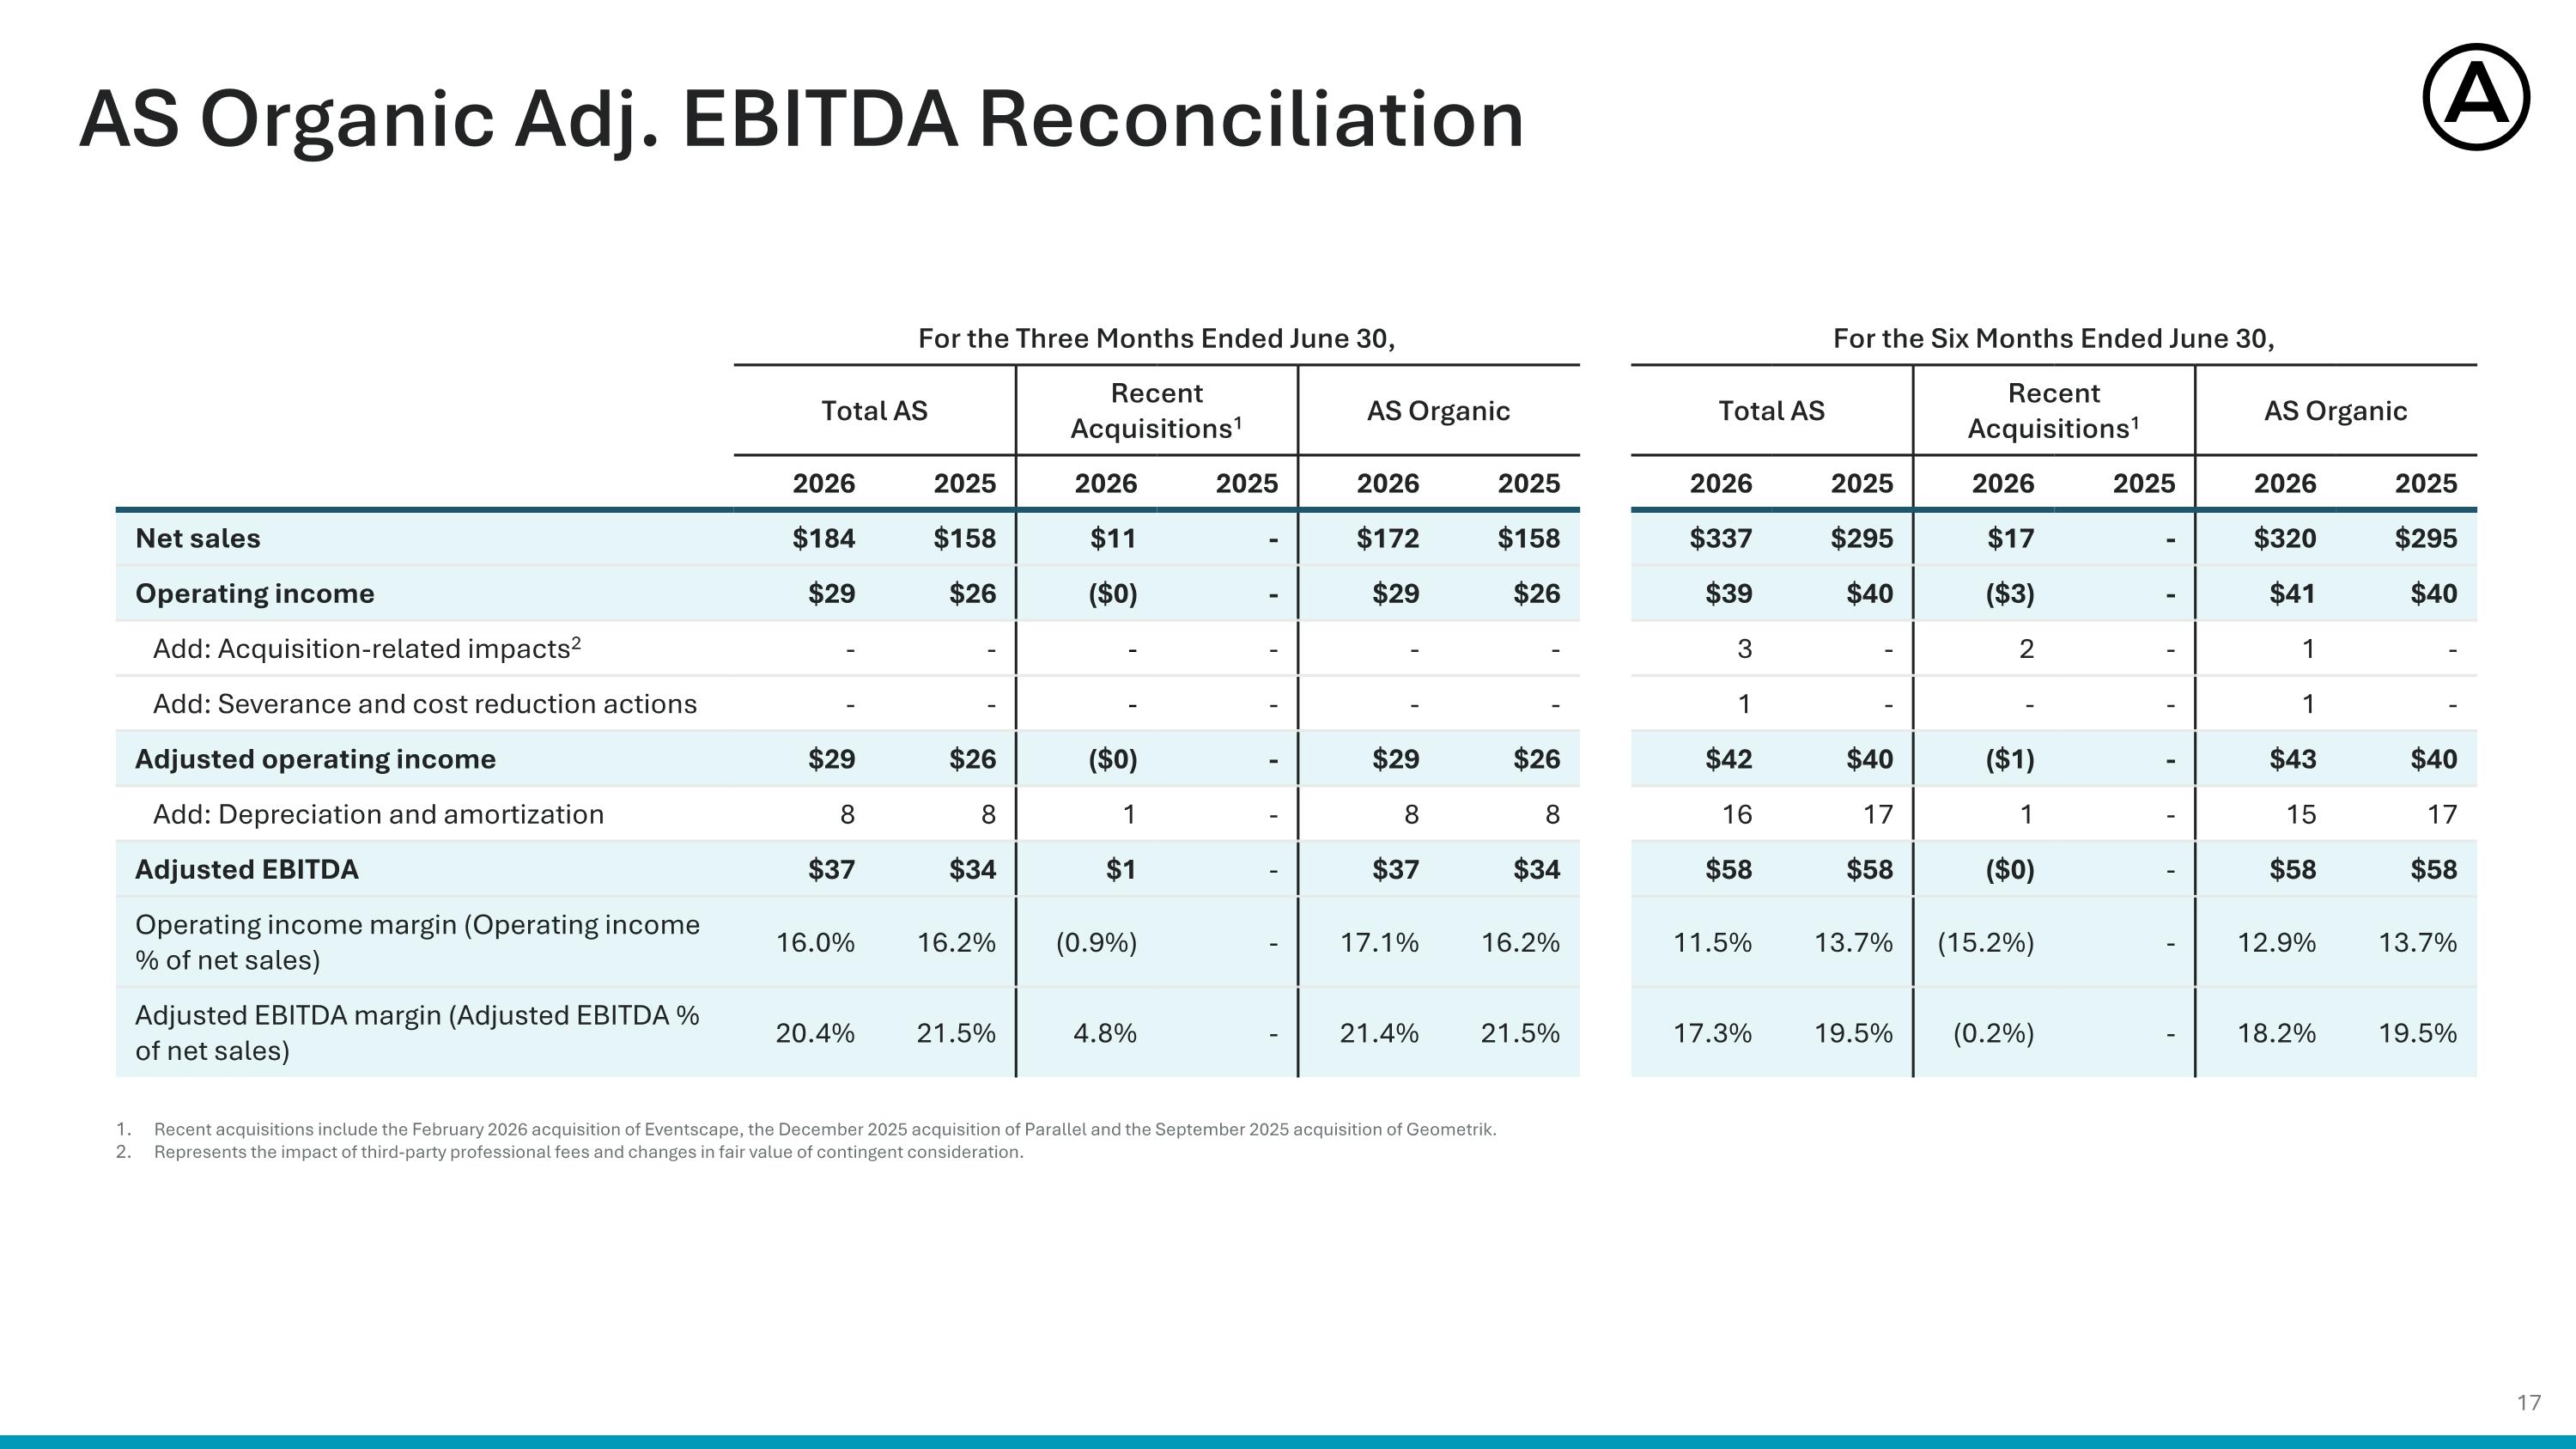
Recent acquisitions include the February 2026 acquisition of Eventscape, the December 2025 acquisition of Parallel and the September 2025 acquisition of Geometrik. Represents the impact of third-party professional fees and changes in fair value of contingent consideration. AS Organic Adj. EBITDA Reconciliation For the Three Months Ended June 30, For the Six Months Ended June 30, Total AS Recent Acquisitions1 AS Organic UNALLOCATED CORPORATE Total AS Recent Acquisitions1 AS Organic UNALLOCATED CORPORATE 2026 2025 2026 2025 2026 2025 2026 2025 2026 2025 2026 2025 Net sales $184 $158 $11 - $172 $158 $337 $295 $17 - $320 $295 Operating income $29 $26 ($0) - $29 $26 $39 $40 ($3) - $41 $40 Add: Acquisition-related impacts2 - - - - - - 3 - 2 - 1 - Add: Severance and cost reduction actions - - - - - - 1 - - - 1 - Adjusted operating income $29 $26 ($0) - $29 $26 $42 $40 ($1) - $43 $40 Add: Depreciation and amortization 8 8 1 - 8 8 16 17 1 - 15 17 Adjusted EBITDA $37 $34 $1 - $37 $34 $58 $58 ($0) - $58 $58 Operating income margin (Operating income % of net sales) 16.0% 16.2% (0.9%) - 17.1% 16.2% 11.5% 13.7% (15.2%) - 12.9% 13.7% Adjusted EBITDA margin (Adjusted EBITDA % of net sales) 20.4% 21.5% 4.8% - 21.4% 21.5% 17.3% 19.5% (0.2%) - 18.2% 19.5%
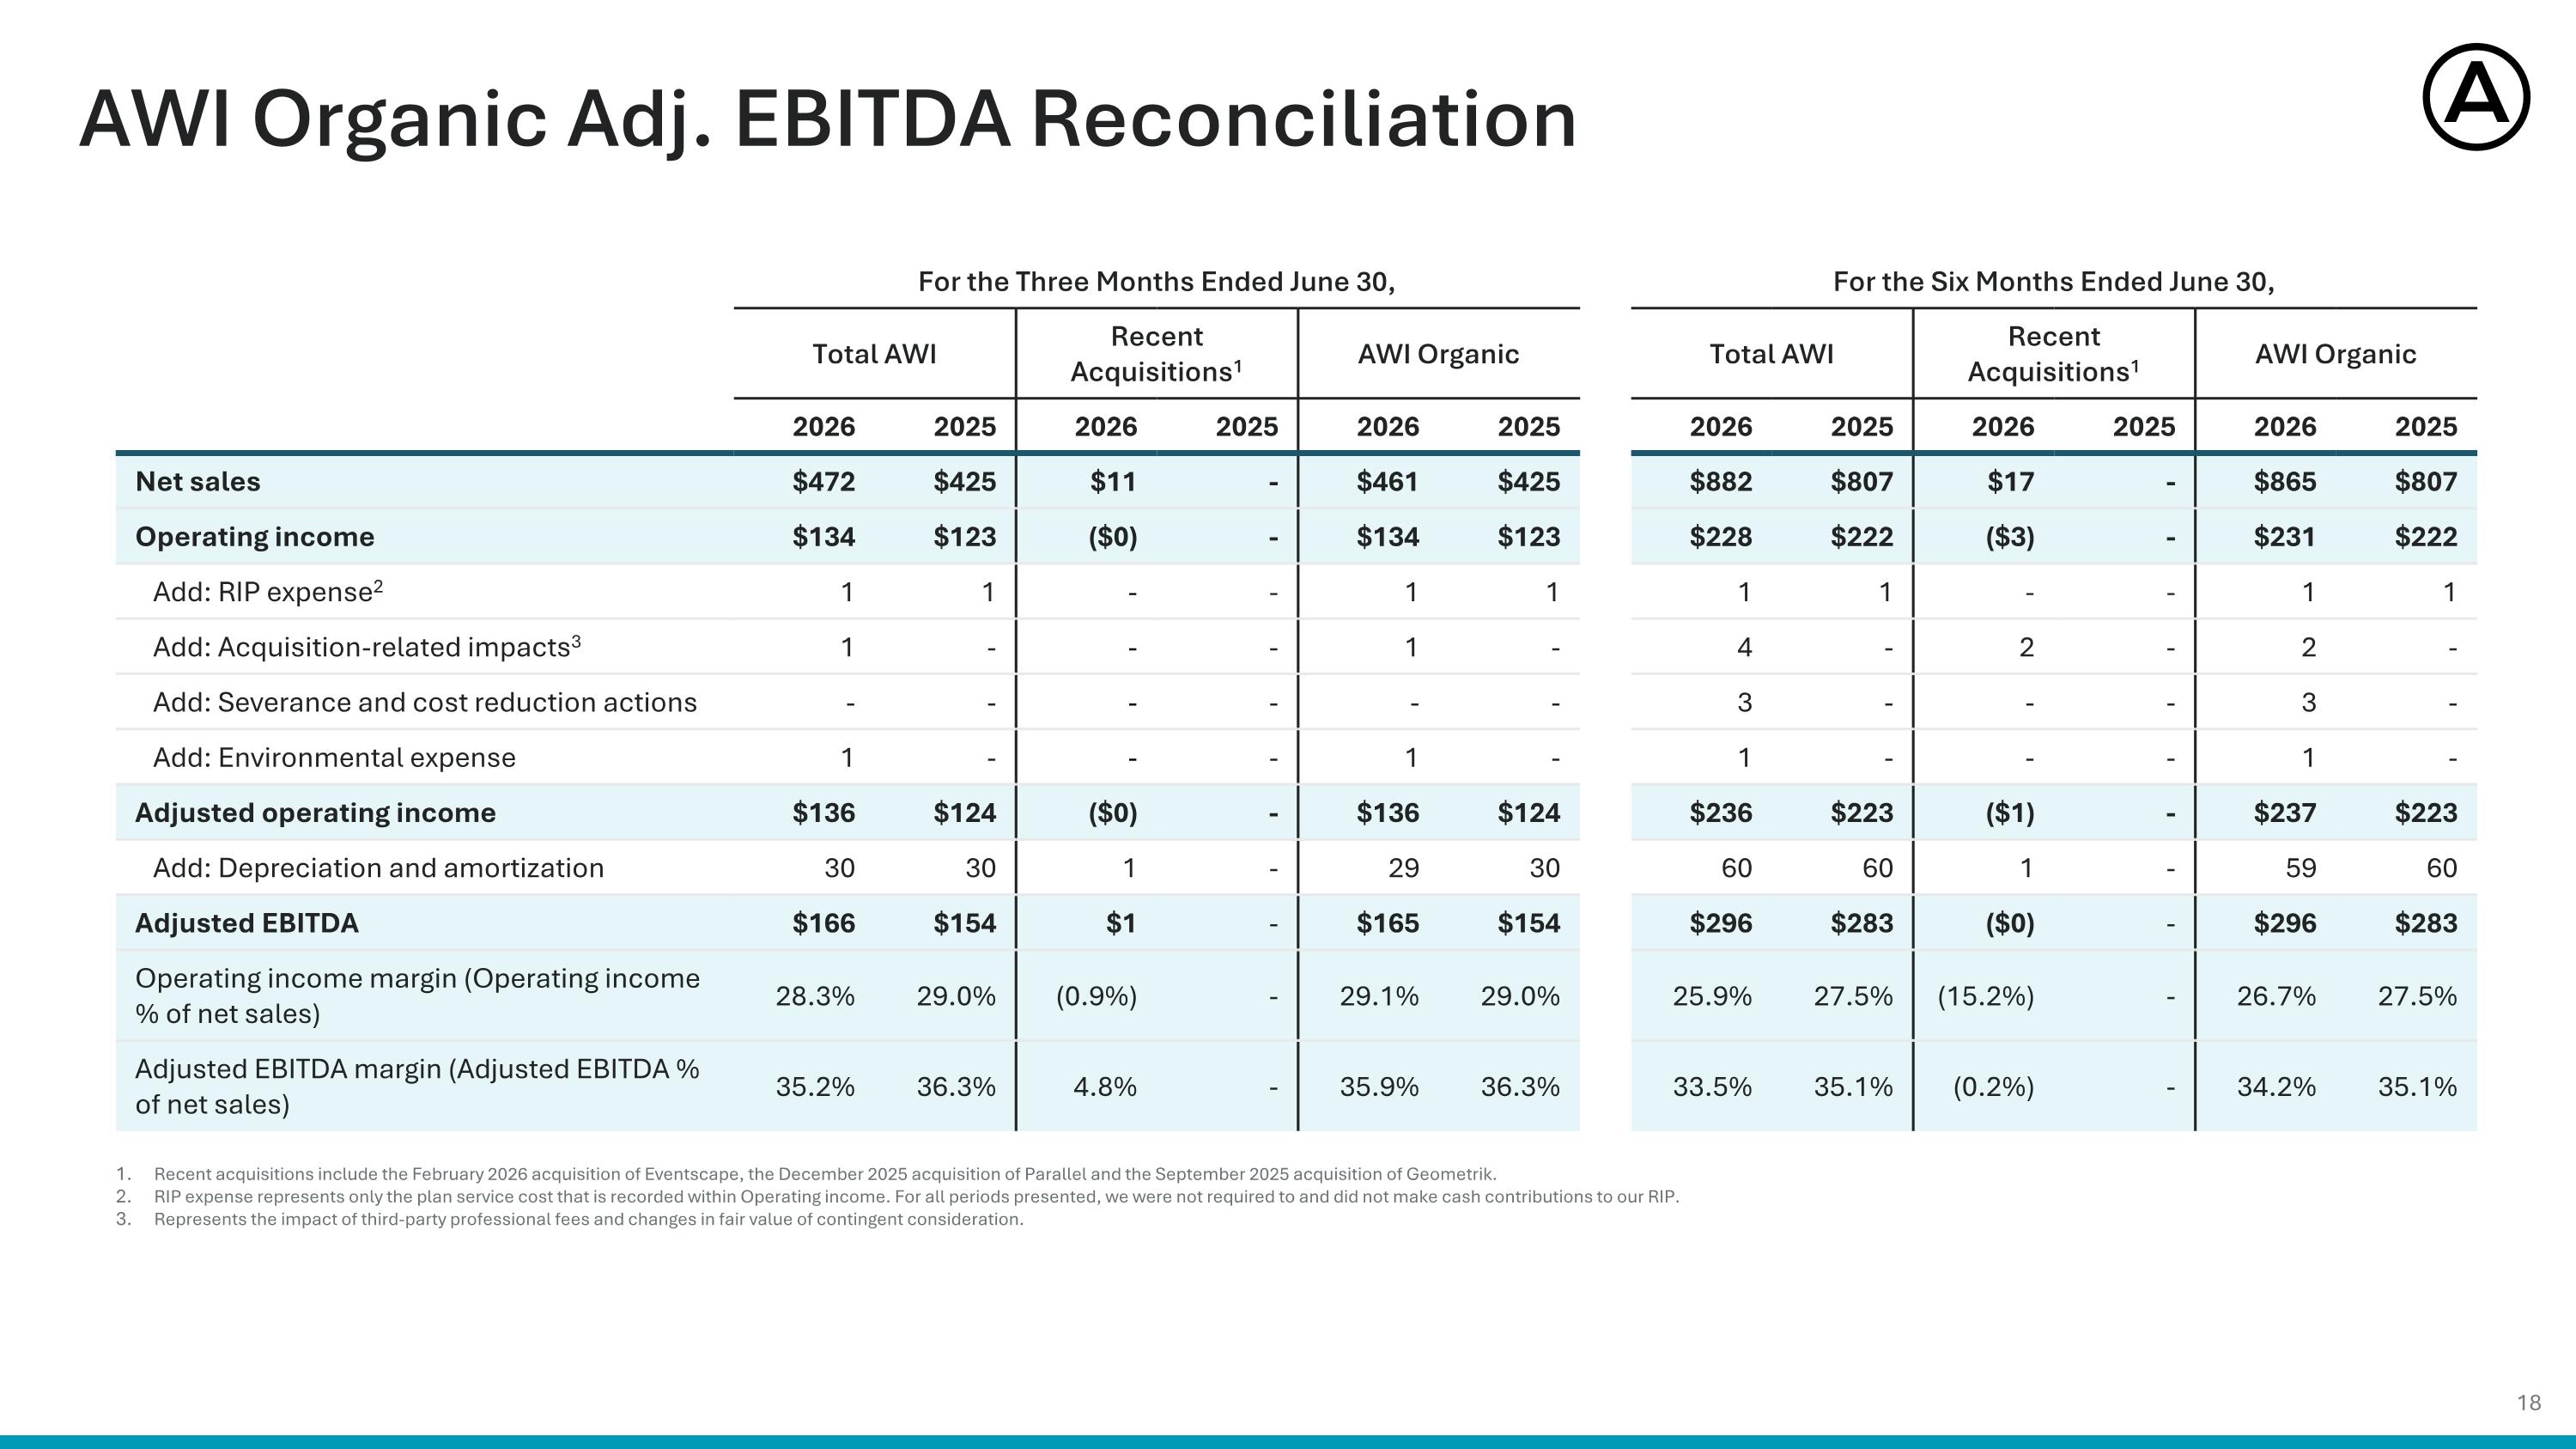
Recent acquisitions include the February 2026 acquisition of Eventscape, the December 2025 acquisition of Parallel and the September 2025 acquisition of Geometrik. RIP expense represents only the plan service cost that is recorded within Operating income. For all periods presented, we were not required to and did not make cash contributions to our RIP. Represents the impact of third-party professional fees and changes in fair value of contingent consideration. AWI Organic Adj. EBITDA Reconciliation For the Three Months Ended June 30, For the Six Months Ended June 30, Total AWI Recent Acquisitions1 AWI Organic UNALLOCATED CORPORATE Total AWI Recent Acquisitions1 AWI Organic UNALLOCATED CORPORATE 2026 2025 2026 2025 2026 2025 2026 2025 2026 2025 2026 2025 Net sales $472 $425 $11 - $461 $425 $882 $807 $17 - $865 $807 Operating income $134 $123 ($0) - $134 $123 $228 $222 ($3) - $231 $222 Add: RIP expense2 1 1 - - 1 1 1 1 - - 1 1 Add: Acquisition-related impacts3 1 - - - 1 - 4 - 2 - 2 - Add: Severance and cost reduction actions - - - - - - 3 - - - 3 - Add: Environmental expense 1 - - - 1 - 1 - - - 1 - Adjusted operating income $136 $124 ($0) - $136 $124 $236 $223 ($1) - $237 $223 Add: Depreciation and amortization 30 30 1 - 29 30 60 60 1 - 59 60 Adjusted EBITDA $166 $154 $1 - $165 $154 $296 $283 ($0) - $296 $283 Operating income margin (Operating income % of net sales) 28.3% 29.0% (0.9%) - 29.1% 29.0% 25.9% 27.5% (15.2%) - 26.7% 27.5% Adjusted EBITDA margin (Adjusted EBITDA % of net sales) 35.2% 36.3% 4.8% - 35.9% 36.3% 33.5% 35.1% (0.2%) - 34.2% 35.1%
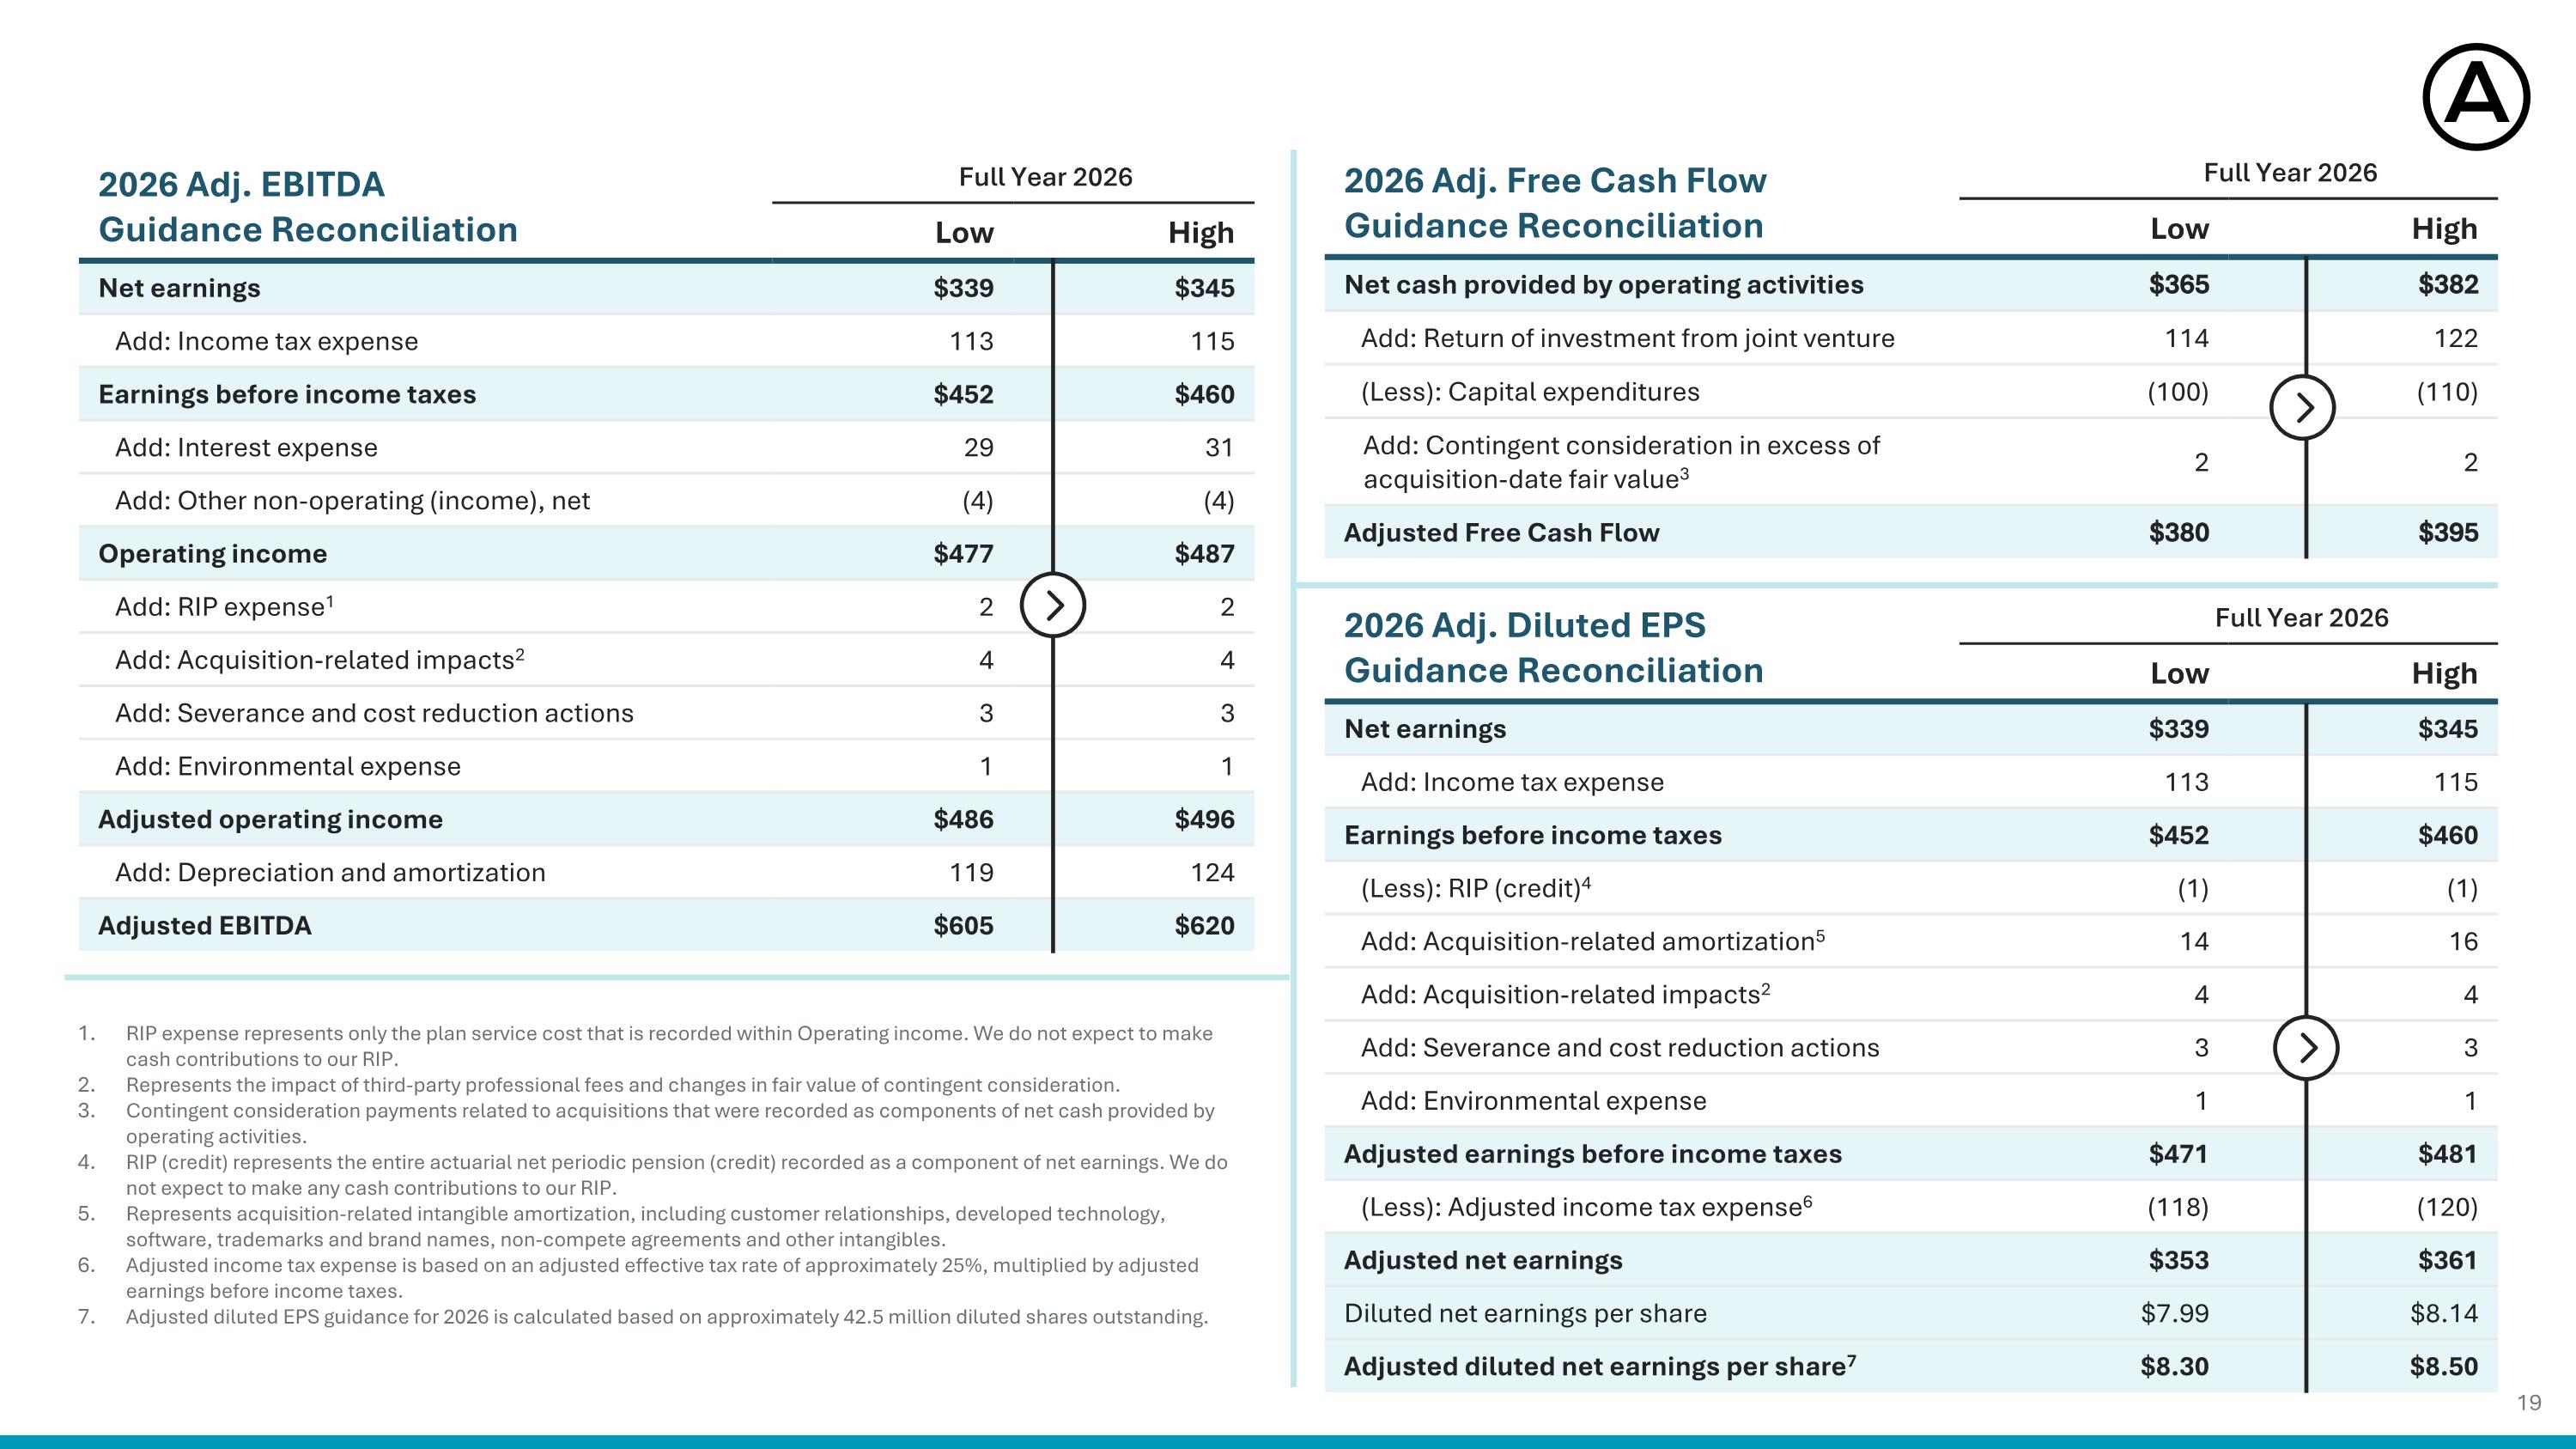
2026 Adj. EBITDA Guidance Reconciliation Full Year 2026 Low High Net earnings $339 $345 Add: Income tax expense 113 115 Earnings before income taxes $452 $460 Add: Interest expense 29 31 Add: Other non-operating (income), net (4) (4) Operating income $477 $487 Add: RIP expense1 2 2 Add: Acquisition-related impacts2 4 4 Add: Severance and cost reduction actions 3 3 Add: Environmental expense 1 1 Adjusted operating income $486 $496 Add: Depreciation and amortization 119 124 Adjusted EBITDA $605 $620 2026 Adj. Diluted EPS Guidance Reconciliation Full Year 2026 Low High Net earnings $339 $345 Add: Income tax expense 113 115 Earnings before income taxes $452 $460 (Less): RIP (credit)4 (1) (1) Add: Acquisition-related amortization5 14 16 Add: Acquisition-related impacts2 4 4 Add: Severance and cost reduction actions 3 3 Add: Environmental expense 1 1 Adjusted earnings before income taxes $471 $481 (Less): Adjusted income tax expense6 (118) (120) Adjusted net earnings $353 $361 Diluted net earnings per share $7.99 $8.14 Adjusted diluted net earnings per share7 $8.30 $8.50 2026 Adj. Free Cash Flow Guidance Reconciliation Full Year 2026 Low High Net cash provided by operating activities $365 $382 Add: Return of investment from joint venture 114 122 (Less): Capital expenditures (100) (110) Add: Contingent consideration in excess of acquisition-date fair value3 2 2 Adjusted Free Cash Flow $380 $395 RIP expense represents only the plan service cost that is recorded within Operating income. We do not expect to make cash contributions to our RIP. Represents the impact of third-party professional fees and changes in fair value of contingent consideration. Contingent consideration payments related to acquisitions that were recorded as components of net cash provided by operating activities. RIP (credit) represents the entire actuarial net periodic pension (credit) recorded as a component of net earnings. We do not expect to make any cash contributions to our RIP. Represents acquisition-related intangible amortization, including customer relationships, developed technology, software, trademarks and brand names, non-compete agreements and other intangibles. Adjusted income tax expense is based on an adjusted effective tax rate of approximately 25%, multiplied by adjusted earnings before income taxes. Adjusted diluted EPS guidance for 2026 is calculated based on approximately 42.5 million diluted shares outstanding.