Pay vs Performance Disclosure - USD ($)
Apr. 04, 2023
Mar. 31, 2026
Mar. 31, 2025
Mar. 31, 2024
Mar. 31, 2024
Required Tabular Disclosure of Pay Versus Performance
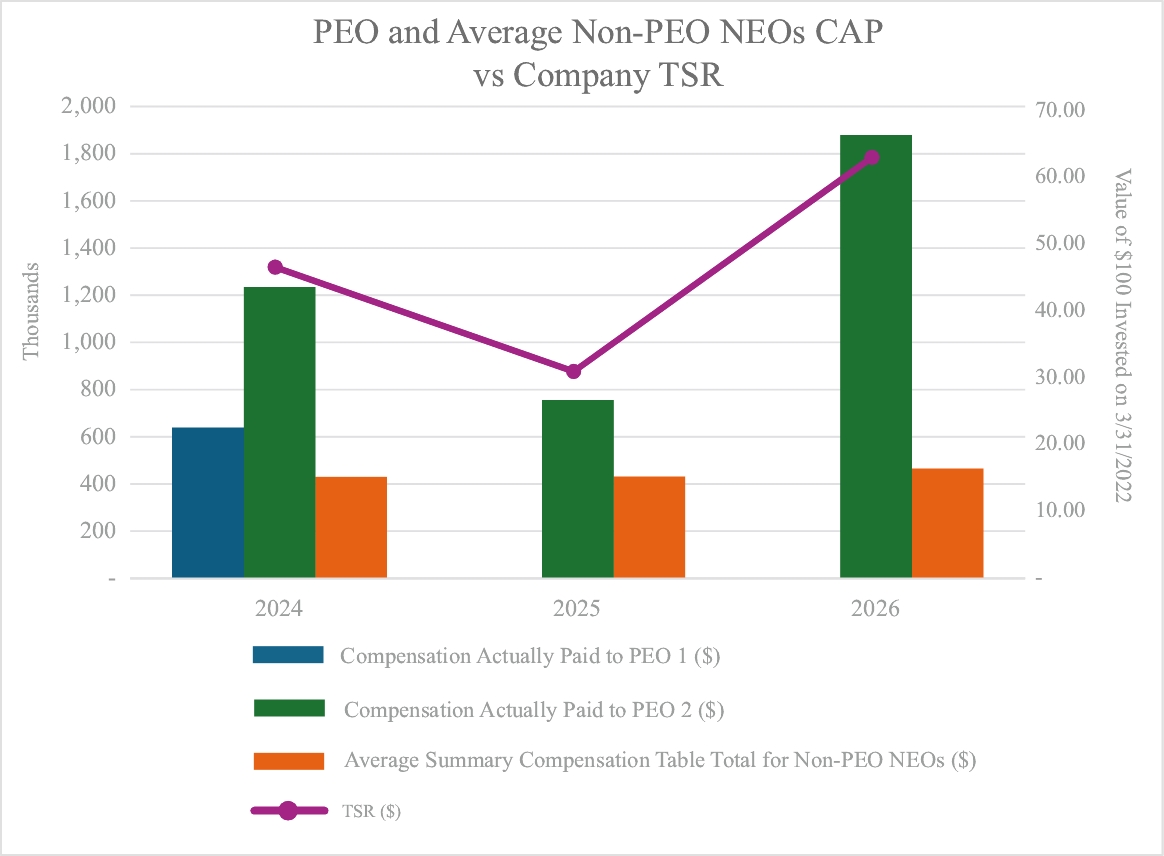
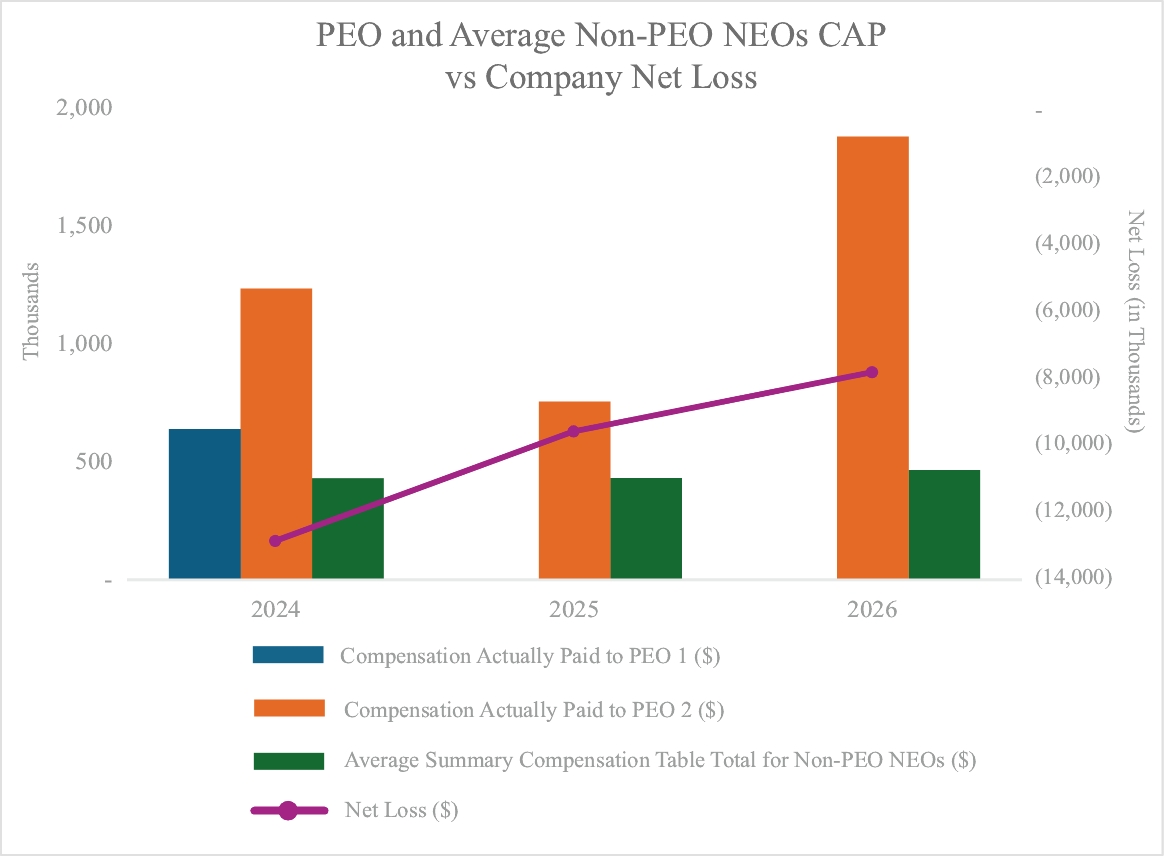
As required by Section 953(a) of the Dodd-Frank Wall Street Reform and Consumer Protection Act and Item 402(v) of Regulation S-K, we are providing the following information about the relationship between our financial performance and executive compensation actually paid. The following table sets forth information concerning Compensation Actually Paid (“CAP”) to our PEOs and non-PEO NEOs versus our total shareholder return (“TSR”) and net income (loss) performance results for the fiscal years ended March 31, 2026, 2025, and 2024. The amounts set forth below under the headings “Compensation Actually Paid to PEO” and “Average Compensation Actually Paid to Non-PEO NEOs have been calculated in a manner consistent with Item 402(v) of Regulation S-K. Use of the term CAP is required by the SEC’s rules and as a result of the calculation methodology required by the SEC, such amounts differ from compensation actually received by the individuals and the compensation decisions described in the “—Narrative to Summary Compensation Table” section above.
Year | Summary compensation table total for Former PEO(1) ($) | Compensation actually paid to Former PEO(1) ($) | Summary compensation table total for Current PEO(2) ($) | Compensation actually paid to Current PEO(2) ($) | Average summary compensation table total for non-PEO NEOs(3) ($) | Average compensation actually paid to non- PEO NEOs(3) ($) | Value of initial fixed $100 investment based on: Total shareholder return (TSR)(4) ($) | Net income (loss) ($ in 000s)(5) | ||||||||||||||||
March 31, 2026 | — | — | 1,270,820 | 1,879,396 | 465,650 | 558,596 | 63.25 | (7,793) | ||||||||||||||||
March 31, 2025 | — | — | 1,084,971 | 775,013 | 431,913 | 371,177 | 31.15 | (9,568) | ||||||||||||||||
March 31, 2024 | 639,915 | 639,915 | 997,530 | 1,234,197 | 430,145 | 720,222 | 46.79 | (12,853) | ||||||||||||||||
(1) | This column corresponds to Jan D’Alvise, who served as PEO through April 4, 2023. |
(2) | This column corresponds to Mr. Kohli, who assumed the PEO role effective April 4, 2023. |
(3) | For the fiscal year ended March 31, 2026, the non-PEO NEOs were Amresh Kumar and Carrie D’Andrea. For the fiscal year ended March 31, 2025, the non-PEO NEOs were Amresh Kumar and Carrie D’Andrea. For the fiscal year ended March 31, 2024, the non-PEO NEOs were Amresh Kumar, Carrie D’Andrea, Pierre Lemieux, and Brian Ford. |
(4) | Our TSR for each of the applicable fiscal years is calculated based on a fixed investment of $100 at the applicable measurement point (March 31, 2022) on the same cumulative basis as is used in Item 201(e) of Regulation S-K. |
(5) | Net loss is as reported in our consolidated financial statements. |
The 2026 CAP to our PEOs and the average CAP to our non-PEO NEOs reflects the following adjustments required by the applicable SEC rules from the total compensation reported in the SCT:
Current PEO ($) | Average of Non-PEO NEOs ($) | |||||
Total Reported in 2026 SCT | 1,270,820 | 465,650 | ||||
Less: value of equity award reported in the SCT | (391,820) | (52,150) | ||||
Add: year-end value of equity awards granted in 2026 that are unvested and outstanding | 586,432 | 78,052 | ||||
Add: change in fair value (from prior year-end) of prior year equity awards that are unvested and outstanding | 94,899 | 15,906 | ||||
Add: fair market value of equity awards granted in 2026 and that vested in 2026 | 152,360 | 20,279 | ||||
Add: change in fair value (from prior year-end) of prior year equity awards that vested in 2026 | 166,705 | 30,859 | ||||
Compensation Actually Paid for 2026 | 1,879,396 | 558,596 | ||||
(1) | This column corresponds to Jan D’Alvise, who served as PEO through April 4, 2023. |
(2) | This column corresponds to Mr. Kohli, who assumed the PEO role effective April 4, 2023. |
(3) | For the fiscal year ended March 31, 2026, the non-PEO NEOs were Amresh Kumar and Carrie D’Andrea. For the fiscal year ended March 31, 2025, the non-PEO NEOs were Amresh Kumar and Carrie D’Andrea. For the fiscal year ended March 31, 2024, the non-PEO NEOs were Amresh Kumar, Carrie D’Andrea, Pierre Lemieux, and Brian Ford. |
The 2026 CAP to our PEOs and the average CAP to our non-PEO NEOs reflects the following adjustments required by the applicable SEC rules from the total compensation reported in the SCT:
Current PEO ($) | Average of Non-PEO NEOs ($) | |||||
Total Reported in 2026 SCT | 1,270,820 | 465,650 | ||||
Less: value of equity award reported in the SCT | (391,820) | (52,150) | ||||
Add: year-end value of equity awards granted in 2026 that are unvested and outstanding | 586,432 | 78,052 | ||||
Add: change in fair value (from prior year-end) of prior year equity awards that are unvested and outstanding | 94,899 | 15,906 | ||||
Add: fair market value of equity awards granted in 2026 and that vested in 2026 | 152,360 | 20,279 | ||||
Add: change in fair value (from prior year-end) of prior year equity awards that vested in 2026 | 166,705 | 30,859 | ||||
Compensation Actually Paid for 2026 | 1,879,396 | 558,596 | ||||
The 2026 CAP to our PEOs and the average CAP to our non-PEO NEOs reflects the following adjustments required by the applicable SEC rules from the total compensation reported in the SCT:
Current PEO ($) | Average of Non-PEO NEOs ($) | |||||
Total Reported in 2026 SCT | 1,270,820 | 465,650 | ||||
Less: value of equity award reported in the SCT | (391,820) | (52,150) | ||||
Add: year-end value of equity awards granted in 2026 that are unvested and outstanding | 586,432 | 78,052 | ||||
Add: change in fair value (from prior year-end) of prior year equity awards that are unvested and outstanding | 94,899 | 15,906 | ||||
Add: fair market value of equity awards granted in 2026 and that vested in 2026 | 152,360 | 20,279 | ||||
Add: change in fair value (from prior year-end) of prior year equity awards that vested in 2026 | 166,705 | 30,859 | ||||
Compensation Actually Paid for 2026 | 1,879,396 | 558,596 | ||||