
Second Quarter Earnings Release Materials July 28, 2026 ARSEN KITCH President, Chief Executive Officer and Director SHERRI BAKER Senior Vice President and Chief Financial Officer
2 Forward Looking Statements Cautionary Statement Regarding Forward Looking Statements This presentation of supplemental information contains, in addition to historical information, certain “forward-looking” statements within the meaning of Section 27A of the Securities Act of 1933, as amended, and Section 21E of the Securities Exchange Act of 1934, as amended by the Private Securities Litigation Reform Act of 1995, including statements as to: our expectations regarding additional savings from our fixed cost reduction initiatives; the Company’s strategic positioning to capitalize on the paperboard industry’s cyclical nature and deliver strong returns; product demand and industry trends; assumptions for Q3 2026 and full year 2026, including operational factors, capital, input costs, lower pricing and inflation; our capital allocation priorities; our strategy, including achieving target leverage ratio and maintaining liquidity; our focus on free cash flow generation through operational efficiencies and demand; our plans to explore avenues for strategic growth opportunities, particularly to expand our own product offerings and broaden such offerings to North American customers; continued investments into our assets to strengthen our competitive advantages and maintain our long-term performance; expectations regarding the paperboard market; targeted working capital improvements; and our financial flexibility and liquidity; and repurchases under the existing share buyback authorization. These forward-looking statements are based on management’s current expectations, estimates, assumptions and projections that are subject to change. Our actual results of operations may differ materially from those expressed or implied by the forward-looking statements contained in this presentation. Important factors that could cause or contribute to such differences include the risks and uncertainties described from time to time in the Company's public filings with the Securities and Exchange Commission, including but not limited to the following: our inability to realize the expected benefits of the Augusta, Georgia paperboard manufacturing facility acquisition, including anticipated financial results, due to integration challenges or other factors; unexpected costs, charges or expenses resulting from the sale of our consumer products division (tissue business) and the related restructuring initiatives; competitive pricing pressures for our products arising from capacity additions, demand reduction and market conditions; the loss of, changes in prices for, or reduction in, orders from significant customers; changes in customer preferences, industry consolidation and vertical integration; changes in the cost and availability of wood fiber, pulp, energy, chemicals, packaging and transportation services; cyclical industry conditions and broader U.S. and global economic conditions; manufacturing or operating disruptions; labor disruptions; reliance on a limited number of suppliers and service providers; cyber-security risks; environmental liabilities and litigation, including PFAS-related claims involving our Augusta facility; our ability to execute our growth, expansion and operational efficiency initiatives and capital projects; changes in expenses, required contributions or withdrawal costs associated with our pension plans; our ability to attract and retain qualified personnel; our ability to service our debt obligations and comply with debt covenants; changes in banking relationships or credit ratings; and changes in laws, regulations or industry standards affecting our business. Forward-looking statements contained in this presentation present management’s views only as of the date of this presentation. We undertake no obligation to publicly update forward-looking statements or to retract future revisions of management's views based on events or circumstances occurring after the date of this presentation. Non-GAAP Financial Measures This presentation includes certain financial measures that are not calculated in accordance with GAAP, including Adjusted EBITDA from continuing operations. The Company’s management believes that the presentation of these financial measures provides useful information to investors because these measures are regularly used by management in assessing the Company’s performance. These financial measures should be considered in addition to results prepared in accordance with GAAP but should not be considered substitutes for or superior to GAAP results. In addition, these non-GAAP financial measures may not be comparable to similarly-titled measures utilized by other companies, since such other companies may not calculate such measure in the same manner as we do. A reconciliation of Adjusted EBITDA to the most relevant GAAP measure is available in the appendix of this presentation.
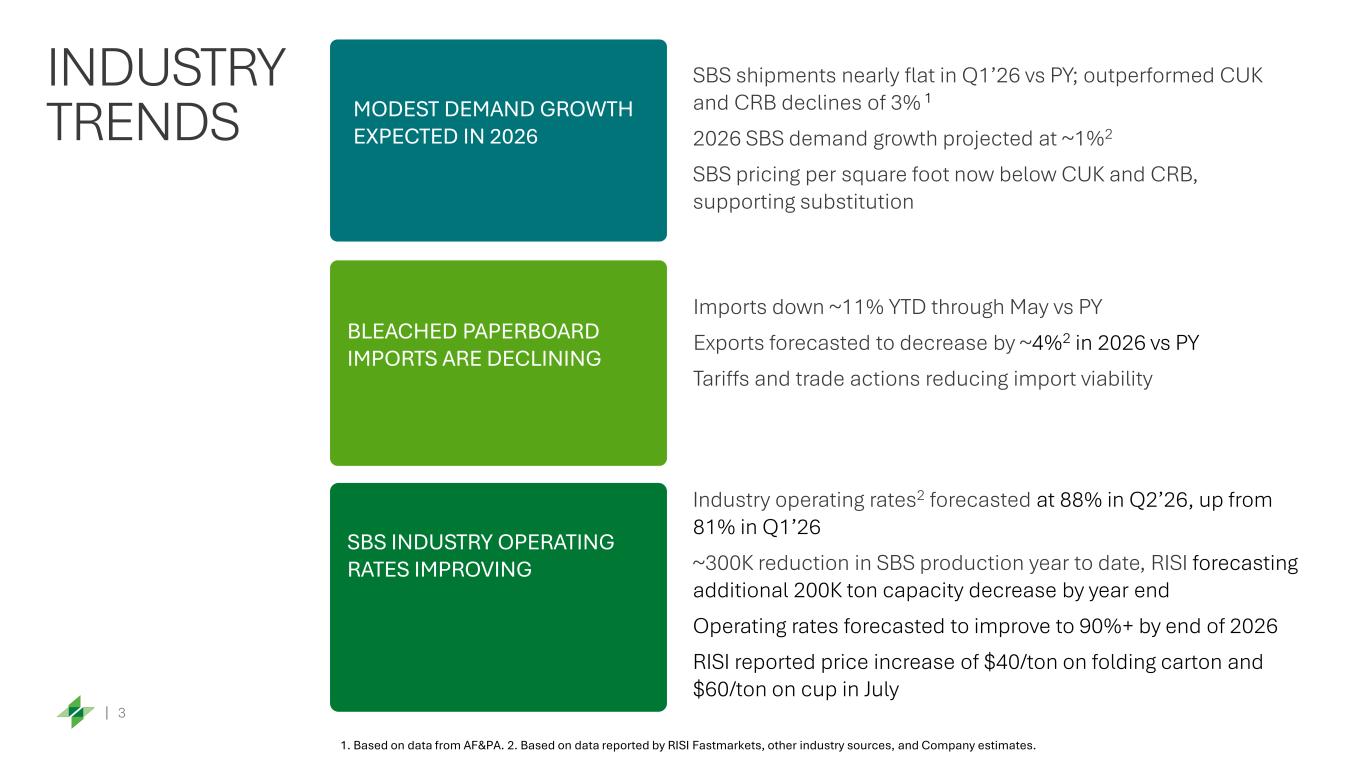
3 INDUSTRY TRENDS 1. Based on data from AF&PA. 2. Based on data reported by RISI Fastmarkets, other industry sources, and Company estimates. MODEST DEMAND GROWTH EXPECTED IN 2026 SBS shipments nearly flat in Q1’26 vs PY; outperformed CUK and CRB declines of 3% 1 2026 SBS demand growth projected at ~1%2 SBS pricing per square foot now below CUK and CRB, supporting substitution SBS INDUSTRY OPERATING RATES IMPROVING Industry operating rates2 forecasted at 88% in Q2’26, up from 81% in Q1’26 ~300K reduction in SBS production year to date, RISI forecasting additional 200K ton capacity decrease by year end Operating rates forecasted to improve to 90%+ by end of 2026 RISI reported price increase of $40/ton on folding carton and $60/ton on cup in July BLEACHED PAPERBOARD IMPORTS ARE DECLINING Imports down ~11% YTD through May vs PY Exports forecasted to decrease by ~4%2 in 2026 vs PY Tariffs and trade actions reducing import viability
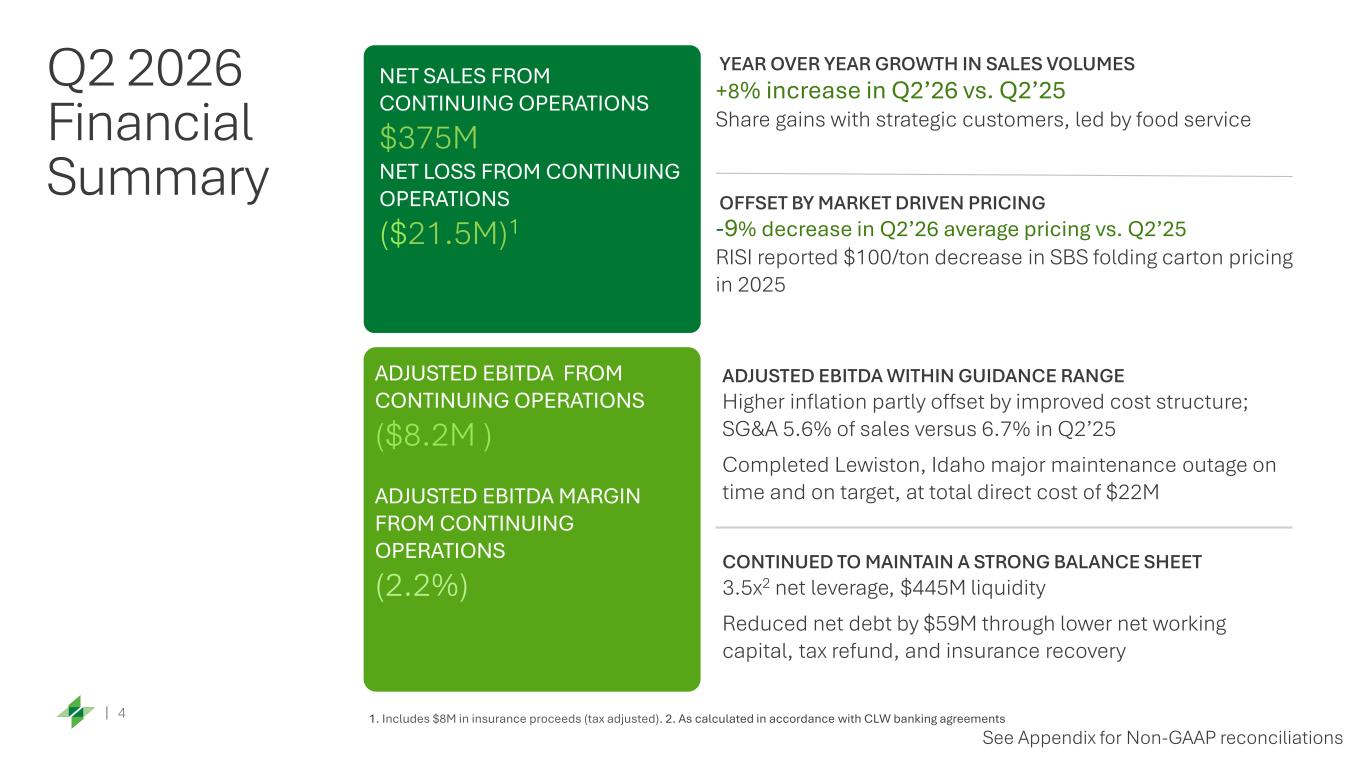
4 +8% increase in Q2’26 vs. Q2’25 Share gains with strategic customers, led by food service -9% decrease in Q2’26 average pricing vs. Q2’25 RISI reported $100/ton decrease in SBS folding carton pricing in 2025 Q2 2026 Financial Summary NET SALES FROM CONTINUING OPERATIONS $375M NET LOSS FROM CONTINUING OPERATIONS ($21.5M)1 OFFSET BY MARKET DRIVEN PRICING ADJUSTED EBITDA FROM CONTINUING OPERATIONS ($8.2M ) ADJUSTED EBITDA MARGIN FROM CONTINUING OPERATIONS (2.2%) ADJUSTED EBITDA WITHIN GUIDANCE RANGE Higher inflation partly offset by improved cost structure; SG&A 5.6% of sales versus 6.7% in Q2’25 Completed Lewiston, Idaho major maintenance outage on time and on target, at total direct cost of $22M CONTINUED TO MAINTAIN A STRONG BALANCE SHEET 3.5x2 net leverage, $445M liquidity Reduced net debt by $59M through lower net working capital, tax refund, and insurance recovery YEAR OVER YEAR GROWTH IN SALES VOLUMES See Appendix for Non-GAAP reconciliations 1. Includes $8M in insurance proceeds (tax adjusted). 2. As calculated in accordance with CLW banking agreements
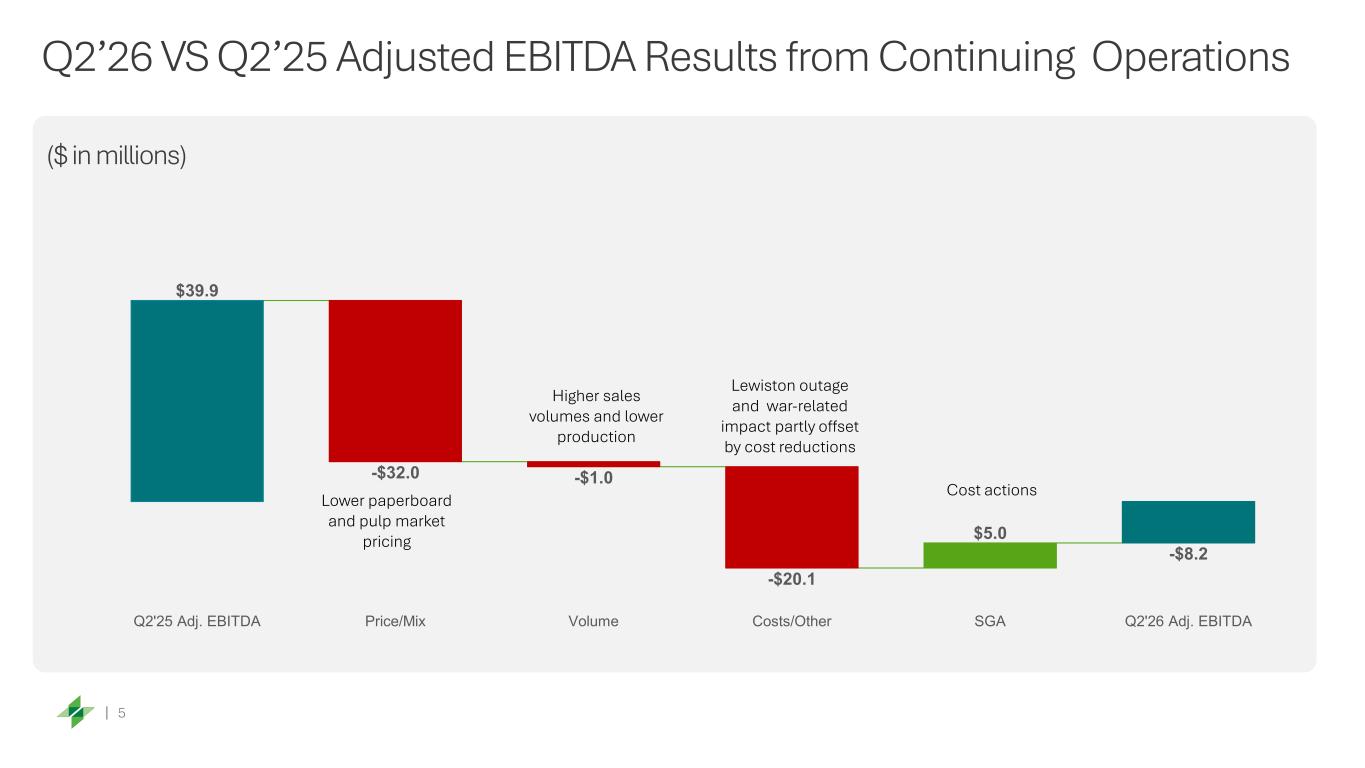
5 Q2’26 VS Q2’25 Adjusted EBITDA Results from Continuing Operations ($ in millions) $39.9 -$20.1 $5.0 -$8.2 -$32.0 -$1.0 Q2'25 Adj. EBITDA Price/Mix Volume Costs/Other SGA Q2'26 Adj. EBITDA Lower paperboard and pulp market pricing Lewiston outage and war-related impact partly offset by cost reductions Cost actions Higher sales volumes and lower production
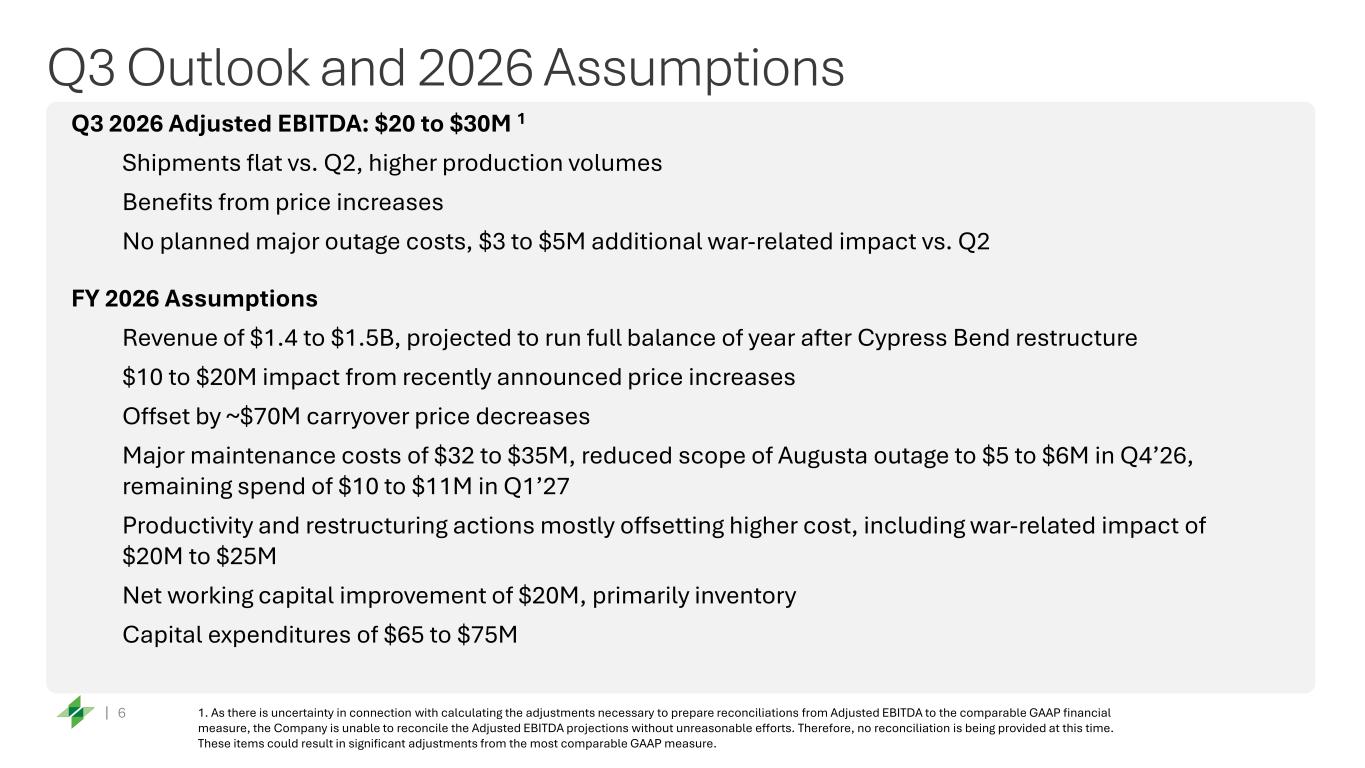
6 Q3 Outlook and 2026 Assumptions Q3 2026 Adjusted EBITDA: $20 to $30M 1 Shipments flat vs. Q2, higher production volumes Benefits from price increases No planned major outage costs, $3 to $5M additional war-related impact vs. Q2 FY 2026 Assumptions Revenue of $1.4 to $1.5B, projected to run full balance of year after Cypress Bend restructure $10 to $20M impact from recently announced price increases Offset by ~$70M carryover price decreases Major maintenance costs of $32 to $35M, reduced scope of Augusta outage to $5 to $6M in Q4’26, remaining spend of $10 to $11M in Q1’27 Productivity and restructuring actions mostly offsetting higher cost, including war-related impact of $20M to $25M Net working capital improvement of $20M, primarily inventory Capital expenditures of $65 to $75M 1. As there is uncertainty in connection with calculating the adjustments necessary to prepare reconciliations from Adjusted EBITDA to the comparable GAAP financial measure, the Company is unable to reconcile the Adjusted EBITDA projections without unreasonable efforts. Therefore, no reconciliation is being provided at this time. These items could result in significant adjustments from the most comparable GAAP measure.
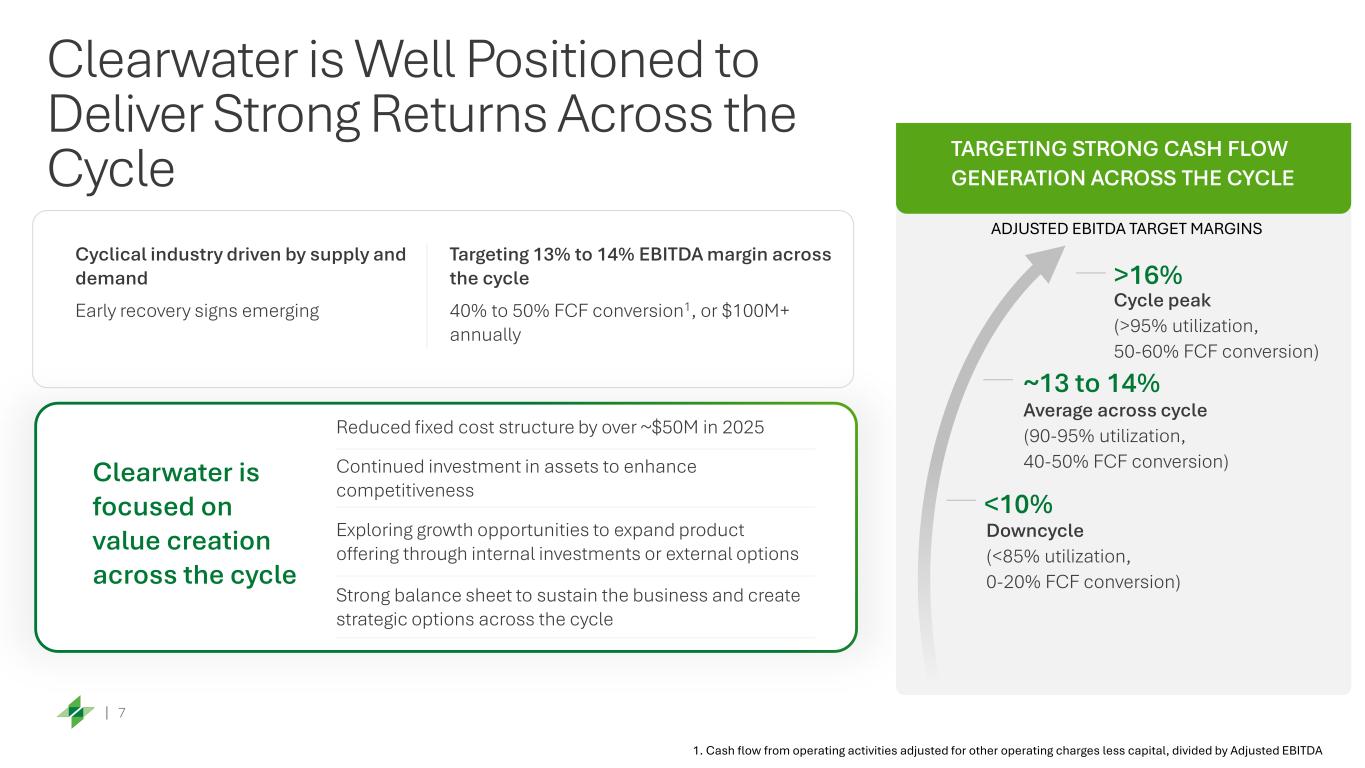
7 Clearwater is Well Positioned to Deliver Strong Returns Across the Cycle >16% Cycle peak (>95% utilization, 50-60% FCF conversion) Average across cycle (90-95% utilization, 40-50% FCF conversion) ~13 to 14% Downcycle (<85% utilization, 0-20% FCF conversion) <10% TARGETING STRONG CASH FLOW GENERATION ACROSS THE CYCLE Cyclical industry driven by supply and demand Early recovery signs emerging Targeting 13% to 14% EBITDA margin across the cycle 40% to 50% FCF conversion1, or $100M+ annually Reduced fixed cost structure by over ~$50M in 2025 Continued investment in assets to enhance competitiveness Exploring growth opportunities to expand product offering through internal investments or external options Strong balance sheet to sustain the business and create strategic options across the cycle Clearwater is focused on value creation across the cycle 1. Cash flow from operating activities adjusted for other operating charges less capital, divided by Adjusted EBITDA ADJUSTED EBITDA TARGET MARGINS
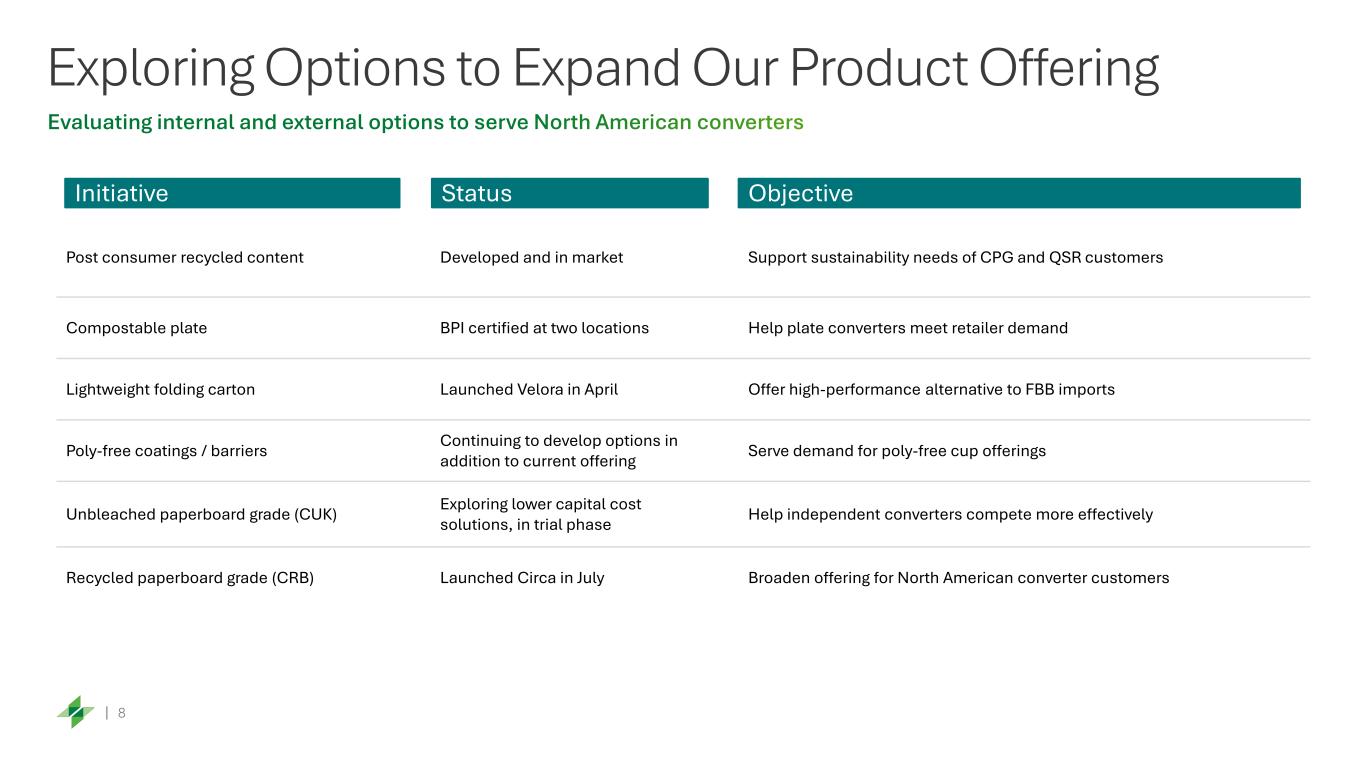
8 Exploring Options to Expand Our Product Offering Post consumer recycled content Developed and in market Support sustainability needs of CPG and QSR customers Compostable plate BPI certified at two locations Help plate converters meet retailer demand Lightweight folding carton Launched Velora in April Offer high-performance alternative to FBB imports Poly-free coatings / barriers Continuing to develop options in addition to current offering Serve demand for poly-free cup offerings Unbleached paperboard grade (CUK) Exploring lower capital cost solutions, in trial phase Help independent converters compete more effectively Recycled paperboard grade (CRB) Launched Circa in July Broaden offering for North American converter customers Initiative Status Objective
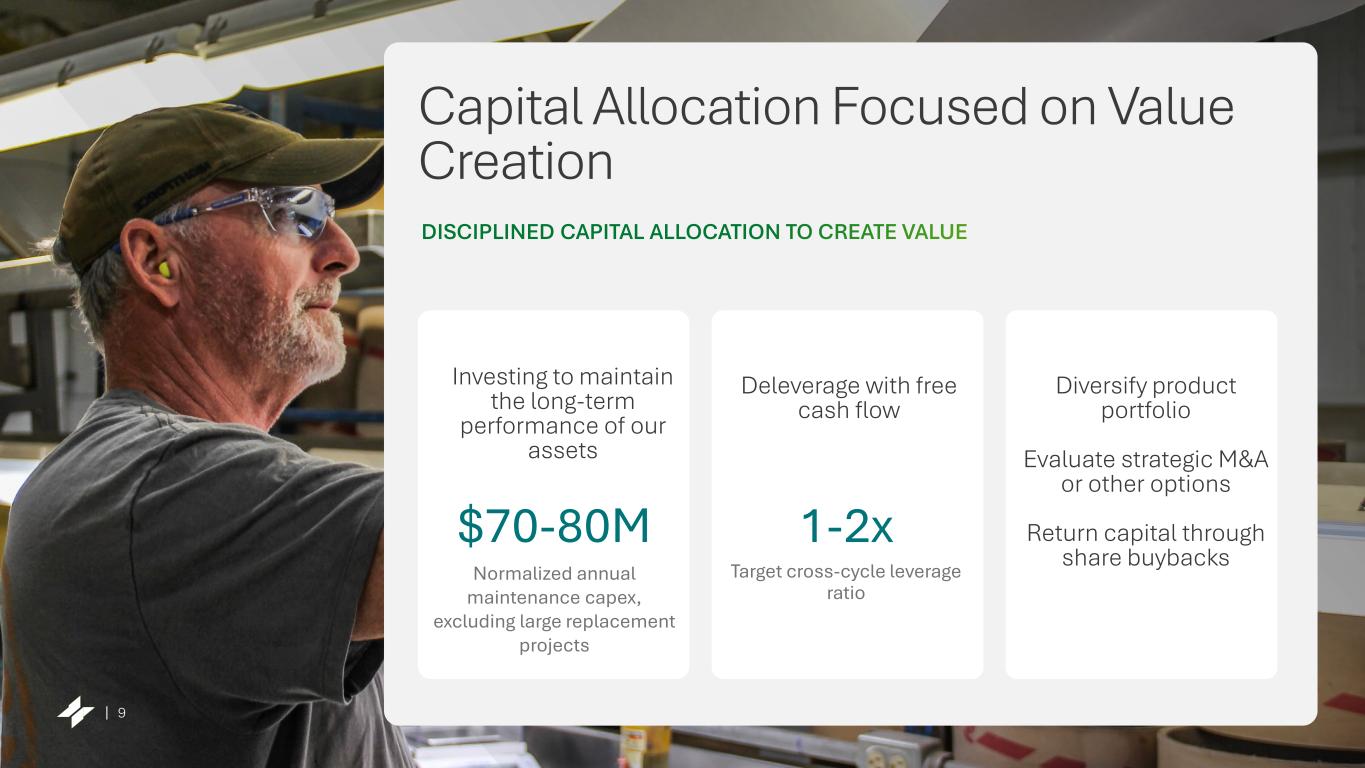
9 Capital Allocation Focused on Value Creation $70-80M Normalized annual maintenance capex, excluding large replacement projects 1-2x Target cross-cycle leverage ratio Diversify product portfolio Evaluate strategic M&A or other options Return capital through share buybacks Deleverage with free cash flow Investing to maintain the long-term performance of our assets
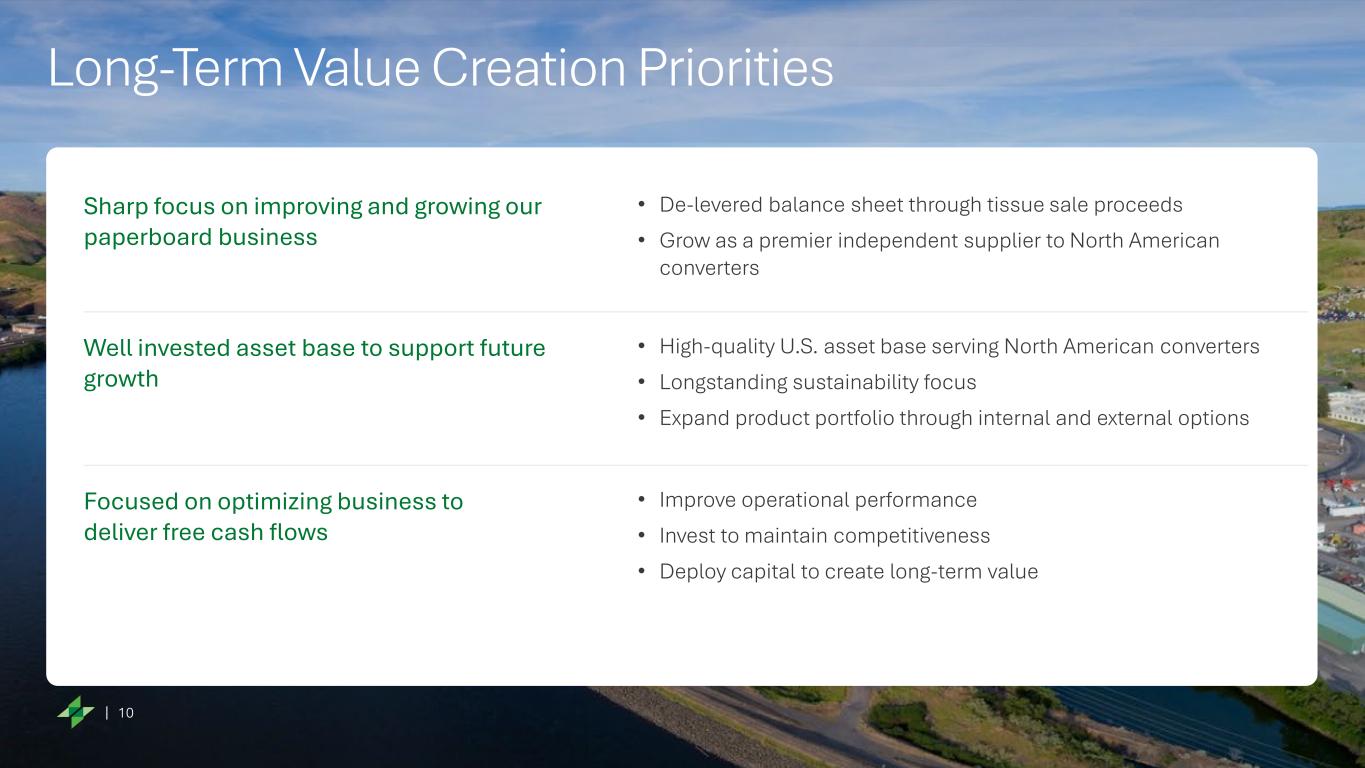
10 Long-Term Value Creation Priorities Sharp focus on improving and growing our paperboard business • De-levered balance sheet through tissue sale proceeds • Grow as a premier independent supplier to North American converters Well invested asset base to support future growth • High-quality U.S. asset base serving North American converters • Longstanding sustainability focus • Expand product portfolio through internal and external options Focused on optimizing business to deliver free cash flows • Improve operational performance • Invest to maintain competitiveness • Deploy capital to create long-term value

11 Appendix
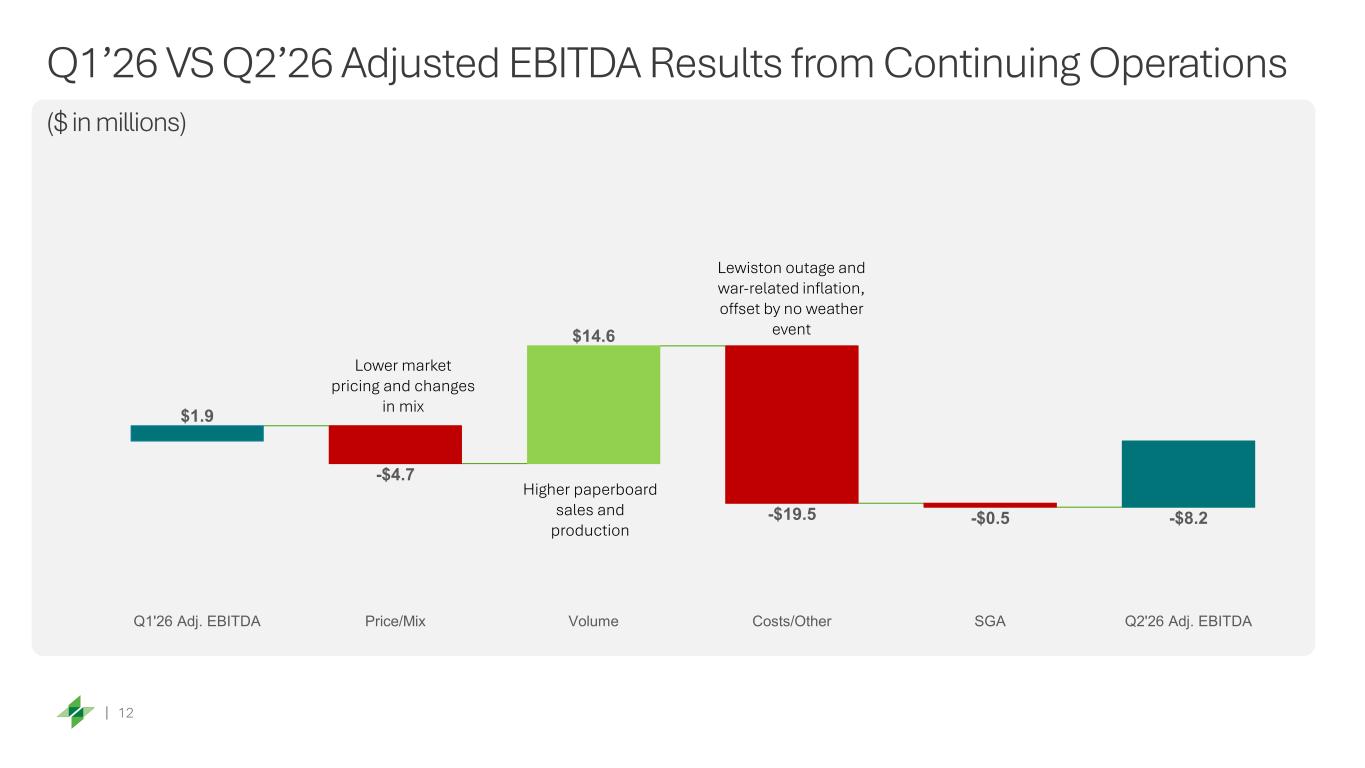
12 Q1’26 VS Q2’26 Adjusted EBITDA Results from Continuing Operations ($ in millions) $1.9 -$19.5 -$0.5 -$8.2 -$4.7 $14.6 Q1'26 Adj. EBITDA Price/Mix Volume Costs/Other SGA Q2'26 Adj. EBITDA Higher paperboard sales and production Lewiston outage and war-related inflation, offset by no weather event Lower market pricing and changes in mix
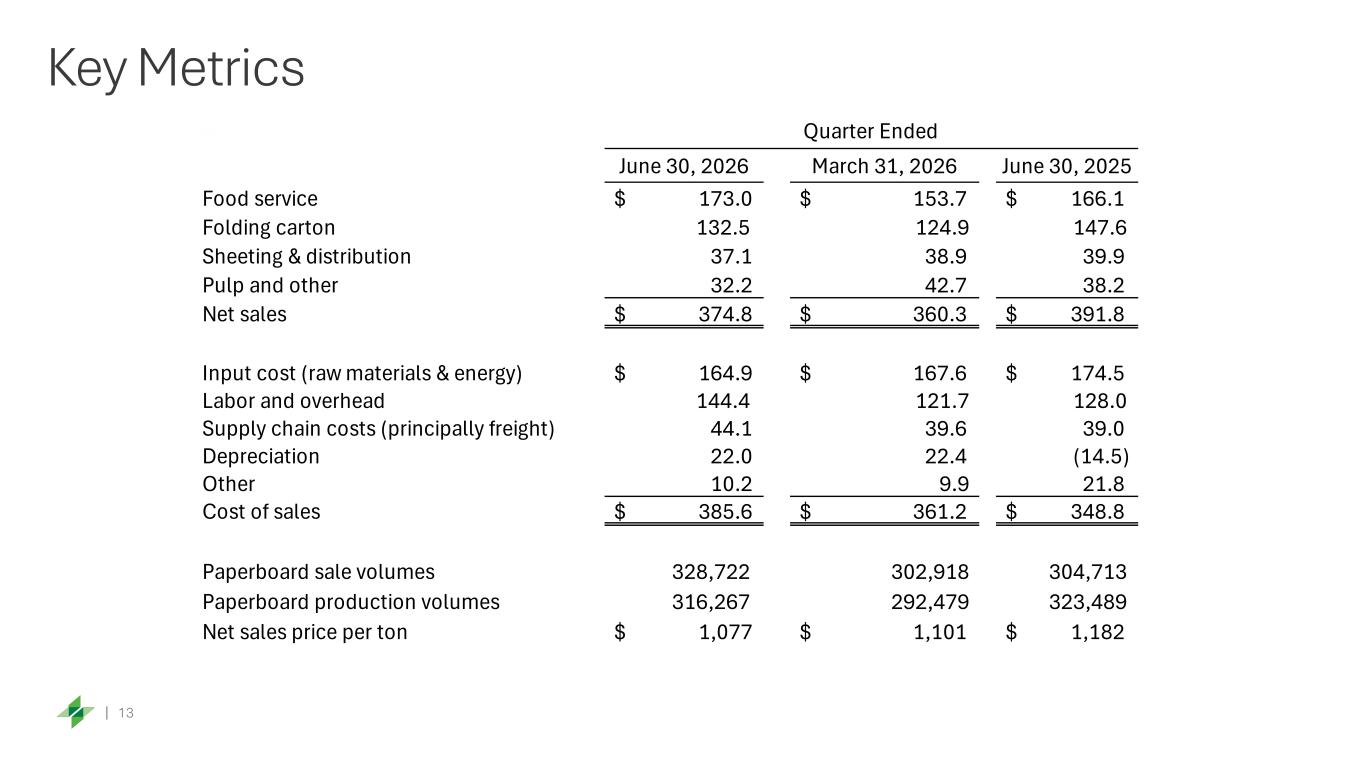
13 Key Metrics June 30, 2026 March 31, 2026 June 30, 2025 Food service $ 173.0 $ 153.7 $ 166.1 Folding carton 132.5 124.9 147.6 Sheeting & distribution 37.1 38.9 39.9 Pulp and other 32.2 42.7 38.2 Net sales $ 374.8 $ 360.3 $ 391.8 Input cost (raw materials & energy) $ 164.9 $ 167.6 $ 174.5 Labor and overhead 144.4 121.7 128.0 Supply chain costs (principally freight) 44.1 39.6 39.0 Depreciation 22.0 22.4 (14.5) Other 10.2 9.9 21.8 Cost of sales $ 385.6 $ 361.2 $ 348.8 Paperboard sale volumes 328,722 302,918 304,713 Paperboard production volumes 316,267 292,479 323,489 Net sales price per ton $ 1,077 $ 1,101 $ 1,182 Quarter Ended
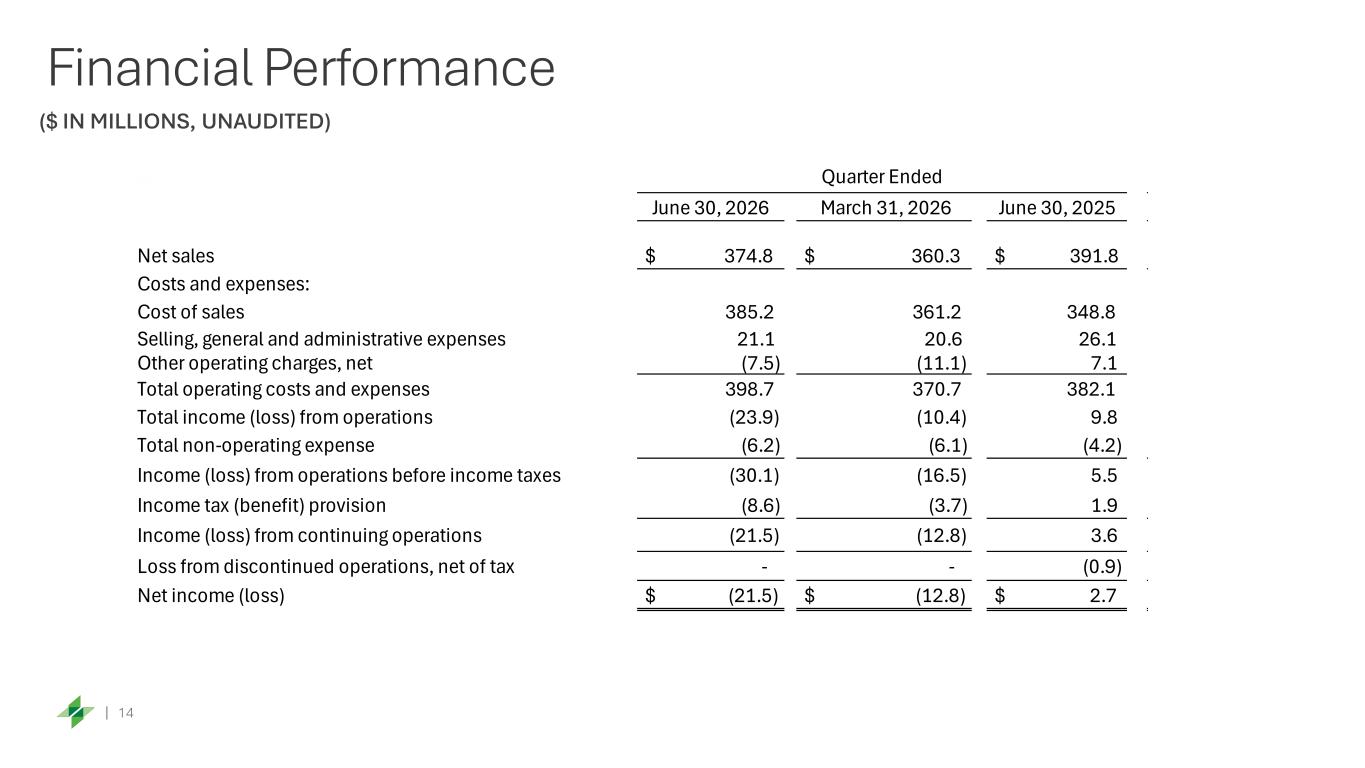
14 Financial Performance ($ IN MILLIONS, UNAUDITED) June 30, 2026 March 31, 2026 June 30, 2025 Net sales $ 374.8 $ 360.3 $ 391.8 Costs and expenses: Cost of sales 385.2 361.2 348.8 Selling, general and administrative expenses 21.1 20.6 26.1 Other operating charges, net (7.5) (11.1) 7.1 Total operating costs and expenses 398.7 370.7 382.1 Total income (loss) from operations (23.9) (10.4) 9.8 Total non-operating expense (6.2) (6.1) (4.2) Income (loss) from operations before income taxes (30.1) (16.5) 5.5 Income tax (benefit) provision (8.6) (3.7) 1.9 Income (loss) from continuing operations (21.5) (12.8) 3.6 Loss from discontinued operations, net of tax - - (0.9) Net income (loss) $ (21.5) $ (12.8) $ 2.7 Quarter Ended
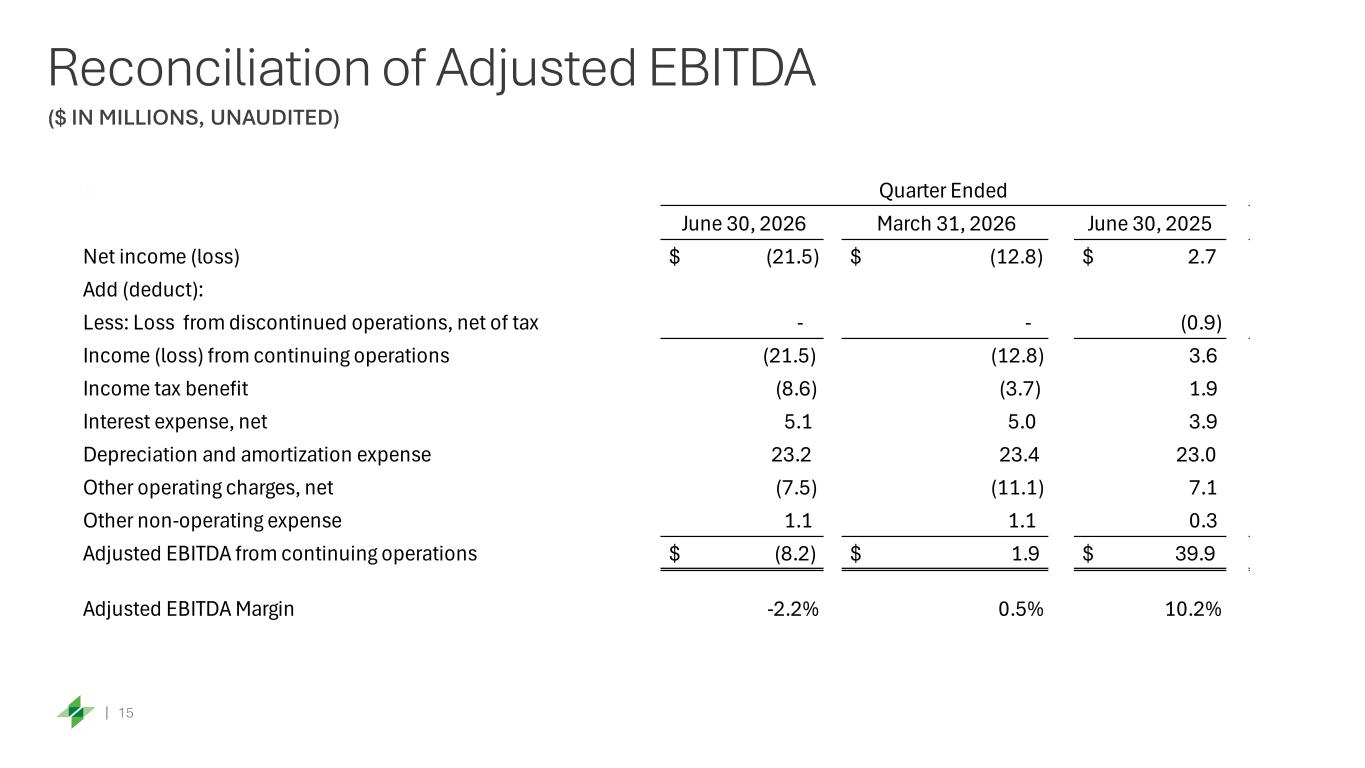
15 Reconciliation of Adjusted EBITDA ($ IN MILLIONS, UNAUDITED) June 30, 2026 March 31, 2026 June 30, 2025 Net income (loss) $ (21.5) $ (12.8) $ 2.7 Add (deduct): Less: Loss from discontinued operations, net of tax - - (0.9) Income (loss) from continuing operations (21.5) (12.8) 3.6 Income tax benefit (8.6) (3.7) 1.9 Interest expense, net 5.1 5.0 3.9 Depreciation and amortization expense 23.2 23.4 23.0 Other operating charges, net (7.5) (11.1) 7.1 Other non-operating expense 1.1 1.1 0.3 Adjusted EBITDA from continuing operations $ (8.2) $ 1.9 $ 39.9 Adjusted EBITDA Margin -2.2% 0.5% 10.2% Quarter Ended
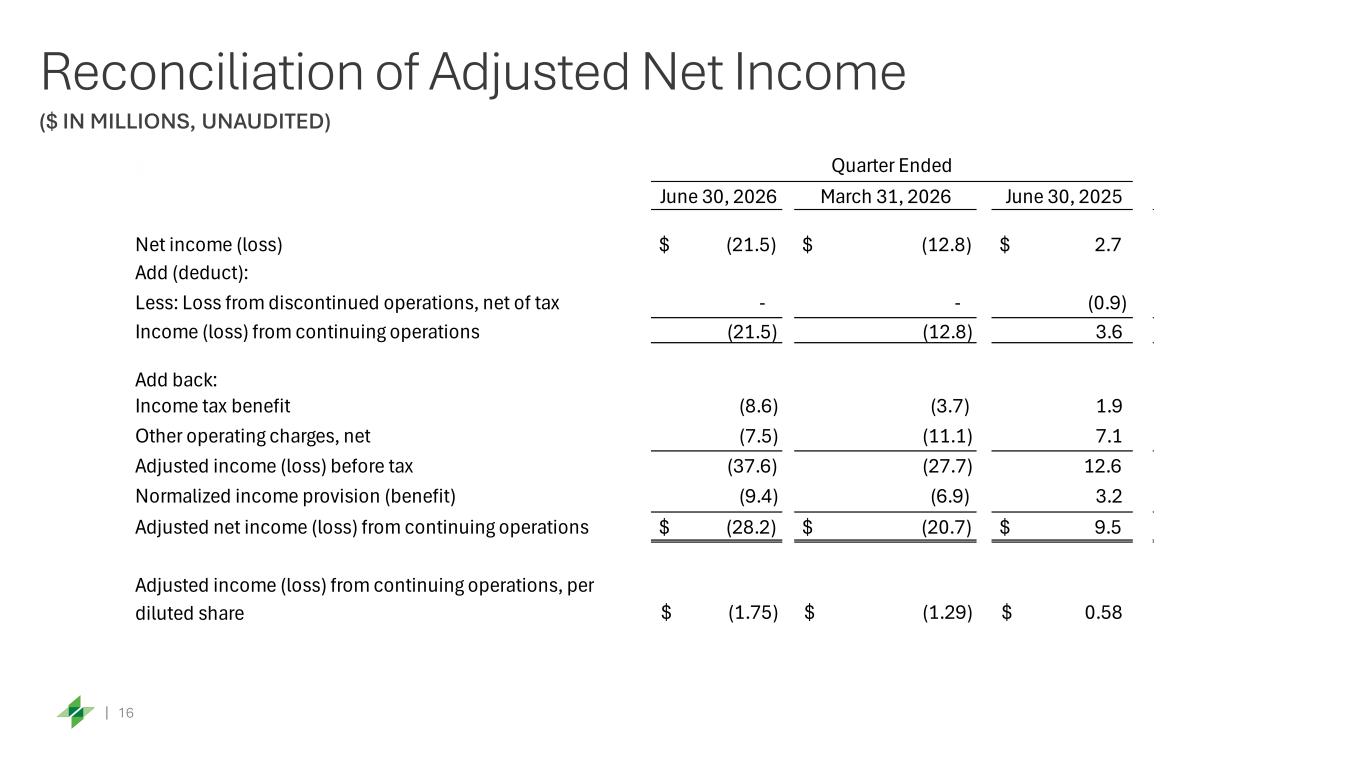
16 Reconciliation of Adjusted Net Income ($ IN MILLIONS, UNAUDITED) June 30, 2026 March 31, 2026 June 30, 2025 Net income (loss) $ (21.5) $ (12.8) $ 2.7 Add (deduct): Less: Loss from discontinued operations, net of tax - - (0.9) Income (loss) from continuing operations (21.5) (12.8) 3.6 Add back: Income tax benefit (8.6) (3.7) 1.9 Other operating charges, net (7.5) (11.1) 7.1 Adjusted income (loss) before tax (37.6) (27.7) 12.6 Normalized income provision (benefit) (9.4) (6.9) 3.2 Adjusted net income (loss) from continuing operations $ (28.2) $ (20.7) $ 9.5 Adjusted income (loss) from continuing operations, per diluted share (1.75)$ (1.29)$ 0.58$ Quarter Ended
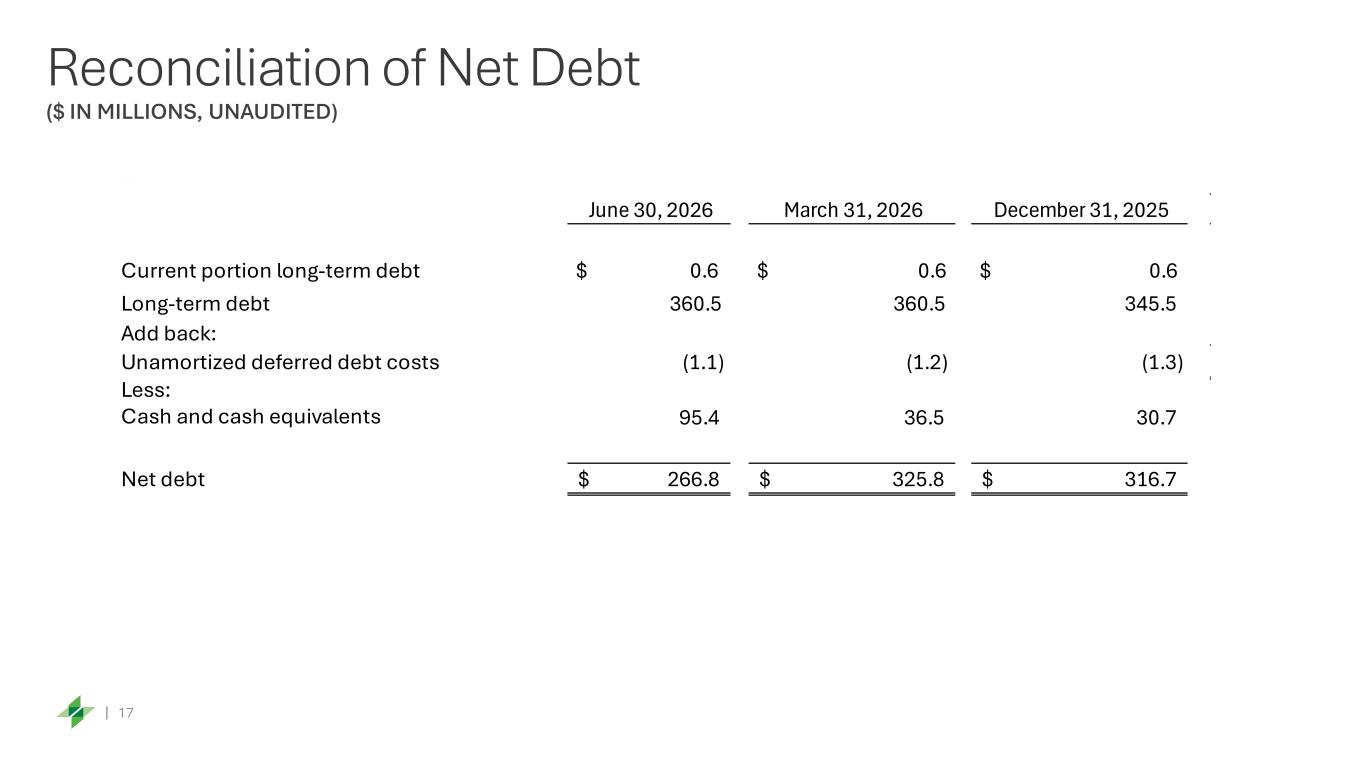
17 Reconciliation of Net Debt June 30, 2026 March 31, 2026 December 31, 2025 Current portion long-term debt $ 0.6 $ 0.6 $ 0.6 Long-term debt 360.5 360.5 345.5 Add back: Unamortized deferred debt costs (1.1) (1.2) (1.3) Less: Cash and cash equivalents 95.4 36.5 30.7 Net debt 266.8$ 325.8$ 316.7$ ($ IN MILLIONS, UNAUDITED)