Shareholder Report
May 31, 2026
USD ($)
Holding
FUND EXPENSES
What were the fund costs for the last year?
| (based on a hypothetical $10,000 investment) | ||
| Class Name | Costs of a $10,000 investment ~ | Costs paid as a percentage of a $10,000 investment ~ |
| R6 | $4 | 0.04% |
˜ Expenses are direct expenses and do not include underlying fund fees and expenses.
MANAGEMENT'S DISCUSSION OF FUND PERFORMANCE
-
For the twelve months ended May 31, 2026, Class R6 shares of the MFS Aggressive Growth Allocation Fund (fund) provided a total return of 18.03%, at net asset value. This compares with a return of 29.78% for the fund’s benchmark, the Standard & Poor's 500 Stock Index. The fund's other benchmark, the MFS Aggressive Growth Allocation Fund Blended Index (Blended Index), generated a return of 27.63%. The Blended Index reflects the blended returns of broad asset class indices, with percentage allocations to each index designed to resemble the long term strategic allocations of the fund. The market indices and related percentage allocations used to compile the Blended Index are set forth in the Fund Performance.
-
Global equity markets reached record levels during the period, withstanding considerable volatility amid tariffs, geopolitical conflict and high levels of uncertainty. A new geopolitical event distressed markets at the end of the period as US and Israeli forces launched strikes against Iran, disrupting Mideast oil and natural gas exports. During the period, a pro-growth tax and spending bill was signed into law in the US, while in Europe, renewed focus on defense and infrastructure spending brightened the economic outlook. In Japan, the election of a pro-growth prime minister sent stocks to new highs prior to the conflict in Iran. Optimism over artificial intelligence remained high.
-
Considerable progress was made in trade talks between the US and many major trading partners, with a fragile truce between the US and China extended through late 2026. While the US Supreme Court struck down part of the Trump administration’s tariff strategy, the administration began deploying other authorities to largely replace the ones that were ruled unconstitutional.
-
Early in the period, moderating inflation pressures allowed many global central banks to ease monetary policy. Amid a difficult policymaking environment and slower job growth, the Federal Reserve resumed easing policy in September and delivered quarter-point rate cuts in October and December before pausing.
-
In fixed income markets, previously range-bound global bond yields spiked following the onset of the Middle East conflict, as energy-driven inflation fears appeared to have rattled bond investors. US rate volatility (as measured by the Merrill Lynch Option Volatility Estimate (MOVE) Index) similarly rose from intra-period lows, reflecting uncertainty around the scope and duration of the conflict and its implications for global growth. However, volatility later retracted as the risk of a broader regional military escalation appeared less likely. Global credit spreads widened only modestly before stabilizing near prior levels, supported by strong demand and resilient underlying fundamentals.
-
Top contributors to performance relative to the Blended Index:
-
Within the international equity segment, style selection contributed positively as exposure to emerging markets, value, growth, and small/mid-cap international strategies benefited relative performance.
-
-
Top detractors from performance relative to the Blended Index:
-
Within the U.S. equity segment, lagging relative performance across the majority of the strategies weighed on relative results as the funds generally underperformed their respective benchmarks. Style selection also held back relative performance as mid-cap strategies underperformed the broader index.
-
Within the international equity segment, relative performance of the MFS International Growth Fund, MFS International New Discovery Fund, and MFS Research International Fund held back performance as the funds lagged their respective benchmarks.
-
FUND PERFORMANCE
The fund’s past performance is not a good predictor of the fund’s future performance. The graph and table below do not reflect the deduction of taxes that a shareholder would pay on fund distributions or the redemption of fund shares. The graph and table below assume reinvestment of dividends and capital gain distributions.
Growth of a Hypothetical $10,000 Investment*
This graph shows the performance of a hypothetical $10,000 investment in Class R6 over a ten year period or since inception, if shorter, in comparison to (i) a broad measure of market performance and (ii) an additional index that MFS believes more closely reflects the market segments in which the fund invests.
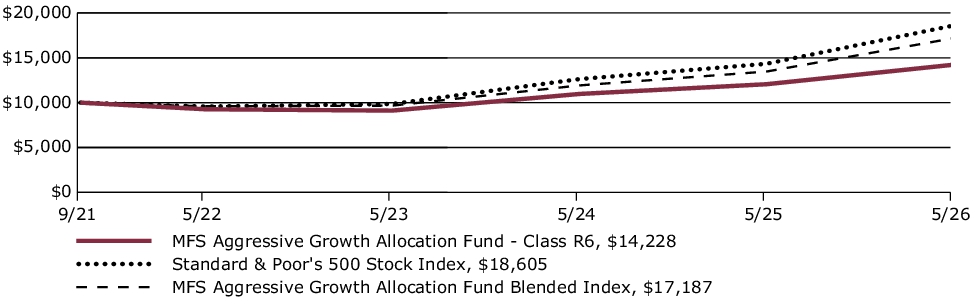
Average Annual Total Returns through 5/31/26
This table shows the average annual total returns of the class of shares noted for the periods shown, both with (if any) and without sales charges. It also shows the average annual total returns of (i) a broad measure of market performance and (ii) an additional index that MFS believes more closely reflects the market segments in which the fund invests, over the same periods.
| Share Class | 1-yr | Life* |
| R6 without sales charge | 18.03% | 7.84% |
| Comparative Benchmark(s) | ||
| Standard & Poor's 500 Stock Index ∆ | 29.78% | 14.21% |
| MFS Aggressive Growth Allocation Fund Blended Index ∆ | 27.63% | 12.29% |
|
*
|
For the period from the commencement of the class's investment operations, September 30, 2021 through May 31, 2026.
|
|
∆
|
Source: FactSet Research Systems Inc.
|
Visit mfs.com/perf/r6 for more recent performance information.
FUND STATISTICS AS OF 5/31/26
| Net Assets ($): | 3,074,453,688 | Total Management Fee ($)#: | 0 | |
| Total Number of Holdings: | 16 | Portfolio Turnover Rate (%): | 1 |
# The fund itself does not pay a management fee but the underlying funds in which the fund invests do pay management fees to MFS.
PORTFOLIO COMPOSITION (BASED ON TOTAL INVESTMENTS AS OF 5/31/26)
Portfolio allocation
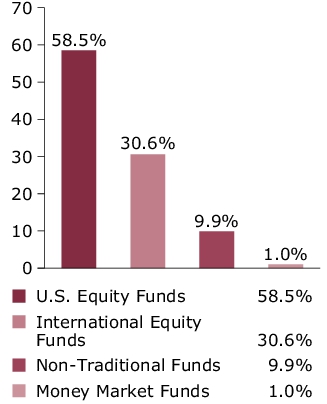
Portfolio holdings
| MFS Value Fund | 11.8% |
| MFS Growth Fund | 11.4% |
| MFS Research Fund | 10.4% |
| MFS Mid Cap Value Fund | 10.0% |
| MFS Mid Cap Growth Fund | 9.9% |
| MFS Research International Fund | 8.2% |
| MFS International Large Cap Value Fund | 5.1% |
| MFS International Intrinsic Equity Fund | 5.1% |
| MFS International Growth Fund | 5.0% |
| MFS Global Real Estate Fund | 5.0% |
| MFS Commodity Strategy Fund | 4.9% |
| MFS International New Discovery Fund | 4.1% |
| MFS Emerging Markets Equity Fund | 3.1% |
| MFS New Discovery Fund | 2.5% |
| MFS New Discovery Value Fund | 2.5% |
| MFS Institutional Money Market Portfolio | 1.0% |
FUND EXPENSES
What were the fund costs for the last year?
| (based on a hypothetical $10,000 investment) | ||
| Class Name | Costs of a $10,000 investment ~ | Costs paid as a percentage of a $10,000 investment ~ |
| R4 | $13 | 0.12% |
˜ Expenses are direct expenses and do not include underlying fund fees and expenses.
MANAGEMENT'S DISCUSSION OF FUND PERFORMANCE
-
For the twelve months ended May 31, 2026, Class R4 shares of the MFS Aggressive Growth Allocation Fund (fund) provided a total return of 17.94%, at net asset value. This compares with a return of 29.78% for the fund’s benchmark, the Standard & Poor's 500 Stock Index. The fund's other benchmark, the MFS Aggressive Growth Allocation Fund Blended Index (Blended Index), generated a return of 27.63%. The Blended Index reflects the blended returns of broad asset class indices, with percentage allocations to each index designed to resemble the long term strategic allocations of the fund. The market indices and related percentage allocations used to compile the Blended Index are set forth in the Fund Performance.
-
Global equity markets reached record levels during the period, withstanding considerable volatility amid tariffs, geopolitical conflict and high levels of uncertainty. A new geopolitical event distressed markets at the end of the period as US and Israeli forces launched strikes against Iran, disrupting Mideast oil and natural gas exports. During the period, a pro-growth tax and spending bill was signed into law in the US, while in Europe, renewed focus on defense and infrastructure spending brightened the economic outlook. In Japan, the election of a pro-growth prime minister sent stocks to new highs prior to the conflict in Iran. Optimism over artificial intelligence remained high.
-
Considerable progress was made in trade talks between the US and many major trading partners, with a fragile truce between the US and China extended through late 2026. While the US Supreme Court struck down part of the Trump administration’s tariff strategy, the administration began deploying other authorities to largely replace the ones that were ruled unconstitutional.
-
Early in the period, moderating inflation pressures allowed many global central banks to ease monetary policy. Amid a difficult policymaking environment and slower job growth, the Federal Reserve resumed easing policy in September and delivered quarter-point rate cuts in October and December before pausing.
-
In fixed income markets, previously range-bound global bond yields spiked following the onset of the Middle East conflict, as energy-driven inflation fears appeared to have rattled bond investors. US rate volatility (as measured by the Merrill Lynch Option Volatility Estimate (MOVE) Index) similarly rose from intra-period lows, reflecting uncertainty around the scope and duration of the conflict and its implications for global growth. However, volatility later retracted as the risk of a broader regional military escalation appeared less likely. Global credit spreads widened only modestly before stabilizing near prior levels, supported by strong demand and resilient underlying fundamentals.
-
Top contributors to performance relative to the Blended Index:
-
Within the international equity segment, style selection contributed positively as exposure to emerging markets, value, growth, and small/mid-cap international strategies benefited relative performance.
-
-
Top detractors from performance relative to the Blended Index:
-
Within the U.S. equity segment, lagging relative performance across the majority of the strategies weighed on relative results as the funds generally underperformed their respective benchmarks. Style selection also held back relative performance as mid-cap strategies underperformed the broader index.
-
Within the international equity segment, relative performance of the MFS International Growth Fund, MFS International New Discovery Fund, and MFS Research International Fund held back performance as the funds lagged their respective benchmarks.
-
FUND PERFORMANCE
The fund’s past performance is not a good predictor of the fund’s future performance. The graph and table below do not reflect the deduction of taxes that a shareholder would pay on fund distributions or the redemption of fund shares. The graph and table below assume reinvestment of dividends and capital gain distributions.
Growth of a Hypothetical $10,000 Investment
This graph shows the performance of a hypothetical $10,000 investment in Class R4 over a ten year period or since inception, if shorter, in comparison to (i) a broad measure of market performance and (ii) an additional index that MFS believes more closely reflects the market segments in which the fund invests.
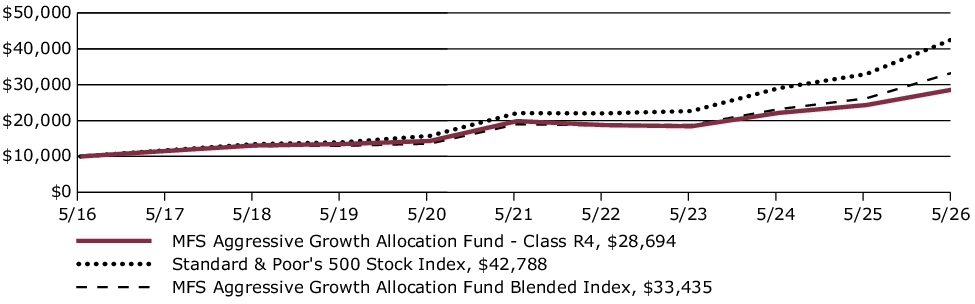
Average Annual Total Returns through 5/31/26
This table shows the average annual total returns of the class of shares noted for the periods shown, both with (if any) and without sales charges. It also shows the average annual total returns of (i) a broad measure of market performance and (ii) an additional index that MFS believes more closely reflects the market segments in which the fund invests, over the same periods.
| Share Class | 1-yr | 5-yr | 10-yr |
| R4 without sales charge | 17.94% | 7.64% | 11.12% |
| Comparative Benchmark(s) | |||
| Standard & Poor's 500 Stock Index ∆ | 29.78% | 14.15% | 15.65% |
| MFS Aggressive Growth Allocation Fund Blended Index ∆ | 27.63% | 11.98% | 12.83% |
|
∆
|
Source: FactSet Research Systems Inc.
|
Visit mfs.com/perf/r4 for more recent performance information.
FUND STATISTICS AS OF 5/31/26
| Net Assets ($): | 3,074,453,688 | Total Management Fee ($)#: | 0 | |
| Total Number of Holdings: | 16 | Portfolio Turnover Rate (%): | 1 |
# The fund itself does not pay a management fee but the underlying funds in which the fund invests do pay management fees to MFS.
PORTFOLIO COMPOSITION (BASED ON TOTAL INVESTMENTS AS OF 5/31/26)
Portfolio allocation
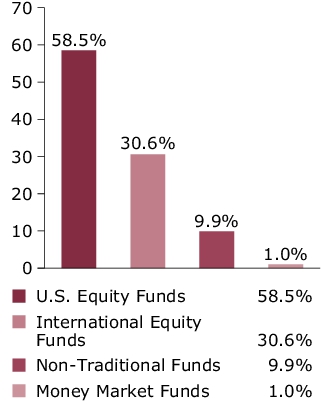
Portfolio holdings
| MFS Value Fund | 11.8% |
| MFS Growth Fund | 11.4% |
| MFS Research Fund | 10.4% |
| MFS Mid Cap Value Fund | 10.0% |
| MFS Mid Cap Growth Fund | 9.9% |
| MFS Research International Fund | 8.2% |
| MFS International Large Cap Value Fund | 5.1% |
| MFS International Intrinsic Equity Fund | 5.1% |
| MFS International Growth Fund | 5.0% |
| MFS Global Real Estate Fund | 5.0% |
| MFS Commodity Strategy Fund | 4.9% |
| MFS International New Discovery Fund | 4.1% |
| MFS Emerging Markets Equity Fund | 3.1% |
| MFS New Discovery Fund | 2.5% |
| MFS New Discovery Value Fund | 2.5% |
| MFS Institutional Money Market Portfolio | 1.0% |
FUND EXPENSES
What were the fund costs for the last year?
| (based on a hypothetical $10,000 investment) | ||
| Class Name | Costs of a $10,000 investment ~ | Costs paid as a percentage of a $10,000 investment ~ |
| R3 | $40 | 0.37% |
˜ Expenses are direct expenses and do not include underlying fund fees and expenses.
MANAGEMENT'S DISCUSSION OF FUND PERFORMANCE
-
For the twelve months ended May 31, 2026, Class R3 shares of the MFS Aggressive Growth Allocation Fund (fund) provided a total return of 17.62%, at net asset value. This compares with a return of 29.78% for the fund’s benchmark, the Standard & Poor's 500 Stock Index. The fund's other benchmark, the MFS Aggressive Growth Allocation Fund Blended Index (Blended Index), generated a return of 27.63%. The Blended Index reflects the blended returns of broad asset class indices, with percentage allocations to each index designed to resemble the long term strategic allocations of the fund. The market indices and related percentage allocations used to compile the Blended Index are set forth in the Fund Performance.
-
Global equity markets reached record levels during the period, withstanding considerable volatility amid tariffs, geopolitical conflict and high levels of uncertainty. A new geopolitical event distressed markets at the end of the period as US and Israeli forces launched strikes against Iran, disrupting Mideast oil and natural gas exports. During the period, a pro-growth tax and spending bill was signed into law in the US, while in Europe, renewed focus on defense and infrastructure spending brightened the economic outlook. In Japan, the election of a pro-growth prime minister sent stocks to new highs prior to the conflict in Iran. Optimism over artificial intelligence remained high.
-
Considerable progress was made in trade talks between the US and many major trading partners, with a fragile truce between the US and China extended through late 2026. While the US Supreme Court struck down part of the Trump administration’s tariff strategy, the administration began deploying other authorities to largely replace the ones that were ruled unconstitutional.
-
Early in the period, moderating inflation pressures allowed many global central banks to ease monetary policy. Amid a difficult policymaking environment and slower job growth, the Federal Reserve resumed easing policy in September and delivered quarter-point rate cuts in October and December before pausing.
-
In fixed income markets, previously range-bound global bond yields spiked following the onset of the Middle East conflict, as energy-driven inflation fears appeared to have rattled bond investors. US rate volatility (as measured by the Merrill Lynch Option Volatility Estimate (MOVE) Index) similarly rose from intra-period lows, reflecting uncertainty around the scope and duration of the conflict and its implications for global growth. However, volatility later retracted as the risk of a broader regional military escalation appeared less likely. Global credit spreads widened only modestly before stabilizing near prior levels, supported by strong demand and resilient underlying fundamentals.
-
Top contributors to performance relative to the Blended Index:
-
Within the international equity segment, style selection contributed positively as exposure to emerging markets, value, growth, and small/mid-cap international strategies benefited relative performance.
-
-
Top detractors from performance relative to the Blended Index:
-
Within the U.S. equity segment, lagging relative performance across the majority of the strategies weighed on relative results as the funds generally underperformed their respective benchmarks. Style selection also held back relative performance as mid-cap strategies underperformed the broader index.
-
Within the international equity segment, relative performance of the MFS International Growth Fund, MFS International New Discovery Fund, and MFS Research International Fund held back performance as the funds lagged their respective benchmarks.
-
FUND PERFORMANCE
The fund’s past performance is not a good predictor of the fund’s future performance. The graph and table below do not reflect the deduction of taxes that a shareholder would pay on fund distributions or the redemption of fund shares. The graph and table below assume reinvestment of dividends and capital gain distributions.
Growth of a Hypothetical $10,000 Investment
This graph shows the performance of a hypothetical $10,000 investment in Class R3 over a ten year period or since inception, if shorter, in comparison to (i) a broad measure of market performance and (ii) an additional index that MFS believes more closely reflects the market segments in which the fund invests.
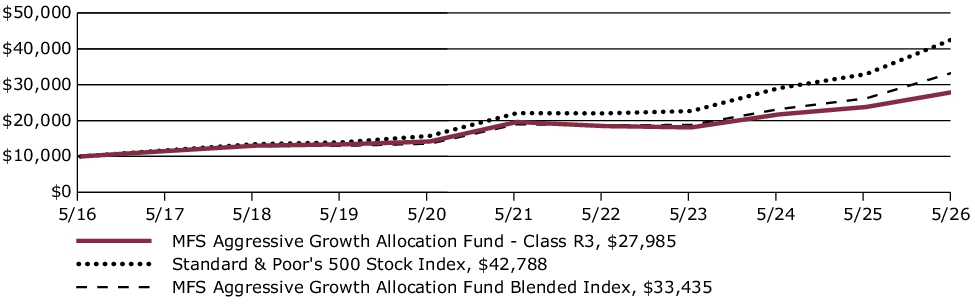
Average Annual Total Returns through 5/31/26
This table shows the average annual total returns of the class of shares noted for the periods shown, both with (if any) and without sales charges. It also shows the average annual total returns of (i) a broad measure of market performance and (ii) an additional index that MFS believes more closely reflects the market segments in which the fund invests, over the same periods.
| Share Class | 1-yr | 5-yr | 10-yr |
| R3 without sales charge | 17.62% | 7.37% | 10.84% |
| Comparative Benchmark(s) | |||
| Standard & Poor's 500 Stock Index ∆ | 29.78% | 14.15% | 15.65% |
| MFS Aggressive Growth Allocation Fund Blended Index ∆ | 27.63% | 11.98% | 12.83% |
|
∆
|
Source: FactSet Research Systems Inc.
|
Visit mfs.com/perf/r3 for more recent performance information.
FUND STATISTICS AS OF 5/31/26
| Net Assets ($): | 3,074,453,688 | Total Management Fee ($)#: | 0 | |
| Total Number of Holdings: | 16 | Portfolio Turnover Rate (%): | 1 |
# The fund itself does not pay a management fee but the underlying funds in which the fund invests do pay management fees to MFS.
PORTFOLIO COMPOSITION (BASED ON TOTAL INVESTMENTS AS OF 5/31/26)
Portfolio allocation
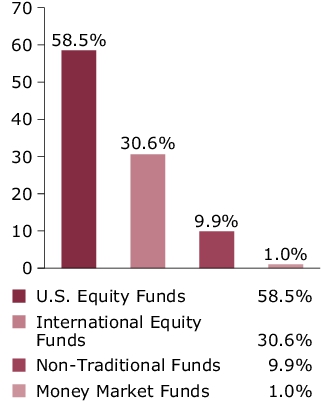
Portfolio holdings
| MFS Value Fund | 11.8% |
| MFS Growth Fund | 11.4% |
| MFS Research Fund | 10.4% |
| MFS Mid Cap Value Fund | 10.0% |
| MFS Mid Cap Growth Fund | 9.9% |
| MFS Research International Fund | 8.2% |
| MFS International Large Cap Value Fund | 5.1% |
| MFS International Intrinsic Equity Fund | 5.1% |
| MFS International Growth Fund | 5.0% |
| MFS Global Real Estate Fund | 5.0% |
| MFS Commodity Strategy Fund | 4.9% |
| MFS International New Discovery Fund | 4.1% |
| MFS Emerging Markets Equity Fund | 3.1% |
| MFS New Discovery Fund | 2.5% |
| MFS New Discovery Value Fund | 2.5% |
| MFS Institutional Money Market Portfolio | 1.0% |
FUND EXPENSES
What were the fund costs for the last year?
| (based on a hypothetical $10,000 investment) | ||
| Class Name | Costs of a $10,000 investment ~ | Costs paid as a percentage of a $10,000 investment ~ |
| R2 | $67 | 0.62% |
˜ Expenses are direct expenses and do not include underlying fund fees and expenses.
MANAGEMENT'S DISCUSSION OF FUND PERFORMANCE
-
For the twelve months ended May 31, 2026, Class R2 shares of the MFS Aggressive Growth Allocation Fund (fund) provided a total return of 17.35%, at net asset value. This compares with a return of 29.78% for the fund’s benchmark, the Standard & Poor's 500 Stock Index. The fund's other benchmark, the MFS Aggressive Growth Allocation Fund Blended Index (Blended Index), generated a return of 27.63%. The Blended Index reflects the blended returns of broad asset class indices, with percentage allocations to each index designed to resemble the long term strategic allocations of the fund. The market indices and related percentage allocations used to compile the Blended Index are set forth in the Fund Performance.
-
Global equity markets reached record levels during the period, withstanding considerable volatility amid tariffs, geopolitical conflict and high levels of uncertainty. A new geopolitical event distressed markets at the end of the period as US and Israeli forces launched strikes against Iran, disrupting Mideast oil and natural gas exports. During the period, a pro-growth tax and spending bill was signed into law in the US, while in Europe, renewed focus on defense and infrastructure spending brightened the economic outlook. In Japan, the election of a pro-growth prime minister sent stocks to new highs prior to the conflict in Iran. Optimism over artificial intelligence remained high.
-
Considerable progress was made in trade talks between the US and many major trading partners, with a fragile truce between the US and China extended through late 2026. While the US Supreme Court struck down part of the Trump administration’s tariff strategy, the administration began deploying other authorities to largely replace the ones that were ruled unconstitutional.
-
Early in the period, moderating inflation pressures allowed many global central banks to ease monetary policy. Amid a difficult policymaking environment and slower job growth, the Federal Reserve resumed easing policy in September and delivered quarter-point rate cuts in October and December before pausing.
-
In fixed income markets, previously range-bound global bond yields spiked following the onset of the Middle East conflict, as energy-driven inflation fears appeared to have rattled bond investors. US rate volatility (as measured by the Merrill Lynch Option Volatility Estimate (MOVE) Index) similarly rose from intra-period lows, reflecting uncertainty around the scope and duration of the conflict and its implications for global growth. However, volatility later retracted as the risk of a broader regional military escalation appeared less likely. Global credit spreads widened only modestly before stabilizing near prior levels, supported by strong demand and resilient underlying fundamentals.
-
Top contributors to performance relative to the Blended Index:
-
Within the international equity segment, style selection contributed positively as exposure to emerging markets, value, growth, and small/mid-cap international strategies benefited relative performance.
-
-
Top detractors from performance relative to the Blended Index:
-
Within the U.S. equity segment, lagging relative performance across the majority of the strategies weighed on relative results as the funds generally underperformed their respective benchmarks. Style selection also held back relative performance as mid-cap strategies underperformed the broader index.
-
Within the international equity segment, relative performance of the MFS International Growth Fund, MFS International New Discovery Fund, and MFS Research International Fund held back performance as the funds lagged their respective benchmarks.
-
FUND PERFORMANCE
The fund’s past performance is not a good predictor of the fund’s future performance. The graph and table below do not reflect the deduction of taxes that a shareholder would pay on fund distributions or the redemption of fund shares. The graph and table below assume reinvestment of dividends and capital gain distributions.
Growth of a Hypothetical $10,000 Investment
This graph shows the performance of a hypothetical $10,000 investment in Class R2 over a ten year period or since inception, if shorter, in comparison to (i) a broad measure of market performance and (ii) an additional index that MFS believes more closely reflects the market segments in which the fund invests.
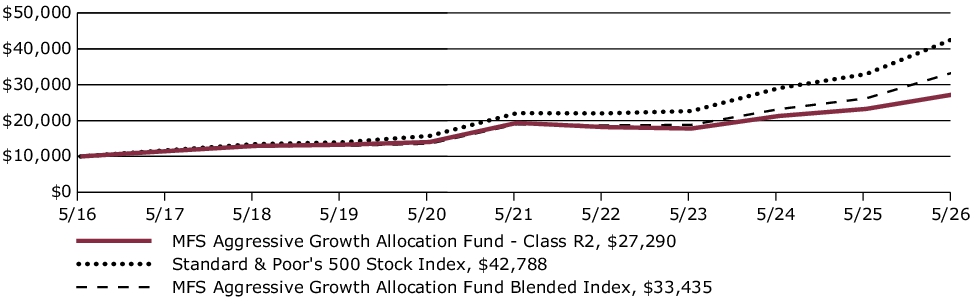
Average Annual Total Returns through 5/31/26
This table shows the average annual total returns of the class of shares noted for the periods shown, both with (if any) and without sales charges. It also shows the average annual total returns of (i) a broad measure of market performance and (ii) an additional index that MFS believes more closely reflects the market segments in which the fund invests, over the same periods.
| Share Class | 1-yr | 5-yr | 10-yr |
| R2 without sales charge | 17.35% | 7.10% | 10.56% |
| Comparative Benchmark(s) | |||
| Standard & Poor's 500 Stock Index ∆ | 29.78% | 14.15% | 15.65% |
| MFS Aggressive Growth Allocation Fund Blended Index ∆ | 27.63% | 11.98% | 12.83% |
|
∆
|
Source: FactSet Research Systems Inc.
|
Visit mfs.com/perf/r2 for more recent performance information.
FUND STATISTICS AS OF 5/31/26
| Net Assets ($): | 3,074,453,688 | Total Management Fee ($)#: | 0 | |
| Total Number of Holdings: | 16 | Portfolio Turnover Rate (%): | 1 |
# The fund itself does not pay a management fee but the underlying funds in which the fund invests do pay management fees to MFS.
PORTFOLIO COMPOSITION (BASED ON TOTAL INVESTMENTS AS OF 5/31/26)
Portfolio allocation
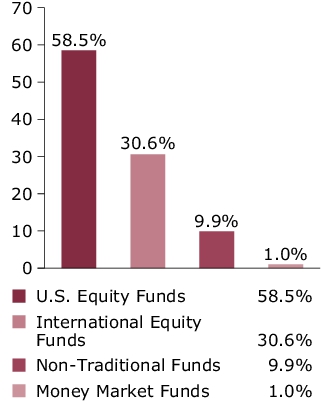
Portfolio holdings
| MFS Value Fund | 11.8% |
| MFS Growth Fund | 11.4% |
| MFS Research Fund | 10.4% |
| MFS Mid Cap Value Fund | 10.0% |
| MFS Mid Cap Growth Fund | 9.9% |
| MFS Research International Fund | 8.2% |
| MFS International Large Cap Value Fund | 5.1% |
| MFS International Intrinsic Equity Fund | 5.1% |
| MFS International Growth Fund | 5.0% |
| MFS Global Real Estate Fund | 5.0% |
| MFS Commodity Strategy Fund | 4.9% |
| MFS International New Discovery Fund | 4.1% |
| MFS Emerging Markets Equity Fund | 3.1% |
| MFS New Discovery Fund | 2.5% |
| MFS New Discovery Value Fund | 2.5% |
| MFS Institutional Money Market Portfolio | 1.0% |
FUND EXPENSES
What were the fund costs for the last year?
| (based on a hypothetical $10,000 investment) | ||
| Class Name | Costs of a $10,000 investment ~ | Costs paid as a percentage of a $10,000 investment ~ |
| R1 | $121 | 1.12% |
˜ Expenses are direct expenses and do not include underlying fund fees and expenses.
MANAGEMENT'S DISCUSSION OF FUND PERFORMANCE
-
For the twelve months ended May 31, 2026, Class R1 shares of the MFS Aggressive Growth Allocation Fund (fund) provided a total return of 16.77%, at net asset value. This compares with a return of 29.78% for the fund’s benchmark, the Standard & Poor's 500 Stock Index. The fund's other benchmark, the MFS Aggressive Growth Allocation Fund Blended Index (Blended Index), generated a return of 27.63%. The Blended Index reflects the blended returns of broad asset class indices, with percentage allocations to each index designed to resemble the long term strategic allocations of the fund. The market indices and related percentage allocations used to compile the Blended Index are set forth in the Fund Performance.
-
Global equity markets reached record levels during the period, withstanding considerable volatility amid tariffs, geopolitical conflict and high levels of uncertainty. A new geopolitical event distressed markets at the end of the period as US and Israeli forces launched strikes against Iran, disrupting Mideast oil and natural gas exports. During the period, a pro-growth tax and spending bill was signed into law in the US, while in Europe, renewed focus on defense and infrastructure spending brightened the economic outlook. In Japan, the election of a pro-growth prime minister sent stocks to new highs prior to the conflict in Iran. Optimism over artificial intelligence remained high.
-
Considerable progress was made in trade talks between the US and many major trading partners, with a fragile truce between the US and China extended through late 2026. While the US Supreme Court struck down part of the Trump administration’s tariff strategy, the administration began deploying other authorities to largely replace the ones that were ruled unconstitutional.
-
Early in the period, moderating inflation pressures allowed many global central banks to ease monetary policy. Amid a difficult policymaking environment and slower job growth, the Federal Reserve resumed easing policy in September and delivered quarter-point rate cuts in October and December before pausing.
-
In fixed income markets, previously range-bound global bond yields spiked following the onset of the Middle East conflict, as energy-driven inflation fears appeared to have rattled bond investors. US rate volatility (as measured by the Merrill Lynch Option Volatility Estimate (MOVE) Index) similarly rose from intra-period lows, reflecting uncertainty around the scope and duration of the conflict and its implications for global growth. However, volatility later retracted as the risk of a broader regional military escalation appeared less likely. Global credit spreads widened only modestly before stabilizing near prior levels, supported by strong demand and resilient underlying fundamentals.
-
Top contributors to performance relative to the Blended Index:
-
Within the international equity segment, style selection contributed positively as exposure to emerging markets, value, growth, and small/mid-cap international strategies benefited relative performance.
-
-
Top detractors from performance relative to the Blended Index:
-
Within the U.S. equity segment, lagging relative performance across the majority of the strategies weighed on relative results as the funds generally underperformed their respective benchmarks. Style selection also held back relative performance as mid-cap strategies underperformed the broader index.
-
Within the international equity segment, relative performance of the MFS International Growth Fund, MFS International New Discovery Fund, and MFS Research International Fund held back performance as the funds lagged their respective benchmarks.
-
FUND PERFORMANCE
The fund’s past performance is not a good predictor of the fund’s future performance. The graph and table below do not reflect the deduction of taxes that a shareholder would pay on fund distributions or the redemption of fund shares. The graph and table below assume reinvestment of dividends and capital gain distributions.
Growth of a Hypothetical $10,000 Investment
This graph shows the performance of a hypothetical $10,000 investment in Class R1 over a ten year period or since inception, if shorter, in comparison to (i) a broad measure of market performance and (ii) an additional index that MFS believes more closely reflects the market segments in which the fund invests.
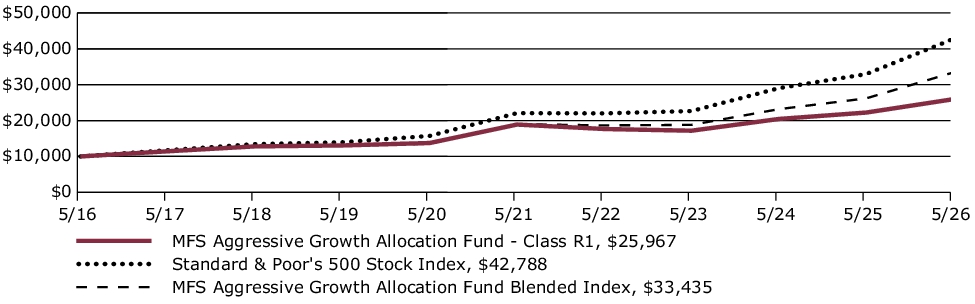
Average Annual Total Returns through 5/31/26
This table shows the average annual total returns of the class of shares noted for the periods shown, both with (if any) and without sales charges. It also shows the average annual total returns of (i) a broad measure of market performance and (ii) an additional index that MFS believes more closely reflects the market segments in which the fund invests, over the same periods.
| Share Class | 1-yr | 5-yr | 10-yr |
| R1 without sales charge | 16.77% | 6.57% | 10.01% |
| Comparative Benchmark(s) | |||
| Standard & Poor's 500 Stock Index ∆ | 29.78% | 14.15% | 15.65% |
| MFS Aggressive Growth Allocation Fund Blended Index ∆ | 27.63% | 11.98% | 12.83% |
|
∆
|
Source: FactSet Research Systems Inc.
|
Visit mfs.com/perf/r1 for more recent performance information.
FUND STATISTICS AS OF 5/31/26
| Net Assets ($): | 3,074,453,688 | Total Management Fee ($)#: | 0 | |
| Total Number of Holdings: | 16 | Portfolio Turnover Rate (%): | 1 |
# The fund itself does not pay a management fee but the underlying funds in which the fund invests do pay management fees to MFS.
PORTFOLIO COMPOSITION (BASED ON TOTAL INVESTMENTS AS OF 5/31/26)
Portfolio allocation
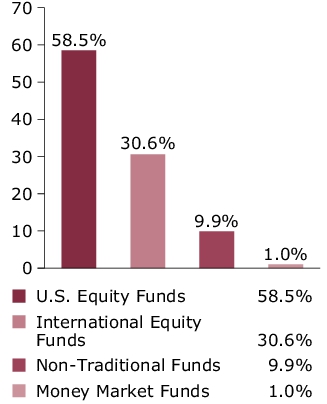
Portfolio holdings
| MFS Value Fund | 11.8% |
| MFS Growth Fund | 11.4% |
| MFS Research Fund | 10.4% |
| MFS Mid Cap Value Fund | 10.0% |
| MFS Mid Cap Growth Fund | 9.9% |
| MFS Research International Fund | 8.2% |
| MFS International Large Cap Value Fund | 5.1% |
| MFS International Intrinsic Equity Fund | 5.1% |
| MFS International Growth Fund | 5.0% |
| MFS Global Real Estate Fund | 5.0% |
| MFS Commodity Strategy Fund | 4.9% |
| MFS International New Discovery Fund | 4.1% |
| MFS Emerging Markets Equity Fund | 3.1% |
| MFS New Discovery Fund | 2.5% |
| MFS New Discovery Value Fund | 2.5% |
| MFS Institutional Money Market Portfolio | 1.0% |
FUND EXPENSES
What were the fund costs for the last year?
| (based on a hypothetical $10,000 investment) | ||
| Class Name | Costs of a $10,000 investment ~ | Costs paid as a percentage of a $10,000 investment ~ |
| I | $13 | 0.12% |
˜ Expenses are direct expenses and do not include underlying fund fees and expenses.
MANAGEMENT'S DISCUSSION OF FUND PERFORMANCE
-
For the twelve months ended May 31, 2026, Class I shares of the MFS Aggressive Growth Allocation Fund (fund) provided a total return of 17.94%, at net asset value. This compares with a return of 29.78% for the fund’s benchmark, the Standard & Poor's 500 Stock Index. The fund's other benchmark, the MFS Aggressive Growth Allocation Fund Blended Index (Blended Index), generated a return of 27.63%. The Blended Index reflects the blended returns of broad asset class indices, with percentage allocations to each index designed to resemble the long term strategic allocations of the fund. The market indices and related percentage allocations used to compile the Blended Index are set forth in the Fund Performance.
-
Global equity markets reached record levels during the period, withstanding considerable volatility amid tariffs, geopolitical conflict and high levels of uncertainty. A new geopolitical event distressed markets at the end of the period as US and Israeli forces launched strikes against Iran, disrupting Mideast oil and natural gas exports. During the period, a pro-growth tax and spending bill was signed into law in the US, while in Europe, renewed focus on defense and infrastructure spending brightened the economic outlook. In Japan, the election of a pro-growth prime minister sent stocks to new highs prior to the conflict in Iran. Optimism over artificial intelligence remained high.
-
Considerable progress was made in trade talks between the US and many major trading partners, with a fragile truce between the US and China extended through late 2026. While the US Supreme Court struck down part of the Trump administration’s tariff strategy, the administration began deploying other authorities to largely replace the ones that were ruled unconstitutional.
-
Early in the period, moderating inflation pressures allowed many global central banks to ease monetary policy. Amid a difficult policymaking environment and slower job growth, the Federal Reserve resumed easing policy in September and delivered quarter-point rate cuts in October and December before pausing.
-
In fixed income markets, previously range-bound global bond yields spiked following the onset of the Middle East conflict, as energy-driven inflation fears appeared to have rattled bond investors. US rate volatility (as measured by the Merrill Lynch Option Volatility Estimate (MOVE) Index) similarly rose from intra-period lows, reflecting uncertainty around the scope and duration of the conflict and its implications for global growth. However, volatility later retracted as the risk of a broader regional military escalation appeared less likely. Global credit spreads widened only modestly before stabilizing near prior levels, supported by strong demand and resilient underlying fundamentals.
-
Top contributors to performance relative to the Blended Index:
-
Within the international equity segment, style selection contributed positively as exposure to emerging markets, value, growth, and small/mid-cap international strategies benefited relative performance.
-
-
Top detractors from performance relative to the Blended Index:
-
Within the U.S. equity segment, lagging relative performance across the majority of the strategies weighed on relative results as the funds generally underperformed their respective benchmarks. Style selection also held back relative performance as mid-cap strategies underperformed the broader index.
-
Within the international equity segment, relative performance of the MFS International Growth Fund, MFS International New Discovery Fund, and MFS Research International Fund held back performance as the funds lagged their respective benchmarks.
-
FUND PERFORMANCE
The fund’s past performance is not a good predictor of the fund’s future performance. The graph and table below do not reflect the deduction of taxes that a shareholder would pay on fund distributions or the redemption of fund shares. The graph and table below assume reinvestment of dividends and capital gain distributions.
Growth of a Hypothetical $10,000 Investment
This graph shows the performance of a hypothetical $10,000 investment in Class I over a ten year period or since inception, if shorter, in comparison to (i) a broad measure of market performance and (ii) an additional index that MFS believes more closely reflects the market segments in which the fund invests.
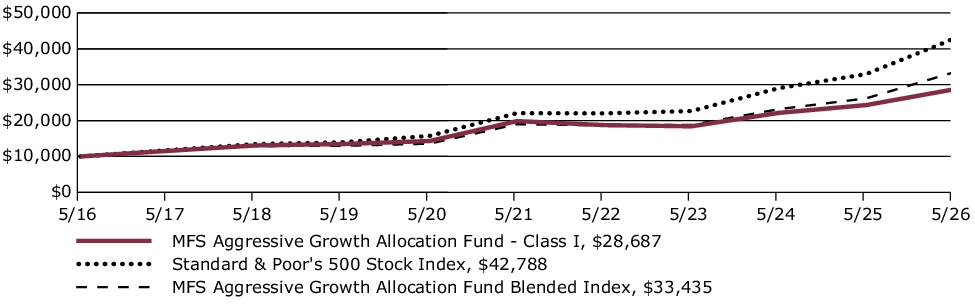
Average Annual Total Returns through 5/31/26
This table shows the average annual total returns of the class of shares noted for the periods shown, both with (if any) and without sales charges. It also shows the average annual total returns of (i) a broad measure of market performance and (ii) an additional index that MFS believes more closely reflects the market segments in which the fund invests, over the same periods.
| Share Class | 1-yr | 5-yr | 10-yr |
| I without sales charge | 17.94% | 7.64% | 11.11% |
| Comparative Benchmark(s) | |||
| Standard & Poor's 500 Stock Index ∆ | 29.78% | 14.15% | 15.65% |
| MFS Aggressive Growth Allocation Fund Blended Index ∆ | 27.63% | 11.98% | 12.83% |
|
∆
|
Source: FactSet Research Systems Inc.
|
Visit mfs.com/perf/i for more recent performance information.
FUND STATISTICS AS OF 5/31/26
| Net Assets ($): | 3,074,453,688 | Total Management Fee ($)#: | 0 | |
| Total Number of Holdings: | 16 | Portfolio Turnover Rate (%): | 1 |
# The fund itself does not pay a management fee but the underlying funds in which the fund invests do pay management fees to MFS.
PORTFOLIO COMPOSITION (BASED ON TOTAL INVESTMENTS AS OF 5/31/26)
Portfolio allocation
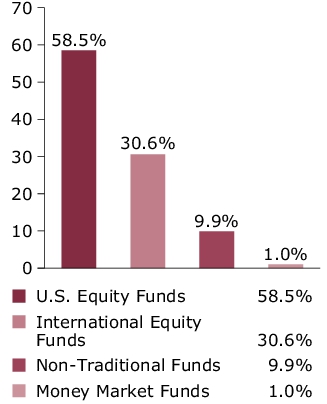
Portfolio holdings
| MFS Value Fund | 11.8% |
| MFS Growth Fund | 11.4% |
| MFS Research Fund | 10.4% |
| MFS Mid Cap Value Fund | 10.0% |
| MFS Mid Cap Growth Fund | 9.9% |
| MFS Research International Fund | 8.2% |
| MFS International Large Cap Value Fund | 5.1% |
| MFS International Intrinsic Equity Fund | 5.1% |
| MFS International Growth Fund | 5.0% |
| MFS Global Real Estate Fund | 5.0% |
| MFS Commodity Strategy Fund | 4.9% |
| MFS International New Discovery Fund | 4.1% |
| MFS Emerging Markets Equity Fund | 3.1% |
| MFS New Discovery Fund | 2.5% |
| MFS New Discovery Value Fund | 2.5% |
| MFS Institutional Money Market Portfolio | 1.0% |
FUND EXPENSES
What were the fund costs for the last year?
| (based on a hypothetical $10,000 investment) | ||
| Class Name | Costs of a $10,000 investment ~ | Costs paid as a percentage of a $10,000 investment ~ |
| C | $121 | 1.12% |
˜ Expenses are direct expenses and do not include underlying fund fees and expenses.
MANAGEMENT'S DISCUSSION OF FUND PERFORMANCE
-
For the twelve months ended May 31, 2026, Class C shares of the MFS Aggressive Growth Allocation Fund (fund) provided a total return of 16.78%, at net asset value. This compares with a return of 29.78% for the fund’s benchmark, the Standard & Poor's 500 Stock Index. The fund's other benchmark, the MFS Aggressive Growth Allocation Fund Blended Index (Blended Index), generated a return of 27.63%. The Blended Index reflects the blended returns of broad asset class indices, with percentage allocations to each index designed to resemble the long term strategic allocations of the fund. The market indices and related percentage allocations used to compile the Blended Index are set forth in the Fund Performance.
-
Global equity markets reached record levels during the period, withstanding considerable volatility amid tariffs, geopolitical conflict and high levels of uncertainty. A new geopolitical event distressed markets at the end of the period as US and Israeli forces launched strikes against Iran, disrupting Mideast oil and natural gas exports. During the period, a pro-growth tax and spending bill was signed into law in the US, while in Europe, renewed focus on defense and infrastructure spending brightened the economic outlook. In Japan, the election of a pro-growth prime minister sent stocks to new highs prior to the conflict in Iran. Optimism over artificial intelligence remained high.
-
Considerable progress was made in trade talks between the US and many major trading partners, with a fragile truce between the US and China extended through late 2026. While the US Supreme Court struck down part of the Trump administration’s tariff strategy, the administration began deploying other authorities to largely replace the ones that were ruled unconstitutional.
-
Early in the period, moderating inflation pressures allowed many global central banks to ease monetary policy. Amid a difficult policymaking environment and slower job growth, the Federal Reserve resumed easing policy in September and delivered quarter-point rate cuts in October and December before pausing.
-
In fixed income markets, previously range-bound global bond yields spiked following the onset of the Middle East conflict, as energy-driven inflation fears appeared to have rattled bond investors. US rate volatility (as measured by the Merrill Lynch Option Volatility Estimate (MOVE) Index) similarly rose from intra-period lows, reflecting uncertainty around the scope and duration of the conflict and its implications for global growth. However, volatility later retracted as the risk of a broader regional military escalation appeared less likely. Global credit spreads widened only modestly before stabilizing near prior levels, supported by strong demand and resilient underlying fundamentals.
-
Top contributors to performance relative to the Blended Index:
-
Within the international equity segment, style selection contributed positively as exposure to emerging markets, value, growth, and small/mid-cap international strategies benefited relative performance.
-
-
Top detractors from performance relative to the Blended Index:
-
Within the U.S. equity segment, lagging relative performance across the majority of the strategies weighed on relative results as the funds generally underperformed their respective benchmarks. Style selection also held back relative performance as mid-cap strategies underperformed the broader index.
-
Within the international equity segment, relative performance of the MFS International Growth Fund, MFS International New Discovery Fund, and MFS Research International Fund held back performance as the funds lagged their respective benchmarks.
-
FUND PERFORMANCE
The fund’s past performance is not a good predictor of the fund’s future performance. The graph and table below do not reflect the deduction of taxes that a shareholder would pay on fund distributions or the redemption of fund shares. The graph and table below assume reinvestment of dividends and capital gain distributions.
Growth of a Hypothetical $10,000 Investment
This graph shows the performance of a hypothetical $10,000 investment in Class C over a ten year period or since inception, if shorter, in comparison to (i) a broad measure of market performance and (ii) an additional index that MFS believes more closely reflects the market segments in which the fund invests.
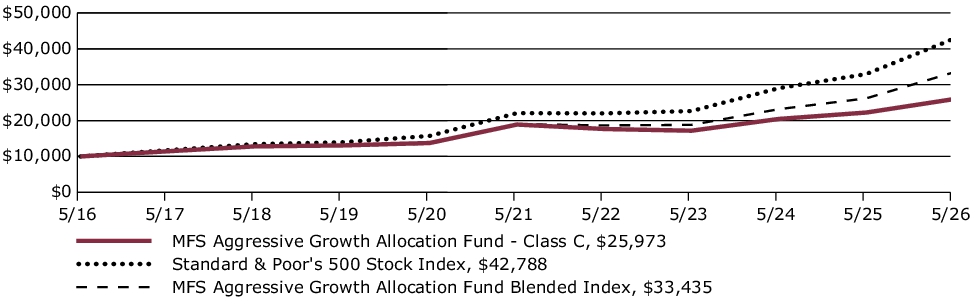
Average Annual Total Returns through 5/31/26
This table shows the average annual total returns of the class of shares noted for the periods shown, both with (if any) and without sales charges. It also shows the average annual total returns of (i) a broad measure of market performance and (ii) an additional index that MFS believes more closely reflects the market segments in which the fund invests, over the same periods.
| Share Class | 1-yr | 5-yr | 10-yr |
| C without sales charge | 16.78% | 6.57% | 10.01% |
| C with CDSC (1% for 12 months)× | 15.78% | 6.57% | 10.01% |
| Comparative Benchmark(s) | |||
| Standard & Poor's 500 Stock Index ∆ | 29.78% | 14.15% | 15.65% |
| MFS Aggressive Growth Allocation Fund Blended Index ∆ | 27.63% | 11.98% | 12.83% |
|
∆
|
Source: FactSet Research Systems Inc.
|
|
×
|
Assuming redemption at the end of the applicable period.
|
Visit mfs.com/perf/c for more recent performance information.
FUND STATISTICS AS OF 5/31/26
| Net Assets ($): | 3,074,453,688 | Total Management Fee ($)#: | 0 | |
| Total Number of Holdings: | 16 | Portfolio Turnover Rate (%): | 1 |
# The fund itself does not pay a management fee but the underlying funds in which the fund invests do pay management fees to MFS.
PORTFOLIO COMPOSITION (BASED ON TOTAL INVESTMENTS AS OF 5/31/26)
Portfolio allocation
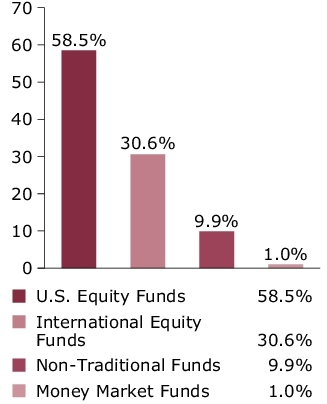
Portfolio holdings
| MFS Value Fund | 11.8% |
| MFS Growth Fund | 11.4% |
| MFS Research Fund | 10.4% |
| MFS Mid Cap Value Fund | 10.0% |
| MFS Mid Cap Growth Fund | 9.9% |
| MFS Research International Fund | 8.2% |
| MFS International Large Cap Value Fund | 5.1% |
| MFS International Intrinsic Equity Fund | 5.1% |
| MFS International Growth Fund | 5.0% |
| MFS Global Real Estate Fund | 5.0% |
| MFS Commodity Strategy Fund | 4.9% |
| MFS International New Discovery Fund | 4.1% |
| MFS Emerging Markets Equity Fund | 3.1% |
| MFS New Discovery Fund | 2.5% |
| MFS New Discovery Value Fund | 2.5% |
| MFS Institutional Money Market Portfolio | 1.0% |
FUND EXPENSES
What were the fund costs for the last year?
| (based on a hypothetical $10,000 investment) | ||
| Class Name | Costs of a $10,000 investment ~ | Costs paid as a percentage of a $10,000 investment ~ |
| B | $121 | 1.12% |
˜ Expenses are direct expenses and do not include underlying fund fees and expenses.
MANAGEMENT'S DISCUSSION OF FUND PERFORMANCE
-
For the twelve months ended May 31, 2026, Class B shares of the MFS Aggressive Growth Allocation Fund (fund) provided a total return of 16.79%, at net asset value. This compares with a return of 29.78% for the fund’s benchmark, the Standard & Poor's 500 Stock Index. The fund's other benchmark, the MFS Aggressive Growth Allocation Fund Blended Index (Blended Index), generated a return of 27.63%. The Blended Index reflects the blended returns of broad asset class indices, with percentage allocations to each index designed to resemble the long term strategic allocations of the fund. The market indices and related percentage allocations used to compile the Blended Index are set forth in the Fund Performance.
-
Global equity markets reached record levels during the period, withstanding considerable volatility amid tariffs, geopolitical conflict and high levels of uncertainty. A new geopolitical event distressed markets at the end of the period as US and Israeli forces launched strikes against Iran, disrupting Mideast oil and natural gas exports. During the period, a pro-growth tax and spending bill was signed into law in the US, while in Europe, renewed focus on defense and infrastructure spending brightened the economic outlook. In Japan, the election of a pro-growth prime minister sent stocks to new highs prior to the conflict in Iran. Optimism over artificial intelligence remained high.
-
Considerable progress was made in trade talks between the US and many major trading partners, with a fragile truce between the US and China extended through late 2026. While the US Supreme Court struck down part of the Trump administration’s tariff strategy, the administration began deploying other authorities to largely replace the ones that were ruled unconstitutional.
-
Early in the period, moderating inflation pressures allowed many global central banks to ease monetary policy. Amid a difficult policymaking environment and slower job growth, the Federal Reserve resumed easing policy in September and delivered quarter-point rate cuts in October and December before pausing.
-
In fixed income markets, previously range-bound global bond yields spiked following the onset of the Middle East conflict, as energy-driven inflation fears appeared to have rattled bond investors. US rate volatility (as measured by the Merrill Lynch Option Volatility Estimate (MOVE) Index) similarly rose from intra-period lows, reflecting uncertainty around the scope and duration of the conflict and its implications for global growth. However, volatility later retracted as the risk of a broader regional military escalation appeared less likely. Global credit spreads widened only modestly before stabilizing near prior levels, supported by strong demand and resilient underlying fundamentals.
-
Top contributors to performance relative to the Blended Index:
-
Within the international equity segment, style selection contributed positively as exposure to emerging markets, value, growth, and small/mid-cap international strategies benefited relative performance.
-
-
Top detractors from performance relative to the Blended Index:
-
Within the U.S. equity segment, lagging relative performance across the majority of the strategies weighed on relative results as the funds generally underperformed their respective benchmarks. Style selection also held back relative performance as mid-cap strategies underperformed the broader index.
-
Within the international equity segment, relative performance of the MFS International Growth Fund, MFS International New Discovery Fund, and MFS Research International Fund held back performance as the funds lagged their respective benchmarks.
-
FUND PERFORMANCE
The fund’s past performance is not a good predictor of the fund’s future performance. The graph and table below do not reflect the deduction of taxes that a shareholder would pay on fund distributions or the redemption of fund shares. The graph and table below assume reinvestment of dividends and capital gain distributions.
Growth of a Hypothetical $10,000 Investment
This graph shows the performance of a hypothetical $10,000 investment in Class B over a ten year period or since inception, if shorter, in comparison to (i) a broad measure of market performance and (ii) an additional index that MFS believes more closely reflects the market segments in which the fund invests.
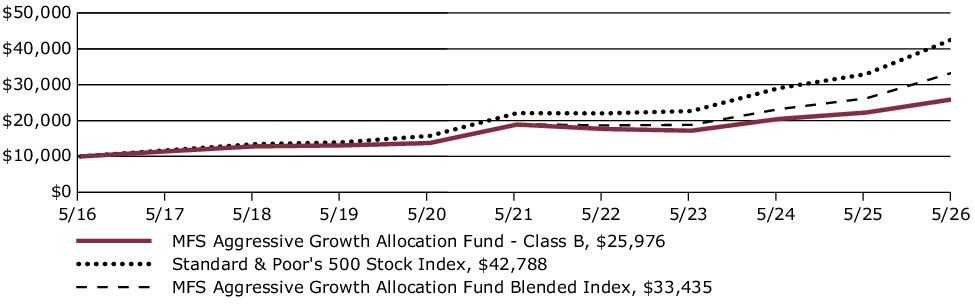
Average Annual Total Returns through 5/31/26
This table shows the average annual total returns of the class of shares noted for the periods shown, both with (if any) and without sales charges. It also shows the average annual total returns of (i) a broad measure of market performance and (ii) an additional index that MFS believes more closely reflects the market segments in which the fund invests, over the same periods.
| Share Class | 1-yr | 5-yr | 10-yr |
| B without sales charge | 16.79% | 6.58% | 10.02% |
| B with CDSC (declining over six years from 4% to 0%)× | 12.79% | 6.26% | 10.02% |
| Comparative Benchmark(s) | |||
| Standard & Poor's 500 Stock Index ∆ | 29.78% | 14.15% | 15.65% |
| MFS Aggressive Growth Allocation Fund Blended Index ∆ | 27.63% | 11.98% | 12.83% |
|
∆
|
Source: FactSet Research Systems Inc.
|
|
×
|
Assuming redemption at the end of the applicable period.
|
Visit mfs.com/perf/b for more recent performance information.
FUND STATISTICS AS OF 5/31/26
| Net Assets ($): | 3,074,453,688 | Total Management Fee ($)#: | 0 | |
| Total Number of Holdings: | 16 | Portfolio Turnover Rate (%): | 1 |
# The fund itself does not pay a management fee but the underlying funds in which the fund invests do pay management fees to MFS.
PORTFOLIO COMPOSITION (BASED ON TOTAL INVESTMENTS AS OF 5/31/26)
Portfolio allocation
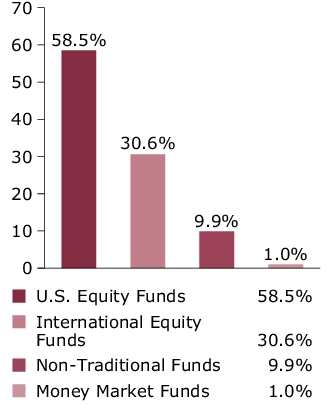
Portfolio holdings
| MFS Value Fund | 11.8% |
| MFS Growth Fund | 11.4% |
| MFS Research Fund | 10.4% |
| MFS Mid Cap Value Fund | 10.0% |
| MFS Mid Cap Growth Fund | 9.9% |
| MFS Research International Fund | 8.2% |
| MFS International Large Cap Value Fund | 5.1% |
| MFS International Intrinsic Equity Fund | 5.1% |
| MFS International Growth Fund | 5.0% |
| MFS Global Real Estate Fund | 5.0% |
| MFS Commodity Strategy Fund | 4.9% |
| MFS International New Discovery Fund | 4.1% |
| MFS Emerging Markets Equity Fund | 3.1% |
| MFS New Discovery Fund | 2.5% |
| MFS New Discovery Value Fund | 2.5% |
| MFS Institutional Money Market Portfolio | 1.0% |
FUND EXPENSES
What were the fund costs for the last year?
| (based on a hypothetical $10,000 investment) | ||
| Class Name | Costs of a $10,000 investment ~ | Costs paid as a percentage of a $10,000 investment ~ |
| A | $40 | 0.37% |
˜ Expenses are direct expenses and do not include underlying fund fees and expenses.
MANAGEMENT'S DISCUSSION OF FUND PERFORMANCE
-
For the twelve months ended May 31, 2026, Class A shares of the MFS Aggressive Growth Allocation Fund (fund) provided a total return of 17.67%, at net asset value. This compares with a return of 29.78% for the fund’s benchmark, the Standard & Poor's 500 Stock Index. The fund's other benchmark, the MFS Aggressive Growth Allocation Fund Blended Index (Blended Index), generated a return of 27.63%. The Blended Index reflects the blended returns of broad asset class indices, with percentage allocations to each index designed to resemble the long term strategic allocations of the fund. The market indices and related percentage allocations used to compile the Blended Index are set forth in the Fund Performance.
-
Global equity markets reached record levels during the period, withstanding considerable volatility amid tariffs, geopolitical conflict and high levels of uncertainty. A new geopolitical event distressed markets at the end of the period as US and Israeli forces launched strikes against Iran, disrupting Mideast oil and natural gas exports. During the period, a pro-growth tax and spending bill was signed into law in the US, while in Europe, renewed focus on defense and infrastructure spending brightened the economic outlook. In Japan, the election of a pro-growth prime minister sent stocks to new highs prior to the conflict in Iran. Optimism over artificial intelligence remained high.
-
Considerable progress was made in trade talks between the US and many major trading partners, with a fragile truce between the US and China extended through late 2026. While the US Supreme Court struck down part of the Trump administration’s tariff strategy, the administration began deploying other authorities to largely replace the ones that were ruled unconstitutional.
-
Early in the period, moderating inflation pressures allowed many global central banks to ease monetary policy. Amid a difficult policymaking environment and slower job growth, the Federal Reserve resumed easing policy in September and delivered quarter-point rate cuts in October and December before pausing.
-
In fixed income markets, previously range-bound global bond yields spiked following the onset of the Middle East conflict, as energy-driven inflation fears appeared to have rattled bond investors. US rate volatility (as measured by the Merrill Lynch Option Volatility Estimate (MOVE) Index) similarly rose from intra-period lows, reflecting uncertainty around the scope and duration of the conflict and its implications for global growth. However, volatility later retracted as the risk of a broader regional military escalation appeared less likely. Global credit spreads widened only modestly before stabilizing near prior levels, supported by strong demand and resilient underlying fundamentals.
-
Top contributors to performance relative to the Blended Index:
-
Within the international equity segment, style selection contributed positively as exposure to emerging markets, value, growth, and small/mid-cap international strategies benefited relative performance.
-
-
Top detractors from performance relative to the Blended Index:
-
Within the U.S. equity segment, lagging relative performance across the majority of the strategies weighed on relative results as the funds generally underperformed their respective benchmarks. Style selection also held back relative performance as mid-cap strategies underperformed the broader index.
-
Within the international equity segment, relative performance of the MFS International Growth Fund, MFS International New Discovery Fund, and MFS Research International Fund held back performance as the funds lagged their respective benchmarks.
-
FUND PERFORMANCE
The fund’s past performance is not a good predictor of the fund’s future performance. The graph and table below do not reflect the deduction of taxes that a shareholder would pay on fund distributions or the redemption of fund shares. The graph and table below assume reinvestment of dividends and capital gain distributions.
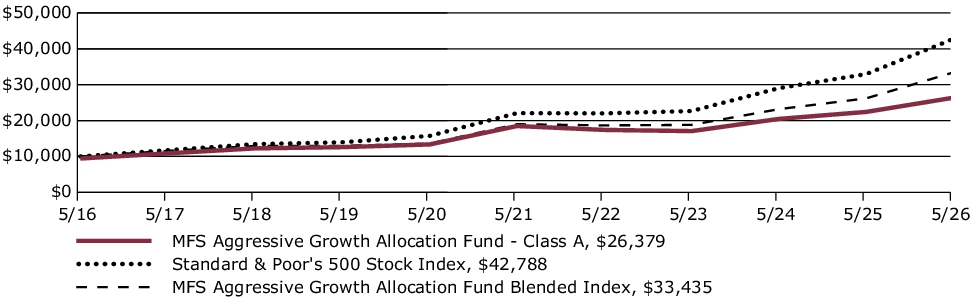
Growth of a Hypothetical $10,000 Investment
This graph shows the performance of a hypothetical $10,000 investment in Class A over a ten year period or since inception, if shorter, in comparison to (i) a broad measure of market performance and (ii) an additional index that MFS believes more closely reflects the market segments in which the fund invests. This graph includes the deduction of the maximum applicable sales charge.
Average Annual Total Returns through 5/31/26
This table shows the average annual total returns of the class of shares noted for the periods shown, both with (if any) and without sales charges. It also shows the average annual total returns of (i) a broad measure of market performance and (ii) an additional index that MFS believes more closely reflects the market segments in which the fund invests, over the same periods.
| Share Class | 1-yr | 5-yr | 10-yr |
| A without sales charge | 17.67% | 7.38% | 10.84% |
| A with initial sales charge (5.75%) | 10.90% | 6.11% | 10.19% |
| Comparative Benchmark(s) | |||
| Standard & Poor's 500 Stock Index ∆ | 29.78% | 14.15% | 15.65% |
| MFS Aggressive Growth Allocation Fund Blended Index ∆ | 27.63% | 11.98% | 12.83% |
|
∆
|
Source: FactSet Research Systems Inc.
|
Visit mfs.com/perf/a for more recent performance information.
FUND STATISTICS AS OF 5/31/26
| Net Assets ($): | 3,074,453,688 | Total Management Fee ($)#: | 0 | |
| Total Number of Holdings: | 16 | Portfolio Turnover Rate (%): | 1 |
# The fund itself does not pay a management fee but the underlying funds in which the fund invests do pay management fees to MFS.
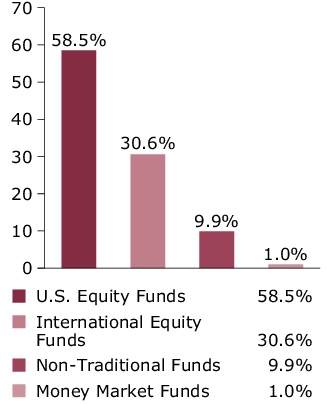
PORTFOLIO COMPOSITION (BASED ON TOTAL INVESTMENTS AS OF 5/31/26)
Portfolio allocation
Portfolio holdings
| MFS Value Fund | 11.8% |
| MFS Growth Fund | 11.4% |
| MFS Research Fund | 10.4% |
| MFS Mid Cap Value Fund | 10.0% |
| MFS Mid Cap Growth Fund | 9.9% |
| MFS Research International Fund | 8.2% |
| MFS International Large Cap Value Fund | 5.1% |
| MFS International Intrinsic Equity Fund | 5.1% |
| MFS International Growth Fund | 5.0% |
| MFS Global Real Estate Fund | 5.0% |
| MFS Commodity Strategy Fund | 4.9% |
| MFS International New Discovery Fund | 4.1% |
| MFS Emerging Markets Equity Fund | 3.1% |
| MFS New Discovery Fund | 2.5% |
| MFS New Discovery Value Fund | 2.5% |
| MFS Institutional Money Market Portfolio | 1.0% |
FUND EXPENSES
What were the fund costs for the last year?
| (based on a hypothetical $10,000 investment) | ||
| Class Name | Costs of a $10,000 investment ~ | Costs paid as a percentage of a $10,000 investment ~ |
| A | $35 | 0.33% |
˜ Expenses are direct expenses and do not include underlying fund fees and expenses.
MANAGEMENT'S DISCUSSION OF FUND PERFORMANCE
-
For the twelve months ended May 31, 2026, Class A shares of the MFS Moderate Allocation Fund (fund) provided a total return of 12.43%, at net asset value. This compares with a return of 29.78% for the fund’s benchmark, the Standard & Poor's 500 Stock Index. The fund's other benchmark, the MFS Moderate Allocation Fund Blended Index (Blended Index), generated a return of 18.60%. The Blended Index reflects the blended returns of broad asset class indices, with percentage allocations to each index designed to resemble the long term strategic allocations of the fund. The market indices and related percentage allocations used to compile the Blended Index are set forth in the Fund Performance.
-
Global equity markets reached record levels during the period, withstanding considerable volatility amid tariffs, geopolitical conflict and high levels of uncertainty. A new geopolitical event distressed markets at the end of the period as US and Israeli forces launched strikes against Iran, disrupting Mideast oil and natural gas exports. During the period, a pro-growth tax and spending bill was signed into law in the US, while in Europe, renewed focus on defense and infrastructure spending brightened the economic outlook. In Japan, the election of a pro-growth prime minister sent stocks to new highs prior to the conflict in Iran. Optimism over artificial intelligence remained high.
-
Considerable progress was made in trade talks between the US and many major trading partners, with a fragile truce between the US and China extended through late 2026. While the US Supreme Court struck down part of the Trump administration’s tariff strategy, the administration began deploying other authorities to largely replace the ones that were ruled unconstitutional.
-
Early in the period, moderating inflation pressures allowed many global central banks to ease monetary policy. Amid a difficult policymaking environment and slower job growth, the Federal Reserve resumed easing policy in September and delivered quarter-point rate cuts in October and December before pausing.
-
In fixed income markets, previously range-bound global bond yields spiked following the onset of the Middle East conflict, as energy-driven inflation fears appeared to have rattled bond investors. US rate volatility (as measured by the Merrill Lynch Option Volatility Estimate (MOVE) Index) similarly rose from intra-period lows, reflecting uncertainty around the scope and duration of the conflict and its implications for global growth. However, volatility later retracted as the risk of a broader regional military escalation appeared less likely. Global credit spreads widened only modestly before stabilizing near prior levels, supported by strong demand and resilient underlying fundamentals.
-
Top contributors to performance relative to the Blended Index:
-
Within the fixed income segment, exposure to the MFS Emerging Markets Debt Fund, MFS Emerging Markets Debt Local Currency Fund, and MFS High Income Fund supported relative performance.
-
Within the international equity segment, style selection contributed positively as exposure to emerging markets, value, growth, and small/mid-cap international strategies benefited relative results.
-
-
Top detractors from performance relative to the Blended Index:
-
Within the U.S. equity segment, lagging relative performance across the majority of the strategies weighed on relative results as the funds generally underperformed their respective benchmarks. Style selection also held back relative performance as mid-cap strategies underperformed the broader index.
-
Within the international equity segment, relative performance of the MFS International Growth Fund, MFS Research International Fund, and MFS International New Discovery Fund held back results as the funds lagged their respective benchmarks.
-
FUND PERFORMANCE
The fund’s past performance is not a good predictor of the fund’s future performance. The graph and table below do not reflect the deduction of taxes that a shareholder would pay on fund distributions or the redemption of fund shares. The graph and table below assume reinvestment of dividends and capital gain distributions.
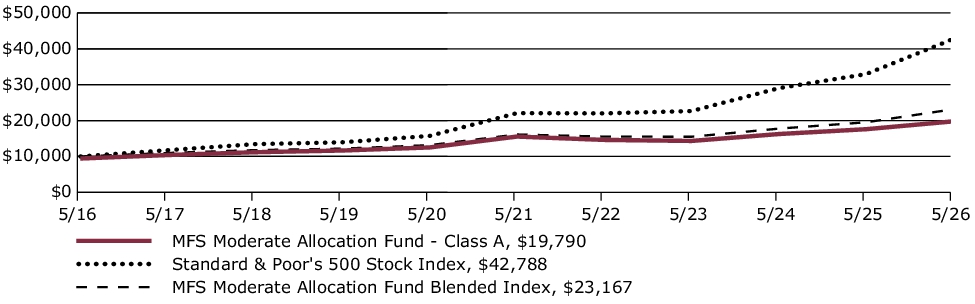
Growth of a Hypothetical $10,000 Investment
This graph shows the performance of a hypothetical $10,000 investment in Class A over a ten year period or since inception, if shorter, in comparison to (i) a broad measure of market performance and (ii) an additional index that MFS believes more closely reflects the market segments in which the fund invests. This graph includes the deduction of the maximum applicable sales charge.
Average Annual Total Returns through 5/31/26
This table shows the average annual total returns of the class of shares noted for the periods shown, both with (if any) and without sales charges. It also shows the average annual total returns of (i) a broad measure of market performance and (ii) an additional index that MFS believes more closely reflects the market segments in which the fund invests, over the same periods.
| Share Class | 1-yr | 5-yr | 10-yr |
| A without sales charge | 12.43% | 4.95% | 7.70% |
| A with initial sales charge (5.75%) | 5.96% | 3.71% | 7.06% |
| Comparative Benchmark(s) | |||
| Standard & Poor's 500 Stock Index ∆ | 29.78% | 14.15% | 15.65% |
| MFS Moderate Allocation Fund Blended Index ∆ | 18.60% | 7.52% | 8.76% |
|
∆
|
Source: FactSet Research Systems Inc.
|
Visit mfs.com/perf/a for more recent performance information.
FUND STATISTICS AS OF 5/31/26
| Net Assets ($): | 6,447,711,049 | Total Management Fee ($)#: | 0 | |
| Total Number of Holdings: | 23 | Portfolio Turnover Rate (%): | 4 |
# The fund itself does not pay a management fee but the underlying funds in which the fund invests do pay management fees to MFS.
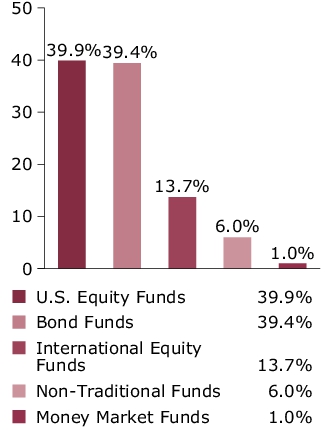
PORTFOLIO COMPOSITION (BASED ON TOTAL INVESTMENTS AS OF 5/31/26)
Portfolio allocation
Portfolio holdings
| MFS Government Securities Fund | 9.8% |
| MFS Total Return Bond Fund | 8.7% |
| MFS Value Fund | 8.0% |
| MFS Growth Fund | 7.4% |
| MFS Research Fund | 7.4% |
| MFS Mid Cap Value Fund | 7.1% |
| MFS Mid Cap Growth Fund | 7.0% |
| MFS Inflation-Adjusted Bond Fund | 6.9% |
| MFS Research International Fund | 5.2% |
| MFS Global Opportunistic Bond Fund | 5.0% |
| MFS High Income Fund | 4.0% |
| MFS Emerging Markets Debt Fund | 3.0% |
| MFS Global Real Estate Fund | 3.0% |
| MFS Commodity Strategy Fund | 3.0% |
| MFS International Large Cap Value Fund | 2.1% |
| MFS International Growth Fund | 2.1% |
| MFS International Intrinsic Equity Fund | 2.1% |
| MFS Emerging Markets Debt Local Currency Fund | 2.0% |
| MFS New Discovery Fund | 1.5% |
| MFS New Discovery Value Fund | 1.5% |
| MFS Emerging Markets Equity Fund | 1.1% |
| MFS International New Discovery Fund | 1.1% |
| MFS Institutional Money Market Portfolio | 1.0% |
FUND EXPENSES
What were the fund costs for the last year?
| (based on a hypothetical $10,000 investment) | ||
| Class Name | Costs of a $10,000 investment ~ | Costs paid as a percentage of a $10,000 investment ~ |
| B | $114 | 1.08% |
˜ Expenses are direct expenses and do not include underlying fund fees and expenses.
MANAGEMENT'S DISCUSSION OF FUND PERFORMANCE
-
For the twelve months ended May 31, 2026, Class B shares of the MFS Moderate Allocation Fund (fund) provided a total return of 11.53%, at net asset value. This compares with a return of 29.78% for the fund’s benchmark, the Standard & Poor's 500 Stock Index. The fund's other benchmark, the MFS Moderate Allocation Fund Blended Index (Blended Index), generated a return of 18.60%. The Blended Index reflects the blended returns of broad asset class indices, with percentage allocations to each index designed to resemble the long term strategic allocations of the fund. The market indices and related percentage allocations used to compile the Blended Index are set forth in the Fund Performance.
-
Global equity markets reached record levels during the period, withstanding considerable volatility amid tariffs, geopolitical conflict and high levels of uncertainty. A new geopolitical event distressed markets at the end of the period as US and Israeli forces launched strikes against Iran, disrupting Mideast oil and natural gas exports. During the period, a pro-growth tax and spending bill was signed into law in the US, while in Europe, renewed focus on defense and infrastructure spending brightened the economic outlook. In Japan, the election of a pro-growth prime minister sent stocks to new highs prior to the conflict in Iran. Optimism over artificial intelligence remained high.
-
Considerable progress was made in trade talks between the US and many major trading partners, with a fragile truce between the US and China extended through late 2026. While the US Supreme Court struck down part of the Trump administration’s tariff strategy, the administration began deploying other authorities to largely replace the ones that were ruled unconstitutional.
-
Early in the period, moderating inflation pressures allowed many global central banks to ease monetary policy. Amid a difficult policymaking environment and slower job growth, the Federal Reserve resumed easing policy in September and delivered quarter-point rate cuts in October and December before pausing.
-
In fixed income markets, previously range-bound global bond yields spiked following the onset of the Middle East conflict, as energy-driven inflation fears appeared to have rattled bond investors. US rate volatility (as measured by the Merrill Lynch Option Volatility Estimate (MOVE) Index) similarly rose from intra-period lows, reflecting uncertainty around the scope and duration of the conflict and its implications for global growth. However, volatility later retracted as the risk of a broader regional military escalation appeared less likely. Global credit spreads widened only modestly before stabilizing near prior levels, supported by strong demand and resilient underlying fundamentals.
-
Top contributors to performance relative to the Blended Index:
-
Within the fixed income segment, exposure to the MFS Emerging Markets Debt Fund, MFS Emerging Markets Debt Local Currency Fund, and MFS High Income Fund supported relative performance.
-
Within the international equity segment, style selection contributed positively as exposure to emerging markets, value, growth, and small/mid-cap international strategies benefited relative results.
-
-
Top detractors from performance relative to the Blended Index:
-
Within the U.S. equity segment, lagging relative performance across the majority of the strategies weighed on relative results as the funds generally underperformed their respective benchmarks. Style selection also held back relative performance as mid-cap strategies underperformed the broader index.
-
Within the international equity segment, relative performance of the MFS International Growth Fund, MFS Research International Fund, and MFS International New Discovery Fund held back results as the funds lagged their respective benchmarks.
-
FUND PERFORMANCE
The fund’s past performance is not a good predictor of the fund’s future performance. The graph and table below do not reflect the deduction of taxes that a shareholder would pay on fund distributions or the redemption of fund shares. The graph and table below assume reinvestment of dividends and capital gain distributions.
Growth of a Hypothetical $10,000 Investment
This graph shows the performance of a hypothetical $10,000 investment in Class B over a ten year period or since inception, if shorter, in comparison to (i) a broad measure of market performance and (ii) an additional index that MFS believes more closely reflects the market segments in which the fund invests.
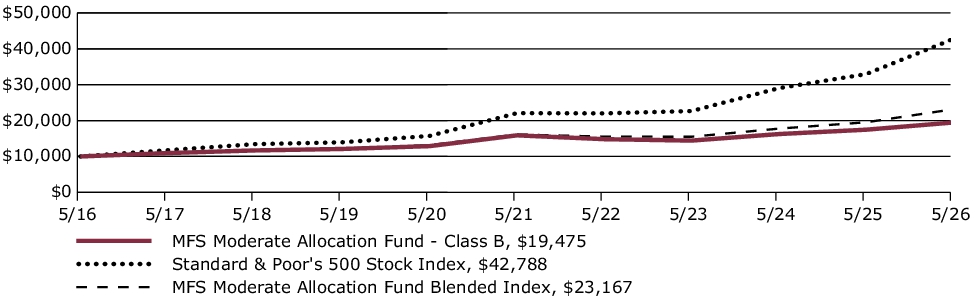
Average Annual Total Returns through 5/31/26
This table shows the average annual total returns of the class of shares noted for the periods shown, both with (if any) and without sales charges. It also shows the average annual total returns of (i) a broad measure of market performance and (ii) an additional index that MFS believes more closely reflects the market segments in which the fund invests, over the same periods.
| Share Class | 1-yr | 5-yr | 10-yr |
| B without sales charge | 11.53% | 4.16% | 6.89% |
| B with CDSC (declining over six years from 4% to 0%)× | 7.53% | 3.83% | 6.89% |
| Comparative Benchmark(s) | |||
| Standard & Poor's 500 Stock Index ∆ | 29.78% | 14.15% | 15.65% |
| MFS Moderate Allocation Fund Blended Index ∆ | 18.60% | 7.52% | 8.76% |
|
∆
|
Source: FactSet Research Systems Inc.
|
|
×
|
Assuming redemption at the end of the applicable period.
|
Visit mfs.com/perf/b for more recent performance information.
FUND STATISTICS AS OF 5/31/26
| Net Assets ($): | 6,447,711,049 | Total Management Fee ($)#: | 0 | |
| Total Number of Holdings: | 23 | Portfolio Turnover Rate (%): | 4 |
# The fund itself does not pay a management fee but the underlying funds in which the fund invests do pay management fees to MFS.
PORTFOLIO COMPOSITION (BASED ON TOTAL INVESTMENTS AS OF 5/31/26)
Portfolio allocation
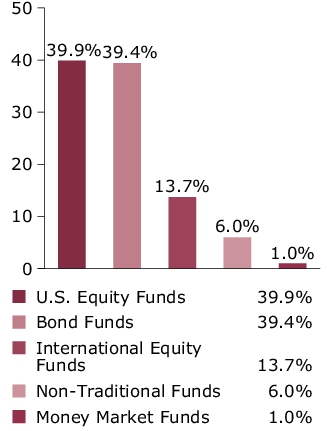
Portfolio holdings
| MFS Government Securities Fund | 9.8% |
| MFS Total Return Bond Fund | 8.7% |
| MFS Value Fund | 8.0% |
| MFS Growth Fund | 7.4% |
| MFS Research Fund | 7.4% |
| MFS Mid Cap Value Fund | 7.1% |
| MFS Mid Cap Growth Fund | 7.0% |
| MFS Inflation-Adjusted Bond Fund | 6.9% |
| MFS Research International Fund | 5.2% |
| MFS Global Opportunistic Bond Fund | 5.0% |
| MFS High Income Fund | 4.0% |
| MFS Emerging Markets Debt Fund | 3.0% |
| MFS Global Real Estate Fund | 3.0% |
| MFS Commodity Strategy Fund | 3.0% |
| MFS International Large Cap Value Fund | 2.1% |
| MFS International Growth Fund | 2.1% |
| MFS International Intrinsic Equity Fund | 2.1% |
| MFS Emerging Markets Debt Local Currency Fund | 2.0% |
| MFS New Discovery Fund | 1.5% |
| MFS New Discovery Value Fund | 1.5% |
| MFS Emerging Markets Equity Fund | 1.1% |
| MFS International New Discovery Fund | 1.1% |
| MFS Institutional Money Market Portfolio | 1.0% |
FUND EXPENSES
What were the fund costs for the last year?
| (based on a hypothetical $10,000 investment) | ||
| Class Name | Costs of a $10,000 investment ~ | Costs paid as a percentage of a $10,000 investment ~ |
| C | $114 | 1.08% |
˜ Expenses are direct expenses and do not include underlying fund fees and expenses.
MANAGEMENT'S DISCUSSION OF FUND PERFORMANCE
-
For the twelve months ended May 31, 2026, Class C shares of the MFS Moderate Allocation Fund (fund) provided a total return of 11.58%, at net asset value. This compares with a return of 29.78% for the fund’s benchmark, the Standard & Poor's 500 Stock Index. The fund's other benchmark, the MFS Moderate Allocation Fund Blended Index (Blended Index), generated a return of 18.60%. The Blended Index reflects the blended returns of broad asset class indices, with percentage allocations to each index designed to resemble the long term strategic allocations of the fund. The market indices and related percentage allocations used to compile the Blended Index are set forth in the Fund Performance.
-
Global equity markets reached record levels during the period, withstanding considerable volatility amid tariffs, geopolitical conflict and high levels of uncertainty. A new geopolitical event distressed markets at the end of the period as US and Israeli forces launched strikes against Iran, disrupting Mideast oil and natural gas exports. During the period, a pro-growth tax and spending bill was signed into law in the US, while in Europe, renewed focus on defense and infrastructure spending brightened the economic outlook. In Japan, the election of a pro-growth prime minister sent stocks to new highs prior to the conflict in Iran. Optimism over artificial intelligence remained high.
-
Considerable progress was made in trade talks between the US and many major trading partners, with a fragile truce between the US and China extended through late 2026. While the US Supreme Court struck down part of the Trump administration’s tariff strategy, the administration began deploying other authorities to largely replace the ones that were ruled unconstitutional.
-
Early in the period, moderating inflation pressures allowed many global central banks to ease monetary policy. Amid a difficult policymaking environment and slower job growth, the Federal Reserve resumed easing policy in September and delivered quarter-point rate cuts in October and December before pausing.
-
In fixed income markets, previously range-bound global bond yields spiked following the onset of the Middle East conflict, as energy-driven inflation fears appeared to have rattled bond investors. US rate volatility (as measured by the Merrill Lynch Option Volatility Estimate (MOVE) Index) similarly rose from intra-period lows, reflecting uncertainty around the scope and duration of the conflict and its implications for global growth. However, volatility later retracted as the risk of a broader regional military escalation appeared less likely. Global credit spreads widened only modestly before stabilizing near prior levels, supported by strong demand and resilient underlying fundamentals.
-
Top contributors to performance relative to the Blended Index:
-
Within the fixed income segment, exposure to the MFS Emerging Markets Debt Fund, MFS Emerging Markets Debt Local Currency Fund, and MFS High Income Fund supported relative performance.
-
Within the international equity segment, style selection contributed positively as exposure to emerging markets, value, growth, and small/mid-cap international strategies benefited relative results.
-
-
Top detractors from performance relative to the Blended Index:
-
Within the U.S. equity segment, lagging relative performance across the majority of the strategies weighed on relative results as the funds generally underperformed their respective benchmarks. Style selection also held back relative performance as mid-cap strategies underperformed the broader index.
-
Within the international equity segment, relative performance of the MFS International Growth Fund, MFS Research International Fund, and MFS International New Discovery Fund held back results as the funds lagged their respective benchmarks.
-
FUND PERFORMANCE
The fund’s past performance is not a good predictor of the fund’s future performance. The graph and table below do not reflect the deduction of taxes that a shareholder would pay on fund distributions or the redemption of fund shares. The graph and table below assume reinvestment of dividends and capital gain distributions.
Growth of a Hypothetical $10,000 Investment
This graph shows the performance of a hypothetical $10,000 investment in Class C over a ten year period or since inception, if shorter, in comparison to (i) a broad measure of market performance and (ii) an additional index that MFS believes more closely reflects the market segments in which the fund invests.
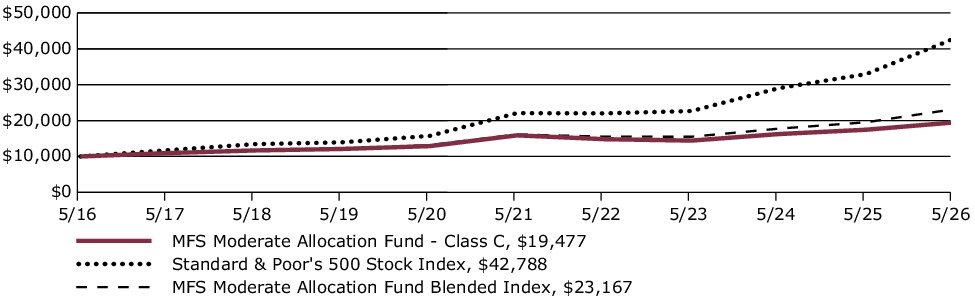
Average Annual Total Returns through 5/31/26
This table shows the average annual total returns of the class of shares noted for the periods shown, both with (if any) and without sales charges. It also shows the average annual total returns of (i) a broad measure of market performance and (ii) an additional index that MFS believes more closely reflects the market segments in which the fund invests, over the same periods.
| Share Class | 1-yr | 5-yr | 10-yr |
| C without sales charge | 11.58% | 4.17% | 6.89% |
| C with CDSC (1% for 12 months)× | 10.58% | 4.17% | 6.89% |
| Comparative Benchmark(s) | |||
| Standard & Poor's 500 Stock Index ∆ | 29.78% | 14.15% | 15.65% |
| MFS Moderate Allocation Fund Blended Index ∆ | 18.60% | 7.52% | 8.76% |
|
∆
|
Source: FactSet Research Systems Inc.
|
|
×
|
Assuming redemption at the end of the applicable period.
|
Visit mfs.com/perf/c for more recent performance information.
FUND STATISTICS AS OF 5/31/26
| Net Assets ($): | 6,447,711,049 | Total Management Fee ($)#: | 0 | |
| Total Number of Holdings: | 23 | Portfolio Turnover Rate (%): | 4 |
# The fund itself does not pay a management fee but the underlying funds in which the fund invests do pay management fees to MFS.
PORTFOLIO COMPOSITION (BASED ON TOTAL INVESTMENTS AS OF 5/31/26)
Portfolio allocation
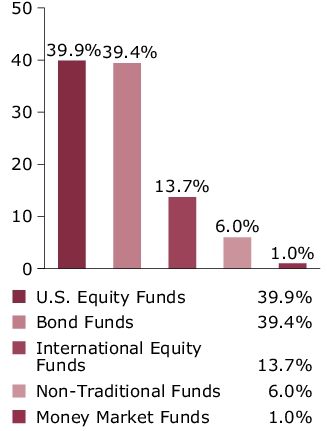
Portfolio holdings
| MFS Government Securities Fund | 9.8% |
| MFS Total Return Bond Fund | 8.7% |
| MFS Value Fund | 8.0% |
| MFS Growth Fund | 7.4% |
| MFS Research Fund | 7.4% |
| MFS Mid Cap Value Fund | 7.1% |
| MFS Mid Cap Growth Fund | 7.0% |
| MFS Inflation-Adjusted Bond Fund | 6.9% |
| MFS Research International Fund | 5.2% |
| MFS Global Opportunistic Bond Fund | 5.0% |
| MFS High Income Fund | 4.0% |
| MFS Emerging Markets Debt Fund | 3.0% |
| MFS Global Real Estate Fund | 3.0% |
| MFS Commodity Strategy Fund | 3.0% |
| MFS International Large Cap Value Fund | 2.1% |
| MFS International Growth Fund | 2.1% |
| MFS International Intrinsic Equity Fund | 2.1% |
| MFS Emerging Markets Debt Local Currency Fund | 2.0% |
| MFS New Discovery Fund | 1.5% |
| MFS New Discovery Value Fund | 1.5% |
| MFS Emerging Markets Equity Fund | 1.1% |
| MFS International New Discovery Fund | 1.1% |
| MFS Institutional Money Market Portfolio | 1.0% |
FUND EXPENSES
What were the fund costs for the last year?
| (based on a hypothetical $10,000 investment) | ||
| Class Name | Costs of a $10,000 investment ~ | Costs paid as a percentage of a $10,000 investment ~ |
| I | $9 | 0.08% |
˜ Expenses are direct expenses and do not include underlying fund fees and expenses.
MANAGEMENT'S DISCUSSION OF FUND PERFORMANCE
-
For the twelve months ended May 31, 2026, Class I shares of the MFS Moderate Allocation Fund (fund) provided a total return of 12.66%, at net asset value. This compares with a return of 29.78% for the fund’s benchmark, the Standard & Poor's 500 Stock Index. The fund's other benchmark, the MFS Moderate Allocation Fund Blended Index (Blended Index), generated a return of 18.60%. The Blended Index reflects the blended returns of broad asset class indices, with percentage allocations to each index designed to resemble the long term strategic allocations of the fund. The market indices and related percentage allocations used to compile the Blended Index are set forth in the Fund Performance.
-
Global equity markets reached record levels during the period, withstanding considerable volatility amid tariffs, geopolitical conflict and high levels of uncertainty. A new geopolitical event distressed markets at the end of the period as US and Israeli forces launched strikes against Iran, disrupting Mideast oil and natural gas exports. During the period, a pro-growth tax and spending bill was signed into law in the US, while in Europe, renewed focus on defense and infrastructure spending brightened the economic outlook. In Japan, the election of a pro-growth prime minister sent stocks to new highs prior to the conflict in Iran. Optimism over artificial intelligence remained high.
-
Considerable progress was made in trade talks between the US and many major trading partners, with a fragile truce between the US and China extended through late 2026. While the US Supreme Court struck down part of the Trump administration’s tariff strategy, the administration began deploying other authorities to largely replace the ones that were ruled unconstitutional.
-
Early in the period, moderating inflation pressures allowed many global central banks to ease monetary policy. Amid a difficult policymaking environment and slower job growth, the Federal Reserve resumed easing policy in September and delivered quarter-point rate cuts in October and December before pausing.
-
In fixed income markets, previously range-bound global bond yields spiked following the onset of the Middle East conflict, as energy-driven inflation fears appeared to have rattled bond investors. US rate volatility (as measured by the Merrill Lynch Option Volatility Estimate (MOVE) Index) similarly rose from intra-period lows, reflecting uncertainty around the scope and duration of the conflict and its implications for global growth. However, volatility later retracted as the risk of a broader regional military escalation appeared less likely. Global credit spreads widened only modestly before stabilizing near prior levels, supported by strong demand and resilient underlying fundamentals.
-
Top contributors to performance relative to the Blended Index:
-
Within the fixed income segment, exposure to the MFS Emerging Markets Debt Fund, MFS Emerging Markets Debt Local Currency Fund, and MFS High Income Fund supported relative performance.
-
Within the international equity segment, style selection contributed positively as exposure to emerging markets, value, growth, and small/mid-cap international strategies benefited relative results.
-
-
Top detractors from performance relative to the Blended Index:
-
Within the U.S. equity segment, lagging relative performance across the majority of the strategies weighed on relative results as the funds generally underperformed their respective benchmarks. Style selection also held back relative performance as mid-cap strategies underperformed the broader index.
-
Within the international equity segment, relative performance of the MFS International Growth Fund, MFS Research International Fund, and MFS International New Discovery Fund held back results as the funds lagged their respective benchmarks.
-
FUND PERFORMANCE
The fund’s past performance is not a good predictor of the fund’s future performance. The graph and table below do not reflect the deduction of taxes that a shareholder would pay on fund distributions or the redemption of fund shares. The graph and table below assume reinvestment of dividends and capital gain distributions.
Growth of a Hypothetical $10,000 Investment
This graph shows the performance of a hypothetical $10,000 investment in Class I over a ten year period or since inception, if shorter, in comparison to (i) a broad measure of market performance and (ii) an additional index that MFS believes more closely reflects the market segments in which the fund invests.
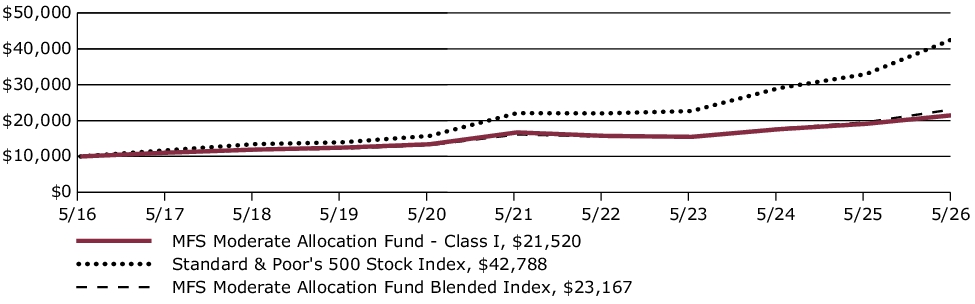
Average Annual Total Returns through 5/31/26
This table shows the average annual total returns of the class of shares noted for the periods shown, both with (if any) and without sales charges. It also shows the average annual total returns of (i) a broad measure of market performance and (ii) an additional index that MFS believes more closely reflects the market segments in which the fund invests, over the same periods.
| Share Class | 1-yr | 5-yr | 10-yr |
| I without sales charge | 12.66% | 5.21% | 7.97% |
| Comparative Benchmark(s) | |||
| Standard & Poor's 500 Stock Index ∆ | 29.78% | 14.15% | 15.65% |
| MFS Moderate Allocation Fund Blended Index ∆ | 18.60% | 7.52% | 8.76% |
|
∆
|
Source: FactSet Research Systems Inc.
|
Visit mfs.com/perf/i for more recent performance information.
FUND STATISTICS AS OF 5/31/26
| Net Assets ($): | 6,447,711,049 | Total Management Fee ($)#: | 0 | |
| Total Number of Holdings: | 23 | Portfolio Turnover Rate (%): | 4 |
# The fund itself does not pay a management fee but the underlying funds in which the fund invests do pay management fees to MFS.
PORTFOLIO COMPOSITION (BASED ON TOTAL INVESTMENTS AS OF 5/31/26)
Portfolio allocation
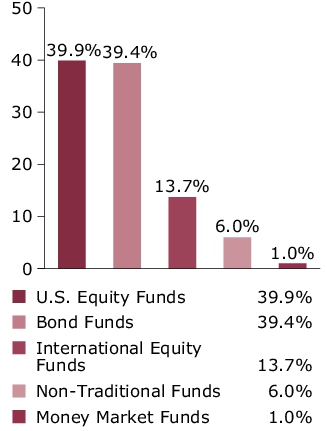
Portfolio holdings
| MFS Government Securities Fund | 9.8% |
| MFS Total Return Bond Fund | 8.7% |
| MFS Value Fund | 8.0% |
| MFS Growth Fund | 7.4% |
| MFS Research Fund | 7.4% |
| MFS Mid Cap Value Fund | 7.1% |
| MFS Mid Cap Growth Fund | 7.0% |
| MFS Inflation-Adjusted Bond Fund | 6.9% |
| MFS Research International Fund | 5.2% |
| MFS Global Opportunistic Bond Fund | 5.0% |
| MFS High Income Fund | 4.0% |
| MFS Emerging Markets Debt Fund | 3.0% |
| MFS Global Real Estate Fund | 3.0% |
| MFS Commodity Strategy Fund | 3.0% |
| MFS International Large Cap Value Fund | 2.1% |
| MFS International Growth Fund | 2.1% |
| MFS International Intrinsic Equity Fund | 2.1% |
| MFS Emerging Markets Debt Local Currency Fund | 2.0% |
| MFS New Discovery Fund | 1.5% |
| MFS New Discovery Value Fund | 1.5% |
| MFS Emerging Markets Equity Fund | 1.1% |
| MFS International New Discovery Fund | 1.1% |
| MFS Institutional Money Market Portfolio | 1.0% |
FUND EXPENSES
What were the fund costs for the last year?
| (based on a hypothetical $10,000 investment) | ||
| Class Name | Costs of a $10,000 investment ~ | Costs paid as a percentage of a $10,000 investment ~ |
| R1 | $114 | 1.08% |
˜ Expenses are direct expenses and do not include underlying fund fees and expenses.
MANAGEMENT'S DISCUSSION OF FUND PERFORMANCE
-
For the twelve months ended May 31, 2026, Class R1 shares of the MFS Moderate Allocation Fund (fund) provided a total return of 11.51%, at net asset value. This compares with a return of 29.78% for the fund’s benchmark, the Standard & Poor's 500 Stock Index. The fund's other benchmark, the MFS Moderate Allocation Fund Blended Index (Blended Index), generated a return of 18.60%. The Blended Index reflects the blended returns of broad asset class indices, with percentage allocations to each index designed to resemble the long term strategic allocations of the fund. The market indices and related percentage allocations used to compile the Blended Index are set forth in the Fund Performance.
-
Global equity markets reached record levels during the period, withstanding considerable volatility amid tariffs, geopolitical conflict and high levels of uncertainty. A new geopolitical event distressed markets at the end of the period as US and Israeli forces launched strikes against Iran, disrupting Mideast oil and natural gas exports. During the period, a pro-growth tax and spending bill was signed into law in the US, while in Europe, renewed focus on defense and infrastructure spending brightened the economic outlook. In Japan, the election of a pro-growth prime minister sent stocks to new highs prior to the conflict in Iran. Optimism over artificial intelligence remained high.
-
Considerable progress was made in trade talks between the US and many major trading partners, with a fragile truce between the US and China extended through late 2026. While the US Supreme Court struck down part of the Trump administration’s tariff strategy, the administration began deploying other authorities to largely replace the ones that were ruled unconstitutional.
-
Early in the period, moderating inflation pressures allowed many global central banks to ease monetary policy. Amid a difficult policymaking environment and slower job growth, the Federal Reserve resumed easing policy in September and delivered quarter-point rate cuts in October and December before pausing.
-
In fixed income markets, previously range-bound global bond yields spiked following the onset of the Middle East conflict, as energy-driven inflation fears appeared to have rattled bond investors. US rate volatility (as measured by the Merrill Lynch Option Volatility Estimate (MOVE) Index) similarly rose from intra-period lows, reflecting uncertainty around the scope and duration of the conflict and its implications for global growth. However, volatility later retracted as the risk of a broader regional military escalation appeared less likely. Global credit spreads widened only modestly before stabilizing near prior levels, supported by strong demand and resilient underlying fundamentals.
-
Top contributors to performance relative to the Blended Index:
-
Within the fixed income segment, exposure to the MFS Emerging Markets Debt Fund, MFS Emerging Markets Debt Local Currency Fund, and MFS High Income Fund supported relative performance.
-
Within the international equity segment, style selection contributed positively as exposure to emerging markets, value, growth, and small/mid-cap international strategies benefited relative results.
-
-
Top detractors from performance relative to the Blended Index:
-
Within the U.S. equity segment, lagging relative performance across the majority of the strategies weighed on relative results as the funds generally underperformed their respective benchmarks. Style selection also held back relative performance as mid-cap strategies underperformed the broader index.
-
Within the international equity segment, relative performance of the MFS International Growth Fund, MFS Research International Fund, and MFS International New Discovery Fund held back results as the funds lagged their respective benchmarks.
-
FUND PERFORMANCE
The fund’s past performance is not a good predictor of the fund’s future performance. The graph and table below do not reflect the deduction of taxes that a shareholder would pay on fund distributions or the redemption of fund shares. The graph and table below assume reinvestment of dividends and capital gain distributions.
Growth of a Hypothetical $10,000 Investment
This graph shows the performance of a hypothetical $10,000 investment in Class R1 over a ten year period or since inception, if shorter, in comparison to (i) a broad measure of market performance and (ii) an additional index that MFS believes more closely reflects the market segments in which the fund invests.
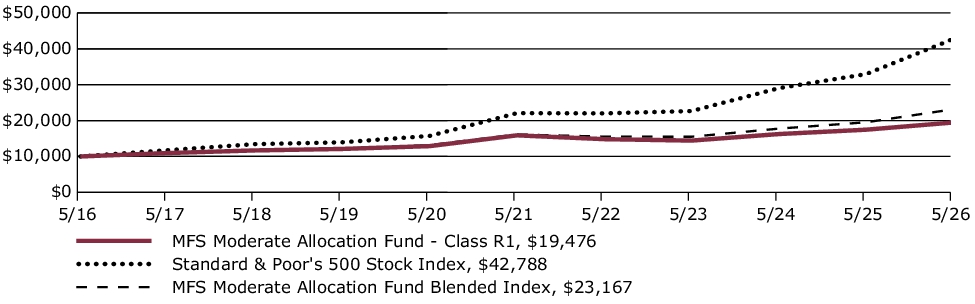
Average Annual Total Returns through 5/31/26
This table shows the average annual total returns of the class of shares noted for the periods shown, both with (if any) and without sales charges. It also shows the average annual total returns of (i) a broad measure of market performance and (ii) an additional index that MFS believes more closely reflects the market segments in which the fund invests, over the same periods.
| Share Class | 1-yr | 5-yr | 10-yr |
| R1 without sales charge | 11.51% | 4.16% | 6.89% |
| Comparative Benchmark(s) | |||
| Standard & Poor's 500 Stock Index ∆ | 29.78% | 14.15% | 15.65% |
| MFS Moderate Allocation Fund Blended Index ∆ | 18.60% | 7.52% | 8.76% |
|
∆
|
Source: FactSet Research Systems Inc.
|
Visit mfs.com/perf/r1 for more recent performance information.
FUND STATISTICS AS OF 5/31/26
| Net Assets ($): | 6,447,711,049 | Total Management Fee ($)#: | 0 | |
| Total Number of Holdings: | 23 | Portfolio Turnover Rate (%): | 4 |
# The fund itself does not pay a management fee but the underlying funds in which the fund invests do pay management fees to MFS.
PORTFOLIO COMPOSITION (BASED ON TOTAL INVESTMENTS AS OF 5/31/26)
Portfolio allocation
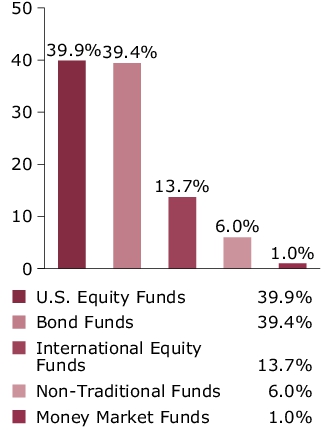
Portfolio holdings
| MFS Government Securities Fund | 9.8% |
| MFS Total Return Bond Fund | 8.7% |
| MFS Value Fund | 8.0% |
| MFS Growth Fund | 7.4% |
| MFS Research Fund | 7.4% |
| MFS Mid Cap Value Fund | 7.1% |
| MFS Mid Cap Growth Fund | 7.0% |
| MFS Inflation-Adjusted Bond Fund | 6.9% |
| MFS Research International Fund | 5.2% |
| MFS Global Opportunistic Bond Fund | 5.0% |
| MFS High Income Fund | 4.0% |
| MFS Emerging Markets Debt Fund | 3.0% |
| MFS Global Real Estate Fund | 3.0% |
| MFS Commodity Strategy Fund | 3.0% |
| MFS International Large Cap Value Fund | 2.1% |
| MFS International Growth Fund | 2.1% |
| MFS International Intrinsic Equity Fund | 2.1% |
| MFS Emerging Markets Debt Local Currency Fund | 2.0% |
| MFS New Discovery Fund | 1.5% |
| MFS New Discovery Value Fund | 1.5% |
| MFS Emerging Markets Equity Fund | 1.1% |
| MFS International New Discovery Fund | 1.1% |
| MFS Institutional Money Market Portfolio | 1.0% |
FUND EXPENSES
What were the fund costs for the last year?
| (based on a hypothetical $10,000 investment) | ||
| Class Name | Costs of a $10,000 investment ~ | Costs paid as a percentage of a $10,000 investment ~ |
| R2 | $62 | 0.58% |
˜ Expenses are direct expenses and do not include underlying fund fees and expenses.
MANAGEMENT'S DISCUSSION OF FUND PERFORMANCE
-
For the twelve months ended May 31, 2026, Class R2 shares of the MFS Moderate Allocation Fund (fund) provided a total return of 12.10%, at net asset value. This compares with a return of 29.78% for the fund’s benchmark, the Standard & Poor's 500 Stock Index. The fund's other benchmark, the MFS Moderate Allocation Fund Blended Index (Blended Index), generated a return of 18.60%. The Blended Index reflects the blended returns of broad asset class indices, with percentage allocations to each index designed to resemble the long term strategic allocations of the fund. The market indices and related percentage allocations used to compile the Blended Index are set forth in the Fund Performance.
-
Global equity markets reached record levels during the period, withstanding considerable volatility amid tariffs, geopolitical conflict and high levels of uncertainty. A new geopolitical event distressed markets at the end of the period as US and Israeli forces launched strikes against Iran, disrupting Mideast oil and natural gas exports. During the period, a pro-growth tax and spending bill was signed into law in the US, while in Europe, renewed focus on defense and infrastructure spending brightened the economic outlook. In Japan, the election of a pro-growth prime minister sent stocks to new highs prior to the conflict in Iran. Optimism over artificial intelligence remained high.
-
Considerable progress was made in trade talks between the US and many major trading partners, with a fragile truce between the US and China extended through late 2026. While the US Supreme Court struck down part of the Trump administration’s tariff strategy, the administration began deploying other authorities to largely replace the ones that were ruled unconstitutional.
-
Early in the period, moderating inflation pressures allowed many global central banks to ease monetary policy. Amid a difficult policymaking environment and slower job growth, the Federal Reserve resumed easing policy in September and delivered quarter-point rate cuts in October and December before pausing.
-
In fixed income markets, previously range-bound global bond yields spiked following the onset of the Middle East conflict, as energy-driven inflation fears appeared to have rattled bond investors. US rate volatility (as measured by the Merrill Lynch Option Volatility Estimate (MOVE) Index) similarly rose from intra-period lows, reflecting uncertainty around the scope and duration of the conflict and its implications for global growth. However, volatility later retracted as the risk of a broader regional military escalation appeared less likely. Global credit spreads widened only modestly before stabilizing near prior levels, supported by strong demand and resilient underlying fundamentals.
-
Top contributors to performance relative to the Blended Index:
-
Within the fixed income segment, exposure to the MFS Emerging Markets Debt Fund, MFS Emerging Markets Debt Local Currency Fund, and MFS High Income Fund supported relative performance.
-
Within the international equity segment, style selection contributed positively as exposure to emerging markets, value, growth, and small/mid-cap international strategies benefited relative results.
-
-
Top detractors from performance relative to the Blended Index:
-
Within the U.S. equity segment, lagging relative performance across the majority of the strategies weighed on relative results as the funds generally underperformed their respective benchmarks. Style selection also held back relative performance as mid-cap strategies underperformed the broader index.
-
Within the international equity segment, relative performance of the MFS International Growth Fund, MFS Research International Fund, and MFS International New Discovery Fund held back results as the funds lagged their respective benchmarks.
-
FUND PERFORMANCE
The fund’s past performance is not a good predictor of the fund’s future performance. The graph and table below do not reflect the deduction of taxes that a shareholder would pay on fund distributions or the redemption of fund shares. The graph and table below assume reinvestment of dividends and capital gain distributions.
Growth of a Hypothetical $10,000 Investment
This graph shows the performance of a hypothetical $10,000 investment in Class R2 over a ten year period or since inception, if shorter, in comparison to (i) a broad measure of market performance and (ii) an additional index that MFS believes more closely reflects the market segments in which the fund invests.
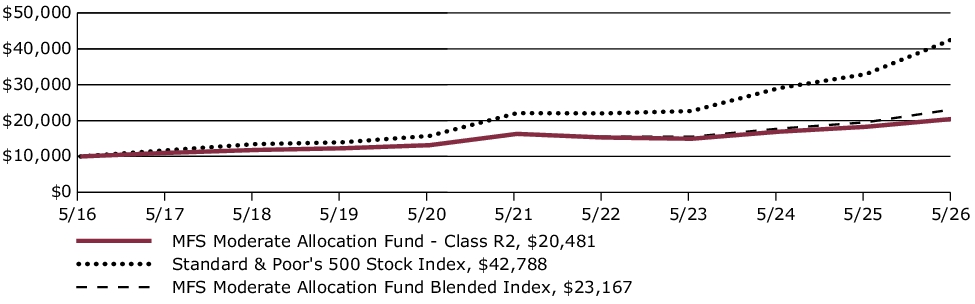
Average Annual Total Returns through 5/31/26
This table shows the average annual total returns of the class of shares noted for the periods shown, both with (if any) and without sales charges. It also shows the average annual total returns of (i) a broad measure of market performance and (ii) an additional index that MFS believes more closely reflects the market segments in which the fund invests, over the same periods.
| Share Class | 1-yr | 5-yr | 10-yr |
| R2 without sales charge | 12.10% | 4.68% | 7.43% |
| Comparative Benchmark(s) | |||
| Standard & Poor's 500 Stock Index ∆ | 29.78% | 14.15% | 15.65% |
| MFS Moderate Allocation Fund Blended Index ∆ | 18.60% | 7.52% | 8.76% |
|
∆
|
Source: FactSet Research Systems Inc.
|
Visit mfs.com/perf/r2 for more recent performance information.
FUND STATISTICS AS OF 5/31/26
| Net Assets ($): | 6,447,711,049 | Total Management Fee ($)#: | 0 | |
| Total Number of Holdings: | 23 | Portfolio Turnover Rate (%): | 4 |
# The fund itself does not pay a management fee but the underlying funds in which the fund invests do pay management fees to MFS.
PORTFOLIO COMPOSITION (BASED ON TOTAL INVESTMENTS AS OF 5/31/26)
Portfolio allocation
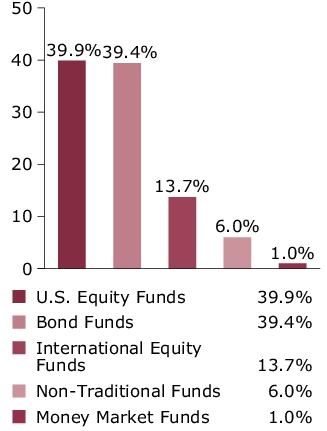
Portfolio holdings
| MFS Government Securities Fund | 9.8% |
| MFS Total Return Bond Fund | 8.7% |
| MFS Value Fund | 8.0% |
| MFS Growth Fund | 7.4% |
| MFS Research Fund | 7.4% |
| MFS Mid Cap Value Fund | 7.1% |
| MFS Mid Cap Growth Fund | 7.0% |
| MFS Inflation-Adjusted Bond Fund | 6.9% |
| MFS Research International Fund | 5.2% |
| MFS Global Opportunistic Bond Fund | 5.0% |
| MFS High Income Fund | 4.0% |
| MFS Emerging Markets Debt Fund | 3.0% |
| MFS Global Real Estate Fund | 3.0% |
| MFS Commodity Strategy Fund | 3.0% |
| MFS International Large Cap Value Fund | 2.1% |
| MFS International Growth Fund | 2.1% |
| MFS International Intrinsic Equity Fund | 2.1% |
| MFS Emerging Markets Debt Local Currency Fund | 2.0% |
| MFS New Discovery Fund | 1.5% |
| MFS New Discovery Value Fund | 1.5% |
| MFS Emerging Markets Equity Fund | 1.1% |
| MFS International New Discovery Fund | 1.1% |
| MFS Institutional Money Market Portfolio | 1.0% |
FUND EXPENSES
What were the fund costs for the last year?
| (based on a hypothetical $10,000 investment) | ||
| Class Name | Costs of a $10,000 investment ~ | Costs paid as a percentage of a $10,000 investment ~ |
| R3 | $35 | 0.33% |
˜ Expenses are direct expenses and do not include underlying fund fees and expenses.
MANAGEMENT'S DISCUSSION OF FUND PERFORMANCE
-
For the twelve months ended May 31, 2026, Class R3 shares of the MFS Moderate Allocation Fund (fund) provided a total return of 12.40%, at net asset value. This compares with a return of 29.78% for the fund’s benchmark, the Standard & Poor's 500 Stock Index. The fund's other benchmark, the MFS Moderate Allocation Fund Blended Index (Blended Index), generated a return of 18.60%. The Blended Index reflects the blended returns of broad asset class indices, with percentage allocations to each index designed to resemble the long term strategic allocations of the fund. The market indices and related percentage allocations used to compile the Blended Index are set forth in the Fund Performance.
-
Global equity markets reached record levels during the period, withstanding considerable volatility amid tariffs, geopolitical conflict and high levels of uncertainty. A new geopolitical event distressed markets at the end of the period as US and Israeli forces launched strikes against Iran, disrupting Mideast oil and natural gas exports. During the period, a pro-growth tax and spending bill was signed into law in the US, while in Europe, renewed focus on defense and infrastructure spending brightened the economic outlook. In Japan, the election of a pro-growth prime minister sent stocks to new highs prior to the conflict in Iran. Optimism over artificial intelligence remained high.
-
Considerable progress was made in trade talks between the US and many major trading partners, with a fragile truce between the US and China extended through late 2026. While the US Supreme Court struck down part of the Trump administration’s tariff strategy, the administration began deploying other authorities to largely replace the ones that were ruled unconstitutional.
-
Early in the period, moderating inflation pressures allowed many global central banks to ease monetary policy. Amid a difficult policymaking environment and slower job growth, the Federal Reserve resumed easing policy in September and delivered quarter-point rate cuts in October and December before pausing.
-
In fixed income markets, previously range-bound global bond yields spiked following the onset of the Middle East conflict, as energy-driven inflation fears appeared to have rattled bond investors. US rate volatility (as measured by the Merrill Lynch Option Volatility Estimate (MOVE) Index) similarly rose from intra-period lows, reflecting uncertainty around the scope and duration of the conflict and its implications for global growth. However, volatility later retracted as the risk of a broader regional military escalation appeared less likely. Global credit spreads widened only modestly before stabilizing near prior levels, supported by strong demand and resilient underlying fundamentals.
-
Top contributors to performance relative to the Blended Index:
-
Within the fixed income segment, exposure to the MFS Emerging Markets Debt Fund, MFS Emerging Markets Debt Local Currency Fund, and MFS High Income Fund supported relative performance.
-
Within the international equity segment, style selection contributed positively as exposure to emerging markets, value, growth, and small/mid-cap international strategies benefited relative results.
-
-
Top detractors from performance relative to the Blended Index:
-
Within the U.S. equity segment, lagging relative performance across the majority of the strategies weighed on relative results as the funds generally underperformed their respective benchmarks. Style selection also held back relative performance as mid-cap strategies underperformed the broader index.
-
Within the international equity segment, relative performance of the MFS International Growth Fund, MFS Research International Fund, and MFS International New Discovery Fund held back results as the funds lagged their respective benchmarks.
-
FUND PERFORMANCE
The fund’s past performance is not a good predictor of the fund’s future performance. The graph and table below do not reflect the deduction of taxes that a shareholder would pay on fund distributions or the redemption of fund shares. The graph and table below assume reinvestment of dividends and capital gain distributions.
Growth of a Hypothetical $10,000 Investment
This graph shows the performance of a hypothetical $10,000 investment in Class R3 over a ten year period or since inception, if shorter, in comparison to (i) a broad measure of market performance and (ii) an additional index that MFS believes more closely reflects the market segments in which the fund invests.
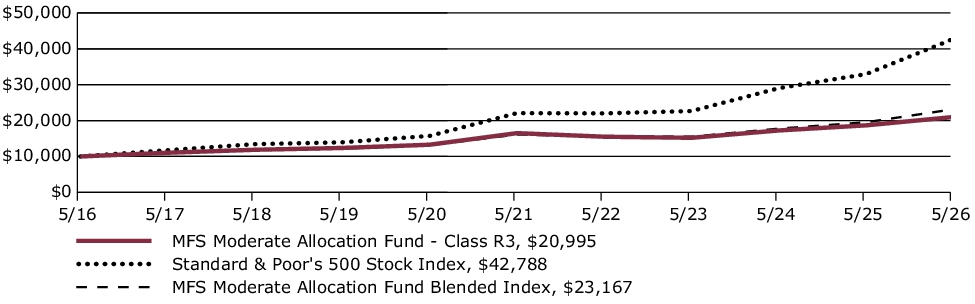
Average Annual Total Returns through 5/31/26
This table shows the average annual total returns of the class of shares noted for the periods shown, both with (if any) and without sales charges. It also shows the average annual total returns of (i) a broad measure of market performance and (ii) an additional index that MFS believes more closely reflects the market segments in which the fund invests, over the same periods.
| Share Class | 1-yr | 5-yr | 10-yr |
| R3 without sales charge | 12.40% | 4.94% | 7.70% |
| Comparative Benchmark(s) | |||
| Standard & Poor's 500 Stock Index ∆ | 29.78% | 14.15% | 15.65% |
| MFS Moderate Allocation Fund Blended Index ∆ | 18.60% | 7.52% | 8.76% |
|
∆
|
Source: FactSet Research Systems Inc.
|
Visit mfs.com/perf/r3 for more recent performance information.
FUND STATISTICS AS OF 5/31/26
| Net Assets ($): | 6,447,711,049 | Total Management Fee ($)#: | 0 | |
| Total Number of Holdings: | 23 | Portfolio Turnover Rate (%): | 4 |
# The fund itself does not pay a management fee but the underlying funds in which the fund invests do pay management fees to MFS.
PORTFOLIO COMPOSITION (BASED ON TOTAL INVESTMENTS AS OF 5/31/26)
Portfolio allocation
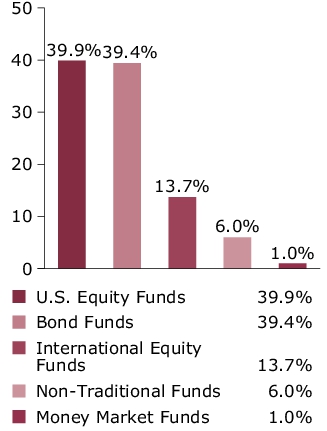
Portfolio holdings
| MFS Government Securities Fund | 9.8% |
| MFS Total Return Bond Fund | 8.7% |
| MFS Value Fund | 8.0% |
| MFS Growth Fund | 7.4% |
| MFS Research Fund | 7.4% |
| MFS Mid Cap Value Fund | 7.1% |
| MFS Mid Cap Growth Fund | 7.0% |
| MFS Inflation-Adjusted Bond Fund | 6.9% |
| MFS Research International Fund | 5.2% |
| MFS Global Opportunistic Bond Fund | 5.0% |
| MFS High Income Fund | 4.0% |
| MFS Emerging Markets Debt Fund | 3.0% |
| MFS Global Real Estate Fund | 3.0% |
| MFS Commodity Strategy Fund | 3.0% |
| MFS International Large Cap Value Fund | 2.1% |
| MFS International Growth Fund | 2.1% |
| MFS International Intrinsic Equity Fund | 2.1% |
| MFS Emerging Markets Debt Local Currency Fund | 2.0% |
| MFS New Discovery Fund | 1.5% |
| MFS New Discovery Value Fund | 1.5% |
| MFS Emerging Markets Equity Fund | 1.1% |
| MFS International New Discovery Fund | 1.1% |
| MFS Institutional Money Market Portfolio | 1.0% |
FUND EXPENSES
What were the fund costs for the last year?
| (based on a hypothetical $10,000 investment) | ||
| Class Name | Costs of a $10,000 investment ~ | Costs paid as a percentage of a $10,000 investment ~ |
| R4 | $9 | 0.08% |
˜ Expenses are direct expenses and do not include underlying fund fees and expenses.
MANAGEMENT'S DISCUSSION OF FUND PERFORMANCE
-
For the twelve months ended May 31, 2026, Class R4 shares of the MFS Moderate Allocation Fund (fund) provided a total return of 12.68%, at net asset value. This compares with a return of 29.78% for the fund’s benchmark, the Standard & Poor's 500 Stock Index. The fund's other benchmark, the MFS Moderate Allocation Fund Blended Index (Blended Index), generated a return of 18.60%. The Blended Index reflects the blended returns of broad asset class indices, with percentage allocations to each index designed to resemble the long term strategic allocations of the fund. The market indices and related percentage allocations used to compile the Blended Index are set forth in the Fund Performance.
-
Global equity markets reached record levels during the period, withstanding considerable volatility amid tariffs, geopolitical conflict and high levels of uncertainty. A new geopolitical event distressed markets at the end of the period as US and Israeli forces launched strikes against Iran, disrupting Mideast oil and natural gas exports. During the period, a pro-growth tax and spending bill was signed into law in the US, while in Europe, renewed focus on defense and infrastructure spending brightened the economic outlook. In Japan, the election of a pro-growth prime minister sent stocks to new highs prior to the conflict in Iran. Optimism over artificial intelligence remained high.
-
Considerable progress was made in trade talks between the US and many major trading partners, with a fragile truce between the US and China extended through late 2026. While the US Supreme Court struck down part of the Trump administration’s tariff strategy, the administration began deploying other authorities to largely replace the ones that were ruled unconstitutional.
-
Early in the period, moderating inflation pressures allowed many global central banks to ease monetary policy. Amid a difficult policymaking environment and slower job growth, the Federal Reserve resumed easing policy in September and delivered quarter-point rate cuts in October and December before pausing.
-
In fixed income markets, previously range-bound global bond yields spiked following the onset of the Middle East conflict, as energy-driven inflation fears appeared to have rattled bond investors. US rate volatility (as measured by the Merrill Lynch Option Volatility Estimate (MOVE) Index) similarly rose from intra-period lows, reflecting uncertainty around the scope and duration of the conflict and its implications for global growth. However, volatility later retracted as the risk of a broader regional military escalation appeared less likely. Global credit spreads widened only modestly before stabilizing near prior levels, supported by strong demand and resilient underlying fundamentals.
-
Top contributors to performance relative to the Blended Index:
-
Within the fixed income segment, exposure to the MFS Emerging Markets Debt Fund, MFS Emerging Markets Debt Local Currency Fund, and MFS High Income Fund supported relative performance.
-
Within the international equity segment, style selection contributed positively as exposure to emerging markets, value, growth, and small/mid-cap international strategies benefited relative results.
-
-
Top detractors from performance relative to the Blended Index:
-
Within the U.S. equity segment, lagging relative performance across the majority of the strategies weighed on relative results as the funds generally underperformed their respective benchmarks. Style selection also held back relative performance as mid-cap strategies underperformed the broader index.
-
Within the international equity segment, relative performance of the MFS International Growth Fund, MFS Research International Fund, and MFS International New Discovery Fund held back results as the funds lagged their respective benchmarks.
-
FUND PERFORMANCE
The fund’s past performance is not a good predictor of the fund’s future performance. The graph and table below do not reflect the deduction of taxes that a shareholder would pay on fund distributions or the redemption of fund shares. The graph and table below assume reinvestment of dividends and capital gain distributions.
Growth of a Hypothetical $10,000 Investment
This graph shows the performance of a hypothetical $10,000 investment in Class R4 over a ten year period or since inception, if shorter, in comparison to (i) a broad measure of market performance and (ii) an additional index that MFS believes more closely reflects the market segments in which the fund invests.
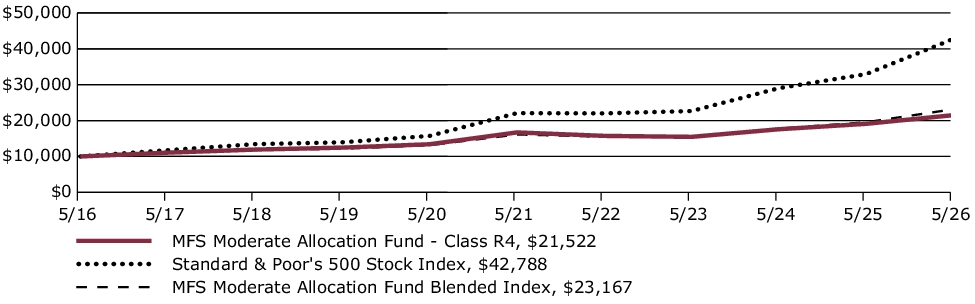
Average Annual Total Returns through 5/31/26
This table shows the average annual total returns of the class of shares noted for the periods shown, both with (if any) and without sales charges. It also shows the average annual total returns of (i) a broad measure of market performance and (ii) an additional index that MFS believes more closely reflects the market segments in which the fund invests, over the same periods.
| Share Class | 1-yr | 5-yr | 10-yr |
| R4 without sales charge | 12.68% | 5.20% | 7.97% |
| Comparative Benchmark(s) | |||
| Standard & Poor's 500 Stock Index ∆ | 29.78% | 14.15% | 15.65% |
| MFS Moderate Allocation Fund Blended Index ∆ | 18.60% | 7.52% | 8.76% |
|
∆
|
Source: FactSet Research Systems Inc.
|
Visit mfs.com/perf/r4 for more recent performance information.
FUND STATISTICS AS OF 5/31/26
| Net Assets ($): | 6,447,711,049 | Total Management Fee ($)#: | 0 | |
| Total Number of Holdings: | 23 | Portfolio Turnover Rate (%): | 4 |
# The fund itself does not pay a management fee but the underlying funds in which the fund invests do pay management fees to MFS.
PORTFOLIO COMPOSITION (BASED ON TOTAL INVESTMENTS AS OF 5/31/26)
Portfolio allocation
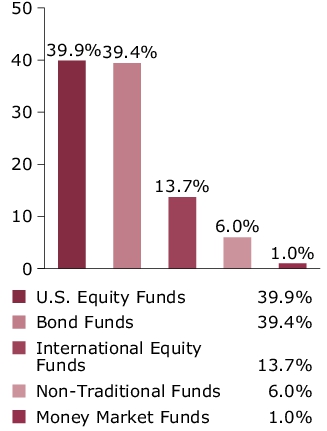
Portfolio holdings
| MFS Government Securities Fund | 9.8% |
| MFS Total Return Bond Fund | 8.7% |
| MFS Value Fund | 8.0% |
| MFS Growth Fund | 7.4% |
| MFS Research Fund | 7.4% |
| MFS Mid Cap Value Fund | 7.1% |
| MFS Mid Cap Growth Fund | 7.0% |
| MFS Inflation-Adjusted Bond Fund | 6.9% |
| MFS Research International Fund | 5.2% |
| MFS Global Opportunistic Bond Fund | 5.0% |
| MFS High Income Fund | 4.0% |
| MFS Emerging Markets Debt Fund | 3.0% |
| MFS Global Real Estate Fund | 3.0% |
| MFS Commodity Strategy Fund | 3.0% |
| MFS International Large Cap Value Fund | 2.1% |
| MFS International Growth Fund | 2.1% |
| MFS International Intrinsic Equity Fund | 2.1% |
| MFS Emerging Markets Debt Local Currency Fund | 2.0% |
| MFS New Discovery Fund | 1.5% |
| MFS New Discovery Value Fund | 1.5% |
| MFS Emerging Markets Equity Fund | 1.1% |
| MFS International New Discovery Fund | 1.1% |
| MFS Institutional Money Market Portfolio | 1.0% |
FUND EXPENSES
What were the fund costs for the last year?
| (based on a hypothetical $10,000 investment) | ||
| Class Name | Costs of a $10,000 investment ~ | Costs paid as a percentage of a $10,000 investment ~ |
| R6 | $2 | 0.02% |
˜ Expenses are direct expenses and do not include underlying fund fees and expenses.
MANAGEMENT'S DISCUSSION OF FUND PERFORMANCE
-
For the twelve months ended May 31, 2026, Class R6 shares of the MFS Moderate Allocation Fund (fund) provided a total return of 12.74%, at net asset value. This compares with a return of 29.78% for the fund’s benchmark, the Standard & Poor's 500 Stock Index. The fund's other benchmark, the MFS Moderate Allocation Fund Blended Index (Blended Index), generated a return of 18.60%. The Blended Index reflects the blended returns of broad asset class indices, with percentage allocations to each index designed to resemble the long term strategic allocations of the fund. The market indices and related percentage allocations used to compile the Blended Index are set forth in the Fund Performance.
-
Global equity markets reached record levels during the period, withstanding considerable volatility amid tariffs, geopolitical conflict and high levels of uncertainty. A new geopolitical event distressed markets at the end of the period as US and Israeli forces launched strikes against Iran, disrupting Mideast oil and natural gas exports. During the period, a pro-growth tax and spending bill was signed into law in the US, while in Europe, renewed focus on defense and infrastructure spending brightened the economic outlook. In Japan, the election of a pro-growth prime minister sent stocks to new highs prior to the conflict in Iran. Optimism over artificial intelligence remained high.
-
Considerable progress was made in trade talks between the US and many major trading partners, with a fragile truce between the US and China extended through late 2026. While the US Supreme Court struck down part of the Trump administration’s tariff strategy, the administration began deploying other authorities to largely replace the ones that were ruled unconstitutional.
-
Early in the period, moderating inflation pressures allowed many global central banks to ease monetary policy. Amid a difficult policymaking environment and slower job growth, the Federal Reserve resumed easing policy in September and delivered quarter-point rate cuts in October and December before pausing.
-
In fixed income markets, previously range-bound global bond yields spiked following the onset of the Middle East conflict, as energy-driven inflation fears appeared to have rattled bond investors. US rate volatility (as measured by the Merrill Lynch Option Volatility Estimate (MOVE) Index) similarly rose from intra-period lows, reflecting uncertainty around the scope and duration of the conflict and its implications for global growth. However, volatility later retracted as the risk of a broader regional military escalation appeared less likely. Global credit spreads widened only modestly before stabilizing near prior levels, supported by strong demand and resilient underlying fundamentals.
-
Top contributors to performance relative to the Blended Index:
-
Within the fixed income segment, exposure to the MFS Emerging Markets Debt Fund, MFS Emerging Markets Debt Local Currency Fund, and MFS High Income Fund supported relative performance.
-
Within the international equity segment, style selection contributed positively as exposure to emerging markets, value, growth, and small/mid-cap international strategies benefited relative results.
-
-
Top detractors from performance relative to the Blended Index:
-
Within the U.S. equity segment, lagging relative performance across the majority of the strategies weighed on relative results as the funds generally underperformed their respective benchmarks. Style selection also held back relative performance as mid-cap strategies underperformed the broader index.
-
Within the international equity segment, relative performance of the MFS International Growth Fund, MFS Research International Fund, and MFS International New Discovery Fund held back results as the funds lagged their respective benchmarks.
-
FUND PERFORMANCE
The fund’s past performance is not a good predictor of the fund’s future performance. The graph and table below do not reflect the deduction of taxes that a shareholder would pay on fund distributions or the redemption of fund shares. The graph and table below assume reinvestment of dividends and capital gain distributions.
Growth of a Hypothetical $10,000 Investment*
This graph shows the performance of a hypothetical $10,000 investment in Class R6 over a ten year period or since inception, if shorter, in comparison to (i) a broad measure of market performance and (ii) an additional index that MFS believes more closely reflects the market segments in which the fund invests.
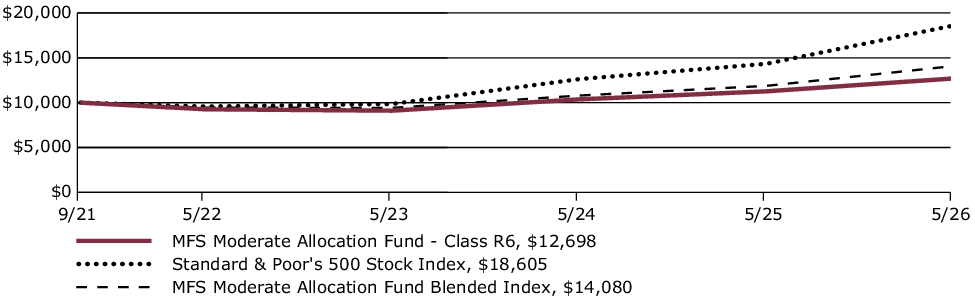
Average Annual Total Returns through 5/31/26
This table shows the average annual total returns of the class of shares noted for the periods shown, both with (if any) and without sales charges. It also shows the average annual total returns of (i) a broad measure of market performance and (ii) an additional index that MFS believes more closely reflects the market segments in which the fund invests, over the same periods.
| Share Class | 1-yr | Life* |
| R6 without sales charge | 12.74% | 5.25% |
| Comparative Benchmark(s) | ||
| Standard & Poor's 500 Stock Index ∆ | 29.78% | 14.21% |
| MFS Moderate Allocation Fund Blended Index ∆ | 18.60% | 7.60% |
|
*
|
For the period from the commencement of the class's investment operations, September 30, 2021 through May 31, 2026.
|
|
∆
|
Source: FactSet Research Systems Inc.
|
Visit mfs.com/perf/r6 for more recent performance information.
FUND STATISTICS AS OF 5/31/26
| Net Assets ($): | 6,447,711,049 | Total Management Fee ($)#: | 0 | |
| Total Number of Holdings: | 23 | Portfolio Turnover Rate (%): | 4 |
# The fund itself does not pay a management fee but the underlying funds in which the fund invests do pay management fees to MFS.
PORTFOLIO COMPOSITION (BASED ON TOTAL INVESTMENTS AS OF 5/31/26)
Portfolio allocation
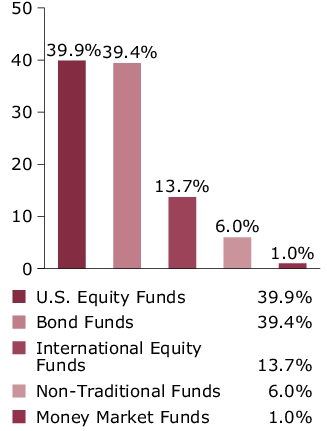
Portfolio holdings
| MFS Government Securities Fund | 9.8% |
| MFS Total Return Bond Fund | 8.7% |
| MFS Value Fund | 8.0% |
| MFS Growth Fund | 7.4% |
| MFS Research Fund | 7.4% |
| MFS Mid Cap Value Fund | 7.1% |
| MFS Mid Cap Growth Fund | 7.0% |
| MFS Inflation-Adjusted Bond Fund | 6.9% |
| MFS Research International Fund | 5.2% |
| MFS Global Opportunistic Bond Fund | 5.0% |
| MFS High Income Fund | 4.0% |
| MFS Emerging Markets Debt Fund | 3.0% |
| MFS Global Real Estate Fund | 3.0% |
| MFS Commodity Strategy Fund | 3.0% |
| MFS International Large Cap Value Fund | 2.1% |
| MFS International Growth Fund | 2.1% |
| MFS International Intrinsic Equity Fund | 2.1% |
| MFS Emerging Markets Debt Local Currency Fund | 2.0% |
| MFS New Discovery Fund | 1.5% |
| MFS New Discovery Value Fund | 1.5% |
| MFS Emerging Markets Equity Fund | 1.1% |
| MFS International New Discovery Fund | 1.1% |
| MFS Institutional Money Market Portfolio | 1.0% |
FUND EXPENSES
What were the fund costs for the last year?
| (based on a hypothetical $10,000 investment) | ||
| Class Name | Costs of a $10,000 investment ~ | Costs paid as a percentage of a $10,000 investment ~ |
| R6 | $3 | 0.03% |
˜ Expenses are direct expenses and do not include underlying fund fees and expenses.
MANAGEMENT'S DISCUSSION OF FUND PERFORMANCE
-
For the twelve months ended May 31, 2026, Class R6 shares of the MFS Conservative Allocation Fund (fund) provided a total return of 9.94%, at net asset value. This compares with a return of 5.13% for the fund’s benchmark, the Bloomberg U.S. Aggregate Bond Index. The fund's other benchmark, the MFS Conservative Allocation Fund Blended Index (Blended Index), generated a return of 14.03%. The Blended Index reflects the blended returns of broad asset class indices, with percentage allocations to each index designed to resemble the long term strategic allocations of the fund. The market indices and related percentage allocations used to compile the Blended Index are set forth in the Fund Performance.
-
Global equity markets reached record levels during the period, withstanding considerable volatility amid tariffs, geopolitical conflict and high levels of uncertainty. A new geopolitical event distressed markets at the end of the period as US and Israeli forces launched strikes against Iran, disrupting Mideast oil and natural gas exports. During the period, a pro-growth tax and spending bill was signed into law in the US, while in Europe, renewed focus on defense and infrastructure spending brightened the economic outlook. In Japan, the election of a pro-growth prime minister sent stocks to new highs prior to the conflict in Iran. Optimism over artificial intelligence remained high.
-
Considerable progress was made in trade talks between the US and many major trading partners, with a fragile truce between the US and China extended through late 2026. While the US Supreme Court struck down part of the Trump administration’s tariff strategy, the administration began deploying other authorities to largely replace the ones that were ruled unconstitutional.
-
Early in the period, moderating inflation pressures allowed many global central banks to ease monetary policy. Amid a difficult policymaking environment and slower job growth, the Federal Reserve resumed easing policy in September and delivered quarter-point rate cuts in October and December before pausing.
-
In fixed income markets, previously range-bound global bond yields spiked following the onset of the Middle East conflict, as energy-driven inflation fears appeared to have rattled bond investors. US rate volatility (as measured by the Merrill Lynch Option Volatility Estimate (MOVE) Index) similarly rose from intra-period lows, reflecting uncertainty around the scope and duration of the conflict and its implications for global growth. However, volatility later retracted as the risk of a broader regional military escalation appeared less likely. Global credit spreads widened only modestly before stabilizing near prior levels, supported by strong demand and resilient underlying fundamentals.
-
Top contributors to performance relative to the Blended Index:
-
Within the fixed income segment, exposure to the MFS Emerging Markets Debt Fund, MFS Emerging Markets Debt Local Currency Fund, and MFS High Income Fund supported relative performance.
-
-
Top detractors from performance relative to the Blended Index:
-
Within the U.S. equity segment, lagging relative performance across the majority of the strategies weighed on relative results as the funds generally underperformed their respective benchmarks. Style selection also held back relative performance as mid-cap strategies underperformed the broader index.
-
Within the international equity segment, relative performance of both the MFS International Growth Fund and MFS Research International Fund held back performance as the funds lagged their respective benchmarks.
-
FUND PERFORMANCE
The fund’s past performance is not a good predictor of the fund’s future performance. The graph and table below do not reflect the deduction of taxes that a shareholder would pay on fund distributions or the redemption of fund shares. The graph and table below assume reinvestment of dividends and capital gain distributions.
Growth of a Hypothetical $10,000 Investment*
This graph shows the performance of a hypothetical $10,000 investment in Class R6 over a ten year period or since inception, if shorter, in comparison to (i) a broad measure of market performance and (ii) an additional index that MFS believes more closely reflects the market segments in which the fund invests.
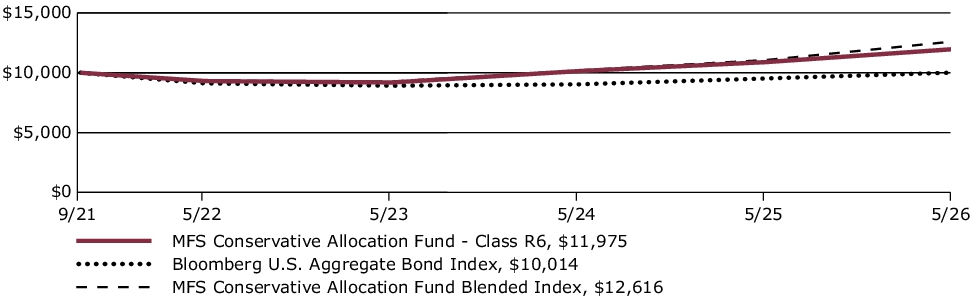
Average Annual Total Returns through 5/31/26
This table shows the average annual total returns of the class of shares noted for the periods shown, both with (if any) and without sales charges. It also shows the average annual total returns of (i) a broad measure of market performance and (ii) an additional index that MFS believes more closely reflects the market segments in which the fund invests, over the same periods.
| Share Class | 1-yr | Life* |
| R6 without sales charge | 9.94% | 3.94% |
| Comparative Benchmark(s) | ||
| Bloomberg U.S. Aggregate Bond Index ∆ | 5.13% | 0.03% |
| MFS Conservative Allocation Fund Blended Index ∆ | 14.03% | 5.10% |
|
*
|
For the period from the commencement of the class's investment operations, September 30, 2021 through May 31, 2026.
|
|
∆
|
Source: FactSet Research Systems Inc.
|
Visit mfs.com/perf/r6 for more recent performance information.
FUND STATISTICS AS OF 5/31/26
| Net Assets ($): | 3,604,133,279 | Total Management Fee ($)#: | 0 | |
| Total Number of Holdings: | 22 | Portfolio Turnover Rate (%): | 4 |
# The fund itself does not pay a management fee but the underlying funds in which the fund invests do pay management fees to MFS.
PORTFOLIO COMPOSITION (BASED ON TOTAL INVESTMENTS AS OF 5/31/26)
Portfolio allocation
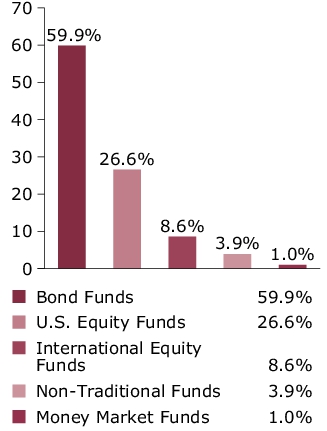
Portfolio holdings
| MFS Total Return Bond Fund | 15.0% |
| MFS Inflation-Adjusted Bond Fund | 10.0% |
| MFS Limited Maturity Fund | 10.0% |
| MFS Government Securities Fund | 9.9% |
| MFS Global Opportunistic Bond Fund | 7.0% |
| MFS Value Fund | 6.0% |
| MFS Growth Fund | 5.3% |
| MFS Research Fund | 5.3% |
| MFS Mid Cap Growth Fund | 4.0% |
| MFS Mid Cap Value Fund | 4.0% |
| MFS High Income Fund | 4.0% |
| MFS Research International Fund | 3.8% |
| MFS Emerging Markets Debt Fund | 2.0% |
| MFS Emerging Markets Debt Local Currency Fund | 2.0% |
| MFS Global Real Estate Fund | 2.0% |
| MFS Commodity Strategy Fund | 1.9% |
| MFS International Growth Fund | 1.6% |
| MFS International Intrinsic Equity Fund | 1.6% |
| MFS International Large Cap Value Fund | 1.6% |
| MFS New Discovery Fund | 1.0% |
| MFS New Discovery Value Fund | 1.0% |
| MFS Institutional Money Market Portfolio | 1.0% |
FUND EXPENSES
What were the fund costs for the last year?
| (based on a hypothetical $10,000 investment) | ||
| Class Name | Costs of a $10,000 investment ~ | Costs paid as a percentage of a $10,000 investment ~ |
| R4 | $9 | 0.09% |
˜ Expenses are direct expenses and do not include underlying fund fees and expenses.
MANAGEMENT'S DISCUSSION OF FUND PERFORMANCE
-
For the twelve months ended May 31, 2026, Class R4 shares of the MFS Conservative Allocation Fund (fund) provided a total return of 9.86%, at net asset value. This compares with a return of 5.13% for the fund’s benchmark, the Bloomberg U.S. Aggregate Bond Index. The fund's other benchmark, the MFS Conservative Allocation Fund Blended Index (Blended Index), generated a return of 14.03%. The Blended Index reflects the blended returns of broad asset class indices, with percentage allocations to each index designed to resemble the long term strategic allocations of the fund. The market indices and related percentage allocations used to compile the Blended Index are set forth in the Fund Performance.
-
Global equity markets reached record levels during the period, withstanding considerable volatility amid tariffs, geopolitical conflict and high levels of uncertainty. A new geopolitical event distressed markets at the end of the period as US and Israeli forces launched strikes against Iran, disrupting Mideast oil and natural gas exports. During the period, a pro-growth tax and spending bill was signed into law in the US, while in Europe, renewed focus on defense and infrastructure spending brightened the economic outlook. In Japan, the election of a pro-growth prime minister sent stocks to new highs prior to the conflict in Iran. Optimism over artificial intelligence remained high.
-
Considerable progress was made in trade talks between the US and many major trading partners, with a fragile truce between the US and China extended through late 2026. While the US Supreme Court struck down part of the Trump administration’s tariff strategy, the administration began deploying other authorities to largely replace the ones that were ruled unconstitutional.
-
Early in the period, moderating inflation pressures allowed many global central banks to ease monetary policy. Amid a difficult policymaking environment and slower job growth, the Federal Reserve resumed easing policy in September and delivered quarter-point rate cuts in October and December before pausing.
-
In fixed income markets, previously range-bound global bond yields spiked following the onset of the Middle East conflict, as energy-driven inflation fears appeared to have rattled bond investors. US rate volatility (as measured by the Merrill Lynch Option Volatility Estimate (MOVE) Index) similarly rose from intra-period lows, reflecting uncertainty around the scope and duration of the conflict and its implications for global growth. However, volatility later retracted as the risk of a broader regional military escalation appeared less likely. Global credit spreads widened only modestly before stabilizing near prior levels, supported by strong demand and resilient underlying fundamentals.
-
Top contributors to performance relative to the Blended Index:
-
Within the fixed income segment, exposure to the MFS Emerging Markets Debt Fund, MFS Emerging Markets Debt Local Currency Fund, and MFS High Income Fund supported relative performance.
-
-
Top detractors from performance relative to the Blended Index:
-
Within the U.S. equity segment, lagging relative performance across the majority of the strategies weighed on relative results as the funds generally underperformed their respective benchmarks. Style selection also held back relative performance as mid-cap strategies underperformed the broader index.
-
Within the international equity segment, relative performance of both the MFS International Growth Fund and MFS Research International Fund held back performance as the funds lagged their respective benchmarks.
-
FUND PERFORMANCE
The fund’s past performance is not a good predictor of the fund’s future performance. The graph and table below do not reflect the deduction of taxes that a shareholder would pay on fund distributions or the redemption of fund shares. The graph and table below assume reinvestment of dividends and capital gain distributions.
Growth of a Hypothetical $10,000 Investment
This graph shows the performance of a hypothetical $10,000 investment in Class R4 over a ten year period or since inception, if shorter, in comparison to (i) a broad measure of market performance and (ii) an additional index that MFS believes more closely reflects the market segments in which the fund invests.
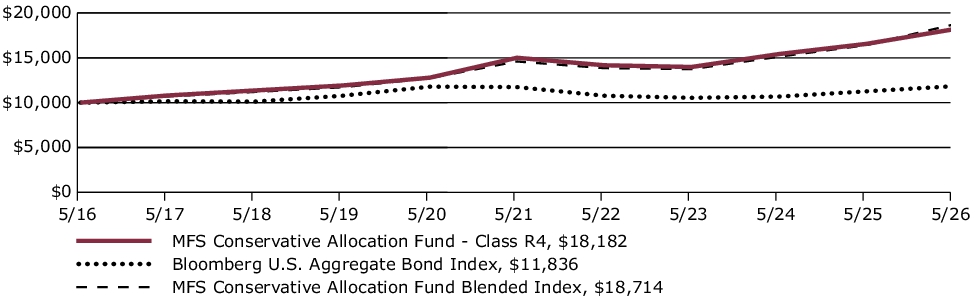
Average Annual Total Returns through 5/31/26
This table shows the average annual total returns of the class of shares noted for the periods shown, both with (if any) and without sales charges. It also shows the average annual total returns of (i) a broad measure of market performance and (ii) an additional index that MFS believes more closely reflects the market segments in which the fund invests, over the same periods.
| Share Class | 1-yr | 5-yr | 10-yr |
| R4 without sales charge | 9.86% | 3.92% | 6.16% |
| Comparative Benchmark(s) | |||
| Bloomberg U.S. Aggregate Bond Index ∆ | 5.13% | 0.17% | 1.70% |
| MFS Conservative Allocation Fund Blended Index ∆ | 14.03% | 5.10% | 6.47% |
|
∆
|
Source: FactSet Research Systems Inc.
|
Visit mfs.com/perf/r4 for more recent performance information.
FUND STATISTICS AS OF 5/31/26
| Net Assets ($): | 3,604,133,279 | Total Management Fee ($)#: | 0 | |
| Total Number of Holdings: | 22 | Portfolio Turnover Rate (%): | 4 |
# The fund itself does not pay a management fee but the underlying funds in which the fund invests do pay management fees to MFS.
PORTFOLIO COMPOSITION (BASED ON TOTAL INVESTMENTS AS OF 5/31/26)
Portfolio allocation
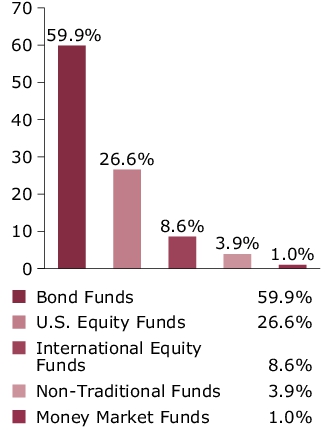
Portfolio holdings
| MFS Total Return Bond Fund | 15.0% |
| MFS Inflation-Adjusted Bond Fund | 10.0% |
| MFS Limited Maturity Fund | 10.0% |
| MFS Government Securities Fund | 9.9% |
| MFS Global Opportunistic Bond Fund | 7.0% |
| MFS Value Fund | 6.0% |
| MFS Growth Fund | 5.3% |
| MFS Research Fund | 5.3% |
| MFS Mid Cap Growth Fund | 4.0% |
| MFS Mid Cap Value Fund | 4.0% |
| MFS High Income Fund | 4.0% |
| MFS Research International Fund | 3.8% |
| MFS Emerging Markets Debt Fund | 2.0% |
| MFS Emerging Markets Debt Local Currency Fund | 2.0% |
| MFS Global Real Estate Fund | 2.0% |
| MFS Commodity Strategy Fund | 1.9% |
| MFS International Growth Fund | 1.6% |
| MFS International Intrinsic Equity Fund | 1.6% |
| MFS International Large Cap Value Fund | 1.6% |
| MFS New Discovery Fund | 1.0% |
| MFS New Discovery Value Fund | 1.0% |
| MFS Institutional Money Market Portfolio | 1.0% |
FUND EXPENSES
What were the fund costs for the last year?
| (based on a hypothetical $10,000 investment) | ||
| Class Name | Costs of a $10,000 investment ~ | Costs paid as a percentage of a $10,000 investment ~ |
| R3 | $36 | 0.34% |
˜ Expenses are direct expenses and do not include underlying fund fees and expenses.
MANAGEMENT'S DISCUSSION OF FUND PERFORMANCE
-
For the twelve months ended May 31, 2026, Class R3 shares of the MFS Conservative Allocation Fund (fund) provided a total return of 9.63%, at net asset value. This compares with a return of 5.13% for the fund’s benchmark, the Bloomberg U.S. Aggregate Bond Index. The fund's other benchmark, the MFS Conservative Allocation Fund Blended Index (Blended Index), generated a return of 14.03%. The Blended Index reflects the blended returns of broad asset class indices, with percentage allocations to each index designed to resemble the long term strategic allocations of the fund. The market indices and related percentage allocations used to compile the Blended Index are set forth in the Fund Performance.
-
Global equity markets reached record levels during the period, withstanding considerable volatility amid tariffs, geopolitical conflict and high levels of uncertainty. A new geopolitical event distressed markets at the end of the period as US and Israeli forces launched strikes against Iran, disrupting Mideast oil and natural gas exports. During the period, a pro-growth tax and spending bill was signed into law in the US, while in Europe, renewed focus on defense and infrastructure spending brightened the economic outlook. In Japan, the election of a pro-growth prime minister sent stocks to new highs prior to the conflict in Iran. Optimism over artificial intelligence remained high.
-
Considerable progress was made in trade talks between the US and many major trading partners, with a fragile truce between the US and China extended through late 2026. While the US Supreme Court struck down part of the Trump administration’s tariff strategy, the administration began deploying other authorities to largely replace the ones that were ruled unconstitutional.
-
Early in the period, moderating inflation pressures allowed many global central banks to ease monetary policy. Amid a difficult policymaking environment and slower job growth, the Federal Reserve resumed easing policy in September and delivered quarter-point rate cuts in October and December before pausing.
-
In fixed income markets, previously range-bound global bond yields spiked following the onset of the Middle East conflict, as energy-driven inflation fears appeared to have rattled bond investors. US rate volatility (as measured by the Merrill Lynch Option Volatility Estimate (MOVE) Index) similarly rose from intra-period lows, reflecting uncertainty around the scope and duration of the conflict and its implications for global growth. However, volatility later retracted as the risk of a broader regional military escalation appeared less likely. Global credit spreads widened only modestly before stabilizing near prior levels, supported by strong demand and resilient underlying fundamentals.
-
Top contributors to performance relative to the Blended Index:
-
Within the fixed income segment, exposure to the MFS Emerging Markets Debt Fund, MFS Emerging Markets Debt Local Currency Fund, and MFS High Income Fund supported relative performance.
-
-
Top detractors from performance relative to the Blended Index:
-
Within the U.S. equity segment, lagging relative performance across the majority of the strategies weighed on relative results as the funds generally underperformed their respective benchmarks. Style selection also held back relative performance as mid-cap strategies underperformed the broader index.
-
Within the international equity segment, relative performance of both the MFS International Growth Fund and MFS Research International Fund held back performance as the funds lagged their respective benchmarks.
-
FUND PERFORMANCE
The fund’s past performance is not a good predictor of the fund’s future performance. The graph and table below do not reflect the deduction of taxes that a shareholder would pay on fund distributions or the redemption of fund shares. The graph and table below assume reinvestment of dividends and capital gain distributions.
Growth of a Hypothetical $10,000 Investment
This graph shows the performance of a hypothetical $10,000 investment in Class R3 over a ten year period or since inception, if shorter, in comparison to (i) a broad measure of market performance and (ii) an additional index that MFS believes more closely reflects the market segments in which the fund invests.
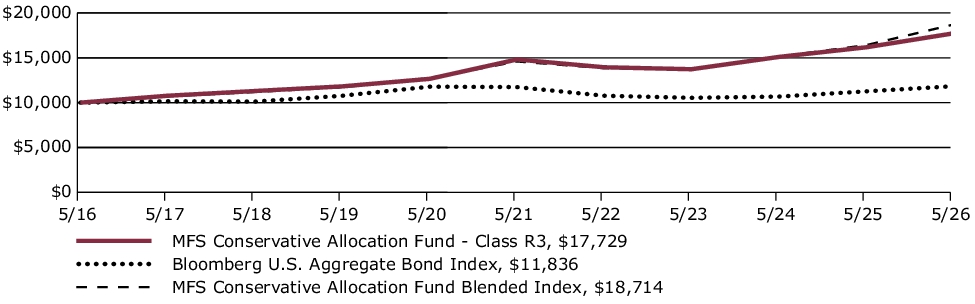
Average Annual Total Returns through 5/31/26
This table shows the average annual total returns of the class of shares noted for the periods shown, both with (if any) and without sales charges. It also shows the average annual total returns of (i) a broad measure of market performance and (ii) an additional index that MFS believes more closely reflects the market segments in which the fund invests, over the same periods.
| Share Class | 1-yr | 5-yr | 10-yr |
| R3 without sales charge | 9.63% | 3.66% | 5.89% |
| Comparative Benchmark(s) | |||
| Bloomberg U.S. Aggregate Bond Index ∆ | 5.13% | 0.17% | 1.70% |
| MFS Conservative Allocation Fund Blended Index ∆ | 14.03% | 5.10% | 6.47% |
|
∆
|
Source: FactSet Research Systems Inc.
|
Visit mfs.com/perf/r3 for more recent performance information.
FUND STATISTICS AS OF 5/31/26
| Net Assets ($): | 3,604,133,279 | Total Management Fee ($)#: | 0 | |
| Total Number of Holdings: | 22 | Portfolio Turnover Rate (%): | 4 |
# The fund itself does not pay a management fee but the underlying funds in which the fund invests do pay management fees to MFS.
PORTFOLIO COMPOSITION (BASED ON TOTAL INVESTMENTS AS OF 5/31/26)
Portfolio allocation
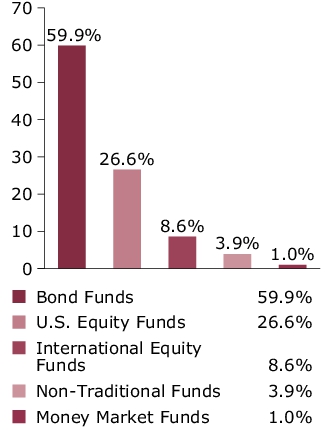
Portfolio holdings
| MFS Total Return Bond Fund | 15.0% |
| MFS Inflation-Adjusted Bond Fund | 10.0% |
| MFS Limited Maturity Fund | 10.0% |
| MFS Government Securities Fund | 9.9% |
| MFS Global Opportunistic Bond Fund | 7.0% |
| MFS Value Fund | 6.0% |
| MFS Growth Fund | 5.3% |
| MFS Research Fund | 5.3% |
| MFS Mid Cap Growth Fund | 4.0% |
| MFS Mid Cap Value Fund | 4.0% |
| MFS High Income Fund | 4.0% |
| MFS Research International Fund | 3.8% |
| MFS Emerging Markets Debt Fund | 2.0% |
| MFS Emerging Markets Debt Local Currency Fund | 2.0% |
| MFS Global Real Estate Fund | 2.0% |
| MFS Commodity Strategy Fund | 1.9% |
| MFS International Growth Fund | 1.6% |
| MFS International Intrinsic Equity Fund | 1.6% |
| MFS International Large Cap Value Fund | 1.6% |
| MFS New Discovery Fund | 1.0% |
| MFS New Discovery Value Fund | 1.0% |
| MFS Institutional Money Market Portfolio | 1.0% |
FUND EXPENSES
What were the fund costs for the last year?
| (based on a hypothetical $10,000 investment) | ||
| Class Name | Costs of a $10,000 investment ~ | Costs paid as a percentage of a $10,000 investment ~ |
| R2 | $62 | 0.59% |
˜ Expenses are direct expenses and do not include underlying fund fees and expenses.
MANAGEMENT'S DISCUSSION OF FUND PERFORMANCE
-
For the twelve months ended May 31, 2026, Class R2 shares of the MFS Conservative Allocation Fund (fund) provided a total return of 9.32%, at net asset value. This compares with a return of 5.13% for the fund’s benchmark, the Bloomberg U.S. Aggregate Bond Index. The fund's other benchmark, the MFS Conservative Allocation Fund Blended Index (Blended Index), generated a return of 14.03%. The Blended Index reflects the blended returns of broad asset class indices, with percentage allocations to each index designed to resemble the long term strategic allocations of the fund. The market indices and related percentage allocations used to compile the Blended Index are set forth in the Fund Performance.
-
Global equity markets reached record levels during the period, withstanding considerable volatility amid tariffs, geopolitical conflict and high levels of uncertainty. A new geopolitical event distressed markets at the end of the period as US and Israeli forces launched strikes against Iran, disrupting Mideast oil and natural gas exports. During the period, a pro-growth tax and spending bill was signed into law in the US, while in Europe, renewed focus on defense and infrastructure spending brightened the economic outlook. In Japan, the election of a pro-growth prime minister sent stocks to new highs prior to the conflict in Iran. Optimism over artificial intelligence remained high.
-
Considerable progress was made in trade talks between the US and many major trading partners, with a fragile truce between the US and China extended through late 2026. While the US Supreme Court struck down part of the Trump administration’s tariff strategy, the administration began deploying other authorities to largely replace the ones that were ruled unconstitutional.
-
Early in the period, moderating inflation pressures allowed many global central banks to ease monetary policy. Amid a difficult policymaking environment and slower job growth, the Federal Reserve resumed easing policy in September and delivered quarter-point rate cuts in October and December before pausing.
-
In fixed income markets, previously range-bound global bond yields spiked following the onset of the Middle East conflict, as energy-driven inflation fears appeared to have rattled bond investors. US rate volatility (as measured by the Merrill Lynch Option Volatility Estimate (MOVE) Index) similarly rose from intra-period lows, reflecting uncertainty around the scope and duration of the conflict and its implications for global growth. However, volatility later retracted as the risk of a broader regional military escalation appeared less likely. Global credit spreads widened only modestly before stabilizing near prior levels, supported by strong demand and resilient underlying fundamentals.
-
Top contributors to performance relative to the Blended Index:
-
Within the fixed income segment, exposure to the MFS Emerging Markets Debt Fund, MFS Emerging Markets Debt Local Currency Fund, and MFS High Income Fund supported relative performance.
-
-
Top detractors from performance relative to the Blended Index:
-
Within the U.S. equity segment, lagging relative performance across the majority of the strategies weighed on relative results as the funds generally underperformed their respective benchmarks. Style selection also held back relative performance as mid-cap strategies underperformed the broader index.
-
Within the international equity segment, relative performance of both the MFS International Growth Fund and MFS Research International Fund held back performance as the funds lagged their respective benchmarks.
-
FUND PERFORMANCE
The fund’s past performance is not a good predictor of the fund’s future performance. The graph and table below do not reflect the deduction of taxes that a shareholder would pay on fund distributions or the redemption of fund shares. The graph and table below assume reinvestment of dividends and capital gain distributions.
Growth of a Hypothetical $10,000 Investment
This graph shows the performance of a hypothetical $10,000 investment in Class R2 over a ten year period or since inception, if shorter, in comparison to (i) a broad measure of market performance and (ii) an additional index that MFS believes more closely reflects the market segments in which the fund invests.
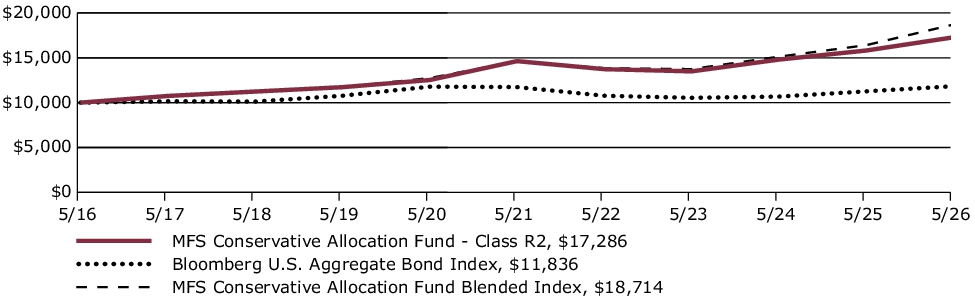
Average Annual Total Returns through 5/31/26
This table shows the average annual total returns of the class of shares noted for the periods shown, both with (if any) and without sales charges. It also shows the average annual total returns of (i) a broad measure of market performance and (ii) an additional index that MFS believes more closely reflects the market segments in which the fund invests, over the same periods.
| Share Class | 1-yr | 5-yr | 10-yr |
| R2 without sales charge | 9.32% | 3.39% | 5.63% |
| Comparative Benchmark(s) | |||
| Bloomberg U.S. Aggregate Bond Index ∆ | 5.13% | 0.17% | 1.70% |
| MFS Conservative Allocation Fund Blended Index ∆ | 14.03% | 5.10% | 6.47% |
|
∆
|
Source: FactSet Research Systems Inc.
|
Visit mfs.com/perf/r2 for more recent performance information.
FUND STATISTICS AS OF 5/31/26
| Net Assets ($): | 3,604,133,279 | Total Management Fee ($)#: | 0 | |
| Total Number of Holdings: | 22 | Portfolio Turnover Rate (%): | 4 |
# The fund itself does not pay a management fee but the underlying funds in which the fund invests do pay management fees to MFS.
PORTFOLIO COMPOSITION (BASED ON TOTAL INVESTMENTS AS OF 5/31/26)
Portfolio allocation
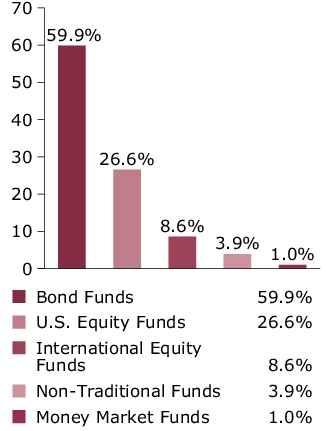
Portfolio holdings
| MFS Total Return Bond Fund | 15.0% |
| MFS Inflation-Adjusted Bond Fund | 10.0% |
| MFS Limited Maturity Fund | 10.0% |
| MFS Government Securities Fund | 9.9% |
| MFS Global Opportunistic Bond Fund | 7.0% |
| MFS Value Fund | 6.0% |
| MFS Growth Fund | 5.3% |
| MFS Research Fund | 5.3% |
| MFS Mid Cap Growth Fund | 4.0% |
| MFS Mid Cap Value Fund | 4.0% |
| MFS High Income Fund | 4.0% |
| MFS Research International Fund | 3.8% |
| MFS Emerging Markets Debt Fund | 2.0% |
| MFS Emerging Markets Debt Local Currency Fund | 2.0% |
| MFS Global Real Estate Fund | 2.0% |
| MFS Commodity Strategy Fund | 1.9% |
| MFS International Growth Fund | 1.6% |
| MFS International Intrinsic Equity Fund | 1.6% |
| MFS International Large Cap Value Fund | 1.6% |
| MFS New Discovery Fund | 1.0% |
| MFS New Discovery Value Fund | 1.0% |
| MFS Institutional Money Market Portfolio | 1.0% |
FUND EXPENSES
What were the fund costs for the last year?
| (based on a hypothetical $10,000 investment) | ||
| Class Name | Costs of a $10,000 investment ~ | Costs paid as a percentage of a $10,000 investment ~ |
| R1 | $114 | 1.09% |
˜ Expenses are direct expenses and do not include underlying fund fees and expenses.
MANAGEMENT'S DISCUSSION OF FUND PERFORMANCE
-
For the twelve months ended May 31, 2026, Class R1 shares of the MFS Conservative Allocation Fund (fund) provided a total return of 8.77%, at net asset value. This compares with a return of 5.13% for the fund’s benchmark, the Bloomberg U.S. Aggregate Bond Index. The fund's other benchmark, the MFS Conservative Allocation Fund Blended Index (Blended Index), generated a return of 14.03%. The Blended Index reflects the blended returns of broad asset class indices, with percentage allocations to each index designed to resemble the long term strategic allocations of the fund. The market indices and related percentage allocations used to compile the Blended Index are set forth in the Fund Performance.
-
Global equity markets reached record levels during the period, withstanding considerable volatility amid tariffs, geopolitical conflict and high levels of uncertainty. A new geopolitical event distressed markets at the end of the period as US and Israeli forces launched strikes against Iran, disrupting Mideast oil and natural gas exports. During the period, a pro-growth tax and spending bill was signed into law in the US, while in Europe, renewed focus on defense and infrastructure spending brightened the economic outlook. In Japan, the election of a pro-growth prime minister sent stocks to new highs prior to the conflict in Iran. Optimism over artificial intelligence remained high.
-
Considerable progress was made in trade talks between the US and many major trading partners, with a fragile truce between the US and China extended through late 2026. While the US Supreme Court struck down part of the Trump administration’s tariff strategy, the administration began deploying other authorities to largely replace the ones that were ruled unconstitutional.
-
Early in the period, moderating inflation pressures allowed many global central banks to ease monetary policy. Amid a difficult policymaking environment and slower job growth, the Federal Reserve resumed easing policy in September and delivered quarter-point rate cuts in October and December before pausing.
-
In fixed income markets, previously range-bound global bond yields spiked following the onset of the Middle East conflict, as energy-driven inflation fears appeared to have rattled bond investors. US rate volatility (as measured by the Merrill Lynch Option Volatility Estimate (MOVE) Index) similarly rose from intra-period lows, reflecting uncertainty around the scope and duration of the conflict and its implications for global growth. However, volatility later retracted as the risk of a broader regional military escalation appeared less likely. Global credit spreads widened only modestly before stabilizing near prior levels, supported by strong demand and resilient underlying fundamentals.
-
Top contributors to performance relative to the Blended Index:
-
Within the fixed income segment, exposure to the MFS Emerging Markets Debt Fund, MFS Emerging Markets Debt Local Currency Fund, and MFS High Income Fund supported relative performance.
-
-
Top detractors from performance relative to the Blended Index:
-
Within the U.S. equity segment, lagging relative performance across the majority of the strategies weighed on relative results as the funds generally underperformed their respective benchmarks. Style selection also held back relative performance as mid-cap strategies underperformed the broader index.
-
Within the international equity segment, relative performance of both the MFS International Growth Fund and MFS Research International Fund held back performance as the funds lagged their respective benchmarks.
-
FUND PERFORMANCE
The fund’s past performance is not a good predictor of the fund’s future performance. The graph and table below do not reflect the deduction of taxes that a shareholder would pay on fund distributions or the redemption of fund shares. The graph and table below assume reinvestment of dividends and capital gain distributions.
Growth of a Hypothetical $10,000 Investment
This graph shows the performance of a hypothetical $10,000 investment in Class R1 over a ten year period or since inception, if shorter, in comparison to (i) a broad measure of market performance and (ii) an additional index that MFS believes more closely reflects the market segments in which the fund invests.
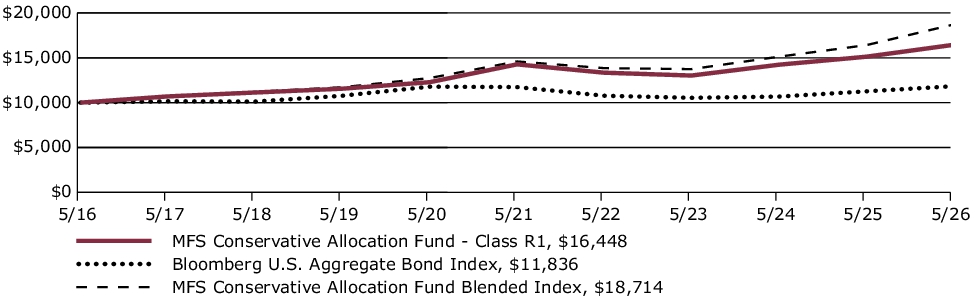
Average Annual Total Returns through 5/31/26
This table shows the average annual total returns of the class of shares noted for the periods shown, both with (if any) and without sales charges. It also shows the average annual total returns of (i) a broad measure of market performance and (ii) an additional index that MFS believes more closely reflects the market segments in which the fund invests, over the same periods.
| Share Class | 1-yr | 5-yr | 10-yr |
| R1 without sales charge | 8.77% | 2.88% | 5.10% |
| Comparative Benchmark(s) | |||
| Bloomberg U.S. Aggregate Bond Index ∆ | 5.13% | 0.17% | 1.70% |
| MFS Conservative Allocation Fund Blended Index ∆ | 14.03% | 5.10% | 6.47% |
|
∆
|
Source: FactSet Research Systems Inc.
|
Visit mfs.com/perf/r1 for more recent performance information.
FUND STATISTICS AS OF 5/31/26
| Net Assets ($): | 3,604,133,279 | Total Management Fee ($)#: | 0 | |
| Total Number of Holdings: | 22 | Portfolio Turnover Rate (%): | 4 |
# The fund itself does not pay a management fee but the underlying funds in which the fund invests do pay management fees to MFS.
PORTFOLIO COMPOSITION (BASED ON TOTAL INVESTMENTS AS OF 5/31/26)
Portfolio allocation
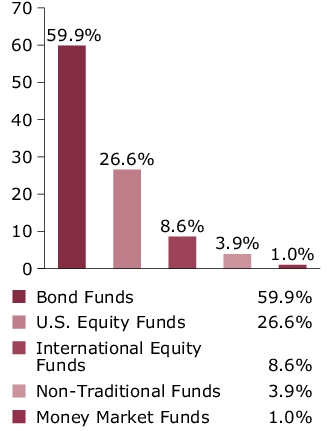
Portfolio holdings
| MFS Total Return Bond Fund | 15.0% |
| MFS Inflation-Adjusted Bond Fund | 10.0% |
| MFS Limited Maturity Fund | 10.0% |
| MFS Government Securities Fund | 9.9% |
| MFS Global Opportunistic Bond Fund | 7.0% |
| MFS Value Fund | 6.0% |
| MFS Growth Fund | 5.3% |
| MFS Research Fund | 5.3% |
| MFS Mid Cap Growth Fund | 4.0% |
| MFS Mid Cap Value Fund | 4.0% |
| MFS High Income Fund | 4.0% |
| MFS Research International Fund | 3.8% |
| MFS Emerging Markets Debt Fund | 2.0% |
| MFS Emerging Markets Debt Local Currency Fund | 2.0% |
| MFS Global Real Estate Fund | 2.0% |
| MFS Commodity Strategy Fund | 1.9% |
| MFS International Growth Fund | 1.6% |
| MFS International Intrinsic Equity Fund | 1.6% |
| MFS International Large Cap Value Fund | 1.6% |
| MFS New Discovery Fund | 1.0% |
| MFS New Discovery Value Fund | 1.0% |
| MFS Institutional Money Market Portfolio | 1.0% |
FUND EXPENSES
What were the fund costs for the last year?
| (based on a hypothetical $10,000 investment) | ||
| Class Name | Costs of a $10,000 investment ~ | Costs paid as a percentage of a $10,000 investment ~ |
| I | $9 | 0.09% |
˜ Expenses are direct expenses and do not include underlying fund fees and expenses.
MANAGEMENT'S DISCUSSION OF FUND PERFORMANCE
-
For the twelve months ended May 31, 2026, Class I shares of the MFS Conservative Allocation Fund (fund) provided a total return of 9.86%, at net asset value. This compares with a return of 5.13% for the fund’s benchmark, the Bloomberg U.S. Aggregate Bond Index. The fund's other benchmark, the MFS Conservative Allocation Fund Blended Index (Blended Index), generated a return of 14.03%. The Blended Index reflects the blended returns of broad asset class indices, with percentage allocations to each index designed to resemble the long term strategic allocations of the fund. The market indices and related percentage allocations used to compile the Blended Index are set forth in the Fund Performance.
-
Global equity markets reached record levels during the period, withstanding considerable volatility amid tariffs, geopolitical conflict and high levels of uncertainty. A new geopolitical event distressed markets at the end of the period as US and Israeli forces launched strikes against Iran, disrupting Mideast oil and natural gas exports. During the period, a pro-growth tax and spending bill was signed into law in the US, while in Europe, renewed focus on defense and infrastructure spending brightened the economic outlook. In Japan, the election of a pro-growth prime minister sent stocks to new highs prior to the conflict in Iran. Optimism over artificial intelligence remained high.
-
Considerable progress was made in trade talks between the US and many major trading partners, with a fragile truce between the US and China extended through late 2026. While the US Supreme Court struck down part of the Trump administration’s tariff strategy, the administration began deploying other authorities to largely replace the ones that were ruled unconstitutional.
-
Early in the period, moderating inflation pressures allowed many global central banks to ease monetary policy. Amid a difficult policymaking environment and slower job growth, the Federal Reserve resumed easing policy in September and delivered quarter-point rate cuts in October and December before pausing.
-
In fixed income markets, previously range-bound global bond yields spiked following the onset of the Middle East conflict, as energy-driven inflation fears appeared to have rattled bond investors. US rate volatility (as measured by the Merrill Lynch Option Volatility Estimate (MOVE) Index) similarly rose from intra-period lows, reflecting uncertainty around the scope and duration of the conflict and its implications for global growth. However, volatility later retracted as the risk of a broader regional military escalation appeared less likely. Global credit spreads widened only modestly before stabilizing near prior levels, supported by strong demand and resilient underlying fundamentals.
-
Top contributors to performance relative to the Blended Index:
-
Within the fixed income segment, exposure to the MFS Emerging Markets Debt Fund, MFS Emerging Markets Debt Local Currency Fund, and MFS High Income Fund supported relative performance.
-
-
Top detractors from performance relative to the Blended Index:
-
Within the U.S. equity segment, lagging relative performance across the majority of the strategies weighed on relative results as the funds generally underperformed their respective benchmarks. Style selection also held back relative performance as mid-cap strategies underperformed the broader index.
-
Within the international equity segment, relative performance of both the MFS International Growth Fund and MFS Research International Fund held back performance as the funds lagged their respective benchmarks.
-
FUND PERFORMANCE
The fund’s past performance is not a good predictor of the fund’s future performance. The graph and table below do not reflect the deduction of taxes that a shareholder would pay on fund distributions or the redemption of fund shares. The graph and table below assume reinvestment of dividends and capital gain distributions.
Growth of a Hypothetical $10,000 Investment
This graph shows the performance of a hypothetical $10,000 investment in Class I over a ten year period or since inception, if shorter, in comparison to (i) a broad measure of market performance and (ii) an additional index that MFS believes more closely reflects the market segments in which the fund invests.
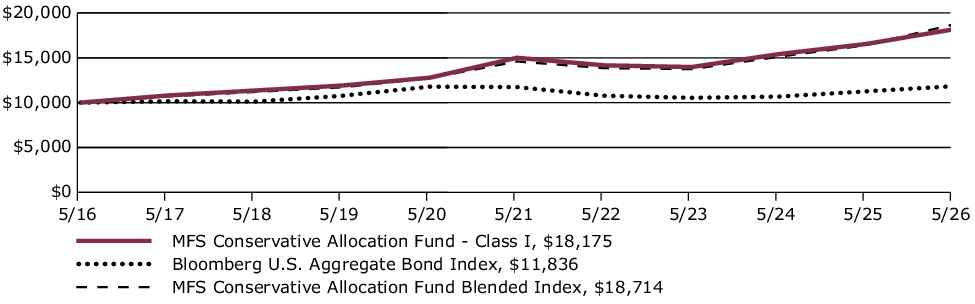
Average Annual Total Returns through 5/31/26
This table shows the average annual total returns of the class of shares noted for the periods shown, both with (if any) and without sales charges. It also shows the average annual total returns of (i) a broad measure of market performance and (ii) an additional index that MFS believes more closely reflects the market segments in which the fund invests, over the same periods.
| Share Class | 1-yr | 5-yr | 10-yr |
| I without sales charge | 9.86% | 3.91% | 6.16% |
| Comparative Benchmark(s) | |||
| Bloomberg U.S. Aggregate Bond Index ∆ | 5.13% | 0.17% | 1.70% |
| MFS Conservative Allocation Fund Blended Index ∆ | 14.03% | 5.10% | 6.47% |
|
∆
|
Source: FactSet Research Systems Inc.
|
Visit mfs.com/perf/i for more recent performance information.
FUND STATISTICS AS OF 5/31/26
| Net Assets ($): | 3,604,133,279 | Total Management Fee ($)#: | 0 | |
| Total Number of Holdings: | 22 | Portfolio Turnover Rate (%): | 4 |
# The fund itself does not pay a management fee but the underlying funds in which the fund invests do pay management fees to MFS.
PORTFOLIO COMPOSITION (BASED ON TOTAL INVESTMENTS AS OF 5/31/26)
Portfolio allocation
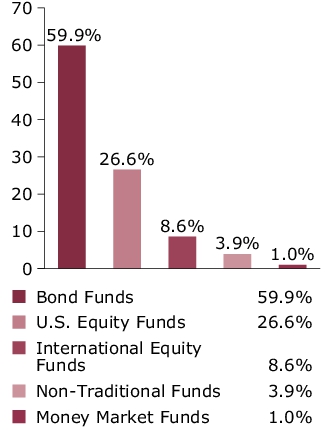
Portfolio holdings
| MFS Total Return Bond Fund | 15.0% |
| MFS Inflation-Adjusted Bond Fund | 10.0% |
| MFS Limited Maturity Fund | 10.0% |
| MFS Government Securities Fund | 9.9% |
| MFS Global Opportunistic Bond Fund | 7.0% |
| MFS Value Fund | 6.0% |
| MFS Growth Fund | 5.3% |
| MFS Research Fund | 5.3% |
| MFS Mid Cap Growth Fund | 4.0% |
| MFS Mid Cap Value Fund | 4.0% |
| MFS High Income Fund | 4.0% |
| MFS Research International Fund | 3.8% |
| MFS Emerging Markets Debt Fund | 2.0% |
| MFS Emerging Markets Debt Local Currency Fund | 2.0% |
| MFS Global Real Estate Fund | 2.0% |
| MFS Commodity Strategy Fund | 1.9% |
| MFS International Growth Fund | 1.6% |
| MFS International Intrinsic Equity Fund | 1.6% |
| MFS International Large Cap Value Fund | 1.6% |
| MFS New Discovery Fund | 1.0% |
| MFS New Discovery Value Fund | 1.0% |
| MFS Institutional Money Market Portfolio | 1.0% |
FUND EXPENSES
What were the fund costs for the last year?
| (based on a hypothetical $10,000 investment) | ||
| Class Name | Costs of a $10,000 investment ~ | Costs paid as a percentage of a $10,000 investment ~ |
| C | $114 | 1.09% |
˜ Expenses are direct expenses and do not include underlying fund fees and expenses.
MANAGEMENT'S DISCUSSION OF FUND PERFORMANCE
-
For the twelve months ended May 31, 2026, Class C shares of the MFS Conservative Allocation Fund (fund) provided a total return of 8.78%, at net asset value. This compares with a return of 5.13% for the fund’s benchmark, the Bloomberg U.S. Aggregate Bond Index. The fund's other benchmark, the MFS Conservative Allocation Fund Blended Index (Blended Index), generated a return of 14.03%. The Blended Index reflects the blended returns of broad asset class indices, with percentage allocations to each index designed to resemble the long term strategic allocations of the fund. The market indices and related percentage allocations used to compile the Blended Index are set forth in the Fund Performance.
-
Global equity markets reached record levels during the period, withstanding considerable volatility amid tariffs, geopolitical conflict and high levels of uncertainty. A new geopolitical event distressed markets at the end of the period as US and Israeli forces launched strikes against Iran, disrupting Mideast oil and natural gas exports. During the period, a pro-growth tax and spending bill was signed into law in the US, while in Europe, renewed focus on defense and infrastructure spending brightened the economic outlook. In Japan, the election of a pro-growth prime minister sent stocks to new highs prior to the conflict in Iran. Optimism over artificial intelligence remained high.
-
Considerable progress was made in trade talks between the US and many major trading partners, with a fragile truce between the US and China extended through late 2026. While the US Supreme Court struck down part of the Trump administration’s tariff strategy, the administration began deploying other authorities to largely replace the ones that were ruled unconstitutional.
-
Early in the period, moderating inflation pressures allowed many global central banks to ease monetary policy. Amid a difficult policymaking environment and slower job growth, the Federal Reserve resumed easing policy in September and delivered quarter-point rate cuts in October and December before pausing.
-
In fixed income markets, previously range-bound global bond yields spiked following the onset of the Middle East conflict, as energy-driven inflation fears appeared to have rattled bond investors. US rate volatility (as measured by the Merrill Lynch Option Volatility Estimate (MOVE) Index) similarly rose from intra-period lows, reflecting uncertainty around the scope and duration of the conflict and its implications for global growth. However, volatility later retracted as the risk of a broader regional military escalation appeared less likely. Global credit spreads widened only modestly before stabilizing near prior levels, supported by strong demand and resilient underlying fundamentals.
-
Top contributors to performance relative to the Blended Index:
-
Within the fixed income segment, exposure to the MFS Emerging Markets Debt Fund, MFS Emerging Markets Debt Local Currency Fund, and MFS High Income Fund supported relative performance.
-
-
Top detractors from performance relative to the Blended Index:
-
Within the U.S. equity segment, lagging relative performance across the majority of the strategies weighed on relative results as the funds generally underperformed their respective benchmarks. Style selection also held back relative performance as mid-cap strategies underperformed the broader index.
-
Within the international equity segment, relative performance of both the MFS International Growth Fund and MFS Research International Fund held back performance as the funds lagged their respective benchmarks.
-
FUND PERFORMANCE
The fund’s past performance is not a good predictor of the fund’s future performance. The graph and table below do not reflect the deduction of taxes that a shareholder would pay on fund distributions or the redemption of fund shares. The graph and table below assume reinvestment of dividends and capital gain distributions.
Growth of a Hypothetical $10,000 Investment
This graph shows the performance of a hypothetical $10,000 investment in Class C over a ten year period or since inception, if shorter, in comparison to (i) a broad measure of market performance and (ii) an additional index that MFS believes more closely reflects the market segments in which the fund invests.
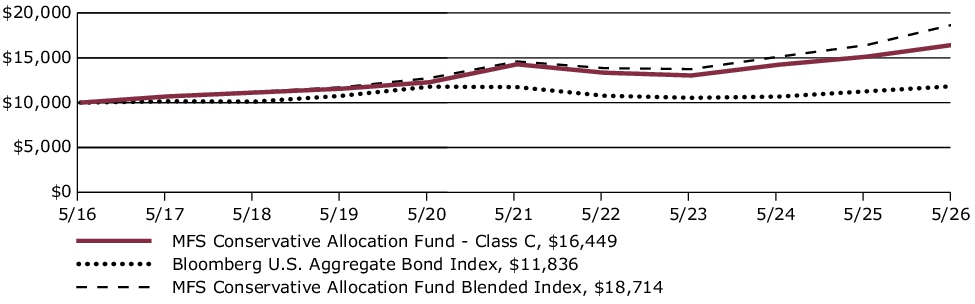
Average Annual Total Returns through 5/31/26
This table shows the average annual total returns of the class of shares noted for the periods shown, both with (if any) and without sales charges. It also shows the average annual total returns of (i) a broad measure of market performance and (ii) an additional index that MFS believes more closely reflects the market segments in which the fund invests, over the same periods.
| Share Class | 1-yr | 5-yr | 10-yr |
| C without sales charge | 8.78% | 2.88% | 5.10% |
| C with CDSC (1% for 12 months)× | 7.78% | 2.88% | 5.10% |
| Comparative Benchmark(s) | |||
| Bloomberg U.S. Aggregate Bond Index ∆ | 5.13% | 0.17% | 1.70% |
| MFS Conservative Allocation Fund Blended Index ∆ | 14.03% | 5.10% | 6.47% |
|
∆
|
Source: FactSet Research Systems Inc.
|
|
×
|
Assuming redemption at the end of the applicable period.
|
Visit mfs.com/perf/c for more recent performance information.
FUND STATISTICS AS OF 5/31/26
| Net Assets ($): | 3,604,133,279 | Total Management Fee ($)#: | 0 | |
| Total Number of Holdings: | 22 | Portfolio Turnover Rate (%): | 4 |
# The fund itself does not pay a management fee but the underlying funds in which the fund invests do pay management fees to MFS.
PORTFOLIO COMPOSITION (BASED ON TOTAL INVESTMENTS AS OF 5/31/26)
Portfolio allocation
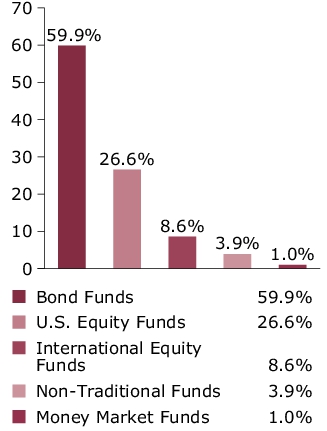
Portfolio holdings
| MFS Total Return Bond Fund | 15.0% |
| MFS Inflation-Adjusted Bond Fund | 10.0% |
| MFS Limited Maturity Fund | 10.0% |
| MFS Government Securities Fund | 9.9% |
| MFS Global Opportunistic Bond Fund | 7.0% |
| MFS Value Fund | 6.0% |
| MFS Growth Fund | 5.3% |
| MFS Research Fund | 5.3% |
| MFS Mid Cap Growth Fund | 4.0% |
| MFS Mid Cap Value Fund | 4.0% |
| MFS High Income Fund | 4.0% |
| MFS Research International Fund | 3.8% |
| MFS Emerging Markets Debt Fund | 2.0% |
| MFS Emerging Markets Debt Local Currency Fund | 2.0% |
| MFS Global Real Estate Fund | 2.0% |
| MFS Commodity Strategy Fund | 1.9% |
| MFS International Growth Fund | 1.6% |
| MFS International Intrinsic Equity Fund | 1.6% |
| MFS International Large Cap Value Fund | 1.6% |
| MFS New Discovery Fund | 1.0% |
| MFS New Discovery Value Fund | 1.0% |
| MFS Institutional Money Market Portfolio | 1.0% |
FUND EXPENSES
What were the fund costs for the last year?
| (based on a hypothetical $10,000 investment) | ||
| Class Name | Costs of a $10,000 investment ~ | Costs paid as a percentage of a $10,000 investment ~ |
| B | $114 | 1.09% |
˜ Expenses are direct expenses and do not include underlying fund fees and expenses.
MANAGEMENT'S DISCUSSION OF FUND PERFORMANCE
-
For the twelve months ended May 31, 2026, Class B shares of the MFS Conservative Allocation Fund (fund) provided a total return of 8.75%, at net asset value. This compares with a return of 5.13% for the fund’s benchmark, the Bloomberg U.S. Aggregate Bond Index. The fund's other benchmark, the MFS Conservative Allocation Fund Blended Index (Blended Index), generated a return of 14.03%. The Blended Index reflects the blended returns of broad asset class indices, with percentage allocations to each index designed to resemble the long term strategic allocations of the fund. The market indices and related percentage allocations used to compile the Blended Index are set forth in the Fund Performance.
-
Global equity markets reached record levels during the period, withstanding considerable volatility amid tariffs, geopolitical conflict and high levels of uncertainty. A new geopolitical event distressed markets at the end of the period as US and Israeli forces launched strikes against Iran, disrupting Mideast oil and natural gas exports. During the period, a pro-growth tax and spending bill was signed into law in the US, while in Europe, renewed focus on defense and infrastructure spending brightened the economic outlook. In Japan, the election of a pro-growth prime minister sent stocks to new highs prior to the conflict in Iran. Optimism over artificial intelligence remained high.
-
Considerable progress was made in trade talks between the US and many major trading partners, with a fragile truce between the US and China extended through late 2026. While the US Supreme Court struck down part of the Trump administration’s tariff strategy, the administration began deploying other authorities to largely replace the ones that were ruled unconstitutional.
-
Early in the period, moderating inflation pressures allowed many global central banks to ease monetary policy. Amid a difficult policymaking environment and slower job growth, the Federal Reserve resumed easing policy in September and delivered quarter-point rate cuts in October and December before pausing.
-
In fixed income markets, previously range-bound global bond yields spiked following the onset of the Middle East conflict, as energy-driven inflation fears appeared to have rattled bond investors. US rate volatility (as measured by the Merrill Lynch Option Volatility Estimate (MOVE) Index) similarly rose from intra-period lows, reflecting uncertainty around the scope and duration of the conflict and its implications for global growth. However, volatility later retracted as the risk of a broader regional military escalation appeared less likely. Global credit spreads widened only modestly before stabilizing near prior levels, supported by strong demand and resilient underlying fundamentals.
-
Top contributors to performance relative to the Blended Index:
-
Within the fixed income segment, exposure to the MFS Emerging Markets Debt Fund, MFS Emerging Markets Debt Local Currency Fund, and MFS High Income Fund supported relative performance.
-
-
Top detractors from performance relative to the Blended Index:
-
Within the U.S. equity segment, lagging relative performance across the majority of the strategies weighed on relative results as the funds generally underperformed their respective benchmarks. Style selection also held back relative performance as mid-cap strategies underperformed the broader index.
-
Within the international equity segment, relative performance of both the MFS International Growth Fund and MFS Research International Fund held back performance as the funds lagged their respective benchmarks.
-
FUND PERFORMANCE
The fund’s past performance is not a good predictor of the fund’s future performance. The graph and table below do not reflect the deduction of taxes that a shareholder would pay on fund distributions or the redemption of fund shares. The graph and table below assume reinvestment of dividends and capital gain distributions.
Growth of a Hypothetical $10,000 Investment
This graph shows the performance of a hypothetical $10,000 investment in Class B over a ten year period or since inception, if shorter, in comparison to (i) a broad measure of market performance and (ii) an additional index that MFS believes more closely reflects the market segments in which the fund invests.
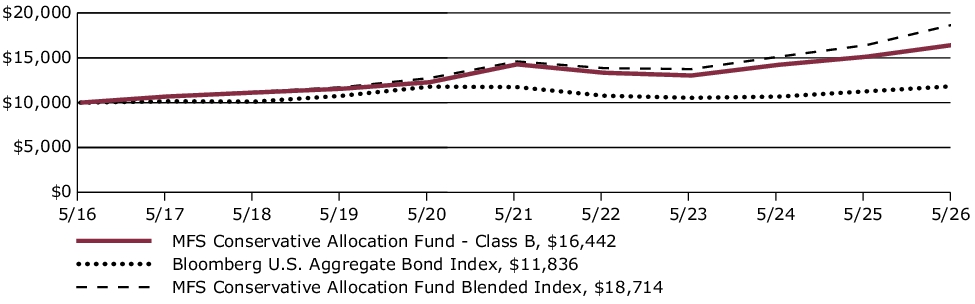
Average Annual Total Returns through 5/31/26
This table shows the average annual total returns of the class of shares noted for the periods shown, both with (if any) and without sales charges. It also shows the average annual total returns of (i) a broad measure of market performance and (ii) an additional index that MFS believes more closely reflects the market segments in which the fund invests, over the same periods.
| Share Class | 1-yr | 5-yr | 10-yr |
| B without sales charge | 8.75% | 2.88% | 5.10% |
| B with CDSC (declining over six years from 4% to 0%)× | 4.75% | 2.54% | 5.10% |
| Comparative Benchmark(s) | |||
| Bloomberg U.S. Aggregate Bond Index ∆ | 5.13% | 0.17% | 1.70% |
| MFS Conservative Allocation Fund Blended Index ∆ | 14.03% | 5.10% | 6.47% |
|
∆
|
Source: FactSet Research Systems Inc.
|
|
×
|
Assuming redemption at the end of the applicable period.
|
Visit mfs.com/perf/b for more recent performance information.
FUND STATISTICS AS OF 5/31/26
| Net Assets ($): | 3,604,133,279 | Total Management Fee ($)#: | 0 | |
| Total Number of Holdings: | 22 | Portfolio Turnover Rate (%): | 4 |
# The fund itself does not pay a management fee but the underlying funds in which the fund invests do pay management fees to MFS.
PORTFOLIO COMPOSITION (BASED ON TOTAL INVESTMENTS AS OF 5/31/26)
Portfolio allocation
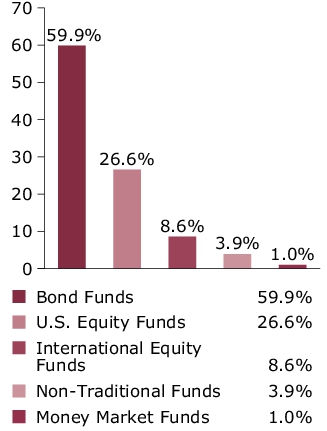
Portfolio holdings
| MFS Total Return Bond Fund | 15.0% |
| MFS Inflation-Adjusted Bond Fund | 10.0% |
| MFS Limited Maturity Fund | 10.0% |
| MFS Government Securities Fund | 9.9% |
| MFS Global Opportunistic Bond Fund | 7.0% |
| MFS Value Fund | 6.0% |
| MFS Growth Fund | 5.3% |
| MFS Research Fund | 5.3% |
| MFS Mid Cap Growth Fund | 4.0% |
| MFS Mid Cap Value Fund | 4.0% |
| MFS High Income Fund | 4.0% |
| MFS Research International Fund | 3.8% |
| MFS Emerging Markets Debt Fund | 2.0% |
| MFS Emerging Markets Debt Local Currency Fund | 2.0% |
| MFS Global Real Estate Fund | 2.0% |
| MFS Commodity Strategy Fund | 1.9% |
| MFS International Growth Fund | 1.6% |
| MFS International Intrinsic Equity Fund | 1.6% |
| MFS International Large Cap Value Fund | 1.6% |
| MFS New Discovery Fund | 1.0% |
| MFS New Discovery Value Fund | 1.0% |
| MFS Institutional Money Market Portfolio | 1.0% |
FUND EXPENSES
What were the fund costs for the last year?
| (based on a hypothetical $10,000 investment) | ||
| Class Name | Costs of a $10,000 investment ~ | Costs paid as a percentage of a $10,000 investment ~ |
| A | $36 | 0.34% |
˜ Expenses are direct expenses and do not include underlying fund fees and expenses.
MANAGEMENT'S DISCUSSION OF FUND PERFORMANCE
-
For the twelve months ended May 31, 2026, Class A shares of the MFS Conservative Allocation Fund (fund) provided a total return of 9.59%, at net asset value. This compares with a return of 5.13% for the fund’s benchmark, the Bloomberg U.S. Aggregate Bond Index. The fund's other benchmark, the MFS Conservative Allocation Fund Blended Index (Blended Index), generated a return of 14.03%. The Blended Index reflects the blended returns of broad asset class indices, with percentage allocations to each index designed to resemble the long term strategic allocations of the fund. The market indices and related percentage allocations used to compile the Blended Index are set forth in the Fund Performance.
-
Global equity markets reached record levels during the period, withstanding considerable volatility amid tariffs, geopolitical conflict and high levels of uncertainty. A new geopolitical event distressed markets at the end of the period as US and Israeli forces launched strikes against Iran, disrupting Mideast oil and natural gas exports. During the period, a pro-growth tax and spending bill was signed into law in the US, while in Europe, renewed focus on defense and infrastructure spending brightened the economic outlook. In Japan, the election of a pro-growth prime minister sent stocks to new highs prior to the conflict in Iran. Optimism over artificial intelligence remained high.
-
Considerable progress was made in trade talks between the US and many major trading partners, with a fragile truce between the US and China extended through late 2026. While the US Supreme Court struck down part of the Trump administration’s tariff strategy, the administration began deploying other authorities to largely replace the ones that were ruled unconstitutional.
-
Early in the period, moderating inflation pressures allowed many global central banks to ease monetary policy. Amid a difficult policymaking environment and slower job growth, the Federal Reserve resumed easing policy in September and delivered quarter-point rate cuts in October and December before pausing.
-
In fixed income markets, previously range-bound global bond yields spiked following the onset of the Middle East conflict, as energy-driven inflation fears appeared to have rattled bond investors. US rate volatility (as measured by the Merrill Lynch Option Volatility Estimate (MOVE) Index) similarly rose from intra-period lows, reflecting uncertainty around the scope and duration of the conflict and its implications for global growth. However, volatility later retracted as the risk of a broader regional military escalation appeared less likely. Global credit spreads widened only modestly before stabilizing near prior levels, supported by strong demand and resilient underlying fundamentals.
-
Top contributors to performance relative to the Blended Index:
-
Within the fixed income segment, exposure to the MFS Emerging Markets Debt Fund, MFS Emerging Markets Debt Local Currency Fund, and MFS High Income Fund supported relative performance.
-
-
Top detractors from performance relative to the Blended Index:
-
Within the U.S. equity segment, lagging relative performance across the majority of the strategies weighed on relative results as the funds generally underperformed their respective benchmarks. Style selection also held back relative performance as mid-cap strategies underperformed the broader index.
-
Within the international equity segment, relative performance of both the MFS International Growth Fund and MFS Research International Fund held back performance as the funds lagged their respective benchmarks.
-
FUND PERFORMANCE
The fund’s past performance is not a good predictor of the fund’s future performance. The graph and table below do not reflect the deduction of taxes that a shareholder would pay on fund distributions or the redemption of fund shares. The graph and table below assume reinvestment of dividends and capital gain distributions.
Growth of a Hypothetical $10,000 Investment
This graph shows the performance of a hypothetical $10,000 investment in Class A over a ten year period or since inception, if shorter, in comparison to (i) a broad measure of market performance and (ii) an additional index that MFS believes more closely reflects the market segments in which the fund invests. This graph includes the deduction of the maximum applicable sales charge.
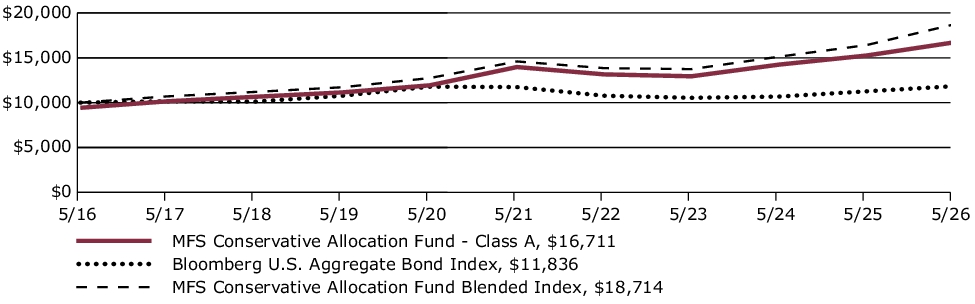
Average Annual Total Returns through 5/31/26
This table shows the average annual total returns of the class of shares noted for the periods shown, both with (if any) and without sales charges. It also shows the average annual total returns of (i) a broad measure of market performance and (ii) an additional index that MFS believes more closely reflects the market segments in which the fund invests, over the same periods.
| Share Class | 1-yr | 5-yr | 10-yr |
| A without sales charge | 9.59% | 3.65% | 5.89% |
| A with initial sales charge (5.75%) | 3.29% | 2.43% | 5.27% |
| Comparative Benchmark(s) | |||
| Bloomberg U.S. Aggregate Bond Index ∆ | 5.13% | 0.17% | 1.70% |
| MFS Conservative Allocation Fund Blended Index ∆ | 14.03% | 5.10% | 6.47% |
|
∆
|
Source: FactSet Research Systems Inc.
|
Visit mfs.com/perf/a for more recent performance information.
FUND STATISTICS AS OF 5/31/26
| Net Assets ($): | 3,604,133,279 | Total Management Fee ($)#: | 0 | |
| Total Number of Holdings: | 22 | Portfolio Turnover Rate (%): | 4 |
# The fund itself does not pay a management fee but the underlying funds in which the fund invests do pay management fees to MFS.
PORTFOLIO COMPOSITION (BASED ON TOTAL INVESTMENTS AS OF 5/31/26)
Portfolio allocation
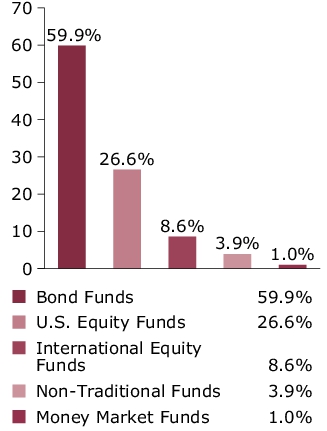
Portfolio holdings
| MFS Total Return Bond Fund | 15.0% |
| MFS Inflation-Adjusted Bond Fund | 10.0% |
| MFS Limited Maturity Fund | 10.0% |
| MFS Government Securities Fund | 9.9% |
| MFS Global Opportunistic Bond Fund | 7.0% |
| MFS Value Fund | 6.0% |
| MFS Growth Fund | 5.3% |
| MFS Research Fund | 5.3% |
| MFS Mid Cap Growth Fund | 4.0% |
| MFS Mid Cap Value Fund | 4.0% |
| MFS High Income Fund | 4.0% |
| MFS Research International Fund | 3.8% |
| MFS Emerging Markets Debt Fund | 2.0% |
| MFS Emerging Markets Debt Local Currency Fund | 2.0% |
| MFS Global Real Estate Fund | 2.0% |
| MFS Commodity Strategy Fund | 1.9% |
| MFS International Growth Fund | 1.6% |
| MFS International Intrinsic Equity Fund | 1.6% |
| MFS International Large Cap Value Fund | 1.6% |
| MFS New Discovery Fund | 1.0% |
| MFS New Discovery Value Fund | 1.0% |
| MFS Institutional Money Market Portfolio | 1.0% |
FUND EXPENSES
What were the fund costs for the last year?
| (based on a hypothetical $10,000 investment) | ||
| Class Name | Costs of a $10,000 investment | Costs paid as a percentage of a $10,000 investment |
| A | $160 | 1.31% |
MANAGEMENT'S DISCUSSION OF FUND PERFORMANCE
-
For the twelve months ended May 31, 2026, Class A shares of the MFS Emerging Markets Equity Fund (fund) provided a total return of 44.43%, at net asset value. This compares with a return of 54.31% for the fund’s benchmark, the MSCI Emerging Markets Index (net div).
-
Global equity markets reached record levels during the period, withstanding considerable volatility amid tariffs, geopolitical conflict and high levels of uncertainty. A new geopolitical event distressed markets at the end of the period as US and Israeli forces launched strikes against Iran, disrupting Mideast oil and natural gas exports. During the period, a pro-growth tax and spending bill was signed into law in the US, while in Europe, renewed focus on defense and infrastructure spending brightened the economic outlook. In Japan, the election of a pro-growth prime minister sent stocks to new highs prior to the conflict in Iran. Optimism over artificial intelligence remained high.
-
Considerable progress was made in trade talks between the US and many major trading partners, with a fragile truce between the US and China extended through late 2026. While the US Supreme Court struck down part of the Trump administration’s tariff strategy, the administration began deploying other authorities to largely replace the ones that were ruled unconstitutional.
-
Early in the period, moderating inflation pressures allowed many global central banks to ease monetary policy. Amid a difficult policymaking environment and slower job growth, the Federal Reserve resumed easing policy in September and delivered quarter-point rate cuts in October and December before pausing.
-
In fixed income markets, previously range-bound global bond yields spiked following the onset of the Middle East conflict, as energy-driven inflation fears appeared to have rattled bond investors. US rate volatility (as measured by the Merrill Lynch Option Volatility Estimate (MOVE) Index) similarly rose from intra-period lows, reflecting uncertainty around the scope and duration of the conflict and its implications for global growth. However, volatility later retracted as the risk of a broader regional military escalation appeared less likely. Global credit spreads widened only modestly before stabilizing near prior levels, supported by strong demand and resilient underlying fundamentals.
-
Top contributors to performance relative to the MSCI Emerging Markets Index:
-
Security selection and an underweight allocation to the financials sector strengthened the fund's relative performance.
-
An underweight allocation to the health care sector also benefited relative returns.
-
-
Top detractors from performance relative to the MSCI Emerging Markets Index:
-
Security selection and an underweight allocation to the information technology sector detracted from the fund's relative performance. Additionally, an overweight allocation to the consumer staples sector further weighed on relative results.
-
Security selection and the fund's underweight allocation to the consumer discretionary sector also detracted from relative performance.
-
FUND PERFORMANCE
The fund’s past performance is not a good predictor of the fund’s future performance. The graph and table below do not reflect the deduction of taxes that a shareholder would pay on fund distributions or the redemption of fund shares. The graph and table below assume reinvestment of dividends and capital gain distributions.
Growth of a Hypothetical $10,000 Investment
This graph shows the performance of a hypothetical $10,000 investment in Class A over a ten year period or since inception, if shorter, in comparison to a broad measure of market performance. This graph includes the deduction of the maximum applicable sales charge.
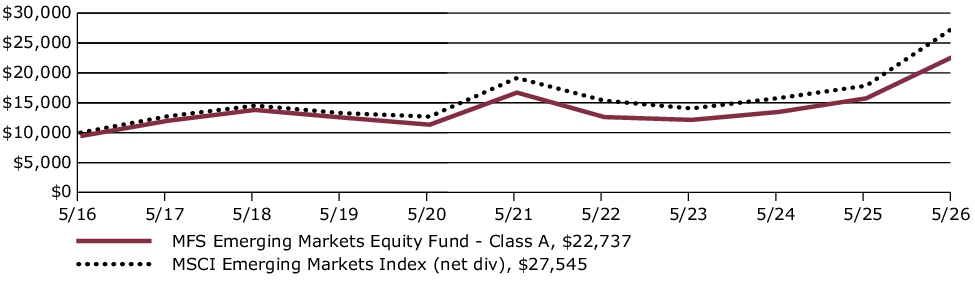
Average Annual Total Returns through 5/31/26
This table shows the average annual total returns of the class of shares noted for the periods shown, both with (if any) and without sales charges. It also shows the average annual total returns of a broad measure of market performance over the same periods.
| Share Class | 1-yr | 5-yr | 10-yr |
| A without sales charge | 44.43% | 6.37% | 9.21% |
| A with initial sales charge (5.75%) | 36.12% | 5.11% | 8.56% |
| Comparative Benchmark(s) | |||
| MSCI Emerging Markets Index (net div) ∆ | 54.31% | 7.54% | 10.66% |
|
∆
|
Source: FactSet Research Systems Inc.
|
Visit mfs.com/perf/a for more recent performance information.
FUND STATISTICS AS OF 5/31/26
| Net Assets ($): | 10,317,220,321 | Total Management Fee ($)#: | 82,489,487 | |
| Total Number of Holdings: | 94 | Portfolio Turnover Rate (%): | 45 |
# Includes the effect of any management fee waivers, if applicable.
Where the fund holds derivatives, they are not included in the total number of portfolio holdings.
PORTFOLIO COMPOSITION (BASED ON TOTAL INVESTMENTS AS OF 5/31/26)
Portfolio structure
| Equities | 98.9% |
| Money Market Funds | 1.1% |
Top ten holdings
| Taiwan Semiconductor Manufacturing Co. Ltd. | 13.5% |
| Samsung Electronics Co. Ltd. | 10.4% |
| Tencent Holdings Ltd. | 4.3% |
| Alibaba Group Holding Ltd. | 3.5% |
| Hon Hai Precision Industry Co. Ltd. | 3.2% |
| SK hynix, Inc. | 2.8% |
| ASE Technology Holding Co. Ltd | 2.7% |
| MediaTek, Inc. | 2.4% |
| HDFC Bank Ltd. | 2.1% |
| Delta Electronics, Inc. | 2.0% |
Issuer country weightings
| Taiwan | 24.7% |
| China | 21.5% |
| South Korea | 20.4% |
| India | 12.1% |
| Brazil | 3.2% |
| Saudi Arabia | 2.6% |
| United States | 2.2% |
| United Arab Emirates | 2.1% |
| Hong Kong | 2.0% |
| Other Countries | 9.2% |
Top ten holdings
| Taiwan Semiconductor Manufacturing Co. Ltd. | 13.5% |
| Samsung Electronics Co. Ltd. | 10.4% |
| Tencent Holdings Ltd. | 4.3% |
| Alibaba Group Holding Ltd. | 3.5% |
| Hon Hai Precision Industry Co. Ltd. | 3.2% |
| SK hynix, Inc. | 2.8% |
| ASE Technology Holding Co. Ltd | 2.7% |
| MediaTek, Inc. | 2.4% |
| HDFC Bank Ltd. | 2.1% |
| Delta Electronics, Inc. | 2.0% |
FUND EXPENSES
What were the fund costs for the last year?
| (based on a hypothetical $10,000 investment) | ||
| Class Name | Costs of a $10,000 investment | Costs paid as a percentage of a $10,000 investment |
| B | $251 | 2.06% |
MANAGEMENT'S DISCUSSION OF FUND PERFORMANCE
-
For the twelve months ended May 31, 2026, Class B shares of the MFS Emerging Markets Equity Fund (fund) provided a total return of 43.36%, at net asset value. This compares with a return of 54.31% for the fund’s benchmark, the MSCI Emerging Markets Index (net div).
-
Global equity markets reached record levels during the period, withstanding considerable volatility amid tariffs, geopolitical conflict and high levels of uncertainty. A new geopolitical event distressed markets at the end of the period as US and Israeli forces launched strikes against Iran, disrupting Mideast oil and natural gas exports. During the period, a pro-growth tax and spending bill was signed into law in the US, while in Europe, renewed focus on defense and infrastructure spending brightened the economic outlook. In Japan, the election of a pro-growth prime minister sent stocks to new highs prior to the conflict in Iran. Optimism over artificial intelligence remained high.
-
Considerable progress was made in trade talks between the US and many major trading partners, with a fragile truce between the US and China extended through late 2026. While the US Supreme Court struck down part of the Trump administration’s tariff strategy, the administration began deploying other authorities to largely replace the ones that were ruled unconstitutional.
-
Early in the period, moderating inflation pressures allowed many global central banks to ease monetary policy. Amid a difficult policymaking environment and slower job growth, the Federal Reserve resumed easing policy in September and delivered quarter-point rate cuts in October and December before pausing.
-
In fixed income markets, previously range-bound global bond yields spiked following the onset of the Middle East conflict, as energy-driven inflation fears appeared to have rattled bond investors. US rate volatility (as measured by the Merrill Lynch Option Volatility Estimate (MOVE) Index) similarly rose from intra-period lows, reflecting uncertainty around the scope and duration of the conflict and its implications for global growth. However, volatility later retracted as the risk of a broader regional military escalation appeared less likely. Global credit spreads widened only modestly before stabilizing near prior levels, supported by strong demand and resilient underlying fundamentals.
-
Top contributors to performance relative to the MSCI Emerging Markets Index:
-
Security selection and an underweight allocation to the financials sector strengthened the fund's relative performance.
-
An underweight allocation to the health care sector also benefited relative returns.
-
-
Top detractors from performance relative to the MSCI Emerging Markets Index:
-
Security selection and an underweight allocation to the information technology sector detracted from the fund's relative performance. Additionally, an overweight allocation to the consumer staples sector further weighed on relative results.
-
Security selection and the fund's underweight allocation to the consumer discretionary sector also detracted from relative performance.
-
FUND PERFORMANCE
The fund’s past performance is not a good predictor of the fund’s future performance. The graph and table below do not reflect the deduction of taxes that a shareholder would pay on fund distributions or the redemption of fund shares. The graph and table below assume reinvestment of dividends and capital gain distributions.
Growth of a Hypothetical $10,000 Investment
This graph shows the performance of a hypothetical $10,000 investment in Class B over a ten year period or since inception, if shorter, in comparison to a broad measure of market performance.
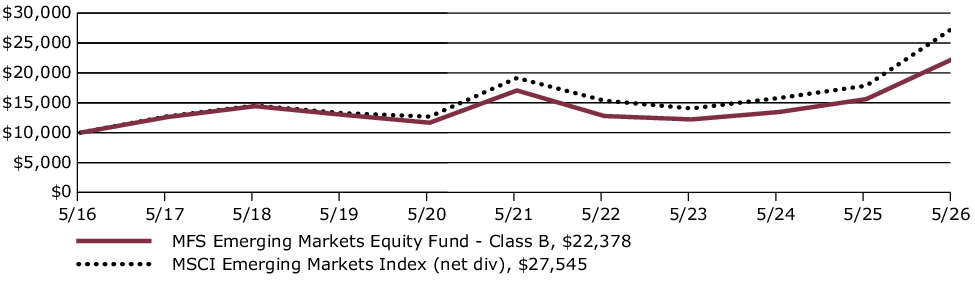
Average Annual Total Returns through 5/31/26
This table shows the average annual total returns of the class of shares noted for the periods shown, both with (if any) and without sales charges. It also shows the average annual total returns of a broad measure of market performance over the same periods.
| Share Class | 1-yr | 5-yr | 10-yr |
| B without sales charge | 43.36% | 5.58% | 8.39% |
| B with CDSC (declining over six years from 4% to 0%)× | 39.36% | 5.25% | 8.39% |
| Comparative Benchmark(s) | |||
| MSCI Emerging Markets Index (net div) ∆ | 54.31% | 7.54% | 10.66% |
|
∆
|
Source: FactSet Research Systems Inc.
|
|
×
|
Assuming redemption at the end of the applicable period.
|
Visit mfs.com/perf/b for more recent performance information.
FUND STATISTICS AS OF 5/31/26
| Net Assets ($): | 10,317,220,321 | Total Management Fee ($)#: | 82,489,487 | |
| Total Number of Holdings: | 94 | Portfolio Turnover Rate (%): | 45 |
# Includes the effect of any management fee waivers, if applicable.
Where the fund holds derivatives, they are not included in the total number of portfolio holdings.
PORTFOLIO COMPOSITION (BASED ON TOTAL INVESTMENTS AS OF 5/31/26)
Portfolio structure
| Equities | 98.9% |
| Money Market Funds | 1.1% |
Top ten holdings
| Taiwan Semiconductor Manufacturing Co. Ltd. | 13.5% |
| Samsung Electronics Co. Ltd. | 10.4% |
| Tencent Holdings Ltd. | 4.3% |
| Alibaba Group Holding Ltd. | 3.5% |
| Hon Hai Precision Industry Co. Ltd. | 3.2% |
| SK hynix, Inc. | 2.8% |
| ASE Technology Holding Co. Ltd | 2.7% |
| MediaTek, Inc. | 2.4% |
| HDFC Bank Ltd. | 2.1% |
| Delta Electronics, Inc. | 2.0% |
Issuer country weightings
| Taiwan | 24.7% |
| China | 21.5% |
| South Korea | 20.4% |
| India | 12.1% |
| Brazil | 3.2% |
| Saudi Arabia | 2.6% |
| United States | 2.2% |
| United Arab Emirates | 2.1% |
| Hong Kong | 2.0% |
| Other Countries | 9.2% |
Top ten holdings
| Taiwan Semiconductor Manufacturing Co. Ltd. | 13.5% |
| Samsung Electronics Co. Ltd. | 10.4% |
| Tencent Holdings Ltd. | 4.3% |
| Alibaba Group Holding Ltd. | 3.5% |
| Hon Hai Precision Industry Co. Ltd. | 3.2% |
| SK hynix, Inc. | 2.8% |
| ASE Technology Holding Co. Ltd | 2.7% |
| MediaTek, Inc. | 2.4% |
| HDFC Bank Ltd. | 2.1% |
| Delta Electronics, Inc. | 2.0% |
FUND EXPENSES
What were the fund costs for the last year?
| (based on a hypothetical $10,000 investment) | ||
| Class Name | Costs of a $10,000 investment | Costs paid as a percentage of a $10,000 investment |
| C | $251 | 2.06% |
MANAGEMENT'S DISCUSSION OF FUND PERFORMANCE
-
For the twelve months ended May 31, 2026, Class C shares of the MFS Emerging Markets Equity Fund (fund) provided a total return of 43.32%, at net asset value. This compares with a return of 54.31% for the fund’s benchmark, the MSCI Emerging Markets Index (net div).
-
Global equity markets reached record levels during the period, withstanding considerable volatility amid tariffs, geopolitical conflict and high levels of uncertainty. A new geopolitical event distressed markets at the end of the period as US and Israeli forces launched strikes against Iran, disrupting Mideast oil and natural gas exports. During the period, a pro-growth tax and spending bill was signed into law in the US, while in Europe, renewed focus on defense and infrastructure spending brightened the economic outlook. In Japan, the election of a pro-growth prime minister sent stocks to new highs prior to the conflict in Iran. Optimism over artificial intelligence remained high.
-
Considerable progress was made in trade talks between the US and many major trading partners, with a fragile truce between the US and China extended through late 2026. While the US Supreme Court struck down part of the Trump administration’s tariff strategy, the administration began deploying other authorities to largely replace the ones that were ruled unconstitutional.
-
Early in the period, moderating inflation pressures allowed many global central banks to ease monetary policy. Amid a difficult policymaking environment and slower job growth, the Federal Reserve resumed easing policy in September and delivered quarter-point rate cuts in October and December before pausing.
-
In fixed income markets, previously range-bound global bond yields spiked following the onset of the Middle East conflict, as energy-driven inflation fears appeared to have rattled bond investors. US rate volatility (as measured by the Merrill Lynch Option Volatility Estimate (MOVE) Index) similarly rose from intra-period lows, reflecting uncertainty around the scope and duration of the conflict and its implications for global growth. However, volatility later retracted as the risk of a broader regional military escalation appeared less likely. Global credit spreads widened only modestly before stabilizing near prior levels, supported by strong demand and resilient underlying fundamentals.
-
Top contributors to performance relative to the MSCI Emerging Markets Index:
-
Security selection and an underweight allocation to the financials sector strengthened the fund's relative performance.
-
An underweight allocation to the health care sector also benefited relative returns.
-
-
Top detractors from performance relative to the MSCI Emerging Markets Index:
-
Security selection and an underweight allocation to the information technology sector detracted from the fund's relative performance. Additionally, an overweight allocation to the consumer staples sector further weighed on relative results.
-
Security selection and the fund's underweight allocation to the consumer discretionary sector also detracted from relative performance.
-
FUND PERFORMANCE
The fund’s past performance is not a good predictor of the fund’s future performance. The graph and table below do not reflect the deduction of taxes that a shareholder would pay on fund distributions or the redemption of fund shares. The graph and table below assume reinvestment of dividends and capital gain distributions.
Growth of a Hypothetical $10,000 Investment
This graph shows the performance of a hypothetical $10,000 investment in Class C over a ten year period or since inception, if shorter, in comparison to a broad measure of market performance.
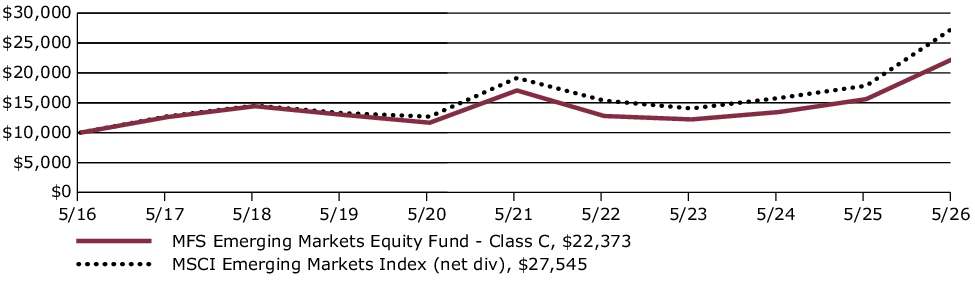
Average Annual Total Returns through 5/31/26
This table shows the average annual total returns of the class of shares noted for the periods shown, both with (if any) and without sales charges. It also shows the average annual total returns of a broad measure of market performance over the same periods.
| Share Class | 1-yr | 5-yr | 10-yr |
| C without sales charge | 43.32% | 5.57% | 8.39% |
| C with CDSC (1% for 12 months)× | 42.32% | 5.57% | 8.39% |
| Comparative Benchmark(s) | |||
| MSCI Emerging Markets Index (net div) ∆ | 54.31% | 7.54% | 10.66% |
|
∆
|
Source: FactSet Research Systems Inc.
|
|
×
|
Assuming redemption at the end of the applicable period.
|
Visit mfs.com/perf/c for more recent performance information.
FUND STATISTICS AS OF 5/31/26
| Net Assets ($): | 10,317,220,321 | Total Management Fee ($)#: | 82,489,487 | |
| Total Number of Holdings: | 94 | Portfolio Turnover Rate (%): | 45 |
# Includes the effect of any management fee waivers, if applicable.
Where the fund holds derivatives, they are not included in the total number of portfolio holdings.
PORTFOLIO COMPOSITION (BASED ON TOTAL INVESTMENTS AS OF 5/31/26)
Portfolio structure
| Equities | 98.9% |
| Money Market Funds | 1.1% |
Top ten holdings
| Taiwan Semiconductor Manufacturing Co. Ltd. | 13.5% |
| Samsung Electronics Co. Ltd. | 10.4% |
| Tencent Holdings Ltd. | 4.3% |
| Alibaba Group Holding Ltd. | 3.5% |
| Hon Hai Precision Industry Co. Ltd. | 3.2% |
| SK hynix, Inc. | 2.8% |
| ASE Technology Holding Co. Ltd | 2.7% |
| MediaTek, Inc. | 2.4% |
| HDFC Bank Ltd. | 2.1% |
| Delta Electronics, Inc. | 2.0% |
Issuer country weightings
| Taiwan | 24.7% |
| China | 21.5% |
| South Korea | 20.4% |
| India | 12.1% |
| Brazil | 3.2% |
| Saudi Arabia | 2.6% |
| United States | 2.2% |
| United Arab Emirates | 2.1% |
| Hong Kong | 2.0% |
| Other Countries | 9.2% |
Top ten holdings
| Taiwan Semiconductor Manufacturing Co. Ltd. | 13.5% |
| Samsung Electronics Co. Ltd. | 10.4% |
| Tencent Holdings Ltd. | 4.3% |
| Alibaba Group Holding Ltd. | 3.5% |
| Hon Hai Precision Industry Co. Ltd. | 3.2% |
| SK hynix, Inc. | 2.8% |
| ASE Technology Holding Co. Ltd | 2.7% |
| MediaTek, Inc. | 2.4% |
| HDFC Bank Ltd. | 2.1% |
| Delta Electronics, Inc. | 2.0% |
FUND EXPENSES
What were the fund costs for the last year?
| (based on a hypothetical $10,000 investment) | ||
| Class Name | Costs of a $10,000 investment | Costs paid as a percentage of a $10,000 investment |
| I | $130 | 1.06% |
MANAGEMENT'S DISCUSSION OF FUND PERFORMANCE
-
For the twelve months ended May 31, 2026, Class I shares of the MFS Emerging Markets Equity Fund (fund) provided a total return of 44.78%, at net asset value. This compares with a return of 54.31% for the fund’s benchmark, the MSCI Emerging Markets Index (net div).
-
Global equity markets reached record levels during the period, withstanding considerable volatility amid tariffs, geopolitical conflict and high levels of uncertainty. A new geopolitical event distressed markets at the end of the period as US and Israeli forces launched strikes against Iran, disrupting Mideast oil and natural gas exports. During the period, a pro-growth tax and spending bill was signed into law in the US, while in Europe, renewed focus on defense and infrastructure spending brightened the economic outlook. In Japan, the election of a pro-growth prime minister sent stocks to new highs prior to the conflict in Iran. Optimism over artificial intelligence remained high.
-
Considerable progress was made in trade talks between the US and many major trading partners, with a fragile truce between the US and China extended through late 2026. While the US Supreme Court struck down part of the Trump administration’s tariff strategy, the administration began deploying other authorities to largely replace the ones that were ruled unconstitutional.
-
Early in the period, moderating inflation pressures allowed many global central banks to ease monetary policy. Amid a difficult policymaking environment and slower job growth, the Federal Reserve resumed easing policy in September and delivered quarter-point rate cuts in October and December before pausing.
-
In fixed income markets, previously range-bound global bond yields spiked following the onset of the Middle East conflict, as energy-driven inflation fears appeared to have rattled bond investors. US rate volatility (as measured by the Merrill Lynch Option Volatility Estimate (MOVE) Index) similarly rose from intra-period lows, reflecting uncertainty around the scope and duration of the conflict and its implications for global growth. However, volatility later retracted as the risk of a broader regional military escalation appeared less likely. Global credit spreads widened only modestly before stabilizing near prior levels, supported by strong demand and resilient underlying fundamentals.
-
Top contributors to performance relative to the MSCI Emerging Markets Index:
-
Security selection and an underweight allocation to the financials sector strengthened the fund's relative performance.
-
An underweight allocation to the health care sector also benefited relative returns.
-
-
Top detractors from performance relative to the MSCI Emerging Markets Index:
-
Security selection and an underweight allocation to the information technology sector detracted from the fund's relative performance. Additionally, an overweight allocation to the consumer staples sector further weighed on relative results.
-
Security selection and the fund's underweight allocation to the consumer discretionary sector also detracted from relative performance.
-
FUND PERFORMANCE
The fund’s past performance is not a good predictor of the fund’s future performance. The graph and table below do not reflect the deduction of taxes that a shareholder would pay on fund distributions or the redemption of fund shares. The graph and table below assume reinvestment of dividends and capital gain distributions.
Growth of a Hypothetical $10,000 Investment
This graph shows the performance of a hypothetical $10,000 investment in Class I over a ten year period or since inception, if shorter, in comparison to a broad measure of market performance.
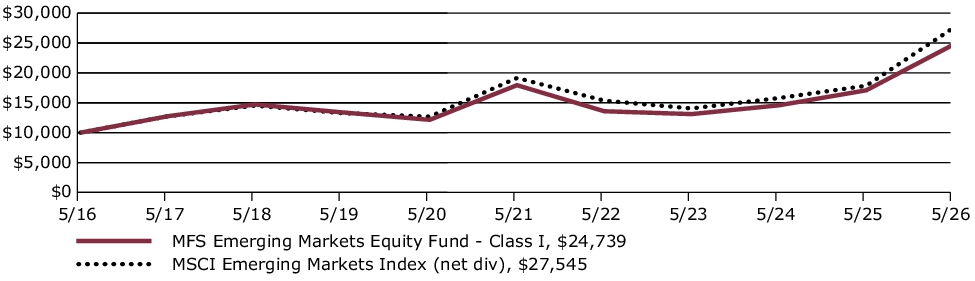
Average Annual Total Returns through 5/31/26
This table shows the average annual total returns of the class of shares noted for the periods shown, both with (if any) and without sales charges. It also shows the average annual total returns of a broad measure of market performance over the same periods.
| Share Class | 1-yr | 5-yr | 10-yr |
| I without sales charge | 44.78% | 6.64% | 9.48% |
| Comparative Benchmark(s) | |||
| MSCI Emerging Markets Index (net div) ∆ | 54.31% | 7.54% | 10.66% |
|
∆
|
Source: FactSet Research Systems Inc.
|
Visit mfs.com/perf/i for more recent performance information.
FUND STATISTICS AS OF 5/31/26
| Net Assets ($): | 10,317,220,321 | Total Management Fee ($)#: | 82,489,487 | |
| Total Number of Holdings: | 94 | Portfolio Turnover Rate (%): | 45 |
# Includes the effect of any management fee waivers, if applicable.
Where the fund holds derivatives, they are not included in the total number of portfolio holdings.
PORTFOLIO COMPOSITION (BASED ON TOTAL INVESTMENTS AS OF 5/31/26)
Portfolio structure
| Equities | 98.9% |
| Money Market Funds | 1.1% |
Top ten holdings
| Taiwan Semiconductor Manufacturing Co. Ltd. | 13.5% |
| Samsung Electronics Co. Ltd. | 10.4% |
| Tencent Holdings Ltd. | 4.3% |
| Alibaba Group Holding Ltd. | 3.5% |
| Hon Hai Precision Industry Co. Ltd. | 3.2% |
| SK hynix, Inc. | 2.8% |
| ASE Technology Holding Co. Ltd | 2.7% |
| MediaTek, Inc. | 2.4% |
| HDFC Bank Ltd. | 2.1% |
| Delta Electronics, Inc. | 2.0% |
Issuer country weightings
| Taiwan | 24.7% |
| China | 21.5% |
| South Korea | 20.4% |
| India | 12.1% |
| Brazil | 3.2% |
| Saudi Arabia | 2.6% |
| United States | 2.2% |
| United Arab Emirates | 2.1% |
| Hong Kong | 2.0% |
| Other Countries | 9.2% |
Top ten holdings
| Taiwan Semiconductor Manufacturing Co. Ltd. | 13.5% |
| Samsung Electronics Co. Ltd. | 10.4% |
| Tencent Holdings Ltd. | 4.3% |
| Alibaba Group Holding Ltd. | 3.5% |
| Hon Hai Precision Industry Co. Ltd. | 3.2% |
| SK hynix, Inc. | 2.8% |
| ASE Technology Holding Co. Ltd | 2.7% |
| MediaTek, Inc. | 2.4% |
| HDFC Bank Ltd. | 2.1% |
| Delta Electronics, Inc. | 2.0% |
FUND EXPENSES
What were the fund costs for the last year?
| (based on a hypothetical $10,000 investment) | ||
| Class Name | Costs of a $10,000 investment | Costs paid as a percentage of a $10,000 investment |
| R1 | $251 | 2.06% |
MANAGEMENT'S DISCUSSION OF FUND PERFORMANCE
-
For the twelve months ended May 31, 2026, Class R1 shares of the MFS Emerging Markets Equity Fund (fund) provided a total return of 43.35%, at net asset value. This compares with a return of 54.31% for the fund’s benchmark, the MSCI Emerging Markets Index (net div).
-
Global equity markets reached record levels during the period, withstanding considerable volatility amid tariffs, geopolitical conflict and high levels of uncertainty. A new geopolitical event distressed markets at the end of the period as US and Israeli forces launched strikes against Iran, disrupting Mideast oil and natural gas exports. During the period, a pro-growth tax and spending bill was signed into law in the US, while in Europe, renewed focus on defense and infrastructure spending brightened the economic outlook. In Japan, the election of a pro-growth prime minister sent stocks to new highs prior to the conflict in Iran. Optimism over artificial intelligence remained high.
-
Considerable progress was made in trade talks between the US and many major trading partners, with a fragile truce between the US and China extended through late 2026. While the US Supreme Court struck down part of the Trump administration’s tariff strategy, the administration began deploying other authorities to largely replace the ones that were ruled unconstitutional.
-
Early in the period, moderating inflation pressures allowed many global central banks to ease monetary policy. Amid a difficult policymaking environment and slower job growth, the Federal Reserve resumed easing policy in September and delivered quarter-point rate cuts in October and December before pausing.
-
In fixed income markets, previously range-bound global bond yields spiked following the onset of the Middle East conflict, as energy-driven inflation fears appeared to have rattled bond investors. US rate volatility (as measured by the Merrill Lynch Option Volatility Estimate (MOVE) Index) similarly rose from intra-period lows, reflecting uncertainty around the scope and duration of the conflict and its implications for global growth. However, volatility later retracted as the risk of a broader regional military escalation appeared less likely. Global credit spreads widened only modestly before stabilizing near prior levels, supported by strong demand and resilient underlying fundamentals.
-
Top contributors to performance relative to the MSCI Emerging Markets Index:
-
Security selection and an underweight allocation to the financials sector strengthened the fund's relative performance.
-
An underweight allocation to the health care sector also benefited relative returns.
-
-
Top detractors from performance relative to the MSCI Emerging Markets Index:
-
Security selection and an underweight allocation to the information technology sector detracted from the fund's relative performance. Additionally, an overweight allocation to the consumer staples sector further weighed on relative results.
-
Security selection and the fund's underweight allocation to the consumer discretionary sector also detracted from relative performance.
-
FUND PERFORMANCE
The fund’s past performance is not a good predictor of the fund’s future performance. The graph and table below do not reflect the deduction of taxes that a shareholder would pay on fund distributions or the redemption of fund shares. The graph and table below assume reinvestment of dividends and capital gain distributions.
Growth of a Hypothetical $10,000 Investment
This graph shows the performance of a hypothetical $10,000 investment in Class R1 over a ten year period or since inception, if shorter, in comparison to a broad measure of market performance.
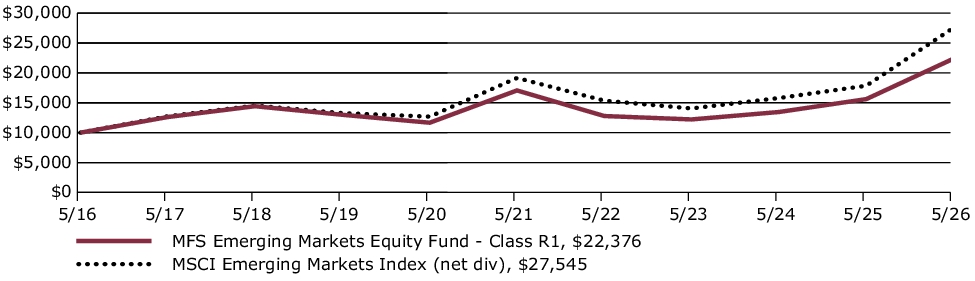
Average Annual Total Returns through 5/31/26
This table shows the average annual total returns of the class of shares noted for the periods shown, both with (if any) and without sales charges. It also shows the average annual total returns of a broad measure of market performance over the same periods.
| Share Class | 1-yr | 5-yr | 10-yr |
| R1 without sales charge | 43.35% | 5.57% | 8.39% |
| Comparative Benchmark(s) | |||
| MSCI Emerging Markets Index (net div) ∆ | 54.31% | 7.54% | 10.66% |
|
∆
|
Source: FactSet Research Systems Inc.
|
Visit mfs.com/perf/r1 for more recent performance information.
FUND STATISTICS AS OF 5/31/26
| Net Assets ($): | 10,317,220,321 | Total Management Fee ($)#: | 82,489,487 | |
| Total Number of Holdings: | 94 | Portfolio Turnover Rate (%): | 45 |
# Includes the effect of any management fee waivers, if applicable.
Where the fund holds derivatives, they are not included in the total number of portfolio holdings.
PORTFOLIO COMPOSITION (BASED ON TOTAL INVESTMENTS AS OF 5/31/26)
Portfolio structure
| Equities | 98.9% |
| Money Market Funds | 1.1% |
Top ten holdings
| Taiwan Semiconductor Manufacturing Co. Ltd. | 13.5% |
| Samsung Electronics Co. Ltd. | 10.4% |
| Tencent Holdings Ltd. | 4.3% |
| Alibaba Group Holding Ltd. | 3.5% |
| Hon Hai Precision Industry Co. Ltd. | 3.2% |
| SK hynix, Inc. | 2.8% |
| ASE Technology Holding Co. Ltd | 2.7% |
| MediaTek, Inc. | 2.4% |
| HDFC Bank Ltd. | 2.1% |
| Delta Electronics, Inc. | 2.0% |
Issuer country weightings
| Taiwan | 24.7% |
| China | 21.5% |
| South Korea | 20.4% |
| India | 12.1% |
| Brazil | 3.2% |
| Saudi Arabia | 2.6% |
| United States | 2.2% |
| United Arab Emirates | 2.1% |
| Hong Kong | 2.0% |
| Other Countries | 9.2% |
Top ten holdings
| Taiwan Semiconductor Manufacturing Co. Ltd. | 13.5% |
| Samsung Electronics Co. Ltd. | 10.4% |
| Tencent Holdings Ltd. | 4.3% |
| Alibaba Group Holding Ltd. | 3.5% |
| Hon Hai Precision Industry Co. Ltd. | 3.2% |
| SK hynix, Inc. | 2.8% |
| ASE Technology Holding Co. Ltd | 2.7% |
| MediaTek, Inc. | 2.4% |
| HDFC Bank Ltd. | 2.1% |
| Delta Electronics, Inc. | 2.0% |
FUND EXPENSES
What were the fund costs for the last year?
| (based on a hypothetical $10,000 investment) | ||
| Class Name | Costs of a $10,000 investment | Costs paid as a percentage of a $10,000 investment |
| R2 | $190 | 1.56% |
MANAGEMENT'S DISCUSSION OF FUND PERFORMANCE
-
For the twelve months ended May 31, 2026, Class R2 shares of the MFS Emerging Markets Equity Fund (fund) provided a total return of 44.01%, at net asset value. This compares with a return of 54.31% for the fund’s benchmark, the MSCI Emerging Markets Index (net div).
-
Global equity markets reached record levels during the period, withstanding considerable volatility amid tariffs, geopolitical conflict and high levels of uncertainty. A new geopolitical event distressed markets at the end of the period as US and Israeli forces launched strikes against Iran, disrupting Mideast oil and natural gas exports. During the period, a pro-growth tax and spending bill was signed into law in the US, while in Europe, renewed focus on defense and infrastructure spending brightened the economic outlook. In Japan, the election of a pro-growth prime minister sent stocks to new highs prior to the conflict in Iran. Optimism over artificial intelligence remained high.
-
Considerable progress was made in trade talks between the US and many major trading partners, with a fragile truce between the US and China extended through late 2026. While the US Supreme Court struck down part of the Trump administration’s tariff strategy, the administration began deploying other authorities to largely replace the ones that were ruled unconstitutional.
-
Early in the period, moderating inflation pressures allowed many global central banks to ease monetary policy. Amid a difficult policymaking environment and slower job growth, the Federal Reserve resumed easing policy in September and delivered quarter-point rate cuts in October and December before pausing.
-
In fixed income markets, previously range-bound global bond yields spiked following the onset of the Middle East conflict, as energy-driven inflation fears appeared to have rattled bond investors. US rate volatility (as measured by the Merrill Lynch Option Volatility Estimate (MOVE) Index) similarly rose from intra-period lows, reflecting uncertainty around the scope and duration of the conflict and its implications for global growth. However, volatility later retracted as the risk of a broader regional military escalation appeared less likely. Global credit spreads widened only modestly before stabilizing near prior levels, supported by strong demand and resilient underlying fundamentals.
-
Top contributors to performance relative to the MSCI Emerging Markets Index:
-
Security selection and an underweight allocation to the financials sector strengthened the fund's relative performance.
-
An underweight allocation to the health care sector also benefited relative returns.
-
-
Top detractors from performance relative to the MSCI Emerging Markets Index:
-
Security selection and an underweight allocation to the information technology sector detracted from the fund's relative performance. Additionally, an overweight allocation to the consumer staples sector further weighed on relative results.
-
Security selection and the fund's underweight allocation to the consumer discretionary sector also detracted from relative performance.
-
FUND PERFORMANCE
The fund’s past performance is not a good predictor of the fund’s future performance. The graph and table below do not reflect the deduction of taxes that a shareholder would pay on fund distributions or the redemption of fund shares. The graph and table below assume reinvestment of dividends and capital gain distributions.
Growth of a Hypothetical $10,000 Investment
This graph shows the performance of a hypothetical $10,000 investment in Class R2 over a ten year period or since inception, if shorter, in comparison to a broad measure of market performance.
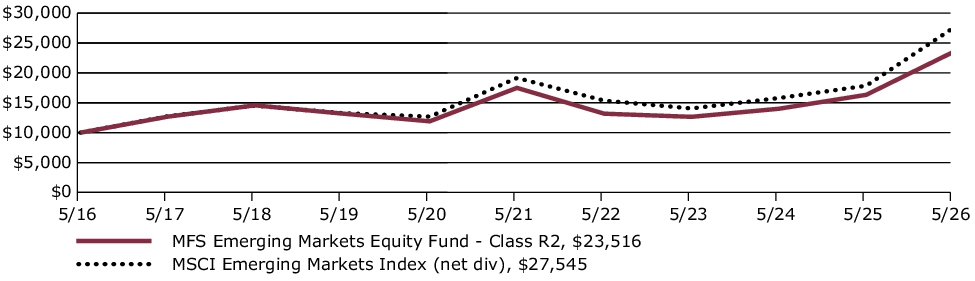
Average Annual Total Returns through 5/31/26
This table shows the average annual total returns of the class of shares noted for the periods shown, both with (if any) and without sales charges. It also shows the average annual total returns of a broad measure of market performance over the same periods.
| Share Class | 1-yr | 5-yr | 10-yr |
| R2 without sales charge | 44.01% | 6.10% | 8.93% |
| Comparative Benchmark(s) | |||
| MSCI Emerging Markets Index (net div) ∆ | 54.31% | 7.54% | 10.66% |
|
∆
|
Source: FactSet Research Systems Inc.
|
Visit mfs.com/perf/r2 for more recent performance information.
FUND STATISTICS AS OF 5/31/26
| Net Assets ($): | 10,317,220,321 | Total Management Fee ($)#: | 82,489,487 | |
| Total Number of Holdings: | 94 | Portfolio Turnover Rate (%): | 45 |
# Includes the effect of any management fee waivers, if applicable.
Where the fund holds derivatives, they are not included in the total number of portfolio holdings.
PORTFOLIO COMPOSITION (BASED ON TOTAL INVESTMENTS AS OF 5/31/26)
Portfolio structure
| Equities | 98.9% |
| Money Market Funds | 1.1% |
Top ten holdings
| Taiwan Semiconductor Manufacturing Co. Ltd. | 13.5% |
| Samsung Electronics Co. Ltd. | 10.4% |
| Tencent Holdings Ltd. | 4.3% |
| Alibaba Group Holding Ltd. | 3.5% |
| Hon Hai Precision Industry Co. Ltd. | 3.2% |
| SK hynix, Inc. | 2.8% |
| ASE Technology Holding Co. Ltd | 2.7% |
| MediaTek, Inc. | 2.4% |
| HDFC Bank Ltd. | 2.1% |
| Delta Electronics, Inc. | 2.0% |
Issuer country weightings
| Taiwan | 24.7% |
| China | 21.5% |
| South Korea | 20.4% |
| India | 12.1% |
| Brazil | 3.2% |
| Saudi Arabia | 2.6% |
| United States | 2.2% |
| United Arab Emirates | 2.1% |
| Hong Kong | 2.0% |
| Other Countries | 9.2% |
Top ten holdings
| Taiwan Semiconductor Manufacturing Co. Ltd. | 13.5% |
| Samsung Electronics Co. Ltd. | 10.4% |
| Tencent Holdings Ltd. | 4.3% |
| Alibaba Group Holding Ltd. | 3.5% |
| Hon Hai Precision Industry Co. Ltd. | 3.2% |
| SK hynix, Inc. | 2.8% |
| ASE Technology Holding Co. Ltd | 2.7% |
| MediaTek, Inc. | 2.4% |
| HDFC Bank Ltd. | 2.1% |
| Delta Electronics, Inc. | 2.0% |
FUND EXPENSES
What were the fund costs for the last year?
| (based on a hypothetical $10,000 investment) | ||
| Class Name | Costs of a $10,000 investment | Costs paid as a percentage of a $10,000 investment |
| R3 | $160 | 1.31% |
MANAGEMENT'S DISCUSSION OF FUND PERFORMANCE
-
For the twelve months ended May 31, 2026, Class R3 shares of the MFS Emerging Markets Equity Fund (fund) provided a total return of 44.39%, at net asset value. This compares with a return of 54.31% for the fund’s benchmark, the MSCI Emerging Markets Index (net div).
-
Global equity markets reached record levels during the period, withstanding considerable volatility amid tariffs, geopolitical conflict and high levels of uncertainty. A new geopolitical event distressed markets at the end of the period as US and Israeli forces launched strikes against Iran, disrupting Mideast oil and natural gas exports. During the period, a pro-growth tax and spending bill was signed into law in the US, while in Europe, renewed focus on defense and infrastructure spending brightened the economic outlook. In Japan, the election of a pro-growth prime minister sent stocks to new highs prior to the conflict in Iran. Optimism over artificial intelligence remained high.
-
Considerable progress was made in trade talks between the US and many major trading partners, with a fragile truce between the US and China extended through late 2026. While the US Supreme Court struck down part of the Trump administration’s tariff strategy, the administration began deploying other authorities to largely replace the ones that were ruled unconstitutional.
-
Early in the period, moderating inflation pressures allowed many global central banks to ease monetary policy. Amid a difficult policymaking environment and slower job growth, the Federal Reserve resumed easing policy in September and delivered quarter-point rate cuts in October and December before pausing.
-
In fixed income markets, previously range-bound global bond yields spiked following the onset of the Middle East conflict, as energy-driven inflation fears appeared to have rattled bond investors. US rate volatility (as measured by the Merrill Lynch Option Volatility Estimate (MOVE) Index) similarly rose from intra-period lows, reflecting uncertainty around the scope and duration of the conflict and its implications for global growth. However, volatility later retracted as the risk of a broader regional military escalation appeared less likely. Global credit spreads widened only modestly before stabilizing near prior levels, supported by strong demand and resilient underlying fundamentals.
-
Top contributors to performance relative to the MSCI Emerging Markets Index:
-
Security selection and an underweight allocation to the financials sector strengthened the fund's relative performance.
-
An underweight allocation to the health care sector also benefited relative returns.
-
-
Top detractors from performance relative to the MSCI Emerging Markets Index:
-
Security selection and an underweight allocation to the information technology sector detracted from the fund's relative performance. Additionally, an overweight allocation to the consumer staples sector further weighed on relative results.
-
Security selection and the fund's underweight allocation to the consumer discretionary sector also detracted from relative performance.
-
FUND PERFORMANCE
The fund’s past performance is not a good predictor of the fund’s future performance. The graph and table below do not reflect the deduction of taxes that a shareholder would pay on fund distributions or the redemption of fund shares. The graph and table below assume reinvestment of dividends and capital gain distributions.
Growth of a Hypothetical $10,000 Investment
This graph shows the performance of a hypothetical $10,000 investment in Class R3 over a ten year period or since inception, if shorter, in comparison to a broad measure of market performance.
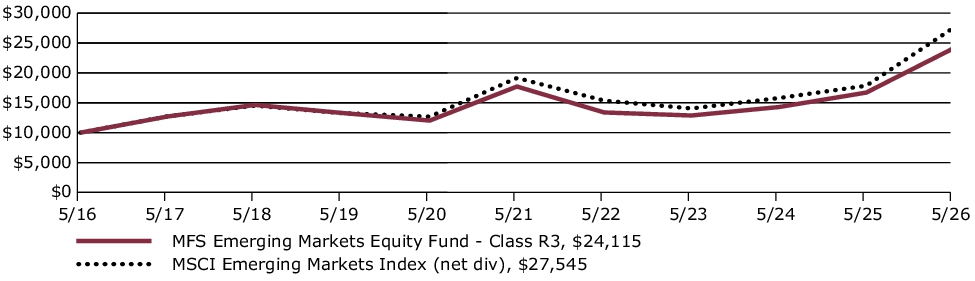
Average Annual Total Returns through 5/31/26
This table shows the average annual total returns of the class of shares noted for the periods shown, both with (if any) and without sales charges. It also shows the average annual total returns of a broad measure of market performance over the same periods.
| Share Class | 1-yr | 5-yr | 10-yr |
| R3 without sales charge | 44.39% | 6.36% | 9.20% |
| Comparative Benchmark(s) | |||
| MSCI Emerging Markets Index (net div) ∆ | 54.31% | 7.54% | 10.66% |
|
∆
|
Source: FactSet Research Systems Inc.
|
Visit mfs.com/perf/r3 for more recent performance information.
FUND STATISTICS AS OF 5/31/26
| Net Assets ($): | 10,317,220,321 | Total Management Fee ($)#: | 82,489,487 | |
| Total Number of Holdings: | 94 | Portfolio Turnover Rate (%): | 45 |
# Includes the effect of any management fee waivers, if applicable.
Where the fund holds derivatives, they are not included in the total number of portfolio holdings.
PORTFOLIO COMPOSITION (BASED ON TOTAL INVESTMENTS AS OF 5/31/26)
Portfolio structure
| Equities | 98.9% |
| Money Market Funds | 1.1% |
Top ten holdings
| Taiwan Semiconductor Manufacturing Co. Ltd. | 13.5% |
| Samsung Electronics Co. Ltd. | 10.4% |
| Tencent Holdings Ltd. | 4.3% |
| Alibaba Group Holding Ltd. | 3.5% |
| Hon Hai Precision Industry Co. Ltd. | 3.2% |
| SK hynix, Inc. | 2.8% |
| ASE Technology Holding Co. Ltd | 2.7% |
| MediaTek, Inc. | 2.4% |
| HDFC Bank Ltd. | 2.1% |
| Delta Electronics, Inc. | 2.0% |
Issuer country weightings
| Taiwan | 24.7% |
| China | 21.5% |
| South Korea | 20.4% |
| India | 12.1% |
| Brazil | 3.2% |
| Saudi Arabia | 2.6% |
| United States | 2.2% |
| United Arab Emirates | 2.1% |
| Hong Kong | 2.0% |
| Other Countries | 9.2% |
Top ten holdings
| Taiwan Semiconductor Manufacturing Co. Ltd. | 13.5% |
| Samsung Electronics Co. Ltd. | 10.4% |
| Tencent Holdings Ltd. | 4.3% |
| Alibaba Group Holding Ltd. | 3.5% |
| Hon Hai Precision Industry Co. Ltd. | 3.2% |
| SK hynix, Inc. | 2.8% |
| ASE Technology Holding Co. Ltd | 2.7% |
| MediaTek, Inc. | 2.4% |
| HDFC Bank Ltd. | 2.1% |
| Delta Electronics, Inc. | 2.0% |
FUND EXPENSES
What were the fund costs for the last year?
| (based on a hypothetical $10,000 investment) | ||
| Class Name | Costs of a $10,000 investment | Costs paid as a percentage of a $10,000 investment |
| R4 | $130 | 1.06% |
MANAGEMENT'S DISCUSSION OF FUND PERFORMANCE
-
For the twelve months ended May 31, 2026, Class R4 shares of the MFS Emerging Markets Equity Fund (fund) provided a total return of 44.78%, at net asset value. This compares with a return of 54.31% for the fund’s benchmark, the MSCI Emerging Markets Index (net div).
-
Global equity markets reached record levels during the period, withstanding considerable volatility amid tariffs, geopolitical conflict and high levels of uncertainty. A new geopolitical event distressed markets at the end of the period as US and Israeli forces launched strikes against Iran, disrupting Mideast oil and natural gas exports. During the period, a pro-growth tax and spending bill was signed into law in the US, while in Europe, renewed focus on defense and infrastructure spending brightened the economic outlook. In Japan, the election of a pro-growth prime minister sent stocks to new highs prior to the conflict in Iran. Optimism over artificial intelligence remained high.
-
Considerable progress was made in trade talks between the US and many major trading partners, with a fragile truce between the US and China extended through late 2026. While the US Supreme Court struck down part of the Trump administration’s tariff strategy, the administration began deploying other authorities to largely replace the ones that were ruled unconstitutional.
-
Early in the period, moderating inflation pressures allowed many global central banks to ease monetary policy. Amid a difficult policymaking environment and slower job growth, the Federal Reserve resumed easing policy in September and delivered quarter-point rate cuts in October and December before pausing.
-
In fixed income markets, previously range-bound global bond yields spiked following the onset of the Middle East conflict, as energy-driven inflation fears appeared to have rattled bond investors. US rate volatility (as measured by the Merrill Lynch Option Volatility Estimate (MOVE) Index) similarly rose from intra-period lows, reflecting uncertainty around the scope and duration of the conflict and its implications for global growth. However, volatility later retracted as the risk of a broader regional military escalation appeared less likely. Global credit spreads widened only modestly before stabilizing near prior levels, supported by strong demand and resilient underlying fundamentals.
-
Top contributors to performance relative to the MSCI Emerging Markets Index:
-
Security selection and an underweight allocation to the financials sector strengthened the fund's relative performance.
-
An underweight allocation to the health care sector also benefited relative returns.
-
-
Top detractors from performance relative to the MSCI Emerging Markets Index:
-
Security selection and an underweight allocation to the information technology sector detracted from the fund's relative performance. Additionally, an overweight allocation to the consumer staples sector further weighed on relative results.
-
Security selection and the fund's underweight allocation to the consumer discretionary sector also detracted from relative performance.
-
FUND PERFORMANCE
The fund’s past performance is not a good predictor of the fund’s future performance. The graph and table below do not reflect the deduction of taxes that a shareholder would pay on fund distributions or the redemption of fund shares. The graph and table below assume reinvestment of dividends and capital gain distributions.
Growth of a Hypothetical $10,000 Investment
This graph shows the performance of a hypothetical $10,000 investment in Class R4 over a ten year period or since inception, if shorter, in comparison to a broad measure of market performance.
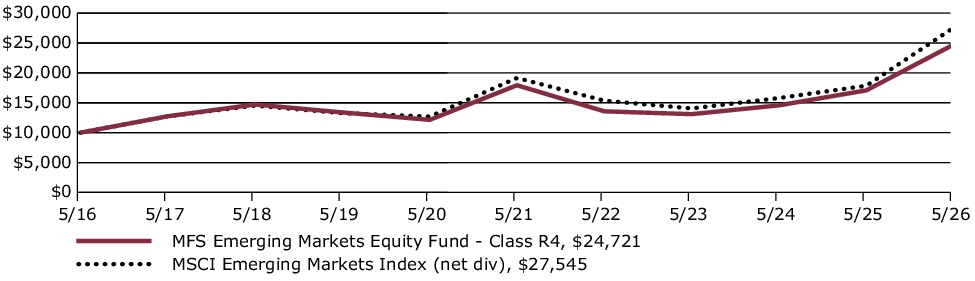
Average Annual Total Returns through 5/31/26
This table shows the average annual total returns of the class of shares noted for the periods shown, both with (if any) and without sales charges. It also shows the average annual total returns of a broad measure of market performance over the same periods.
| Share Class | 1-yr | 5-yr | 10-yr |
| R4 without sales charge | 44.78% | 6.64% | 9.47% |
| Comparative Benchmark(s) | |||
| MSCI Emerging Markets Index (net div) ∆ | 54.31% | 7.54% | 10.66% |
|
∆
|
Source: FactSet Research Systems Inc.
|
Visit mfs.com/perf/r4 for more recent performance information.
FUND STATISTICS AS OF 5/31/26
| Net Assets ($): | 10,317,220,321 | Total Management Fee ($)#: | 82,489,487 | |
| Total Number of Holdings: | 94 | Portfolio Turnover Rate (%): | 45 |
# Includes the effect of any management fee waivers, if applicable.
Where the fund holds derivatives, they are not included in the total number of portfolio holdings.
PORTFOLIO COMPOSITION (BASED ON TOTAL INVESTMENTS AS OF 5/31/26)
Portfolio structure
| Equities | 98.9% |
| Money Market Funds | 1.1% |
Top ten holdings
| Taiwan Semiconductor Manufacturing Co. Ltd. | 13.5% |
| Samsung Electronics Co. Ltd. | 10.4% |
| Tencent Holdings Ltd. | 4.3% |
| Alibaba Group Holding Ltd. | 3.5% |
| Hon Hai Precision Industry Co. Ltd. | 3.2% |
| SK hynix, Inc. | 2.8% |
| ASE Technology Holding Co. Ltd | 2.7% |
| MediaTek, Inc. | 2.4% |
| HDFC Bank Ltd. | 2.1% |
| Delta Electronics, Inc. | 2.0% |
Issuer country weightings
| Taiwan | 24.7% |
| China | 21.5% |
| South Korea | 20.4% |
| India | 12.1% |
| Brazil | 3.2% |
| Saudi Arabia | 2.6% |
| United States | 2.2% |
| United Arab Emirates | 2.1% |
| Hong Kong | 2.0% |
| Other Countries | 9.2% |
Top ten holdings
| Taiwan Semiconductor Manufacturing Co. Ltd. | 13.5% |
| Samsung Electronics Co. Ltd. | 10.4% |
| Tencent Holdings Ltd. | 4.3% |
| Alibaba Group Holding Ltd. | 3.5% |
| Hon Hai Precision Industry Co. Ltd. | 3.2% |
| SK hynix, Inc. | 2.8% |
| ASE Technology Holding Co. Ltd | 2.7% |
| MediaTek, Inc. | 2.4% |
| HDFC Bank Ltd. | 2.1% |
| Delta Electronics, Inc. | 2.0% |
FUND EXPENSES
What were the fund costs for the last year?
| (based on a hypothetical $10,000 investment) | ||
| Class Name | Costs of a $10,000 investment | Costs paid as a percentage of a $10,000 investment |
| R6 | $114 | 0.93% |
MANAGEMENT'S DISCUSSION OF FUND PERFORMANCE
-
For the twelve months ended May 31, 2026, Class R6 shares of the MFS Emerging Markets Equity Fund (fund) provided a total return of 44.97%, at net asset value. This compares with a return of 54.31% for the fund’s benchmark, the MSCI Emerging Markets Index (net div).
-
Global equity markets reached record levels during the period, withstanding considerable volatility amid tariffs, geopolitical conflict and high levels of uncertainty. A new geopolitical event distressed markets at the end of the period as US and Israeli forces launched strikes against Iran, disrupting Mideast oil and natural gas exports. During the period, a pro-growth tax and spending bill was signed into law in the US, while in Europe, renewed focus on defense and infrastructure spending brightened the economic outlook. In Japan, the election of a pro-growth prime minister sent stocks to new highs prior to the conflict in Iran. Optimism over artificial intelligence remained high.
-
Considerable progress was made in trade talks between the US and many major trading partners, with a fragile truce between the US and China extended through late 2026. While the US Supreme Court struck down part of the Trump administration’s tariff strategy, the administration began deploying other authorities to largely replace the ones that were ruled unconstitutional.
-
Early in the period, moderating inflation pressures allowed many global central banks to ease monetary policy. Amid a difficult policymaking environment and slower job growth, the Federal Reserve resumed easing policy in September and delivered quarter-point rate cuts in October and December before pausing.
-
In fixed income markets, previously range-bound global bond yields spiked following the onset of the Middle East conflict, as energy-driven inflation fears appeared to have rattled bond investors. US rate volatility (as measured by the Merrill Lynch Option Volatility Estimate (MOVE) Index) similarly rose from intra-period lows, reflecting uncertainty around the scope and duration of the conflict and its implications for global growth. However, volatility later retracted as the risk of a broader regional military escalation appeared less likely. Global credit spreads widened only modestly before stabilizing near prior levels, supported by strong demand and resilient underlying fundamentals.
-
Top contributors to performance relative to the MSCI Emerging Markets Index:
-
Security selection and an underweight allocation to the financials sector strengthened the fund's relative performance.
-
An underweight allocation to the health care sector also benefited relative returns.
-
-
Top detractors from performance relative to the MSCI Emerging Markets Index:
-
Security selection and an underweight allocation to the information technology sector detracted from the fund's relative performance. Additionally, an overweight allocation to the consumer staples sector further weighed on relative results.
-
Security selection and the fund's underweight allocation to the consumer discretionary sector also detracted from relative performance.
-
FUND PERFORMANCE
The fund’s past performance is not a good predictor of the fund’s future performance. The graph and table below do not reflect the deduction of taxes that a shareholder would pay on fund distributions or the redemption of fund shares. The graph and table below assume reinvestment of dividends and capital gain distributions.
Growth of a Hypothetical $10,000 Investment
This graph shows the performance of a hypothetical $10,000 investment in Class R6 over a ten year period or since inception, if shorter, in comparison to a broad measure of market performance.
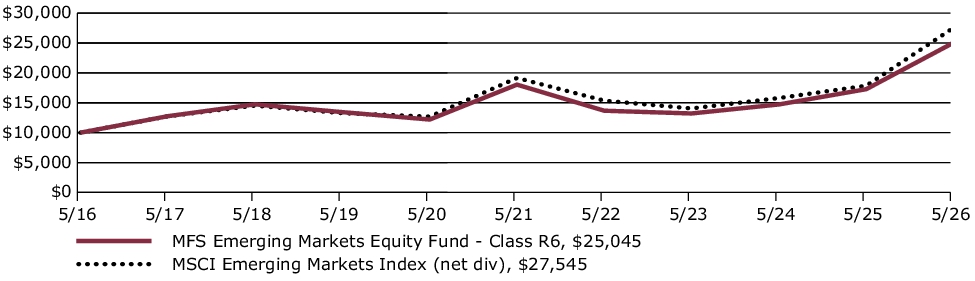
Average Annual Total Returns through 5/31/26
This table shows the average annual total returns of the class of shares noted for the periods shown, both with (if any) and without sales charges. It also shows the average annual total returns of a broad measure of market performance over the same periods.
| Share Class | 1-yr | 5-yr | 10-yr |
| R6 without sales charge | 44.97% | 6.79% | 9.62% |
| Comparative Benchmark(s) | |||
| MSCI Emerging Markets Index (net div) ∆ | 54.31% | 7.54% | 10.66% |
|
∆
|
Source: FactSet Research Systems Inc.
|
Visit mfs.com/perf/r6 for more recent performance information.
FUND STATISTICS AS OF 5/31/26
| Net Assets ($): | 10,317,220,321 | Total Management Fee ($)#: | 82,489,487 | |
| Total Number of Holdings: | 94 | Portfolio Turnover Rate (%): | 45 |
# Includes the effect of any management fee waivers, if applicable.
Where the fund holds derivatives, they are not included in the total number of portfolio holdings.
PORTFOLIO COMPOSITION (BASED ON TOTAL INVESTMENTS AS OF 5/31/26)
Portfolio structure
| Equities | 98.9% |
| Money Market Funds | 1.1% |
Top ten holdings
| Taiwan Semiconductor Manufacturing Co. Ltd. | 13.5% |
| Samsung Electronics Co. Ltd. | 10.4% |
| Tencent Holdings Ltd. | 4.3% |
| Alibaba Group Holding Ltd. | 3.5% |
| Hon Hai Precision Industry Co. Ltd. | 3.2% |
| SK hynix, Inc. | 2.8% |
| ASE Technology Holding Co. Ltd | 2.7% |
| MediaTek, Inc. | 2.4% |
| HDFC Bank Ltd. | 2.1% |
| Delta Electronics, Inc. | 2.0% |
Issuer country weightings
| Taiwan | 24.7% |
| China | 21.5% |
| South Korea | 20.4% |
| India | 12.1% |
| Brazil | 3.2% |
| Saudi Arabia | 2.6% |
| United States | 2.2% |
| United Arab Emirates | 2.1% |
| Hong Kong | 2.0% |
| Other Countries | 9.2% |
Top ten holdings
| Taiwan Semiconductor Manufacturing Co. Ltd. | 13.5% |
| Samsung Electronics Co. Ltd. | 10.4% |
| Tencent Holdings Ltd. | 4.3% |
| Alibaba Group Holding Ltd. | 3.5% |
| Hon Hai Precision Industry Co. Ltd. | 3.2% |
| SK hynix, Inc. | 2.8% |
| ASE Technology Holding Co. Ltd | 2.7% |
| MediaTek, Inc. | 2.4% |
| HDFC Bank Ltd. | 2.1% |
| Delta Electronics, Inc. | 2.0% |
FUND EXPENSES
What were the fund costs for the last year?
| (based on a hypothetical $10,000 investment) | ||
| Class Name | Costs of a $10,000 investment ~ | Costs paid as a percentage of a $10,000 investment ~ |
| R6 | $2 | 0.02% |
˜ Expenses are direct expenses and do not include underlying fund fees and expenses.
MANAGEMENT'S DISCUSSION OF FUND PERFORMANCE
-
For the twelve months ended May 31, 2026, Class R6 shares of the MFS Growth Allocation Fund (fund) provided a total return of 15.56%, at net asset value. This compares with a return of 29.78% for the fund’s benchmark, the Standard & Poor's 500 Stock Index. The fund's other benchmark, the MFS Growth Allocation Fund Blended Index (Blended Index), generated a return of 23.16%. The Blended Index reflects the blended returns of broad asset class indices, with percentage allocations to each index designed to resemble the long term strategic allocations of the fund. The market indices and related percentage allocations used to compile the Blended Index are set forth in the Fund Performance.
-
Global equity markets reached record levels during the period, withstanding considerable volatility amid tariffs, geopolitical conflict and high levels of uncertainty. A new geopolitical event distressed markets at the end of the period as US and Israeli forces launched strikes against Iran, disrupting Mideast oil and natural gas exports. During the period, a pro-growth tax and spending bill was signed into law in the US, while in Europe, renewed focus on defense and infrastructure spending brightened the economic outlook. In Japan, the election of a pro-growth prime minister sent stocks to new highs prior to the conflict in Iran. Optimism over artificial intelligence remained high.
-
Considerable progress was made in trade talks between the US and many major trading partners, with a fragile truce between the US and China extended through late 2026. While the US Supreme Court struck down part of the Trump administration’s tariff strategy, the administration began deploying other authorities to largely replace the ones that were ruled unconstitutional.
-
Early in the period, moderating inflation pressures allowed many global central banks to ease monetary policy. Amid a difficult policymaking environment and slower job growth, the Federal Reserve resumed easing policy in September and delivered quarter-point rate cuts in October and December before pausing.
-
In fixed income markets, previously range-bound global bond yields spiked following the onset of the Middle East conflict, as energy-driven inflation fears appeared to have rattled bond investors. US rate volatility (as measured by the Merrill Lynch Option Volatility Estimate (MOVE) Index) similarly rose from intra-period lows, reflecting uncertainty around the scope and duration of the conflict and its implications for global growth. However, volatility later retracted as the risk of a broader regional military escalation appeared less likely. Global credit spreads widened only modestly before stabilizing near prior levels, supported by strong demand and resilient underlying fundamentals.
-
Top contributors to performance relative to the Blended Index:
-
Within the fixed income segment, exposure to the MFS Emerging Markets Debt Fund, MFS Emerging Markets Debt Local Currency Fund, and MFS High Income Fund supported relative performance.
-
Within the international equity segment, style selection contributed positively as exposure to emerging markets, value, growth, and small/mid-cap international strategies benefited relative results.
-
-
Top detractors from performance relative to the Blended Index:
-
Within the U.S. equity segment, lagging relative performance across the majority of the strategies weighed on relative results as the funds generally underperformed their respective benchmarks. Style selection also held back relative performance as mid-cap strategies underperformed the broader index.
-
Within the international equity segment, relative performance of the MFS International Growth Fund, MFS Research International Fund, and MFS International New Discovery Fund held back results as the funds lagged their respective benchmarks.
-
FUND PERFORMANCE
The fund’s past performance is not a good predictor of the fund’s future performance. The graph and table below do not reflect the deduction of taxes that a shareholder would pay on fund distributions or the redemption of fund shares. The graph and table below assume reinvestment of dividends and capital gain distributions.
Growth of a Hypothetical $10,000 Investment*
This graph shows the performance of a hypothetical $10,000 investment in Class R6 over a ten year period or since inception, if shorter, in comparison to (i) a broad measure of market performance and (ii) an additional index that MFS believes more closely reflects the market segments in which the fund invests.
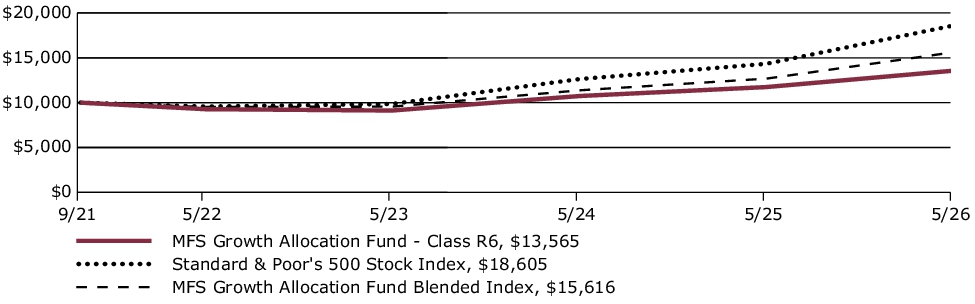
Average Annual Total Returns through 5/31/26
This table shows the average annual total returns of the class of shares noted for the periods shown, both with (if any) and without sales charges. It also shows the average annual total returns of (i) a broad measure of market performance and (ii) an additional index that MFS believes more closely reflects the market segments in which the fund invests, over the same periods.
| Share Class | 1-yr | Life* |
| R6 without sales charge | 15.56% | 6.75% |
| Comparative Benchmark(s) | ||
| Standard & Poor's 500 Stock Index ∆ | 29.78% | 14.21% |
| MFS Growth Allocation Fund Blended Index ∆ | 23.16% | 10.01% |
|
*
|
For the period from the commencement of the class's investment operations, September 30, 2021 through May 31, 2026.
|
|
∆
|
Source: FactSet Research Systems Inc.
|
Visit mfs.com/perf/r6 for more recent performance information.
FUND STATISTICS AS OF 5/31/26
| Net Assets ($): | 6,759,524,810 | Total Management Fee ($)#: | 0 | |
| Total Number of Holdings: | 22 | Portfolio Turnover Rate (%): | 3 |
# The fund itself does not pay a management fee but the underlying funds in which the fund invests do pay management fees to MFS.
PORTFOLIO COMPOSITION (BASED ON TOTAL INVESTMENTS AS OF 5/31/26)
Portfolio allocation
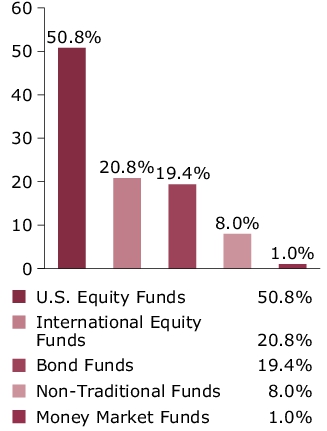
Portfolio holdings
| MFS Value Fund | 9.9% |
| MFS Research Fund | 9.4% |
| MFS Growth Fund | 9.4% |
| MFS Mid Cap Value Fund | 9.1% |
| MFS Mid Cap Growth Fund | 8.9% |
| MFS Research International Fund | 7.3% |
| MFS Inflation-Adjusted Bond Fund | 4.9% |
| MFS Global Real Estate Fund | 4.0% |
| MFS Commodity Strategy Fund | 4.0% |
| MFS High Income Fund | 4.0% |
| MFS International Large Cap Value Fund | 3.1% |
| MFS International Intrinsic Equity Fund | 3.1% |
| MFS International Growth Fund | 3.1% |
| MFS Emerging Markets Debt Fund | 3.0% |
| MFS Global Opportunistic Bond Fund | 3.0% |
| MFS Total Return Bond Fund | 2.5% |
| MFS Emerging Markets Equity Fund | 2.1% |
| MFS International New Discovery Fund | 2.1% |
| MFS New Discovery Fund | 2.1% |
| MFS New Discovery Value Fund | 2.0% |
| MFS Emerging Markets Debt Local Currency Fund | 2.0% |
| MFS Institutional Money Market Portfolio | 1.0% |
FUND EXPENSES
What were the fund costs for the last year?
| (based on a hypothetical $10,000 investment) | ||
| Class Name | Costs of a $10,000 investment ~ | Costs paid as a percentage of a $10,000 investment ~ |
| R4 | $10 | 0.09% |
˜ Expenses are direct expenses and do not include underlying fund fees and expenses.
MANAGEMENT'S DISCUSSION OF FUND PERFORMANCE
-
For the twelve months ended May 31, 2026, Class R4 shares of the MFS Growth Allocation Fund (fund) provided a total return of 15.50%, at net asset value. This compares with a return of 29.78% for the fund’s benchmark, the Standard & Poor's 500 Stock Index. The fund's other benchmark, the MFS Growth Allocation Fund Blended Index (Blended Index), generated a return of 23.16%. The Blended Index reflects the blended returns of broad asset class indices, with percentage allocations to each index designed to resemble the long term strategic allocations of the fund. The market indices and related percentage allocations used to compile the Blended Index are set forth in the Fund Performance.
-
Global equity markets reached record levels during the period, withstanding considerable volatility amid tariffs, geopolitical conflict and high levels of uncertainty. A new geopolitical event distressed markets at the end of the period as US and Israeli forces launched strikes against Iran, disrupting Mideast oil and natural gas exports. During the period, a pro-growth tax and spending bill was signed into law in the US, while in Europe, renewed focus on defense and infrastructure spending brightened the economic outlook. In Japan, the election of a pro-growth prime minister sent stocks to new highs prior to the conflict in Iran. Optimism over artificial intelligence remained high.
-
Considerable progress was made in trade talks between the US and many major trading partners, with a fragile truce between the US and China extended through late 2026. While the US Supreme Court struck down part of the Trump administration’s tariff strategy, the administration began deploying other authorities to largely replace the ones that were ruled unconstitutional.
-
Early in the period, moderating inflation pressures allowed many global central banks to ease monetary policy. Amid a difficult policymaking environment and slower job growth, the Federal Reserve resumed easing policy in September and delivered quarter-point rate cuts in October and December before pausing.
-
In fixed income markets, previously range-bound global bond yields spiked following the onset of the Middle East conflict, as energy-driven inflation fears appeared to have rattled bond investors. US rate volatility (as measured by the Merrill Lynch Option Volatility Estimate (MOVE) Index) similarly rose from intra-period lows, reflecting uncertainty around the scope and duration of the conflict and its implications for global growth. However, volatility later retracted as the risk of a broader regional military escalation appeared less likely. Global credit spreads widened only modestly before stabilizing near prior levels, supported by strong demand and resilient underlying fundamentals.
-
Top contributors to performance relative to the Blended Index:
-
Within the fixed income segment, exposure to the MFS Emerging Markets Debt Fund, MFS Emerging Markets Debt Local Currency Fund, and MFS High Income Fund supported relative performance.
-
Within the international equity segment, style selection contributed positively as exposure to emerging markets, value, growth, and small/mid-cap international strategies benefited relative results.
-
-
Top detractors from performance relative to the Blended Index:
-
Within the U.S. equity segment, lagging relative performance across the majority of the strategies weighed on relative results as the funds generally underperformed their respective benchmarks. Style selection also held back relative performance as mid-cap strategies underperformed the broader index.
-
Within the international equity segment, relative performance of the MFS International Growth Fund, MFS Research International Fund, and MFS International New Discovery Fund held back results as the funds lagged their respective benchmarks.
-
FUND PERFORMANCE
The fund’s past performance is not a good predictor of the fund’s future performance. The graph and table below do not reflect the deduction of taxes that a shareholder would pay on fund distributions or the redemption of fund shares. The graph and table below assume reinvestment of dividends and capital gain distributions.
Growth of a Hypothetical $10,000 Investment
This graph shows the performance of a hypothetical $10,000 investment in Class R4 over a ten year period or since inception, if shorter, in comparison to (i) a broad measure of market performance and (ii) an additional index that MFS believes more closely reflects the market segments in which the fund invests.
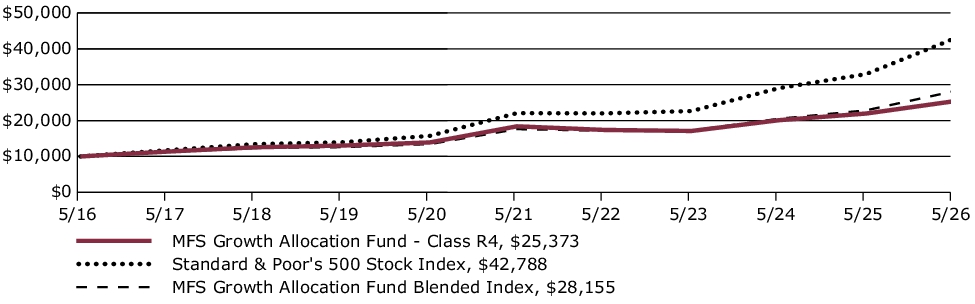
Average Annual Total Returns through 5/31/26
This table shows the average annual total returns of the class of shares noted for the periods shown, both with (if any) and without sales charges. It also shows the average annual total returns of (i) a broad measure of market performance and (ii) an additional index that MFS believes more closely reflects the market segments in which the fund invests, over the same periods.
| Share Class | 1-yr | 5-yr | 10-yr |
| R4 without sales charge | 15.50% | 6.63% | 9.76% |
| Comparative Benchmark(s) | |||
| Standard & Poor's 500 Stock Index ∆ | 29.78% | 14.15% | 15.65% |
| MFS Growth Allocation Fund Blended Index ∆ | 23.16% | 9.83% | 10.91% |
|
∆
|
Source: FactSet Research Systems Inc.
|
Visit mfs.com/perf/r4 for more recent performance information.
FUND STATISTICS AS OF 5/31/26
| Net Assets ($): | 6,759,524,810 | Total Management Fee ($)#: | 0 | |
| Total Number of Holdings: | 22 | Portfolio Turnover Rate (%): | 3 |
# The fund itself does not pay a management fee but the underlying funds in which the fund invests do pay management fees to MFS.
PORTFOLIO COMPOSITION (BASED ON TOTAL INVESTMENTS AS OF 5/31/26)
Portfolio allocation
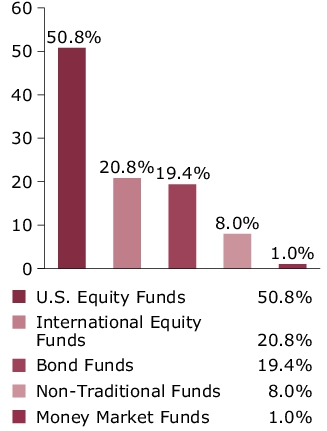
Portfolio holdings
| MFS Value Fund | 9.9% |
| MFS Research Fund | 9.4% |
| MFS Growth Fund | 9.4% |
| MFS Mid Cap Value Fund | 9.1% |
| MFS Mid Cap Growth Fund | 8.9% |
| MFS Research International Fund | 7.3% |
| MFS Inflation-Adjusted Bond Fund | 4.9% |
| MFS Global Real Estate Fund | 4.0% |
| MFS Commodity Strategy Fund | 4.0% |
| MFS High Income Fund | 4.0% |
| MFS International Large Cap Value Fund | 3.1% |
| MFS International Intrinsic Equity Fund | 3.1% |
| MFS International Growth Fund | 3.1% |
| MFS Emerging Markets Debt Fund | 3.0% |
| MFS Global Opportunistic Bond Fund | 3.0% |
| MFS Total Return Bond Fund | 2.5% |
| MFS Emerging Markets Equity Fund | 2.1% |
| MFS International New Discovery Fund | 2.1% |
| MFS New Discovery Fund | 2.1% |
| MFS New Discovery Value Fund | 2.0% |
| MFS Emerging Markets Debt Local Currency Fund | 2.0% |
| MFS Institutional Money Market Portfolio | 1.0% |
FUND EXPENSES
What were the fund costs for the last year?
| (based on a hypothetical $10,000 investment) | ||
| Class Name | Costs of a $10,000 investment ~ | Costs paid as a percentage of a $10,000 investment ~ |
| R3 | $37 | 0.34% |
˜ Expenses are direct expenses and do not include underlying fund fees and expenses.
MANAGEMENT'S DISCUSSION OF FUND PERFORMANCE
-
For the twelve months ended May 31, 2026, Class R3 shares of the MFS Growth Allocation Fund (fund) provided a total return of 15.22%, at net asset value. This compares with a return of 29.78% for the fund’s benchmark, the Standard & Poor's 500 Stock Index. The fund's other benchmark, the MFS Growth Allocation Fund Blended Index (Blended Index), generated a return of 23.16%. The Blended Index reflects the blended returns of broad asset class indices, with percentage allocations to each index designed to resemble the long term strategic allocations of the fund. The market indices and related percentage allocations used to compile the Blended Index are set forth in the Fund Performance.
-
Global equity markets reached record levels during the period, withstanding considerable volatility amid tariffs, geopolitical conflict and high levels of uncertainty. A new geopolitical event distressed markets at the end of the period as US and Israeli forces launched strikes against Iran, disrupting Mideast oil and natural gas exports. During the period, a pro-growth tax and spending bill was signed into law in the US, while in Europe, renewed focus on defense and infrastructure spending brightened the economic outlook. In Japan, the election of a pro-growth prime minister sent stocks to new highs prior to the conflict in Iran. Optimism over artificial intelligence remained high.
-
Considerable progress was made in trade talks between the US and many major trading partners, with a fragile truce between the US and China extended through late 2026. While the US Supreme Court struck down part of the Trump administration’s tariff strategy, the administration began deploying other authorities to largely replace the ones that were ruled unconstitutional.
-
Early in the period, moderating inflation pressures allowed many global central banks to ease monetary policy. Amid a difficult policymaking environment and slower job growth, the Federal Reserve resumed easing policy in September and delivered quarter-point rate cuts in October and December before pausing.
-
In fixed income markets, previously range-bound global bond yields spiked following the onset of the Middle East conflict, as energy-driven inflation fears appeared to have rattled bond investors. US rate volatility (as measured by the Merrill Lynch Option Volatility Estimate (MOVE) Index) similarly rose from intra-period lows, reflecting uncertainty around the scope and duration of the conflict and its implications for global growth. However, volatility later retracted as the risk of a broader regional military escalation appeared less likely. Global credit spreads widened only modestly before stabilizing near prior levels, supported by strong demand and resilient underlying fundamentals.
-
Top contributors to performance relative to the Blended Index:
-
Within the fixed income segment, exposure to the MFS Emerging Markets Debt Fund, MFS Emerging Markets Debt Local Currency Fund, and MFS High Income Fund supported relative performance.
-
Within the international equity segment, style selection contributed positively as exposure to emerging markets, value, growth, and small/mid-cap international strategies benefited relative results.
-
-
Top detractors from performance relative to the Blended Index:
-
Within the U.S. equity segment, lagging relative performance across the majority of the strategies weighed on relative results as the funds generally underperformed their respective benchmarks. Style selection also held back relative performance as mid-cap strategies underperformed the broader index.
-
Within the international equity segment, relative performance of the MFS International Growth Fund, MFS Research International Fund, and MFS International New Discovery Fund held back results as the funds lagged their respective benchmarks.
-
FUND PERFORMANCE
The fund’s past performance is not a good predictor of the fund’s future performance. The graph and table below do not reflect the deduction of taxes that a shareholder would pay on fund distributions or the redemption of fund shares. The graph and table below assume reinvestment of dividends and capital gain distributions.
Growth of a Hypothetical $10,000 Investment
This graph shows the performance of a hypothetical $10,000 investment in Class R3 over a ten year period or since inception, if shorter, in comparison to (i) a broad measure of market performance and (ii) an additional index that MFS believes more closely reflects the market segments in which the fund invests.
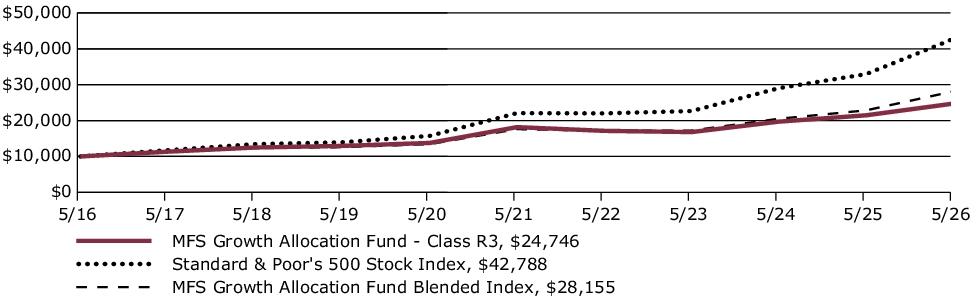
Average Annual Total Returns through 5/31/26
This table shows the average annual total returns of the class of shares noted for the periods shown, both with (if any) and without sales charges. It also shows the average annual total returns of (i) a broad measure of market performance and (ii) an additional index that MFS believes more closely reflects the market segments in which the fund invests, over the same periods.
| Share Class | 1-yr | 5-yr | 10-yr |
| R3 without sales charge | 15.22% | 6.37% | 9.48% |
| Comparative Benchmark(s) | |||
| Standard & Poor's 500 Stock Index ∆ | 29.78% | 14.15% | 15.65% |
| MFS Growth Allocation Fund Blended Index ∆ | 23.16% | 9.83% | 10.91% |
|
∆
|
Source: FactSet Research Systems Inc.
|
Visit mfs.com/perf/r3 for more recent performance information.
FUND STATISTICS AS OF 5/31/26
| Net Assets ($): | 6,759,524,810 | Total Management Fee ($)#: | 0 | |
| Total Number of Holdings: | 22 | Portfolio Turnover Rate (%): | 3 |
# The fund itself does not pay a management fee but the underlying funds in which the fund invests do pay management fees to MFS.
PORTFOLIO COMPOSITION (BASED ON TOTAL INVESTMENTS AS OF 5/31/26)
Portfolio allocation
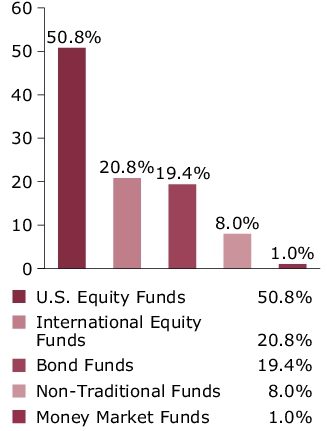
Portfolio holdings
| MFS Value Fund | 9.9% |
| MFS Research Fund | 9.4% |
| MFS Growth Fund | 9.4% |
| MFS Mid Cap Value Fund | 9.1% |
| MFS Mid Cap Growth Fund | 8.9% |
| MFS Research International Fund | 7.3% |
| MFS Inflation-Adjusted Bond Fund | 4.9% |
| MFS Global Real Estate Fund | 4.0% |
| MFS Commodity Strategy Fund | 4.0% |
| MFS High Income Fund | 4.0% |
| MFS International Large Cap Value Fund | 3.1% |
| MFS International Intrinsic Equity Fund | 3.1% |
| MFS International Growth Fund | 3.1% |
| MFS Emerging Markets Debt Fund | 3.0% |
| MFS Global Opportunistic Bond Fund | 3.0% |
| MFS Total Return Bond Fund | 2.5% |
| MFS Emerging Markets Equity Fund | 2.1% |
| MFS International New Discovery Fund | 2.1% |
| MFS New Discovery Fund | 2.1% |
| MFS New Discovery Value Fund | 2.0% |
| MFS Emerging Markets Debt Local Currency Fund | 2.0% |
| MFS Institutional Money Market Portfolio | 1.0% |
FUND EXPENSES
What were the fund costs for the last year?
| (based on a hypothetical $10,000 investment) | ||
| Class Name | Costs of a $10,000 investment ~ | Costs paid as a percentage of a $10,000 investment ~ |
| R2 | $63 | 0.59% |
˜ Expenses are direct expenses and do not include underlying fund fees and expenses.
MANAGEMENT'S DISCUSSION OF FUND PERFORMANCE
-
For the twelve months ended May 31, 2026, Class R2 shares of the MFS Growth Allocation Fund (fund) provided a total return of 14.95%, at net asset value. This compares with a return of 29.78% for the fund’s benchmark, the Standard & Poor's 500 Stock Index. The fund's other benchmark, the MFS Growth Allocation Fund Blended Index (Blended Index), generated a return of 23.16%. The Blended Index reflects the blended returns of broad asset class indices, with percentage allocations to each index designed to resemble the long term strategic allocations of the fund. The market indices and related percentage allocations used to compile the Blended Index are set forth in the Fund Performance.
-
Global equity markets reached record levels during the period, withstanding considerable volatility amid tariffs, geopolitical conflict and high levels of uncertainty. A new geopolitical event distressed markets at the end of the period as US and Israeli forces launched strikes against Iran, disrupting Mideast oil and natural gas exports. During the period, a pro-growth tax and spending bill was signed into law in the US, while in Europe, renewed focus on defense and infrastructure spending brightened the economic outlook. In Japan, the election of a pro-growth prime minister sent stocks to new highs prior to the conflict in Iran. Optimism over artificial intelligence remained high.
-
Considerable progress was made in trade talks between the US and many major trading partners, with a fragile truce between the US and China extended through late 2026. While the US Supreme Court struck down part of the Trump administration’s tariff strategy, the administration began deploying other authorities to largely replace the ones that were ruled unconstitutional.
-
Early in the period, moderating inflation pressures allowed many global central banks to ease monetary policy. Amid a difficult policymaking environment and slower job growth, the Federal Reserve resumed easing policy in September and delivered quarter-point rate cuts in October and December before pausing.
-
In fixed income markets, previously range-bound global bond yields spiked following the onset of the Middle East conflict, as energy-driven inflation fears appeared to have rattled bond investors. US rate volatility (as measured by the Merrill Lynch Option Volatility Estimate (MOVE) Index) similarly rose from intra-period lows, reflecting uncertainty around the scope and duration of the conflict and its implications for global growth. However, volatility later retracted as the risk of a broader regional military escalation appeared less likely. Global credit spreads widened only modestly before stabilizing near prior levels, supported by strong demand and resilient underlying fundamentals.
-
Top contributors to performance relative to the Blended Index:
-
Within the fixed income segment, exposure to the MFS Emerging Markets Debt Fund, MFS Emerging Markets Debt Local Currency Fund, and MFS High Income Fund supported relative performance.
-
Within the international equity segment, style selection contributed positively as exposure to emerging markets, value, growth, and small/mid-cap international strategies benefited relative results.
-
-
Top detractors from performance relative to the Blended Index:
-
Within the U.S. equity segment, lagging relative performance across the majority of the strategies weighed on relative results as the funds generally underperformed their respective benchmarks. Style selection also held back relative performance as mid-cap strategies underperformed the broader index.
-
Within the international equity segment, relative performance of the MFS International Growth Fund, MFS Research International Fund, and MFS International New Discovery Fund held back results as the funds lagged their respective benchmarks.
-
FUND PERFORMANCE
The fund’s past performance is not a good predictor of the fund’s future performance. The graph and table below do not reflect the deduction of taxes that a shareholder would pay on fund distributions or the redemption of fund shares. The graph and table below assume reinvestment of dividends and capital gain distributions.
Growth of a Hypothetical $10,000 Investment
This graph shows the performance of a hypothetical $10,000 investment in Class R2 over a ten year period or since inception, if shorter, in comparison to (i) a broad measure of market performance and (ii) an additional index that MFS believes more closely reflects the market segments in which the fund invests.
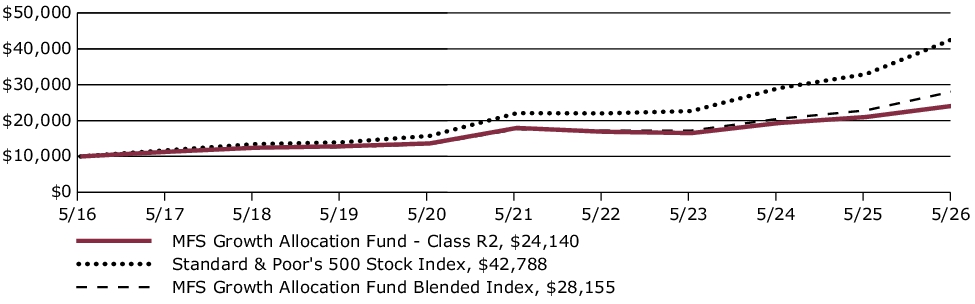
Average Annual Total Returns through 5/31/26
This table shows the average annual total returns of the class of shares noted for the periods shown, both with (if any) and without sales charges. It also shows the average annual total returns of (i) a broad measure of market performance and (ii) an additional index that MFS believes more closely reflects the market segments in which the fund invests, over the same periods.
| Share Class | 1-yr | 5-yr | 10-yr |
| R2 without sales charge | 14.95% | 6.11% | 9.21% |
| Comparative Benchmark(s) | |||
| Standard & Poor's 500 Stock Index ∆ | 29.78% | 14.15% | 15.65% |
| MFS Growth Allocation Fund Blended Index ∆ | 23.16% | 9.83% | 10.91% |
|
∆
|
Source: FactSet Research Systems Inc.
|
Visit mfs.com/perf/r2 for more recent performance information.
FUND STATISTICS AS OF 5/31/26
| Net Assets ($): | 6,759,524,810 | Total Management Fee ($)#: | 0 | |
| Total Number of Holdings: | 22 | Portfolio Turnover Rate (%): | 3 |
# The fund itself does not pay a management fee but the underlying funds in which the fund invests do pay management fees to MFS.
PORTFOLIO COMPOSITION (BASED ON TOTAL INVESTMENTS AS OF 5/31/26)
Portfolio allocation
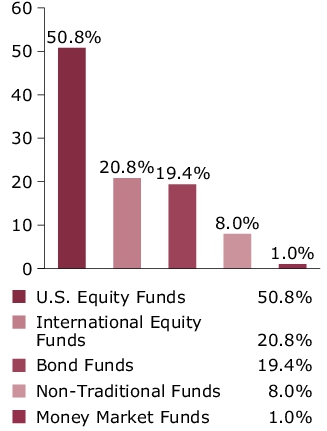
Portfolio holdings
| MFS Value Fund | 9.9% |
| MFS Research Fund | 9.4% |
| MFS Growth Fund | 9.4% |
| MFS Mid Cap Value Fund | 9.1% |
| MFS Mid Cap Growth Fund | 8.9% |
| MFS Research International Fund | 7.3% |
| MFS Inflation-Adjusted Bond Fund | 4.9% |
| MFS Global Real Estate Fund | 4.0% |
| MFS Commodity Strategy Fund | 4.0% |
| MFS High Income Fund | 4.0% |
| MFS International Large Cap Value Fund | 3.1% |
| MFS International Intrinsic Equity Fund | 3.1% |
| MFS International Growth Fund | 3.1% |
| MFS Emerging Markets Debt Fund | 3.0% |
| MFS Global Opportunistic Bond Fund | 3.0% |
| MFS Total Return Bond Fund | 2.5% |
| MFS Emerging Markets Equity Fund | 2.1% |
| MFS International New Discovery Fund | 2.1% |
| MFS New Discovery Fund | 2.1% |
| MFS New Discovery Value Fund | 2.0% |
| MFS Emerging Markets Debt Local Currency Fund | 2.0% |
| MFS Institutional Money Market Portfolio | 1.0% |
FUND EXPENSES
What were the fund costs for the last year?
| (based on a hypothetical $10,000 investment) | ||
| Class Name | Costs of a $10,000 investment ~ | Costs paid as a percentage of a $10,000 investment ~ |
| R1 | $117 | 1.09% |
˜ Expenses are direct expenses and do not include underlying fund fees and expenses.
MANAGEMENT'S DISCUSSION OF FUND PERFORMANCE
-
For the twelve months ended May 31, 2026, Class R1 shares of the MFS Growth Allocation Fund (fund) provided a total return of 14.36%, at net asset value. This compares with a return of 29.78% for the fund’s benchmark, the Standard & Poor's 500 Stock Index. The fund's other benchmark, the MFS Growth Allocation Fund Blended Index (Blended Index), generated a return of 23.16%. The Blended Index reflects the blended returns of broad asset class indices, with percentage allocations to each index designed to resemble the long term strategic allocations of the fund. The market indices and related percentage allocations used to compile the Blended Index are set forth in the Fund Performance.
-
Global equity markets reached record levels during the period, withstanding considerable volatility amid tariffs, geopolitical conflict and high levels of uncertainty. A new geopolitical event distressed markets at the end of the period as US and Israeli forces launched strikes against Iran, disrupting Mideast oil and natural gas exports. During the period, a pro-growth tax and spending bill was signed into law in the US, while in Europe, renewed focus on defense and infrastructure spending brightened the economic outlook. In Japan, the election of a pro-growth prime minister sent stocks to new highs prior to the conflict in Iran. Optimism over artificial intelligence remained high.
-
Considerable progress was made in trade talks between the US and many major trading partners, with a fragile truce between the US and China extended through late 2026. While the US Supreme Court struck down part of the Trump administration’s tariff strategy, the administration began deploying other authorities to largely replace the ones that were ruled unconstitutional.
-
Early in the period, moderating inflation pressures allowed many global central banks to ease monetary policy. Amid a difficult policymaking environment and slower job growth, the Federal Reserve resumed easing policy in September and delivered quarter-point rate cuts in October and December before pausing.
-
In fixed income markets, previously range-bound global bond yields spiked following the onset of the Middle East conflict, as energy-driven inflation fears appeared to have rattled bond investors. US rate volatility (as measured by the Merrill Lynch Option Volatility Estimate (MOVE) Index) similarly rose from intra-period lows, reflecting uncertainty around the scope and duration of the conflict and its implications for global growth. However, volatility later retracted as the risk of a broader regional military escalation appeared less likely. Global credit spreads widened only modestly before stabilizing near prior levels, supported by strong demand and resilient underlying fundamentals.
-
Top contributors to performance relative to the Blended Index:
-
Within the fixed income segment, exposure to the MFS Emerging Markets Debt Fund, MFS Emerging Markets Debt Local Currency Fund, and MFS High Income Fund supported relative performance.
-
Within the international equity segment, style selection contributed positively as exposure to emerging markets, value, growth, and small/mid-cap international strategies benefited relative results.
-
-
Top detractors from performance relative to the Blended Index:
-
Within the U.S. equity segment, lagging relative performance across the majority of the strategies weighed on relative results as the funds generally underperformed their respective benchmarks. Style selection also held back relative performance as mid-cap strategies underperformed the broader index.
-
Within the international equity segment, relative performance of the MFS International Growth Fund, MFS Research International Fund, and MFS International New Discovery Fund held back results as the funds lagged their respective benchmarks.
-
FUND PERFORMANCE
The fund’s past performance is not a good predictor of the fund’s future performance. The graph and table below do not reflect the deduction of taxes that a shareholder would pay on fund distributions or the redemption of fund shares. The graph and table below assume reinvestment of dividends and capital gain distributions.
Growth of a Hypothetical $10,000 Investment
This graph shows the performance of a hypothetical $10,000 investment in Class R1 over a ten year period or since inception, if shorter, in comparison to (i) a broad measure of market performance and (ii) an additional index that MFS believes more closely reflects the market segments in which the fund invests.
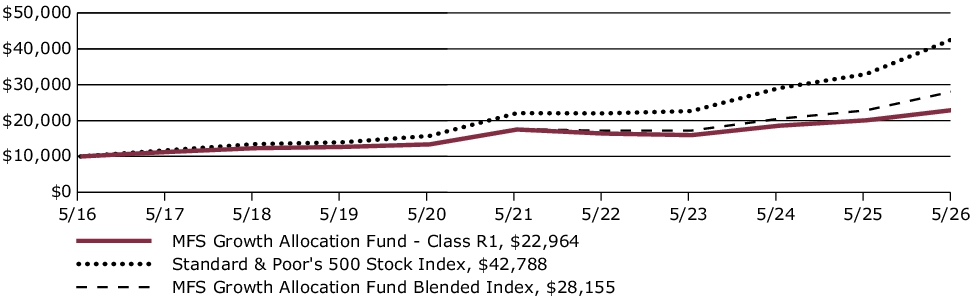
Average Annual Total Returns through 5/31/26
This table shows the average annual total returns of the class of shares noted for the periods shown, both with (if any) and without sales charges. It also shows the average annual total returns of (i) a broad measure of market performance and (ii) an additional index that MFS believes more closely reflects the market segments in which the fund invests, over the same periods.
| Share Class | 1-yr | 5-yr | 10-yr |
| R1 without sales charge | 14.36% | 5.57% | 8.67% |
| Comparative Benchmark(s) | |||
| Standard & Poor's 500 Stock Index ∆ | 29.78% | 14.15% | 15.65% |
| MFS Growth Allocation Fund Blended Index ∆ | 23.16% | 9.83% | 10.91% |
|
∆
|
Source: FactSet Research Systems Inc.
|
Visit mfs.com/perf/r1 for more recent performance information.
FUND STATISTICS AS OF 5/31/26
| Net Assets ($): | 6,759,524,810 | Total Management Fee ($)#: | 0 | |
| Total Number of Holdings: | 22 | Portfolio Turnover Rate (%): | 3 |
# The fund itself does not pay a management fee but the underlying funds in which the fund invests do pay management fees to MFS.
PORTFOLIO COMPOSITION (BASED ON TOTAL INVESTMENTS AS OF 5/31/26)
Portfolio allocation
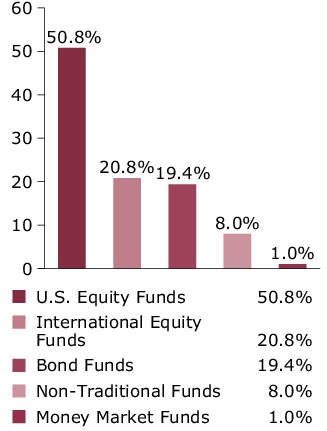
Portfolio holdings
| MFS Value Fund | 9.9% |
| MFS Research Fund | 9.4% |
| MFS Growth Fund | 9.4% |
| MFS Mid Cap Value Fund | 9.1% |
| MFS Mid Cap Growth Fund | 8.9% |
| MFS Research International Fund | 7.3% |
| MFS Inflation-Adjusted Bond Fund | 4.9% |
| MFS Global Real Estate Fund | 4.0% |
| MFS Commodity Strategy Fund | 4.0% |
| MFS High Income Fund | 4.0% |
| MFS International Large Cap Value Fund | 3.1% |
| MFS International Intrinsic Equity Fund | 3.1% |
| MFS International Growth Fund | 3.1% |
| MFS Emerging Markets Debt Fund | 3.0% |
| MFS Global Opportunistic Bond Fund | 3.0% |
| MFS Total Return Bond Fund | 2.5% |
| MFS Emerging Markets Equity Fund | 2.1% |
| MFS International New Discovery Fund | 2.1% |
| MFS New Discovery Fund | 2.1% |
| MFS New Discovery Value Fund | 2.0% |
| MFS Emerging Markets Debt Local Currency Fund | 2.0% |
| MFS Institutional Money Market Portfolio | 1.0% |
FUND EXPENSES
What were the fund costs for the last year?
| (based on a hypothetical $10,000 investment) | ||
| Class Name | Costs of a $10,000 investment ~ | Costs paid as a percentage of a $10,000 investment ~ |
| I | $10 | 0.09% |
˜ Expenses are direct expenses and do not include underlying fund fees and expenses.
MANAGEMENT'S DISCUSSION OF FUND PERFORMANCE
-
For the twelve months ended May 31, 2026, Class I shares of the MFS Growth Allocation Fund (fund) provided a total return of 15.49%, at net asset value. This compares with a return of 29.78% for the fund’s benchmark, the Standard & Poor's 500 Stock Index. The fund's other benchmark, the MFS Growth Allocation Fund Blended Index (Blended Index), generated a return of 23.16%. The Blended Index reflects the blended returns of broad asset class indices, with percentage allocations to each index designed to resemble the long term strategic allocations of the fund. The market indices and related percentage allocations used to compile the Blended Index are set forth in the Fund Performance.
-
Global equity markets reached record levels during the period, withstanding considerable volatility amid tariffs, geopolitical conflict and high levels of uncertainty. A new geopolitical event distressed markets at the end of the period as US and Israeli forces launched strikes against Iran, disrupting Mideast oil and natural gas exports. During the period, a pro-growth tax and spending bill was signed into law in the US, while in Europe, renewed focus on defense and infrastructure spending brightened the economic outlook. In Japan, the election of a pro-growth prime minister sent stocks to new highs prior to the conflict in Iran. Optimism over artificial intelligence remained high.
-
Considerable progress was made in trade talks between the US and many major trading partners, with a fragile truce between the US and China extended through late 2026. While the US Supreme Court struck down part of the Trump administration’s tariff strategy, the administration began deploying other authorities to largely replace the ones that were ruled unconstitutional.
-
Early in the period, moderating inflation pressures allowed many global central banks to ease monetary policy. Amid a difficult policymaking environment and slower job growth, the Federal Reserve resumed easing policy in September and delivered quarter-point rate cuts in October and December before pausing.
-
In fixed income markets, previously range-bound global bond yields spiked following the onset of the Middle East conflict, as energy-driven inflation fears appeared to have rattled bond investors. US rate volatility (as measured by the Merrill Lynch Option Volatility Estimate (MOVE) Index) similarly rose from intra-period lows, reflecting uncertainty around the scope and duration of the conflict and its implications for global growth. However, volatility later retracted as the risk of a broader regional military escalation appeared less likely. Global credit spreads widened only modestly before stabilizing near prior levels, supported by strong demand and resilient underlying fundamentals.
-
Top contributors to performance relative to the Blended Index:
-
Within the fixed income segment, exposure to the MFS Emerging Markets Debt Fund, MFS Emerging Markets Debt Local Currency Fund, and MFS High Income Fund supported relative performance.
-
Within the international equity segment, style selection contributed positively as exposure to emerging markets, value, growth, and small/mid-cap international strategies benefited relative results.
-
-
Top detractors from performance relative to the Blended Index:
-
Within the U.S. equity segment, lagging relative performance across the majority of the strategies weighed on relative results as the funds generally underperformed their respective benchmarks. Style selection also held back relative performance as mid-cap strategies underperformed the broader index.
-
Within the international equity segment, relative performance of the MFS International Growth Fund, MFS Research International Fund, and MFS International New Discovery Fund held back results as the funds lagged their respective benchmarks.
-
FUND PERFORMANCE
The fund’s past performance is not a good predictor of the fund’s future performance. The graph and table below do not reflect the deduction of taxes that a shareholder would pay on fund distributions or the redemption of fund shares. The graph and table below assume reinvestment of dividends and capital gain distributions.
Growth of a Hypothetical $10,000 Investment
This graph shows the performance of a hypothetical $10,000 investment in Class I over a ten year period or since inception, if shorter, in comparison to (i) a broad measure of market performance and (ii) an additional index that MFS believes more closely reflects the market segments in which the fund invests.
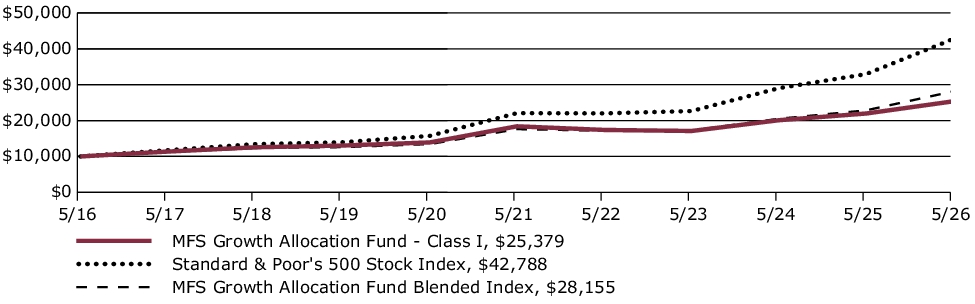
Average Annual Total Returns through 5/31/26
This table shows the average annual total returns of the class of shares noted for the periods shown, both with (if any) and without sales charges. It also shows the average annual total returns of (i) a broad measure of market performance and (ii) an additional index that MFS believes more closely reflects the market segments in which the fund invests, over the same periods.
| Share Class | 1-yr | 5-yr | 10-yr |
| I without sales charge | 15.49% | 6.64% | 9.76% |
| Comparative Benchmark(s) | |||
| Standard & Poor's 500 Stock Index ∆ | 29.78% | 14.15% | 15.65% |
| MFS Growth Allocation Fund Blended Index ∆ | 23.16% | 9.83% | 10.91% |
|
∆
|
Source: FactSet Research Systems Inc.
|
Visit mfs.com/perf/i for more recent performance information.
FUND STATISTICS AS OF 5/31/26
| Net Assets ($): | 6,759,524,810 | Total Management Fee ($)#: | 0 | |
| Total Number of Holdings: | 22 | Portfolio Turnover Rate (%): | 3 |
# The fund itself does not pay a management fee but the underlying funds in which the fund invests do pay management fees to MFS.
PORTFOLIO COMPOSITION (BASED ON TOTAL INVESTMENTS AS OF 5/31/26)
Portfolio allocation
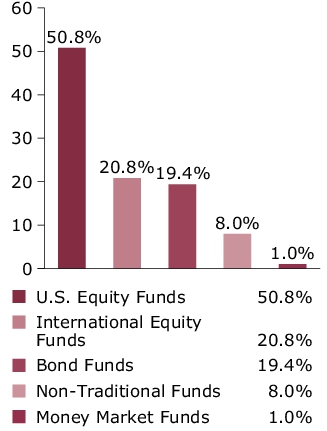
Portfolio holdings
| MFS Value Fund | 9.9% |
| MFS Research Fund | 9.4% |
| MFS Growth Fund | 9.4% |
| MFS Mid Cap Value Fund | 9.1% |
| MFS Mid Cap Growth Fund | 8.9% |
| MFS Research International Fund | 7.3% |
| MFS Inflation-Adjusted Bond Fund | 4.9% |
| MFS Global Real Estate Fund | 4.0% |
| MFS Commodity Strategy Fund | 4.0% |
| MFS High Income Fund | 4.0% |
| MFS International Large Cap Value Fund | 3.1% |
| MFS International Intrinsic Equity Fund | 3.1% |
| MFS International Growth Fund | 3.1% |
| MFS Emerging Markets Debt Fund | 3.0% |
| MFS Global Opportunistic Bond Fund | 3.0% |
| MFS Total Return Bond Fund | 2.5% |
| MFS Emerging Markets Equity Fund | 2.1% |
| MFS International New Discovery Fund | 2.1% |
| MFS New Discovery Fund | 2.1% |
| MFS New Discovery Value Fund | 2.0% |
| MFS Emerging Markets Debt Local Currency Fund | 2.0% |
| MFS Institutional Money Market Portfolio | 1.0% |
FUND EXPENSES
What were the fund costs for the last year?
| (based on a hypothetical $10,000 investment) | ||
| Class Name | Costs of a $10,000 investment ~ | Costs paid as a percentage of a $10,000 investment ~ |
| C | $117 | 1.09% |
˜ Expenses are direct expenses and do not include underlying fund fees and expenses.
MANAGEMENT'S DISCUSSION OF FUND PERFORMANCE
-
For the twelve months ended May 31, 2026, Class C shares of the MFS Growth Allocation Fund (fund) provided a total return of 14.36%, at net asset value. This compares with a return of 29.78% for the fund’s benchmark, the Standard & Poor's 500 Stock Index. The fund's other benchmark, the MFS Growth Allocation Fund Blended Index (Blended Index), generated a return of 23.16%. The Blended Index reflects the blended returns of broad asset class indices, with percentage allocations to each index designed to resemble the long term strategic allocations of the fund. The market indices and related percentage allocations used to compile the Blended Index are set forth in the Fund Performance.
-
Global equity markets reached record levels during the period, withstanding considerable volatility amid tariffs, geopolitical conflict and high levels of uncertainty. A new geopolitical event distressed markets at the end of the period as US and Israeli forces launched strikes against Iran, disrupting Mideast oil and natural gas exports. During the period, a pro-growth tax and spending bill was signed into law in the US, while in Europe, renewed focus on defense and infrastructure spending brightened the economic outlook. In Japan, the election of a pro-growth prime minister sent stocks to new highs prior to the conflict in Iran. Optimism over artificial intelligence remained high.
-
Considerable progress was made in trade talks between the US and many major trading partners, with a fragile truce between the US and China extended through late 2026. While the US Supreme Court struck down part of the Trump administration’s tariff strategy, the administration began deploying other authorities to largely replace the ones that were ruled unconstitutional.
-
Early in the period, moderating inflation pressures allowed many global central banks to ease monetary policy. Amid a difficult policymaking environment and slower job growth, the Federal Reserve resumed easing policy in September and delivered quarter-point rate cuts in October and December before pausing.
-
In fixed income markets, previously range-bound global bond yields spiked following the onset of the Middle East conflict, as energy-driven inflation fears appeared to have rattled bond investors. US rate volatility (as measured by the Merrill Lynch Option Volatility Estimate (MOVE) Index) similarly rose from intra-period lows, reflecting uncertainty around the scope and duration of the conflict and its implications for global growth. However, volatility later retracted as the risk of a broader regional military escalation appeared less likely. Global credit spreads widened only modestly before stabilizing near prior levels, supported by strong demand and resilient underlying fundamentals.
-
Top contributors to performance relative to the Blended Index:
-
Within the fixed income segment, exposure to the MFS Emerging Markets Debt Fund, MFS Emerging Markets Debt Local Currency Fund, and MFS High Income Fund supported relative performance.
-
Within the international equity segment, style selection contributed positively as exposure to emerging markets, value, growth, and small/mid-cap international strategies benefited relative results.
-
-
Top detractors from performance relative to the Blended Index:
-
Within the U.S. equity segment, lagging relative performance across the majority of the strategies weighed on relative results as the funds generally underperformed their respective benchmarks. Style selection also held back relative performance as mid-cap strategies underperformed the broader index.
-
Within the international equity segment, relative performance of the MFS International Growth Fund, MFS Research International Fund, and MFS International New Discovery Fund held back results as the funds lagged their respective benchmarks.
-
FUND PERFORMANCE
The fund’s past performance is not a good predictor of the fund’s future performance. The graph and table below do not reflect the deduction of taxes that a shareholder would pay on fund distributions or the redemption of fund shares. The graph and table below assume reinvestment of dividends and capital gain distributions.
Growth of a Hypothetical $10,000 Investment
This graph shows the performance of a hypothetical $10,000 investment in Class C over a ten year period or since inception, if shorter, in comparison to (i) a broad measure of market performance and (ii) an additional index that MFS believes more closely reflects the market segments in which the fund invests.
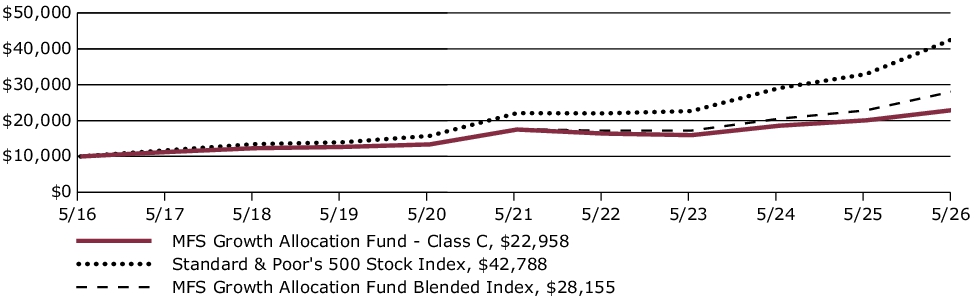
Average Annual Total Returns through 5/31/26
This table shows the average annual total returns of the class of shares noted for the periods shown, both with (if any) and without sales charges. It also shows the average annual total returns of (i) a broad measure of market performance and (ii) an additional index that MFS believes more closely reflects the market segments in which the fund invests, over the same periods.
| Share Class | 1-yr | 5-yr | 10-yr |
| C without sales charge | 14.36% | 5.58% | 8.67% |
| C with CDSC (1% for 12 months)× | 13.36% | 5.58% | 8.67% |
| Comparative Benchmark(s) | |||
| Standard & Poor's 500 Stock Index ∆ | 29.78% | 14.15% | 15.65% |
| MFS Growth Allocation Fund Blended Index ∆ | 23.16% | 9.83% | 10.91% |
|
∆
|
Source: FactSet Research Systems Inc.
|
|
×
|
Assuming redemption at the end of the applicable period.
|
Visit mfs.com/perf/c for more recent performance information.
FUND STATISTICS AS OF 5/31/26
| Net Assets ($): | 6,759,524,810 | Total Management Fee ($)#: | 0 | |
| Total Number of Holdings: | 22 | Portfolio Turnover Rate (%): | 3 |
# The fund itself does not pay a management fee but the underlying funds in which the fund invests do pay management fees to MFS.
PORTFOLIO COMPOSITION (BASED ON TOTAL INVESTMENTS AS OF 5/31/26)
Portfolio allocation
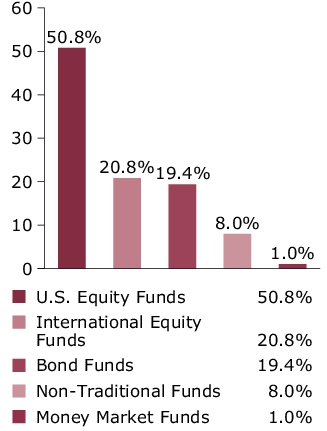
Portfolio holdings
| MFS Value Fund | 9.9% |
| MFS Research Fund | 9.4% |
| MFS Growth Fund | 9.4% |
| MFS Mid Cap Value Fund | 9.1% |
| MFS Mid Cap Growth Fund | 8.9% |
| MFS Research International Fund | 7.3% |
| MFS Inflation-Adjusted Bond Fund | 4.9% |
| MFS Global Real Estate Fund | 4.0% |
| MFS Commodity Strategy Fund | 4.0% |
| MFS High Income Fund | 4.0% |
| MFS International Large Cap Value Fund | 3.1% |
| MFS International Intrinsic Equity Fund | 3.1% |
| MFS International Growth Fund | 3.1% |
| MFS Emerging Markets Debt Fund | 3.0% |
| MFS Global Opportunistic Bond Fund | 3.0% |
| MFS Total Return Bond Fund | 2.5% |
| MFS Emerging Markets Equity Fund | 2.1% |
| MFS International New Discovery Fund | 2.1% |
| MFS New Discovery Fund | 2.1% |
| MFS New Discovery Value Fund | 2.0% |
| MFS Emerging Markets Debt Local Currency Fund | 2.0% |
| MFS Institutional Money Market Portfolio | 1.0% |
FUND EXPENSES
What were the fund costs for the last year?
| (based on a hypothetical $10,000 investment) | ||
| Class Name | Costs of a $10,000 investment ~ | Costs paid as a percentage of a $10,000 investment ~ |
| B | $117 | 1.09% |
˜ Expenses are direct expenses and do not include underlying fund fees and expenses.
MANAGEMENT'S DISCUSSION OF FUND PERFORMANCE
-
For the twelve months ended May 31, 2026, Class B shares of the MFS Growth Allocation Fund (fund) provided a total return of 14.34%, at net asset value. This compares with a return of 29.78% for the fund’s benchmark, the Standard & Poor's 500 Stock Index. The fund's other benchmark, the MFS Growth Allocation Fund Blended Index (Blended Index), generated a return of 23.16%. The Blended Index reflects the blended returns of broad asset class indices, with percentage allocations to each index designed to resemble the long term strategic allocations of the fund. The market indices and related percentage allocations used to compile the Blended Index are set forth in the Fund Performance.
-
Global equity markets reached record levels during the period, withstanding considerable volatility amid tariffs, geopolitical conflict and high levels of uncertainty. A new geopolitical event distressed markets at the end of the period as US and Israeli forces launched strikes against Iran, disrupting Mideast oil and natural gas exports. During the period, a pro-growth tax and spending bill was signed into law in the US, while in Europe, renewed focus on defense and infrastructure spending brightened the economic outlook. In Japan, the election of a pro-growth prime minister sent stocks to new highs prior to the conflict in Iran. Optimism over artificial intelligence remained high.
-
Considerable progress was made in trade talks between the US and many major trading partners, with a fragile truce between the US and China extended through late 2026. While the US Supreme Court struck down part of the Trump administration’s tariff strategy, the administration began deploying other authorities to largely replace the ones that were ruled unconstitutional.
-
Early in the period, moderating inflation pressures allowed many global central banks to ease monetary policy. Amid a difficult policymaking environment and slower job growth, the Federal Reserve resumed easing policy in September and delivered quarter-point rate cuts in October and December before pausing.
-
In fixed income markets, previously range-bound global bond yields spiked following the onset of the Middle East conflict, as energy-driven inflation fears appeared to have rattled bond investors. US rate volatility (as measured by the Merrill Lynch Option Volatility Estimate (MOVE) Index) similarly rose from intra-period lows, reflecting uncertainty around the scope and duration of the conflict and its implications for global growth. However, volatility later retracted as the risk of a broader regional military escalation appeared less likely. Global credit spreads widened only modestly before stabilizing near prior levels, supported by strong demand and resilient underlying fundamentals.
-
Top contributors to performance relative to the Blended Index:
-
Within the fixed income segment, exposure to the MFS Emerging Markets Debt Fund, MFS Emerging Markets Debt Local Currency Fund, and MFS High Income Fund supported relative performance.
-
Within the international equity segment, style selection contributed positively as exposure to emerging markets, value, growth, and small/mid-cap international strategies benefited relative results.
-
-
Top detractors from performance relative to the Blended Index:
-
Within the U.S. equity segment, lagging relative performance across the majority of the strategies weighed on relative results as the funds generally underperformed their respective benchmarks. Style selection also held back relative performance as mid-cap strategies underperformed the broader index.
-
Within the international equity segment, relative performance of the MFS International Growth Fund, MFS Research International Fund, and MFS International New Discovery Fund held back results as the funds lagged their respective benchmarks.
-
FUND PERFORMANCE
The fund’s past performance is not a good predictor of the fund’s future performance. The graph and table below do not reflect the deduction of taxes that a shareholder would pay on fund distributions or the redemption of fund shares. The graph and table below assume reinvestment of dividends and capital gain distributions.
Growth of a Hypothetical $10,000 Investment
This graph shows the performance of a hypothetical $10,000 investment in Class B over a ten year period or since inception, if shorter, in comparison to (i) a broad measure of market performance and (ii) an additional index that MFS believes more closely reflects the market segments in which the fund invests.
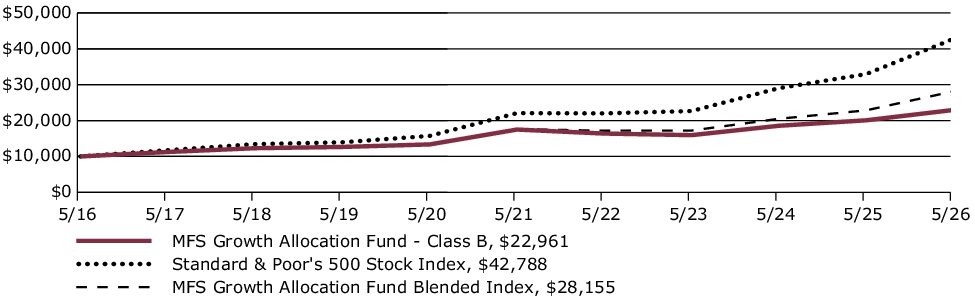
Average Annual Total Returns through 5/31/26
This table shows the average annual total returns of the class of shares noted for the periods shown, both with (if any) and without sales charges. It also shows the average annual total returns of (i) a broad measure of market performance and (ii) an additional index that MFS believes more closely reflects the market segments in which the fund invests, over the same periods.
| Share Class | 1-yr | 5-yr | 10-yr |
| B without sales charge | 14.34% | 5.58% | 8.67% |
| B with CDSC (declining over six years from 4% to 0%)× | 10.34% | 5.26% | 8.67% |
| Comparative Benchmark(s) | |||
| Standard & Poor's 500 Stock Index ∆ | 29.78% | 14.15% | 15.65% |
| MFS Growth Allocation Fund Blended Index ∆ | 23.16% | 9.83% | 10.91% |
|
∆
|
Source: FactSet Research Systems Inc.
|
|
×
|
Assuming redemption at the end of the applicable period.
|
Visit mfs.com/perf/b for more recent performance information.
FUND STATISTICS AS OF 5/31/26
| Net Assets ($): | 6,759,524,810 | Total Management Fee ($)#: | 0 | |
| Total Number of Holdings: | 22 | Portfolio Turnover Rate (%): | 3 |
# The fund itself does not pay a management fee but the underlying funds in which the fund invests do pay management fees to MFS.
PORTFOLIO COMPOSITION (BASED ON TOTAL INVESTMENTS AS OF 5/31/26)
Portfolio allocation
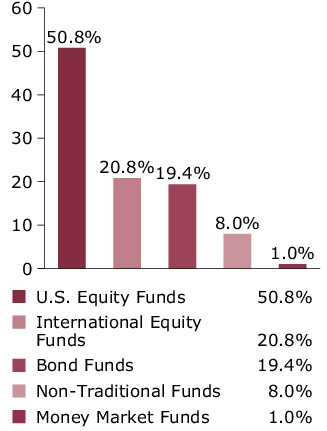
Portfolio holdings
| MFS Value Fund | 9.9% |
| MFS Research Fund | 9.4% |
| MFS Growth Fund | 9.4% |
| MFS Mid Cap Value Fund | 9.1% |
| MFS Mid Cap Growth Fund | 8.9% |
| MFS Research International Fund | 7.3% |
| MFS Inflation-Adjusted Bond Fund | 4.9% |
| MFS Global Real Estate Fund | 4.0% |
| MFS Commodity Strategy Fund | 4.0% |
| MFS High Income Fund | 4.0% |
| MFS International Large Cap Value Fund | 3.1% |
| MFS International Intrinsic Equity Fund | 3.1% |
| MFS International Growth Fund | 3.1% |
| MFS Emerging Markets Debt Fund | 3.0% |
| MFS Global Opportunistic Bond Fund | 3.0% |
| MFS Total Return Bond Fund | 2.5% |
| MFS Emerging Markets Equity Fund | 2.1% |
| MFS International New Discovery Fund | 2.1% |
| MFS New Discovery Fund | 2.1% |
| MFS New Discovery Value Fund | 2.0% |
| MFS Emerging Markets Debt Local Currency Fund | 2.0% |
| MFS Institutional Money Market Portfolio | 1.0% |
FUND EXPENSES
What were the fund costs for the last year?
| (based on a hypothetical $10,000 investment) | ||
| Class Name | Costs of a $10,000 investment ~ | Costs paid as a percentage of a $10,000 investment ~ |
| A | $37 | 0.34% |
˜ Expenses are direct expenses and do not include underlying fund fees and expenses.
MANAGEMENT'S DISCUSSION OF FUND PERFORMANCE
-
For the twelve months ended May 31, 2026, Class A shares of the MFS Growth Allocation Fund (fund) provided a total return of 15.22%, at net asset value. This compares with a return of 29.78% for the fund’s benchmark, the Standard & Poor's 500 Stock Index. The fund's other benchmark, the MFS Growth Allocation Fund Blended Index (Blended Index), generated a return of 23.16%. The Blended Index reflects the blended returns of broad asset class indices, with percentage allocations to each index designed to resemble the long term strategic allocations of the fund. The market indices and related percentage allocations used to compile the Blended Index are set forth in the Fund Performance.
-
Global equity markets reached record levels during the period, withstanding considerable volatility amid tariffs, geopolitical conflict and high levels of uncertainty. A new geopolitical event distressed markets at the end of the period as US and Israeli forces launched strikes against Iran, disrupting Mideast oil and natural gas exports. During the period, a pro-growth tax and spending bill was signed into law in the US, while in Europe, renewed focus on defense and infrastructure spending brightened the economic outlook. In Japan, the election of a pro-growth prime minister sent stocks to new highs prior to the conflict in Iran. Optimism over artificial intelligence remained high.
-
Considerable progress was made in trade talks between the US and many major trading partners, with a fragile truce between the US and China extended through late 2026. While the US Supreme Court struck down part of the Trump administration’s tariff strategy, the administration began deploying other authorities to largely replace the ones that were ruled unconstitutional.
-
Early in the period, moderating inflation pressures allowed many global central banks to ease monetary policy. Amid a difficult policymaking environment and slower job growth, the Federal Reserve resumed easing policy in September and delivered quarter-point rate cuts in October and December before pausing.
-
In fixed income markets, previously range-bound global bond yields spiked following the onset of the Middle East conflict, as energy-driven inflation fears appeared to have rattled bond investors. US rate volatility (as measured by the Merrill Lynch Option Volatility Estimate (MOVE) Index) similarly rose from intra-period lows, reflecting uncertainty around the scope and duration of the conflict and its implications for global growth. However, volatility later retracted as the risk of a broader regional military escalation appeared less likely. Global credit spreads widened only modestly before stabilizing near prior levels, supported by strong demand and resilient underlying fundamentals.
-
Top contributors to performance relative to the Blended Index:
-
Within the fixed income segment, exposure to the MFS Emerging Markets Debt Fund, MFS Emerging Markets Debt Local Currency Fund, and MFS High Income Fund supported relative performance.
-
Within the international equity segment, style selection contributed positively as exposure to emerging markets, value, growth, and small/mid-cap international strategies benefited relative results.
-
-
Top detractors from performance relative to the Blended Index:
-
Within the U.S. equity segment, lagging relative performance across the majority of the strategies weighed on relative results as the funds generally underperformed their respective benchmarks. Style selection also held back relative performance as mid-cap strategies underperformed the broader index.
-
Within the international equity segment, relative performance of the MFS International Growth Fund, MFS Research International Fund, and MFS International New Discovery Fund held back results as the funds lagged their respective benchmarks.
-
FUND PERFORMANCE
The fund’s past performance is not a good predictor of the fund’s future performance. The graph and table below do not reflect the deduction of taxes that a shareholder would pay on fund distributions or the redemption of fund shares. The graph and table below assume reinvestment of dividends and capital gain distributions.
Growth of a Hypothetical $10,000 Investment
This graph shows the performance of a hypothetical $10,000 investment in Class A over a ten year period or since inception, if shorter, in comparison to (i) a broad measure of market performance and (ii) an additional index that MFS believes more closely reflects the market segments in which the fund invests. This graph includes the deduction of the maximum applicable sales charge.
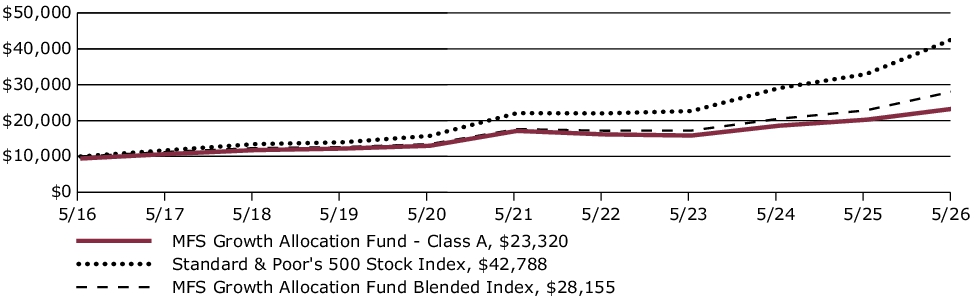
Average Annual Total Returns through 5/31/26
This table shows the average annual total returns of the class of shares noted for the periods shown, both with (if any) and without sales charges. It also shows the average annual total returns of (i) a broad measure of market performance and (ii) an additional index that MFS believes more closely reflects the market segments in which the fund invests, over the same periods.
| Share Class | 1-yr | 5-yr | 10-yr |
| A without sales charge | 15.22% | 6.37% | 9.48% |
| A with initial sales charge (5.75%) | 8.60% | 5.12% | 8.84% |
| Comparative Benchmark(s) | |||
| Standard & Poor's 500 Stock Index ∆ | 29.78% | 14.15% | 15.65% |
| MFS Growth Allocation Fund Blended Index ∆ | 23.16% | 9.83% | 10.91% |
|
∆
|
Source: FactSet Research Systems Inc.
|
Visit mfs.com/perf/a for more recent performance information.
FUND STATISTICS AS OF 5/31/26
| Net Assets ($): | 6,759,524,810 | Total Management Fee ($)#: | 0 | |
| Total Number of Holdings: | 22 | Portfolio Turnover Rate (%): | 3 |
# The fund itself does not pay a management fee but the underlying funds in which the fund invests do pay management fees to MFS.
PORTFOLIO COMPOSITION (BASED ON TOTAL INVESTMENTS AS OF 5/31/26)
Portfolio allocation
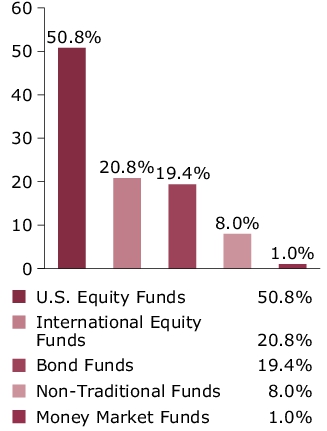
Portfolio holdings
| MFS Value Fund | 9.9% |
| MFS Research Fund | 9.4% |
| MFS Growth Fund | 9.4% |
| MFS Mid Cap Value Fund | 9.1% |
| MFS Mid Cap Growth Fund | 8.9% |
| MFS Research International Fund | 7.3% |
| MFS Inflation-Adjusted Bond Fund | 4.9% |
| MFS Global Real Estate Fund | 4.0% |
| MFS Commodity Strategy Fund | 4.0% |
| MFS High Income Fund | 4.0% |
| MFS International Large Cap Value Fund | 3.1% |
| MFS International Intrinsic Equity Fund | 3.1% |
| MFS International Growth Fund | 3.1% |
| MFS Emerging Markets Debt Fund | 3.0% |
| MFS Global Opportunistic Bond Fund | 3.0% |
| MFS Total Return Bond Fund | 2.5% |
| MFS Emerging Markets Equity Fund | 2.1% |
| MFS International New Discovery Fund | 2.1% |
| MFS New Discovery Fund | 2.1% |
| MFS New Discovery Value Fund | 2.0% |
| MFS Emerging Markets Debt Local Currency Fund | 2.0% |
| MFS Institutional Money Market Portfolio | 1.0% |
FUND EXPENSES
What were the fund costs for the last year?
| (based on a hypothetical $10,000 investment) | ||
| Class Name | Costs of a $10,000 investment ~ | Costs paid as a percentage of a $10,000 investment ~ |
| A | $39 | 0.35% |
˜ Expenses are direct expenses and do not include underlying fund fees and expenses.
MANAGEMENT'S DISCUSSION OF FUND PERFORMANCE
-
For the twelve months ended May 31, 2026, Class A shares of the MFS International Diversification Fund (fund) provided a total return of 22.45%, at net asset value. This compares with a return of 32.77% for the fund’s benchmark, the MSCI All Country World (ex-US) Index (net div).
-
Global equity markets reached record levels during the period, withstanding considerable volatility amid tariffs, geopolitical conflict and high levels of uncertainty. A new geopolitical event distressed markets at the end of the period as US and Israeli forces launched strikes against Iran, disrupting Mideast oil and natural gas exports. During the period, a pro-growth tax and spending bill was signed into law in the US, while in Europe, renewed focus on defense and infrastructure spending brightened the economic outlook. In Japan, the election of a pro-growth prime minister sent stocks to new highs prior to the conflict in Iran. Optimism over artificial intelligence remained high.
-
Considerable progress was made in trade talks between the US and many major trading partners, with a fragile truce between the US and China extended through late 2026. While the US Supreme Court struck down part of the Trump administration’s tariff strategy, the administration began deploying other authorities to largely replace the ones that were ruled unconstitutional.
-
Early in the period, moderating inflation pressures allowed many global central banks to ease monetary policy. Amid a difficult policymaking environment and slower job growth, the Federal Reserve resumed easing policy in September and delivered quarter-point rate cuts in October and December before pausing.
-
In fixed income markets, previously range-bound global bond yields spiked following the onset of the Middle East conflict, as energy-driven inflation fears appeared to have rattled bond investors. US rate volatility (as measured by the Merrill Lynch Option Volatility Estimate (MOVE) Index) similarly rose from intra-period lows, reflecting uncertainty around the scope and duration of the conflict and its implications for global growth. However, volatility later retracted as the risk of a broader regional military escalation appeared less likely. Global credit spreads widened only modestly before stabilizing near prior levels, supported by strong demand and resilient underlying fundamentals.
-
Top contributors to performance relative to the MSCI All Country World (ex-US) Index:
-
During the reporting period, the fund’s exposure to the MFS Emerging Markets Equity Fund aided relative performance as emerging markets performed well versus international stocks.
-
-
Top detractors from performance relative to the MSCI All Country World (ex-US) Index:
-
The fund’s exposure to the MFS Research International Fund weakened relative returns as the fund underperformed its respective benchmark.
-
The fund’s exposure to both the MFS International Growth Fund and MFS International New Discovery Fund further weighed on relative performance.
-
FUND PERFORMANCE
The fund’s past performance is not a good predictor of the fund’s future performance. The graph and table below do not reflect the deduction of taxes that a shareholder would pay on fund distributions or the redemption of fund shares. The graph and table below assume reinvestment of dividends and capital gain distributions.
Growth of a Hypothetical $10,000 Investment
This graph shows the performance of a hypothetical $10,000 investment in Class A over a ten year period or since inception, if shorter, in comparison to a broad measure of market performance. This graph includes the deduction of the maximum applicable sales charge.
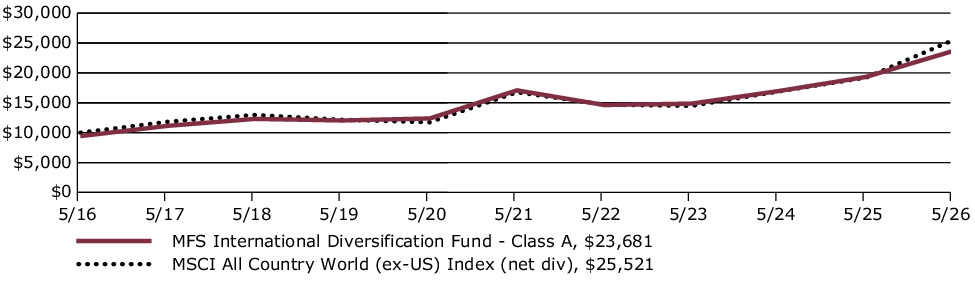
Average Annual Total Returns through 5/31/26
This table shows the average annual total returns of the class of shares noted for the periods shown, both with (if any) and without sales charges. It also shows the average annual total returns of a broad measure of market performance over the same periods.
| Share Class | 1-yr | 5-yr | 10-yr |
| A without sales charge | 22.45% | 6.76% | 9.65% |
| A with initial sales charge (5.75%) | 15.41% | 5.50% | 9.00% |
| Comparative Benchmark(s) | |||
| MSCI All Country World (ex-US) Index (net div) ∆ | 32.77% | 8.77% | 9.82% |
|
∆
|
Source: FactSet Research Systems Inc.
|
Visit mfs.com/perf/a for more recent performance information.
FUND STATISTICS AS OF 5/31/26
| Net Assets ($): | 44,550,318,981 | Total Management Fee ($)#: | 0 | |
| Total Number of Holdings: | 7 | Portfolio Turnover Rate (%): | 1 |
# The fund itself does not pay a management fee but the underlying funds in which the fund invests do pay management fees to MFS.
PORTFOLIO COMPOSITION (BASED ON TOTAL INVESTMENTS AS OF 5/31/26)
Portfolio target allocation
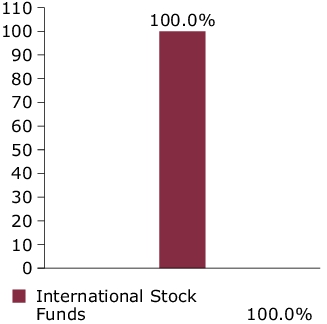
Portfolio actual allocation
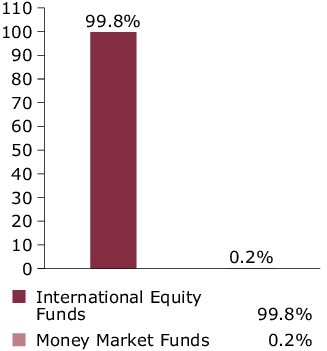
Portfolio holdings
| MFS Research International Fund | 27.4% |
| MFS Emerging Markets Equity Fund | 17.5% |
| MFS International Growth Fund | 15.0% |
| MFS International Intrinsic Equity Fund | 15.0% |
| MFS International Large Cap Value Fund | 14.9% |
| MFS International New Discovery Fund | 10.0% |
| MFS Institutional Money Market Portfolio | 0.2% |
FUND EXPENSES
What were the fund costs for the last year?
| (based on a hypothetical $10,000 investment) | ||
| Class Name | Costs of a $10,000 investment ~ | Costs paid as a percentage of a $10,000 investment ~ |
| B | $122 | 1.10% |
˜ Expenses are direct expenses and do not include underlying fund fees and expenses.
MANAGEMENT'S DISCUSSION OF FUND PERFORMANCE
-
For the twelve months ended May 31, 2026, Class B shares of the MFS International Diversification Fund (fund) provided a total return of 21.53%, at net asset value. This compares with a return of 32.77% for the fund’s benchmark, the MSCI All Country World (ex-US) Index (net div).
-
Global equity markets reached record levels during the period, withstanding considerable volatility amid tariffs, geopolitical conflict and high levels of uncertainty. A new geopolitical event distressed markets at the end of the period as US and Israeli forces launched strikes against Iran, disrupting Mideast oil and natural gas exports. During the period, a pro-growth tax and spending bill was signed into law in the US, while in Europe, renewed focus on defense and infrastructure spending brightened the economic outlook. In Japan, the election of a pro-growth prime minister sent stocks to new highs prior to the conflict in Iran. Optimism over artificial intelligence remained high.
-
Considerable progress was made in trade talks between the US and many major trading partners, with a fragile truce between the US and China extended through late 2026. While the US Supreme Court struck down part of the Trump administration’s tariff strategy, the administration began deploying other authorities to largely replace the ones that were ruled unconstitutional.
-
Early in the period, moderating inflation pressures allowed many global central banks to ease monetary policy. Amid a difficult policymaking environment and slower job growth, the Federal Reserve resumed easing policy in September and delivered quarter-point rate cuts in October and December before pausing.
-
In fixed income markets, previously range-bound global bond yields spiked following the onset of the Middle East conflict, as energy-driven inflation fears appeared to have rattled bond investors. US rate volatility (as measured by the Merrill Lynch Option Volatility Estimate (MOVE) Index) similarly rose from intra-period lows, reflecting uncertainty around the scope and duration of the conflict and its implications for global growth. However, volatility later retracted as the risk of a broader regional military escalation appeared less likely. Global credit spreads widened only modestly before stabilizing near prior levels, supported by strong demand and resilient underlying fundamentals.
-
Top contributors to performance relative to the MSCI All Country World (ex-US) Index:
-
During the reporting period, the fund’s exposure to the MFS Emerging Markets Equity Fund aided relative performance as emerging markets performed well versus international stocks.
-
-
Top detractors from performance relative to the MSCI All Country World (ex-US) Index:
-
The fund’s exposure to the MFS Research International Fund weakened relative returns as the fund underperformed its respective benchmark.
-
The fund’s exposure to both the MFS International Growth Fund and MFS International New Discovery Fund further weighed on relative performance.
-
FUND PERFORMANCE
The fund’s past performance is not a good predictor of the fund’s future performance. The graph and table below do not reflect the deduction of taxes that a shareholder would pay on fund distributions or the redemption of fund shares. The graph and table below assume reinvestment of dividends and capital gain distributions.
Growth of a Hypothetical $10,000 Investment
This graph shows the performance of a hypothetical $10,000 investment in Class B over a ten year period or since inception, if shorter, in comparison to a broad measure of market performance.
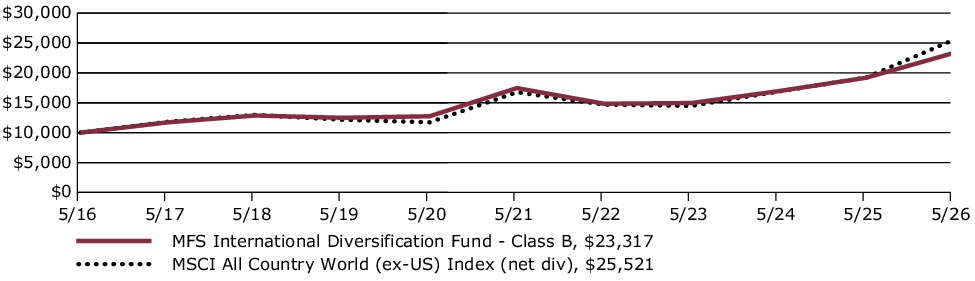
Average Annual Total Returns through 5/31/26
This table shows the average annual total returns of the class of shares noted for the periods shown, both with (if any) and without sales charges. It also shows the average annual total returns of a broad measure of market performance over the same periods.
| Share Class | 1-yr | 5-yr | 10-yr |
| B without sales charge | 21.53% | 5.96% | 8.83% |
| B with CDSC (declining over six years from 4% to 0%)× | 17.53% | 5.64% | 8.83% |
| Comparative Benchmark(s) | |||
| MSCI All Country World (ex-US) Index (net div) ∆ | 32.77% | 8.77% | 9.82% |
|
∆
|
Source: FactSet Research Systems Inc.
|
|
×
|
Assuming redemption at the end of the applicable period.
|
Visit mfs.com/perf/b for more recent performance information.
FUND STATISTICS AS OF 5/31/26
| Net Assets ($): | 44,550,318,981 | Total Management Fee ($)#: | 0 | |
| Total Number of Holdings: | 7 | Portfolio Turnover Rate (%): | 1 |
# The fund itself does not pay a management fee but the underlying funds in which the fund invests do pay management fees to MFS.
PORTFOLIO COMPOSITION (BASED ON TOTAL INVESTMENTS AS OF 5/31/26)
Portfolio target allocation
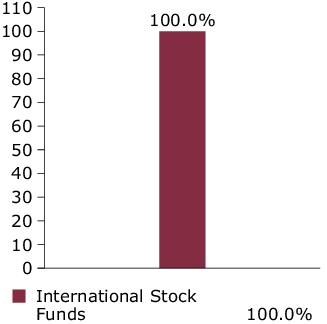
Portfolio actual allocation
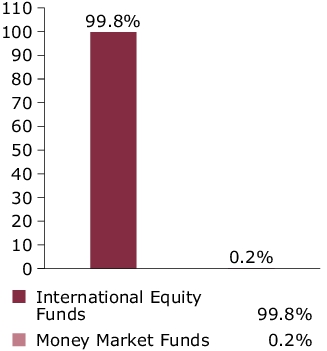
Portfolio holdings
| MFS Research International Fund | 27.4% |
| MFS Emerging Markets Equity Fund | 17.5% |
| MFS International Growth Fund | 15.0% |
| MFS International Intrinsic Equity Fund | 15.0% |
| MFS International Large Cap Value Fund | 14.9% |
| MFS International New Discovery Fund | 10.0% |
| MFS Institutional Money Market Portfolio | 0.2% |
FUND EXPENSES
What were the fund costs for the last year?
| (based on a hypothetical $10,000 investment) | ||
| Class Name | Costs of a $10,000 investment ~ | Costs paid as a percentage of a $10,000 investment ~ |
| C | $122 | 1.10% |
˜ Expenses are direct expenses and do not include underlying fund fees and expenses.
MANAGEMENT'S DISCUSSION OF FUND PERFORMANCE
-
For the twelve months ended May 31, 2026, Class C shares of the MFS International Diversification Fund (fund) provided a total return of 21.54%, at net asset value. This compares with a return of 32.77% for the fund’s benchmark, the MSCI All Country World (ex-US) Index (net div).
-
Global equity markets reached record levels during the period, withstanding considerable volatility amid tariffs, geopolitical conflict and high levels of uncertainty. A new geopolitical event distressed markets at the end of the period as US and Israeli forces launched strikes against Iran, disrupting Mideast oil and natural gas exports. During the period, a pro-growth tax and spending bill was signed into law in the US, while in Europe, renewed focus on defense and infrastructure spending brightened the economic outlook. In Japan, the election of a pro-growth prime minister sent stocks to new highs prior to the conflict in Iran. Optimism over artificial intelligence remained high.
-
Considerable progress was made in trade talks between the US and many major trading partners, with a fragile truce between the US and China extended through late 2026. While the US Supreme Court struck down part of the Trump administration’s tariff strategy, the administration began deploying other authorities to largely replace the ones that were ruled unconstitutional.
-
Early in the period, moderating inflation pressures allowed many global central banks to ease monetary policy. Amid a difficult policymaking environment and slower job growth, the Federal Reserve resumed easing policy in September and delivered quarter-point rate cuts in October and December before pausing.
-
In fixed income markets, previously range-bound global bond yields spiked following the onset of the Middle East conflict, as energy-driven inflation fears appeared to have rattled bond investors. US rate volatility (as measured by the Merrill Lynch Option Volatility Estimate (MOVE) Index) similarly rose from intra-period lows, reflecting uncertainty around the scope and duration of the conflict and its implications for global growth. However, volatility later retracted as the risk of a broader regional military escalation appeared less likely. Global credit spreads widened only modestly before stabilizing near prior levels, supported by strong demand and resilient underlying fundamentals.
-
Top contributors to performance relative to the MSCI All Country World (ex-US) Index:
-
During the reporting period, the fund’s exposure to the MFS Emerging Markets Equity Fund aided relative performance as emerging markets performed well versus international stocks.
-
-
Top detractors from performance relative to the MSCI All Country World (ex-US) Index:
-
The fund’s exposure to the MFS Research International Fund weakened relative returns as the fund underperformed its respective benchmark.
-
The fund’s exposure to both the MFS International Growth Fund and MFS International New Discovery Fund further weighed on relative performance.
-
FUND PERFORMANCE
The fund’s past performance is not a good predictor of the fund’s future performance. The graph and table below do not reflect the deduction of taxes that a shareholder would pay on fund distributions or the redemption of fund shares. The graph and table below assume reinvestment of dividends and capital gain distributions.
Growth of a Hypothetical $10,000 Investment
This graph shows the performance of a hypothetical $10,000 investment in Class C over a ten year period or since inception, if shorter, in comparison to a broad measure of market performance.
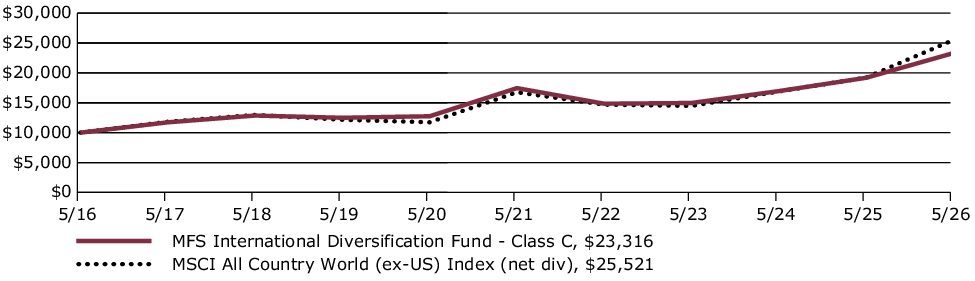
Average Annual Total Returns through 5/31/26
This table shows the average annual total returns of the class of shares noted for the periods shown, both with (if any) and without sales charges. It also shows the average annual total returns of a broad measure of market performance over the same periods.
| Share Class | 1-yr | 5-yr | 10-yr |
| C without sales charge | 21.54% | 5.97% | 8.83% |
| C with CDSC (1% for 12 months)× | 20.54% | 5.97% | 8.83% |
| Comparative Benchmark(s) | |||
| MSCI All Country World (ex-US) Index (net div) ∆ | 32.77% | 8.77% | 9.82% |
|
∆
|
Source: FactSet Research Systems Inc.
|
|
×
|
Assuming redemption at the end of the applicable period.
|
Visit mfs.com/perf/c for more recent performance information.
FUND STATISTICS AS OF 5/31/26
| Net Assets ($): | 44,550,318,981 | Total Management Fee ($)#: | 0 | |
| Total Number of Holdings: | 7 | Portfolio Turnover Rate (%): | 1 |
# The fund itself does not pay a management fee but the underlying funds in which the fund invests do pay management fees to MFS.
PORTFOLIO COMPOSITION (BASED ON TOTAL INVESTMENTS AS OF 5/31/26)
Portfolio target allocation
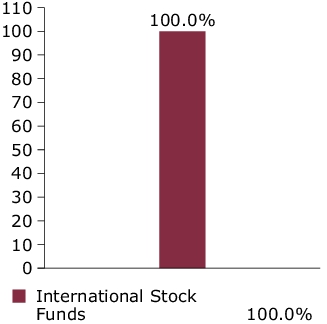
Portfolio actual allocation
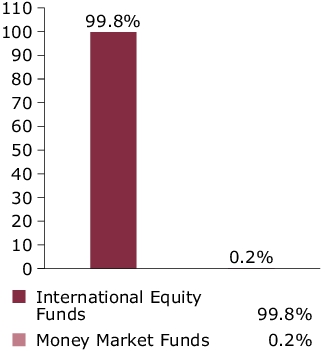
Portfolio holdings
| MFS Research International Fund | 27.4% |
| MFS Emerging Markets Equity Fund | 17.5% |
| MFS International Growth Fund | 15.0% |
| MFS International Intrinsic Equity Fund | 15.0% |
| MFS International Large Cap Value Fund | 14.9% |
| MFS International New Discovery Fund | 10.0% |
| MFS Institutional Money Market Portfolio | 0.2% |
FUND EXPENSES
What were the fund costs for the last year?
| (based on a hypothetical $10,000 investment) | ||
| Class Name | Costs of a $10,000 investment ~ | Costs paid as a percentage of a $10,000 investment ~ |
| I | $11 | 0.10% |
˜ Expenses are direct expenses and do not include underlying fund fees and expenses.
MANAGEMENT'S DISCUSSION OF FUND PERFORMANCE
-
For the twelve months ended May 31, 2026, Class I shares of the MFS International Diversification Fund (fund) provided a total return of 22.76%, at net asset value. This compares with a return of 32.77% for the fund’s benchmark, the MSCI All Country World (ex-US) Index (net div).
-
Global equity markets reached record levels during the period, withstanding considerable volatility amid tariffs, geopolitical conflict and high levels of uncertainty. A new geopolitical event distressed markets at the end of the period as US and Israeli forces launched strikes against Iran, disrupting Mideast oil and natural gas exports. During the period, a pro-growth tax and spending bill was signed into law in the US, while in Europe, renewed focus on defense and infrastructure spending brightened the economic outlook. In Japan, the election of a pro-growth prime minister sent stocks to new highs prior to the conflict in Iran. Optimism over artificial intelligence remained high.
-
Considerable progress was made in trade talks between the US and many major trading partners, with a fragile truce between the US and China extended through late 2026. While the US Supreme Court struck down part of the Trump administration’s tariff strategy, the administration began deploying other authorities to largely replace the ones that were ruled unconstitutional.
-
Early in the period, moderating inflation pressures allowed many global central banks to ease monetary policy. Amid a difficult policymaking environment and slower job growth, the Federal Reserve resumed easing policy in September and delivered quarter-point rate cuts in October and December before pausing.
-
In fixed income markets, previously range-bound global bond yields spiked following the onset of the Middle East conflict, as energy-driven inflation fears appeared to have rattled bond investors. US rate volatility (as measured by the Merrill Lynch Option Volatility Estimate (MOVE) Index) similarly rose from intra-period lows, reflecting uncertainty around the scope and duration of the conflict and its implications for global growth. However, volatility later retracted as the risk of a broader regional military escalation appeared less likely. Global credit spreads widened only modestly before stabilizing near prior levels, supported by strong demand and resilient underlying fundamentals.
-
Top contributors to performance relative to the MSCI All Country World (ex-US) Index:
-
During the reporting period, the fund’s exposure to the MFS Emerging Markets Equity Fund aided relative performance as emerging markets performed well versus international stocks.
-
-
Top detractors from performance relative to the MSCI All Country World (ex-US) Index:
-
The fund’s exposure to the MFS Research International Fund weakened relative returns as the fund underperformed its respective benchmark.
-
The fund’s exposure to both the MFS International Growth Fund and MFS International New Discovery Fund further weighed on relative performance.
-
FUND PERFORMANCE
The fund’s past performance is not a good predictor of the fund’s future performance. The graph and table below do not reflect the deduction of taxes that a shareholder would pay on fund distributions or the redemption of fund shares. The graph and table below assume reinvestment of dividends and capital gain distributions.
Growth of a Hypothetical $10,000 Investment
This graph shows the performance of a hypothetical $10,000 investment in Class I over a ten year period or since inception, if shorter, in comparison to a broad measure of market performance.
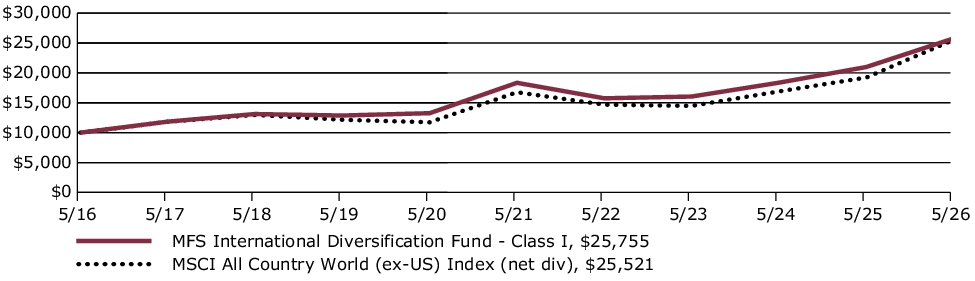
Average Annual Total Returns through 5/31/26
This table shows the average annual total returns of the class of shares noted for the periods shown, both with (if any) and without sales charges. It also shows the average annual total returns of a broad measure of market performance over the same periods.
| Share Class | 1-yr | 5-yr | 10-yr |
| I without sales charge | 22.76% | 7.03% | 9.92% |
| Comparative Benchmark(s) | |||
| MSCI All Country World (ex-US) Index (net div) ∆ | 32.77% | 8.77% | 9.82% |
|
∆
|
Source: FactSet Research Systems Inc.
|
Visit mfs.com/perf/i for more recent performance information.
FUND STATISTICS AS OF 5/31/26
| Net Assets ($): | 44,550,318,981 | Total Management Fee ($)#: | 0 | |
| Total Number of Holdings: | 7 | Portfolio Turnover Rate (%): | 1 |
# The fund itself does not pay a management fee but the underlying funds in which the fund invests do pay management fees to MFS.
PORTFOLIO COMPOSITION (BASED ON TOTAL INVESTMENTS AS OF 5/31/26)
Portfolio target allocation
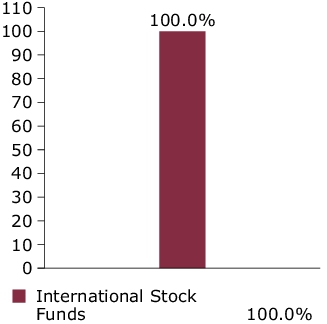
Portfolio actual allocation
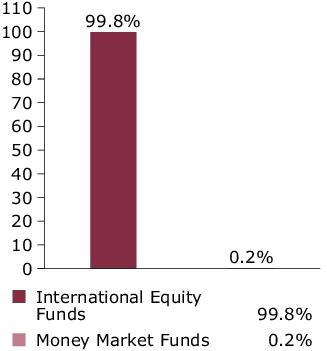
Portfolio holdings
| MFS Research International Fund | 27.4% |
| MFS Emerging Markets Equity Fund | 17.5% |
| MFS International Growth Fund | 15.0% |
| MFS International Intrinsic Equity Fund | 15.0% |
| MFS International Large Cap Value Fund | 14.9% |
| MFS International New Discovery Fund | 10.0% |
| MFS Institutional Money Market Portfolio | 0.2% |
FUND EXPENSES
What were the fund costs for the last year?
| (based on a hypothetical $10,000 investment) | ||
| Class Name | Costs of a $10,000 investment ~ | Costs paid as a percentage of a $10,000 investment ~ |
| R1 | $122 | 1.10% |
˜ Expenses are direct expenses and do not include underlying fund fees and expenses.
MANAGEMENT'S DISCUSSION OF FUND PERFORMANCE
-
For the twelve months ended May 31, 2026, Class R1 shares of the MFS International Diversification Fund (fund) provided a total return of 21.50%, at net asset value. This compares with a return of 32.77% for the fund’s benchmark, the MSCI All Country World (ex-US) Index (net div).
-
Global equity markets reached record levels during the period, withstanding considerable volatility amid tariffs, geopolitical conflict and high levels of uncertainty. A new geopolitical event distressed markets at the end of the period as US and Israeli forces launched strikes against Iran, disrupting Mideast oil and natural gas exports. During the period, a pro-growth tax and spending bill was signed into law in the US, while in Europe, renewed focus on defense and infrastructure spending brightened the economic outlook. In Japan, the election of a pro-growth prime minister sent stocks to new highs prior to the conflict in Iran. Optimism over artificial intelligence remained high.
-
Considerable progress was made in trade talks between the US and many major trading partners, with a fragile truce between the US and China extended through late 2026. While the US Supreme Court struck down part of the Trump administration’s tariff strategy, the administration began deploying other authorities to largely replace the ones that were ruled unconstitutional.
-
Early in the period, moderating inflation pressures allowed many global central banks to ease monetary policy. Amid a difficult policymaking environment and slower job growth, the Federal Reserve resumed easing policy in September and delivered quarter-point rate cuts in October and December before pausing.
-
In fixed income markets, previously range-bound global bond yields spiked following the onset of the Middle East conflict, as energy-driven inflation fears appeared to have rattled bond investors. US rate volatility (as measured by the Merrill Lynch Option Volatility Estimate (MOVE) Index) similarly rose from intra-period lows, reflecting uncertainty around the scope and duration of the conflict and its implications for global growth. However, volatility later retracted as the risk of a broader regional military escalation appeared less likely. Global credit spreads widened only modestly before stabilizing near prior levels, supported by strong demand and resilient underlying fundamentals.
-
Top contributors to performance relative to the MSCI All Country World (ex-US) Index:
-
During the reporting period, the fund’s exposure to the MFS Emerging Markets Equity Fund aided relative performance as emerging markets performed well versus international stocks.
-
-
Top detractors from performance relative to the MSCI All Country World (ex-US) Index:
-
The fund’s exposure to the MFS Research International Fund weakened relative returns as the fund underperformed its respective benchmark.
-
The fund’s exposure to both the MFS International Growth Fund and MFS International New Discovery Fund further weighed on relative performance.
-
FUND PERFORMANCE
The fund’s past performance is not a good predictor of the fund’s future performance. The graph and table below do not reflect the deduction of taxes that a shareholder would pay on fund distributions or the redemption of fund shares. The graph and table below assume reinvestment of dividends and capital gain distributions.
Growth of a Hypothetical $10,000 Investment
This graph shows the performance of a hypothetical $10,000 investment in Class R1 over a ten year period or since inception, if shorter, in comparison to a broad measure of market performance.
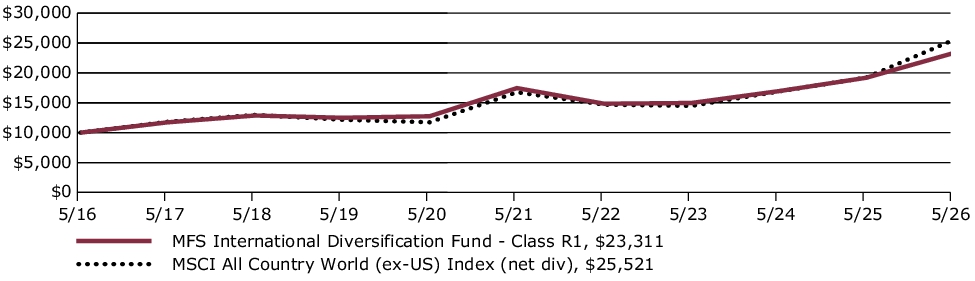
Average Annual Total Returns through 5/31/26
This table shows the average annual total returns of the class of shares noted for the periods shown, both with (if any) and without sales charges. It also shows the average annual total returns of a broad measure of market performance over the same periods.
| Share Class | 1-yr | 5-yr | 10-yr |
| R1 without sales charge | 21.50% | 5.96% | 8.83% |
| Comparative Benchmark(s) | |||
| MSCI All Country World (ex-US) Index (net div) ∆ | 32.77% | 8.77% | 9.82% |
|
∆
|
Source: FactSet Research Systems Inc.
|
Visit mfs.com/perf/r1 for more recent performance information.
FUND STATISTICS AS OF 5/31/26
| Net Assets ($): | 44,550,318,981 | Total Management Fee ($)#: | 0 | |
| Total Number of Holdings: | 7 | Portfolio Turnover Rate (%): | 1 |
# The fund itself does not pay a management fee but the underlying funds in which the fund invests do pay management fees to MFS.
PORTFOLIO COMPOSITION (BASED ON TOTAL INVESTMENTS AS OF 5/31/26)
Portfolio target allocation
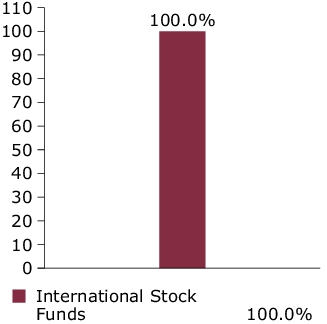
Portfolio actual allocation
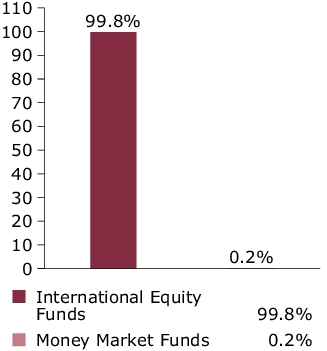
Portfolio holdings
| MFS Research International Fund | 27.4% |
| MFS Emerging Markets Equity Fund | 17.5% |
| MFS International Growth Fund | 15.0% |
| MFS International Intrinsic Equity Fund | 15.0% |
| MFS International Large Cap Value Fund | 14.9% |
| MFS International New Discovery Fund | 10.0% |
| MFS Institutional Money Market Portfolio | 0.2% |
FUND EXPENSES
What were the fund costs for the last year?
| (based on a hypothetical $10,000 investment) | ||
| Class Name | Costs of a $10,000 investment ~ | Costs paid as a percentage of a $10,000 investment ~ |
| R2 | $67 | 0.60% |
˜ Expenses are direct expenses and do not include underlying fund fees and expenses.
MANAGEMENT'S DISCUSSION OF FUND PERFORMANCE
-
For the twelve months ended May 31, 2026, Class R2 shares of the MFS International Diversification Fund (fund) provided a total return of 22.13%, at net asset value. This compares with a return of 32.77% for the fund’s benchmark, the MSCI All Country World (ex-US) Index (net div).
-
Global equity markets reached record levels during the period, withstanding considerable volatility amid tariffs, geopolitical conflict and high levels of uncertainty. A new geopolitical event distressed markets at the end of the period as US and Israeli forces launched strikes against Iran, disrupting Mideast oil and natural gas exports. During the period, a pro-growth tax and spending bill was signed into law in the US, while in Europe, renewed focus on defense and infrastructure spending brightened the economic outlook. In Japan, the election of a pro-growth prime minister sent stocks to new highs prior to the conflict in Iran. Optimism over artificial intelligence remained high.
-
Considerable progress was made in trade talks between the US and many major trading partners, with a fragile truce between the US and China extended through late 2026. While the US Supreme Court struck down part of the Trump administration’s tariff strategy, the administration began deploying other authorities to largely replace the ones that were ruled unconstitutional.
-
Early in the period, moderating inflation pressures allowed many global central banks to ease monetary policy. Amid a difficult policymaking environment and slower job growth, the Federal Reserve resumed easing policy in September and delivered quarter-point rate cuts in October and December before pausing.
-
In fixed income markets, previously range-bound global bond yields spiked following the onset of the Middle East conflict, as energy-driven inflation fears appeared to have rattled bond investors. US rate volatility (as measured by the Merrill Lynch Option Volatility Estimate (MOVE) Index) similarly rose from intra-period lows, reflecting uncertainty around the scope and duration of the conflict and its implications for global growth. However, volatility later retracted as the risk of a broader regional military escalation appeared less likely. Global credit spreads widened only modestly before stabilizing near prior levels, supported by strong demand and resilient underlying fundamentals.
-
Top contributors to performance relative to the MSCI All Country World (ex-US) Index:
-
During the reporting period, the fund’s exposure to the MFS Emerging Markets Equity Fund aided relative performance as emerging markets performed well versus international stocks.
-
-
Top detractors from performance relative to the MSCI All Country World (ex-US) Index:
-
The fund’s exposure to the MFS Research International Fund weakened relative returns as the fund underperformed its respective benchmark.
-
The fund’s exposure to both the MFS International Growth Fund and MFS International New Discovery Fund further weighed on relative performance.
-
FUND PERFORMANCE
The fund’s past performance is not a good predictor of the fund’s future performance. The graph and table below do not reflect the deduction of taxes that a shareholder would pay on fund distributions or the redemption of fund shares. The graph and table below assume reinvestment of dividends and capital gain distributions.
Growth of a Hypothetical $10,000 Investment
This graph shows the performance of a hypothetical $10,000 investment in Class R2 over a ten year period or since inception, if shorter, in comparison to a broad measure of market performance.
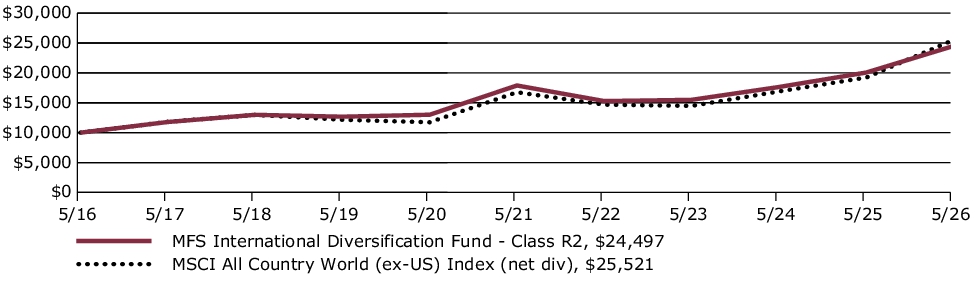
Average Annual Total Returns through 5/31/26
This table shows the average annual total returns of the class of shares noted for the periods shown, both with (if any) and without sales charges. It also shows the average annual total returns of a broad measure of market performance over the same periods.
| Share Class | 1-yr | 5-yr | 10-yr |
| R2 without sales charge | 22.13% | 6.49% | 9.37% |
| Comparative Benchmark(s) | |||
| MSCI All Country World (ex-US) Index (net div) ∆ | 32.77% | 8.77% | 9.82% |
|
∆
|
Source: FactSet Research Systems Inc.
|
Visit mfs.com/perf/r2 for more recent performance information.
FUND STATISTICS AS OF 5/31/26
| Net Assets ($): | 44,550,318,981 | Total Management Fee ($)#: | 0 | |
| Total Number of Holdings: | 7 | Portfolio Turnover Rate (%): | 1 |
# The fund itself does not pay a management fee but the underlying funds in which the fund invests do pay management fees to MFS.
PORTFOLIO COMPOSITION (BASED ON TOTAL INVESTMENTS AS OF 5/31/26)
Portfolio target allocation
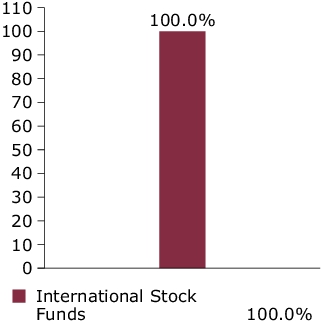
Portfolio actual allocation
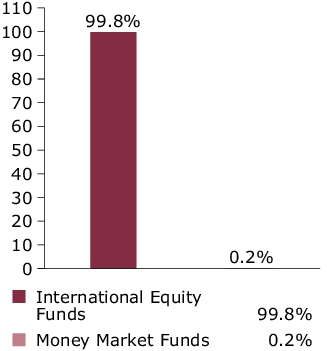
Portfolio holdings
| MFS Research International Fund | 27.4% |
| MFS Emerging Markets Equity Fund | 17.5% |
| MFS International Growth Fund | 15.0% |
| MFS International Intrinsic Equity Fund | 15.0% |
| MFS International Large Cap Value Fund | 14.9% |
| MFS International New Discovery Fund | 10.0% |
| MFS Institutional Money Market Portfolio | 0.2% |
FUND EXPENSES
What were the fund costs for the last year?
| (based on a hypothetical $10,000 investment) | ||
| Class Name | Costs of a $10,000 investment ~ | Costs paid as a percentage of a $10,000 investment ~ |
| R3 | $39 | 0.35% |
˜ Expenses are direct expenses and do not include underlying fund fees and expenses.
MANAGEMENT'S DISCUSSION OF FUND PERFORMANCE
-
For the twelve months ended May 31, 2026, Class R3 shares of the MFS International Diversification Fund (fund) provided a total return of 22.43%, at net asset value. This compares with a return of 32.77% for the fund’s benchmark, the MSCI All Country World (ex-US) Index (net div).
-
Global equity markets reached record levels during the period, withstanding considerable volatility amid tariffs, geopolitical conflict and high levels of uncertainty. A new geopolitical event distressed markets at the end of the period as US and Israeli forces launched strikes against Iran, disrupting Mideast oil and natural gas exports. During the period, a pro-growth tax and spending bill was signed into law in the US, while in Europe, renewed focus on defense and infrastructure spending brightened the economic outlook. In Japan, the election of a pro-growth prime minister sent stocks to new highs prior to the conflict in Iran. Optimism over artificial intelligence remained high.
-
Considerable progress was made in trade talks between the US and many major trading partners, with a fragile truce between the US and China extended through late 2026. While the US Supreme Court struck down part of the Trump administration’s tariff strategy, the administration began deploying other authorities to largely replace the ones that were ruled unconstitutional.
-
Early in the period, moderating inflation pressures allowed many global central banks to ease monetary policy. Amid a difficult policymaking environment and slower job growth, the Federal Reserve resumed easing policy in September and delivered quarter-point rate cuts in October and December before pausing.
-
In fixed income markets, previously range-bound global bond yields spiked following the onset of the Middle East conflict, as energy-driven inflation fears appeared to have rattled bond investors. US rate volatility (as measured by the Merrill Lynch Option Volatility Estimate (MOVE) Index) similarly rose from intra-period lows, reflecting uncertainty around the scope and duration of the conflict and its implications for global growth. However, volatility later retracted as the risk of a broader regional military escalation appeared less likely. Global credit spreads widened only modestly before stabilizing near prior levels, supported by strong demand and resilient underlying fundamentals.
-
Top contributors to performance relative to the MSCI All Country World (ex-US) Index:
-
During the reporting period, the fund’s exposure to the MFS Emerging Markets Equity Fund aided relative performance as emerging markets performed well versus international stocks.
-
-
Top detractors from performance relative to the MSCI All Country World (ex-US) Index:
-
The fund’s exposure to the MFS Research International Fund weakened relative returns as the fund underperformed its respective benchmark.
-
The fund’s exposure to both the MFS International Growth Fund and MFS International New Discovery Fund further weighed on relative performance.
-
FUND PERFORMANCE
The fund’s past performance is not a good predictor of the fund’s future performance. The graph and table below do not reflect the deduction of taxes that a shareholder would pay on fund distributions or the redemption of fund shares. The graph and table below assume reinvestment of dividends and capital gain distributions.
Growth of a Hypothetical $10,000 Investment
This graph shows the performance of a hypothetical $10,000 investment in Class R3 over a ten year period or since inception, if shorter, in comparison to a broad measure of market performance.
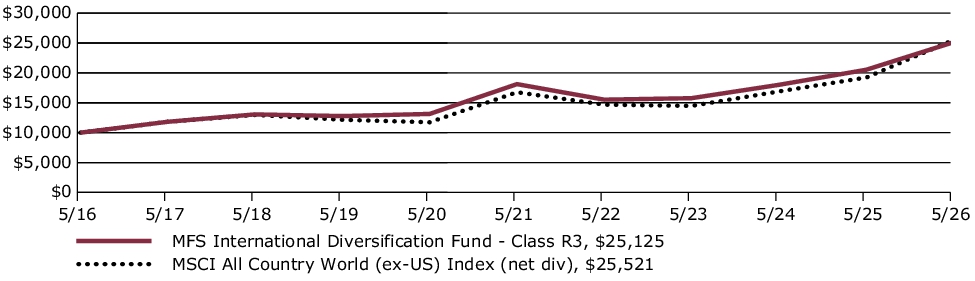
Average Annual Total Returns through 5/31/26
This table shows the average annual total returns of the class of shares noted for the periods shown, both with (if any) and without sales charges. It also shows the average annual total returns of a broad measure of market performance over the same periods.
| Share Class | 1-yr | 5-yr | 10-yr |
| R3 without sales charge | 22.43% | 6.76% | 9.65% |
| Comparative Benchmark(s) | |||
| MSCI All Country World (ex-US) Index (net div) ∆ | 32.77% | 8.77% | 9.82% |
|
∆
|
Source: FactSet Research Systems Inc.
|
Visit mfs.com/perf/r3 for more recent performance information.
FUND STATISTICS AS OF 5/31/26
| Net Assets ($): | 44,550,318,981 | Total Management Fee ($)#: | 0 | |
| Total Number of Holdings: | 7 | Portfolio Turnover Rate (%): | 1 |
# The fund itself does not pay a management fee but the underlying funds in which the fund invests do pay management fees to MFS.
PORTFOLIO COMPOSITION (BASED ON TOTAL INVESTMENTS AS OF 5/31/26)
Portfolio target allocation
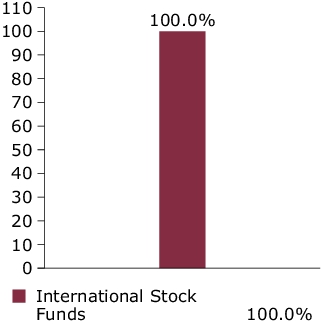
Portfolio actual allocation
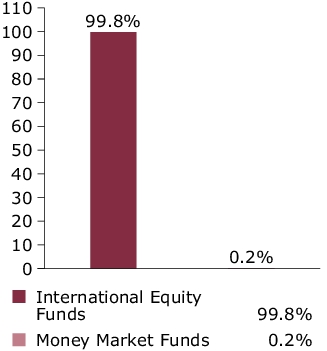
Portfolio holdings
| MFS Research International Fund | 27.4% |
| MFS Emerging Markets Equity Fund | 17.5% |
| MFS International Growth Fund | 15.0% |
| MFS International Intrinsic Equity Fund | 15.0% |
| MFS International Large Cap Value Fund | 14.9% |
| MFS International New Discovery Fund | 10.0% |
| MFS Institutional Money Market Portfolio | 0.2% |
FUND EXPENSES
What were the fund costs for the last year?
| (based on a hypothetical $10,000 investment) | ||
| Class Name | Costs of a $10,000 investment ~ | Costs paid as a percentage of a $10,000 investment ~ |
| R4 | $11 | 0.10% |
˜ Expenses are direct expenses and do not include underlying fund fees and expenses.
MANAGEMENT'S DISCUSSION OF FUND PERFORMANCE
-
For the twelve months ended May 31, 2026, Class R4 shares of the MFS International Diversification Fund (fund) provided a total return of 22.76%, at net asset value. This compares with a return of 32.77% for the fund’s benchmark, the MSCI All Country World (ex-US) Index (net div).
-
Global equity markets reached record levels during the period, withstanding considerable volatility amid tariffs, geopolitical conflict and high levels of uncertainty. A new geopolitical event distressed markets at the end of the period as US and Israeli forces launched strikes against Iran, disrupting Mideast oil and natural gas exports. During the period, a pro-growth tax and spending bill was signed into law in the US, while in Europe, renewed focus on defense and infrastructure spending brightened the economic outlook. In Japan, the election of a pro-growth prime minister sent stocks to new highs prior to the conflict in Iran. Optimism over artificial intelligence remained high.
-
Considerable progress was made in trade talks between the US and many major trading partners, with a fragile truce between the US and China extended through late 2026. While the US Supreme Court struck down part of the Trump administration’s tariff strategy, the administration began deploying other authorities to largely replace the ones that were ruled unconstitutional.
-
Early in the period, moderating inflation pressures allowed many global central banks to ease monetary policy. Amid a difficult policymaking environment and slower job growth, the Federal Reserve resumed easing policy in September and delivered quarter-point rate cuts in October and December before pausing.
-
In fixed income markets, previously range-bound global bond yields spiked following the onset of the Middle East conflict, as energy-driven inflation fears appeared to have rattled bond investors. US rate volatility (as measured by the Merrill Lynch Option Volatility Estimate (MOVE) Index) similarly rose from intra-period lows, reflecting uncertainty around the scope and duration of the conflict and its implications for global growth. However, volatility later retracted as the risk of a broader regional military escalation appeared less likely. Global credit spreads widened only modestly before stabilizing near prior levels, supported by strong demand and resilient underlying fundamentals.
-
Top contributors to performance relative to the MSCI All Country World (ex-US) Index:
-
During the reporting period, the fund’s exposure to the MFS Emerging Markets Equity Fund aided relative performance as emerging markets performed well versus international stocks.
-
-
Top detractors from performance relative to the MSCI All Country World (ex-US) Index:
-
The fund’s exposure to the MFS Research International Fund weakened relative returns as the fund underperformed its respective benchmark.
-
The fund’s exposure to both the MFS International Growth Fund and MFS International New Discovery Fund further weighed on relative performance.
-
FUND PERFORMANCE
The fund’s past performance is not a good predictor of the fund’s future performance. The graph and table below do not reflect the deduction of taxes that a shareholder would pay on fund distributions or the redemption of fund shares. The graph and table below assume reinvestment of dividends and capital gain distributions.
Growth of a Hypothetical $10,000 Investment
This graph shows the performance of a hypothetical $10,000 investment in Class R4 over a ten year period or since inception, if shorter, in comparison to a broad measure of market performance.
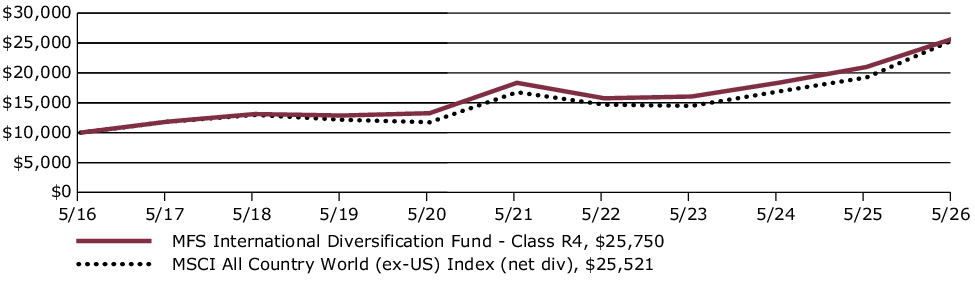
Average Annual Total Returns through 5/31/26
This table shows the average annual total returns of the class of shares noted for the periods shown, both with (if any) and without sales charges. It also shows the average annual total returns of a broad measure of market performance over the same periods.
| Share Class | 1-yr | 5-yr | 10-yr |
| R4 without sales charge | 22.76% | 7.03% | 9.92% |
| Comparative Benchmark(s) | |||
| MSCI All Country World (ex-US) Index (net div) ∆ | 32.77% | 8.77% | 9.82% |
|
∆
|
Source: FactSet Research Systems Inc.
|
Visit mfs.com/perf/r4 for more recent performance information.
FUND STATISTICS AS OF 5/31/26
| Net Assets ($): | 44,550,318,981 | Total Management Fee ($)#: | 0 | |
| Total Number of Holdings: | 7 | Portfolio Turnover Rate (%): | 1 |
# The fund itself does not pay a management fee but the underlying funds in which the fund invests do pay management fees to MFS.
PORTFOLIO COMPOSITION (BASED ON TOTAL INVESTMENTS AS OF 5/31/26)
Portfolio target allocation
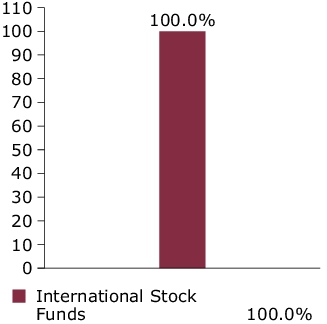
Portfolio actual allocation
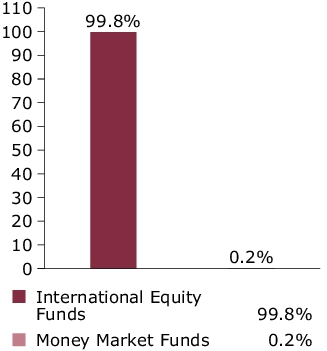
Portfolio holdings
| MFS Research International Fund | 27.4% |
| MFS Emerging Markets Equity Fund | 17.5% |
| MFS International Growth Fund | 15.0% |
| MFS International Intrinsic Equity Fund | 15.0% |
| MFS International Large Cap Value Fund | 14.9% |
| MFS International New Discovery Fund | 10.0% |
| MFS Institutional Money Market Portfolio | 0.2% |
FUND EXPENSES
What were the fund costs for the last year?
| (based on a hypothetical $10,000 investment) | ||
| Class Name | Costs of a $10,000 investment ~ | Costs paid as a percentage of a $10,000 investment ~ |
| R6 | $0 | 0.00% |
˜ Expenses are direct expenses and do not include underlying fund fees and expenses.
MANAGEMENT'S DISCUSSION OF FUND PERFORMANCE
-
For the twelve months ended May 31, 2026, Class R6 shares of the MFS International Diversification Fund (fund) provided a total return of 22.89%, at net asset value. This compares with a return of 32.77% for the fund’s benchmark, the MSCI All Country World (ex-US) Index (net div).
-
Global equity markets reached record levels during the period, withstanding considerable volatility amid tariffs, geopolitical conflict and high levels of uncertainty. A new geopolitical event distressed markets at the end of the period as US and Israeli forces launched strikes against Iran, disrupting Mideast oil and natural gas exports. During the period, a pro-growth tax and spending bill was signed into law in the US, while in Europe, renewed focus on defense and infrastructure spending brightened the economic outlook. In Japan, the election of a pro-growth prime minister sent stocks to new highs prior to the conflict in Iran. Optimism over artificial intelligence remained high.
-
Considerable progress was made in trade talks between the US and many major trading partners, with a fragile truce between the US and China extended through late 2026. While the US Supreme Court struck down part of the Trump administration’s tariff strategy, the administration began deploying other authorities to largely replace the ones that were ruled unconstitutional.
-
Early in the period, moderating inflation pressures allowed many global central banks to ease monetary policy. Amid a difficult policymaking environment and slower job growth, the Federal Reserve resumed easing policy in September and delivered quarter-point rate cuts in October and December before pausing.
-
In fixed income markets, previously range-bound global bond yields spiked following the onset of the Middle East conflict, as energy-driven inflation fears appeared to have rattled bond investors. US rate volatility (as measured by the Merrill Lynch Option Volatility Estimate (MOVE) Index) similarly rose from intra-period lows, reflecting uncertainty around the scope and duration of the conflict and its implications for global growth. However, volatility later retracted as the risk of a broader regional military escalation appeared less likely. Global credit spreads widened only modestly before stabilizing near prior levels, supported by strong demand and resilient underlying fundamentals.
-
Top contributors to performance relative to the MSCI All Country World (ex-US) Index:
-
During the reporting period, the fund’s exposure to the MFS Emerging Markets Equity Fund aided relative performance as emerging markets performed well versus international stocks.
-
-
Top detractors from performance relative to the MSCI All Country World (ex-US) Index:
-
The fund’s exposure to the MFS Research International Fund weakened relative returns as the fund underperformed its respective benchmark.
-
The fund’s exposure to both the MFS International Growth Fund and MFS International New Discovery Fund further weighed on relative performance.
-
FUND PERFORMANCE
The fund’s past performance is not a good predictor of the fund’s future performance. The graph and table below do not reflect the deduction of taxes that a shareholder would pay on fund distributions or the redemption of fund shares. The graph and table below assume reinvestment of dividends and capital gain distributions.
Growth of a Hypothetical $10,000 Investment*
This graph shows the performance of a hypothetical $10,000 investment in Class R6 over a ten year period or since inception, if shorter, in comparison to a broad measure of market performance.
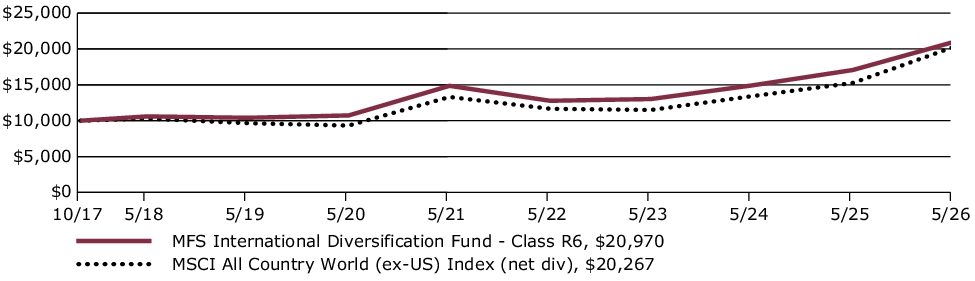
Average Annual Total Returns through 5/31/26
This table shows the average annual total returns of the class of shares noted for the periods shown, both with (if any) and without sales charges. It also shows the average annual total returns of a broad measure of market performance over the same periods.
| Share Class | 1-yr | 5-yr | Life* |
| R6 without sales charge | 22.89% | 7.13% | 8.92% |
| Comparative Benchmark(s) | |||
| MSCI All Country World (ex-US) Index (net div) ∆ | 32.77% | 8.77% | 8.49% |
|
*
|
For the period from the commencement of the class's investment operations, October 2, 2017 through May 31, 2026.
|
|
∆
|
Source: FactSet Research Systems Inc.
|
Visit mfs.com/perf/r6 for more recent performance information.
FUND STATISTICS AS OF 5/31/26
| Net Assets ($): | 44,550,318,981 | Total Management Fee ($)#: | 0 | |
| Total Number of Holdings: | 7 | Portfolio Turnover Rate (%): | 1 |
# The fund itself does not pay a management fee but the underlying funds in which the fund invests do pay management fees to MFS.
PORTFOLIO COMPOSITION (BASED ON TOTAL INVESTMENTS AS OF 5/31/26)
Portfolio target allocation
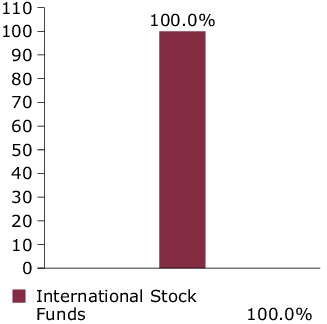
Portfolio actual allocation
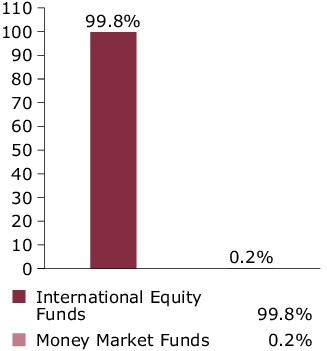
Portfolio holdings
| MFS Research International Fund | 27.4% |
| MFS Emerging Markets Equity Fund | 17.5% |
| MFS International Growth Fund | 15.0% |
| MFS International Intrinsic Equity Fund | 15.0% |
| MFS International Large Cap Value Fund | 14.9% |
| MFS International New Discovery Fund | 10.0% |
| MFS Institutional Money Market Portfolio | 0.2% |
FUND EXPENSES
What were the fund costs for the last year?
| (based on a hypothetical $10,000 investment) | ||
| Class Name | Costs of a $10,000 investment | Costs paid as a percentage of a $10,000 investment |
| R6 | $71 | 0.67% |
MANAGEMENT'S DISCUSSION OF FUND PERFORMANCE
-
For the twelve months ended May 31, 2026, Class R6 shares of the MFS International Growth Fund (fund) provided a total return of 11.96%, at net asset value. This compares with a return of 32.77% for the fund’s benchmark, the MSCI All Country World (ex-US) Index (net div). The fund's other benchmark, the MSCI All Country World (ex-US) Growth Index (net div), generated a return of 27.50%.
-
Global equity markets reached record levels during the period, withstanding considerable volatility amid tariffs, geopolitical conflict and high levels of uncertainty. A new geopolitical event distressed markets at the end of the period as US and Israeli forces launched strikes against Iran, disrupting Mideast oil and natural gas exports. During the period, a pro-growth tax and spending bill was signed into law in the US, while in Europe, renewed focus on defense and infrastructure spending brightened the economic outlook. In Japan, the election of a pro-growth prime minister sent stocks to new highs prior to the conflict in Iran. Optimism over artificial intelligence remained high.
-
Considerable progress was made in trade talks between the US and many major trading partners, with a fragile truce between the US and China extended through late 2026. While the US Supreme Court struck down part of the Trump administration’s tariff strategy, the administration began deploying other authorities to largely replace the ones that were ruled unconstitutional.
-
Early in the period, moderating inflation pressures allowed many global central banks to ease monetary policy. Amid a difficult policymaking environment and slower job growth, the Federal Reserve resumed easing policy in September and delivered quarter-point rate cuts in October and December before pausing.
-
In fixed income markets, previously range-bound global bond yields spiked following the onset of the Middle East conflict, as energy-driven inflation fears appeared to have rattled bond investors. US rate volatility (as measured by the Merrill Lynch Option Volatility Estimate (MOVE) Index) similarly rose from intra-period lows, reflecting uncertainty around the scope and duration of the conflict and its implications for global growth. However, volatility later retracted as the risk of a broader regional military escalation appeared less likely. Global credit spreads widened only modestly before stabilizing near prior levels, supported by strong demand and resilient underlying fundamentals.
-
Top contributors to performance relative to the MSCI All Country World (ex-US) Growth Index:
-
Security selection within the financials sector strengthened the fund's relative performance.
-
An underweight allocation to the communication services sector further benefited relative performance.
-
-
Top detractors from performance relative to the MSCI All Country World (ex-US) Growth Index:
-
Security selection and an underweight allocation to the information technology sector weakened the fund's relative performance.
-
Security selection and an overweight allocation to the consumer staples sector also hindered relative results.
-
FUND PERFORMANCE
The fund’s past performance is not a good predictor of the fund’s future performance. The graph and table below do not reflect the deduction of taxes that a shareholder would pay on fund distributions or the redemption of fund shares. The graph and table below assume reinvestment of dividends and capital gain distributions.
Growth of a Hypothetical $10,000 Investment
This graph shows the performance of a hypothetical $10,000 investment in Class R6 over a ten year period or since inception, if shorter, in comparison to (i) a broad measure of market performance and (ii) an additional index that MFS believes more closely reflects the market segments in which the fund invests.
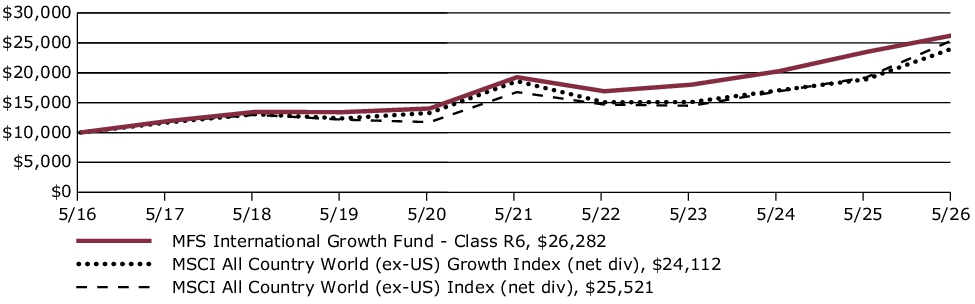
Average Annual Total Returns through 5/31/26
This table shows the average annual total returns of the class of shares noted for the periods shown, both with (if any) and without sales charges. It also shows the average annual total returns of (i) a broad measure of market performance and (ii) an additional index that MFS believes more closely reflects the market segments in which the fund invests, over the same periods.
| Share Class | 1-yr | 5-yr | 10-yr |
| R6 without sales charge | 11.96% | 6.42% | 10.15% |
| Comparative Benchmark(s) | |||
| MSCI All Country World (ex-US) Index (net div) ∆ | 32.77% | 8.77% | 9.82% |
| MSCI All Country World (ex-US) Growth Index (net div) ∆ | 27.50% | 5.35% | 9.20% |
|
∆
|
Source: FactSet Research Systems Inc.
|
Visit mfs.com/perf/r6 for more recent performance information.
FUND STATISTICS AS OF 5/31/26
| Net Assets ($): | 23,028,645,857 | Total Management Fee ($)#: | 139,387,645 | |
| Total Number of Holdings: | 85 | Portfolio Turnover Rate (%): | 16 |
# Includes the effect of any management fee waivers, if applicable.
Where the fund holds derivatives, they are not included in the total number of portfolio holdings.
PORTFOLIO COMPOSITION (BASED ON TOTAL INVESTMENTS AS OF 5/31/26)
Portfolio structure
| Equities | 98.5% |
| Money Market Funds | 1.5% |
Top ten holdings
| Taiwan Semiconductor Manufacturing Co. Ltd. | 7.3% |
| Schneider Electric SE | 4.0% |
| Resonac Holdings Corp. | 3.7% |
| SAP SE | 3.2% |
| Nestle S.A. | 3.0% |
| Delta Electronics, Inc. | 2.9% |
| AstraZeneca PLC | 2.8% |
| AIA Group Ltd. | 2.7% |
| Rolls-Royce Holdings PLC | 2.4% |
| Agnico Eagle Mines Ltd. | 2.4% |
Issuer country weightings
| Taiwan | 11.6% |
| Japan | 11.4% |
| United Kingdom | 11.0% |
| France | 10.9% |
| Germany | 8.6% |
| Canada | 7.3% |
| Switzerland | 7.0% |
| Netherlands | 4.3% |
| United States | 4.2% |
| Other Countries | 23.7% |
Top ten holdings
| Taiwan Semiconductor Manufacturing Co. Ltd. | 7.3% |
| Schneider Electric SE | 4.0% |
| Resonac Holdings Corp. | 3.7% |
| SAP SE | 3.2% |
| Nestle S.A. | 3.0% |
| Delta Electronics, Inc. | 2.9% |
| AstraZeneca PLC | 2.8% |
| AIA Group Ltd. | 2.7% |
| Rolls-Royce Holdings PLC | 2.4% |
| Agnico Eagle Mines Ltd. | 2.4% |
FUND EXPENSES
What were the fund costs for the last year?
| (based on a hypothetical $10,000 investment) | ||
| Class Name | Costs of a $10,000 investment | Costs paid as a percentage of a $10,000 investment |
| R4 | $83 | 0.78% |
MANAGEMENT'S DISCUSSION OF FUND PERFORMANCE
-
For the twelve months ended May 31, 2026, Class R4 shares of the MFS International Growth Fund (fund) provided a total return of 11.87%, at net asset value. This compares with a return of 32.77% for the fund’s benchmark, the MSCI All Country World (ex-US) Index (net div). The fund's other benchmark, the MSCI All Country World (ex-US) Growth Index (net div), generated a return of 27.50%.
-
Global equity markets reached record levels during the period, withstanding considerable volatility amid tariffs, geopolitical conflict and high levels of uncertainty. A new geopolitical event distressed markets at the end of the period as US and Israeli forces launched strikes against Iran, disrupting Mideast oil and natural gas exports. During the period, a pro-growth tax and spending bill was signed into law in the US, while in Europe, renewed focus on defense and infrastructure spending brightened the economic outlook. In Japan, the election of a pro-growth prime minister sent stocks to new highs prior to the conflict in Iran. Optimism over artificial intelligence remained high.
-
Considerable progress was made in trade talks between the US and many major trading partners, with a fragile truce between the US and China extended through late 2026. While the US Supreme Court struck down part of the Trump administration’s tariff strategy, the administration began deploying other authorities to largely replace the ones that were ruled unconstitutional.
-
Early in the period, moderating inflation pressures allowed many global central banks to ease monetary policy. Amid a difficult policymaking environment and slower job growth, the Federal Reserve resumed easing policy in September and delivered quarter-point rate cuts in October and December before pausing.
-
In fixed income markets, previously range-bound global bond yields spiked following the onset of the Middle East conflict, as energy-driven inflation fears appeared to have rattled bond investors. US rate volatility (as measured by the Merrill Lynch Option Volatility Estimate (MOVE) Index) similarly rose from intra-period lows, reflecting uncertainty around the scope and duration of the conflict and its implications for global growth. However, volatility later retracted as the risk of a broader regional military escalation appeared less likely. Global credit spreads widened only modestly before stabilizing near prior levels, supported by strong demand and resilient underlying fundamentals.
-
Top contributors to performance relative to the MSCI All Country World (ex-US) Growth Index:
-
Security selection within the financials sector strengthened the fund's relative performance.
-
An underweight allocation to the communication services sector further benefited relative performance.
-
-
Top detractors from performance relative to the MSCI All Country World (ex-US) Growth Index:
-
Security selection and an underweight allocation to the information technology sector weakened the fund's relative performance.
-
Security selection and an overweight allocation to the consumer staples sector also hindered relative results.
-
FUND PERFORMANCE
The fund’s past performance is not a good predictor of the fund’s future performance. The graph and table below do not reflect the deduction of taxes that a shareholder would pay on fund distributions or the redemption of fund shares. The graph and table below assume reinvestment of dividends and capital gain distributions.
Growth of a Hypothetical $10,000 Investment
This graph shows the performance of a hypothetical $10,000 investment in Class R4 over a ten year period or since inception, if shorter, in comparison to (i) a broad measure of market performance and (ii) an additional index that MFS believes more closely reflects the market segments in which the fund invests.
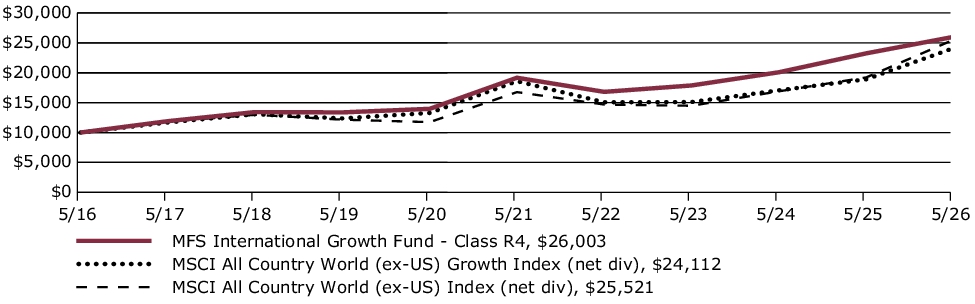
Average Annual Total Returns through 5/31/26
This table shows the average annual total returns of the class of shares noted for the periods shown, both with (if any) and without sales charges. It also shows the average annual total returns of (i) a broad measure of market performance and (ii) an additional index that MFS believes more closely reflects the market segments in which the fund invests, over the same periods.
| Share Class | 1-yr | 5-yr | 10-yr |
| R4 without sales charge | 11.87% | 6.30% | 10.03% |
| Comparative Benchmark(s) | |||
| MSCI All Country World (ex-US) Index (net div) ∆ | 32.77% | 8.77% | 9.82% |
| MSCI All Country World (ex-US) Growth Index (net div) ∆ | 27.50% | 5.35% | 9.20% |
|
∆
|
Source: FactSet Research Systems Inc.
|
Visit mfs.com/perf/r4 for more recent performance information.
FUND STATISTICS AS OF 5/31/26
| Net Assets ($): | 23,028,645,857 | Total Management Fee ($)#: | 139,387,645 | |
| Total Number of Holdings: | 85 | Portfolio Turnover Rate (%): | 16 |
# Includes the effect of any management fee waivers, if applicable.
Where the fund holds derivatives, they are not included in the total number of portfolio holdings.
PORTFOLIO COMPOSITION (BASED ON TOTAL INVESTMENTS AS OF 5/31/26)
Portfolio structure
| Equities | 98.5% |
| Money Market Funds | 1.5% |
Top ten holdings
| Taiwan Semiconductor Manufacturing Co. Ltd. | 7.3% |
| Schneider Electric SE | 4.0% |
| Resonac Holdings Corp. | 3.7% |
| SAP SE | 3.2% |
| Nestle S.A. | 3.0% |
| Delta Electronics, Inc. | 2.9% |
| AstraZeneca PLC | 2.8% |
| AIA Group Ltd. | 2.7% |
| Rolls-Royce Holdings PLC | 2.4% |
| Agnico Eagle Mines Ltd. | 2.4% |
Issuer country weightings
| Taiwan | 11.6% |
| Japan | 11.4% |
| United Kingdom | 11.0% |
| France | 10.9% |
| Germany | 8.6% |
| Canada | 7.3% |
| Switzerland | 7.0% |
| Netherlands | 4.3% |
| United States | 4.2% |
| Other Countries | 23.7% |
Top ten holdings
| Taiwan Semiconductor Manufacturing Co. Ltd. | 7.3% |
| Schneider Electric SE | 4.0% |
| Resonac Holdings Corp. | 3.7% |
| SAP SE | 3.2% |
| Nestle S.A. | 3.0% |
| Delta Electronics, Inc. | 2.9% |
| AstraZeneca PLC | 2.8% |
| AIA Group Ltd. | 2.7% |
| Rolls-Royce Holdings PLC | 2.4% |
| Agnico Eagle Mines Ltd. | 2.4% |
FUND EXPENSES
What were the fund costs for the last year?
| (based on a hypothetical $10,000 investment) | ||
| Class Name | Costs of a $10,000 investment | Costs paid as a percentage of a $10,000 investment |
| R3 | $109 | 1.03% |
MANAGEMENT'S DISCUSSION OF FUND PERFORMANCE
-
For the twelve months ended May 31, 2026, Class R3 shares of the MFS International Growth Fund (fund) provided a total return of 11.56%, at net asset value. This compares with a return of 32.77% for the fund’s benchmark, the MSCI All Country World (ex-US) Index (net div). The fund's other benchmark, the MSCI All Country World (ex-US) Growth Index (net div), generated a return of 27.50%.
-
Global equity markets reached record levels during the period, withstanding considerable volatility amid tariffs, geopolitical conflict and high levels of uncertainty. A new geopolitical event distressed markets at the end of the period as US and Israeli forces launched strikes against Iran, disrupting Mideast oil and natural gas exports. During the period, a pro-growth tax and spending bill was signed into law in the US, while in Europe, renewed focus on defense and infrastructure spending brightened the economic outlook. In Japan, the election of a pro-growth prime minister sent stocks to new highs prior to the conflict in Iran. Optimism over artificial intelligence remained high.
-
Considerable progress was made in trade talks between the US and many major trading partners, with a fragile truce between the US and China extended through late 2026. While the US Supreme Court struck down part of the Trump administration’s tariff strategy, the administration began deploying other authorities to largely replace the ones that were ruled unconstitutional.
-
Early in the period, moderating inflation pressures allowed many global central banks to ease monetary policy. Amid a difficult policymaking environment and slower job growth, the Federal Reserve resumed easing policy in September and delivered quarter-point rate cuts in October and December before pausing.
-
In fixed income markets, previously range-bound global bond yields spiked following the onset of the Middle East conflict, as energy-driven inflation fears appeared to have rattled bond investors. US rate volatility (as measured by the Merrill Lynch Option Volatility Estimate (MOVE) Index) similarly rose from intra-period lows, reflecting uncertainty around the scope and duration of the conflict and its implications for global growth. However, volatility later retracted as the risk of a broader regional military escalation appeared less likely. Global credit spreads widened only modestly before stabilizing near prior levels, supported by strong demand and resilient underlying fundamentals.
-
Top contributors to performance relative to the MSCI All Country World (ex-US) Growth Index:
-
Security selection within the financials sector strengthened the fund's relative performance.
-
An underweight allocation to the communication services sector further benefited relative performance.
-
-
Top detractors from performance relative to the MSCI All Country World (ex-US) Growth Index:
-
Security selection and an underweight allocation to the information technology sector weakened the fund's relative performance.
-
Security selection and an overweight allocation to the consumer staples sector also hindered relative results.
-
FUND PERFORMANCE
The fund’s past performance is not a good predictor of the fund’s future performance. The graph and table below do not reflect the deduction of taxes that a shareholder would pay on fund distributions or the redemption of fund shares. The graph and table below assume reinvestment of dividends and capital gain distributions.
Growth of a Hypothetical $10,000 Investment
This graph shows the performance of a hypothetical $10,000 investment in Class R3 over a ten year period or since inception, if shorter, in comparison to (i) a broad measure of market performance and (ii) an additional index that MFS believes more closely reflects the market segments in which the fund invests.
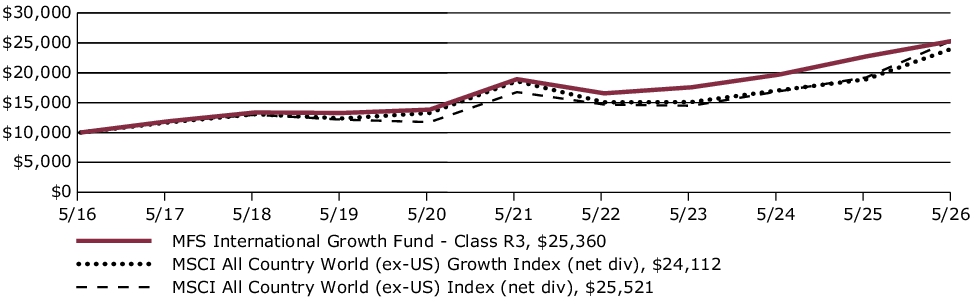
Average Annual Total Returns through 5/31/26
This table shows the average annual total returns of the class of shares noted for the periods shown, both with (if any) and without sales charges. It also shows the average annual total returns of (i) a broad measure of market performance and (ii) an additional index that MFS believes more closely reflects the market segments in which the fund invests, over the same periods.
| Share Class | 1-yr | 5-yr | 10-yr |
| R3 without sales charge | 11.56% | 6.03% | 9.75% |
| Comparative Benchmark(s) | |||
| MSCI All Country World (ex-US) Index (net div) ∆ | 32.77% | 8.77% | 9.82% |
| MSCI All Country World (ex-US) Growth Index (net div) ∆ | 27.50% | 5.35% | 9.20% |
|
∆
|
Source: FactSet Research Systems Inc.
|
Visit mfs.com/perf/r3 for more recent performance information.
FUND STATISTICS AS OF 5/31/26
| Net Assets ($): | 23,028,645,857 | Total Management Fee ($)#: | 139,387,645 | |
| Total Number of Holdings: | 85 | Portfolio Turnover Rate (%): | 16 |
# Includes the effect of any management fee waivers, if applicable.
Where the fund holds derivatives, they are not included in the total number of portfolio holdings.
PORTFOLIO COMPOSITION (BASED ON TOTAL INVESTMENTS AS OF 5/31/26)
Portfolio structure
| Equities | 98.5% |
| Money Market Funds | 1.5% |
Top ten holdings
| Taiwan Semiconductor Manufacturing Co. Ltd. | 7.3% |
| Schneider Electric SE | 4.0% |
| Resonac Holdings Corp. | 3.7% |
| SAP SE | 3.2% |
| Nestle S.A. | 3.0% |
| Delta Electronics, Inc. | 2.9% |
| AstraZeneca PLC | 2.8% |
| AIA Group Ltd. | 2.7% |
| Rolls-Royce Holdings PLC | 2.4% |
| Agnico Eagle Mines Ltd. | 2.4% |
Issuer country weightings
| Taiwan | 11.6% |
| Japan | 11.4% |
| United Kingdom | 11.0% |
| France | 10.9% |
| Germany | 8.6% |
| Canada | 7.3% |
| Switzerland | 7.0% |
| Netherlands | 4.3% |
| United States | 4.2% |
| Other Countries | 23.7% |
Top ten holdings
| Taiwan Semiconductor Manufacturing Co. Ltd. | 7.3% |
| Schneider Electric SE | 4.0% |
| Resonac Holdings Corp. | 3.7% |
| SAP SE | 3.2% |
| Nestle S.A. | 3.0% |
| Delta Electronics, Inc. | 2.9% |
| AstraZeneca PLC | 2.8% |
| AIA Group Ltd. | 2.7% |
| Rolls-Royce Holdings PLC | 2.4% |
| Agnico Eagle Mines Ltd. | 2.4% |
FUND EXPENSES
What were the fund costs for the last year?
| (based on a hypothetical $10,000 investment) | ||
| Class Name | Costs of a $10,000 investment | Costs paid as a percentage of a $10,000 investment |
| R2 | $135 | 1.28% |
MANAGEMENT'S DISCUSSION OF FUND PERFORMANCE
-
For the twelve months ended May 31, 2026, Class R2 shares of the MFS International Growth Fund (fund) provided a total return of 11.32%, at net asset value. This compares with a return of 32.77% for the fund’s benchmark, the MSCI All Country World (ex-US) Index (net div). The fund's other benchmark, the MSCI All Country World (ex-US) Growth Index (net div), generated a return of 27.50%.
-
Global equity markets reached record levels during the period, withstanding considerable volatility amid tariffs, geopolitical conflict and high levels of uncertainty. A new geopolitical event distressed markets at the end of the period as US and Israeli forces launched strikes against Iran, disrupting Mideast oil and natural gas exports. During the period, a pro-growth tax and spending bill was signed into law in the US, while in Europe, renewed focus on defense and infrastructure spending brightened the economic outlook. In Japan, the election of a pro-growth prime minister sent stocks to new highs prior to the conflict in Iran. Optimism over artificial intelligence remained high.
-
Considerable progress was made in trade talks between the US and many major trading partners, with a fragile truce between the US and China extended through late 2026. While the US Supreme Court struck down part of the Trump administration’s tariff strategy, the administration began deploying other authorities to largely replace the ones that were ruled unconstitutional.
-
Early in the period, moderating inflation pressures allowed many global central banks to ease monetary policy. Amid a difficult policymaking environment and slower job growth, the Federal Reserve resumed easing policy in September and delivered quarter-point rate cuts in October and December before pausing.
-
In fixed income markets, previously range-bound global bond yields spiked following the onset of the Middle East conflict, as energy-driven inflation fears appeared to have rattled bond investors. US rate volatility (as measured by the Merrill Lynch Option Volatility Estimate (MOVE) Index) similarly rose from intra-period lows, reflecting uncertainty around the scope and duration of the conflict and its implications for global growth. However, volatility later retracted as the risk of a broader regional military escalation appeared less likely. Global credit spreads widened only modestly before stabilizing near prior levels, supported by strong demand and resilient underlying fundamentals.
-
Top contributors to performance relative to the MSCI All Country World (ex-US) Growth Index:
-
Security selection within the financials sector strengthened the fund's relative performance.
-
An underweight allocation to the communication services sector further benefited relative performance.
-
-
Top detractors from performance relative to the MSCI All Country World (ex-US) Growth Index:
-
Security selection and an underweight allocation to the information technology sector weakened the fund's relative performance.
-
Security selection and an overweight allocation to the consumer staples sector also hindered relative results.
-
FUND PERFORMANCE
The fund’s past performance is not a good predictor of the fund’s future performance. The graph and table below do not reflect the deduction of taxes that a shareholder would pay on fund distributions or the redemption of fund shares. The graph and table below assume reinvestment of dividends and capital gain distributions.
Growth of a Hypothetical $10,000 Investment
This graph shows the performance of a hypothetical $10,000 investment in Class R2 over a ten year period or since inception, if shorter, in comparison to (i) a broad measure of market performance and (ii) an additional index that MFS believes more closely reflects the market segments in which the fund invests.
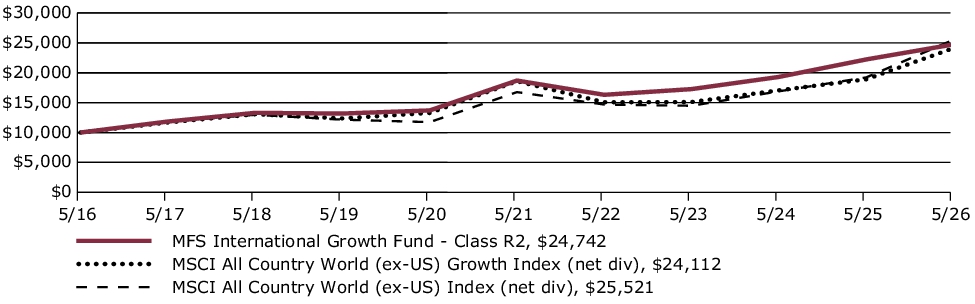
Average Annual Total Returns through 5/31/26
This table shows the average annual total returns of the class of shares noted for the periods shown, both with (if any) and without sales charges. It also shows the average annual total returns of (i) a broad measure of market performance and (ii) an additional index that MFS believes more closely reflects the market segments in which the fund invests, over the same periods.
| Share Class | 1-yr | 5-yr | 10-yr |
| R2 without sales charge | 11.32% | 5.77% | 9.48% |
| Comparative Benchmark(s) | |||
| MSCI All Country World (ex-US) Index (net div) ∆ | 32.77% | 8.77% | 9.82% |
| MSCI All Country World (ex-US) Growth Index (net div) ∆ | 27.50% | 5.35% | 9.20% |
|
∆
|
Source: FactSet Research Systems Inc.
|
Visit mfs.com/perf/r2 for more recent performance information.
FUND STATISTICS AS OF 5/31/26
| Net Assets ($): | 23,028,645,857 | Total Management Fee ($)#: | 139,387,645 | |
| Total Number of Holdings: | 85 | Portfolio Turnover Rate (%): | 16 |
# Includes the effect of any management fee waivers, if applicable.
Where the fund holds derivatives, they are not included in the total number of portfolio holdings.
PORTFOLIO COMPOSITION (BASED ON TOTAL INVESTMENTS AS OF 5/31/26)
Portfolio structure
| Equities | 98.5% |
| Money Market Funds | 1.5% |
Top ten holdings
| Taiwan Semiconductor Manufacturing Co. Ltd. | 7.3% |
| Schneider Electric SE | 4.0% |
| Resonac Holdings Corp. | 3.7% |
| SAP SE | 3.2% |
| Nestle S.A. | 3.0% |
| Delta Electronics, Inc. | 2.9% |
| AstraZeneca PLC | 2.8% |
| AIA Group Ltd. | 2.7% |
| Rolls-Royce Holdings PLC | 2.4% |
| Agnico Eagle Mines Ltd. | 2.4% |
Issuer country weightings
| Taiwan | 11.6% |
| Japan | 11.4% |
| United Kingdom | 11.0% |
| France | 10.9% |
| Germany | 8.6% |
| Canada | 7.3% |
| Switzerland | 7.0% |
| Netherlands | 4.3% |
| United States | 4.2% |
| Other Countries | 23.7% |
Top ten holdings
| Taiwan Semiconductor Manufacturing Co. Ltd. | 7.3% |
| Schneider Electric SE | 4.0% |
| Resonac Holdings Corp. | 3.7% |
| SAP SE | 3.2% |
| Nestle S.A. | 3.0% |
| Delta Electronics, Inc. | 2.9% |
| AstraZeneca PLC | 2.8% |
| AIA Group Ltd. | 2.7% |
| Rolls-Royce Holdings PLC | 2.4% |
| Agnico Eagle Mines Ltd. | 2.4% |
FUND EXPENSES
What were the fund costs for the last year?
| (based on a hypothetical $10,000 investment) | ||
| Class Name | Costs of a $10,000 investment | Costs paid as a percentage of a $10,000 investment |
| R1 | $188 | 1.78% |
MANAGEMENT'S DISCUSSION OF FUND PERFORMANCE
-
For the twelve months ended May 31, 2026, Class R1 shares of the MFS International Growth Fund (fund) provided a total return of 10.75%, at net asset value. This compares with a return of 32.77% for the fund’s benchmark, the MSCI All Country World (ex-US) Index (net div). The fund's other benchmark, the MSCI All Country World (ex-US) Growth Index (net div), generated a return of 27.50%.
-
Global equity markets reached record levels during the period, withstanding considerable volatility amid tariffs, geopolitical conflict and high levels of uncertainty. A new geopolitical event distressed markets at the end of the period as US and Israeli forces launched strikes against Iran, disrupting Mideast oil and natural gas exports. During the period, a pro-growth tax and spending bill was signed into law in the US, while in Europe, renewed focus on defense and infrastructure spending brightened the economic outlook. In Japan, the election of a pro-growth prime minister sent stocks to new highs prior to the conflict in Iran. Optimism over artificial intelligence remained high.
-
Considerable progress was made in trade talks between the US and many major trading partners, with a fragile truce between the US and China extended through late 2026. While the US Supreme Court struck down part of the Trump administration’s tariff strategy, the administration began deploying other authorities to largely replace the ones that were ruled unconstitutional.
-
Early in the period, moderating inflation pressures allowed many global central banks to ease monetary policy. Amid a difficult policymaking environment and slower job growth, the Federal Reserve resumed easing policy in September and delivered quarter-point rate cuts in October and December before pausing.
-
In fixed income markets, previously range-bound global bond yields spiked following the onset of the Middle East conflict, as energy-driven inflation fears appeared to have rattled bond investors. US rate volatility (as measured by the Merrill Lynch Option Volatility Estimate (MOVE) Index) similarly rose from intra-period lows, reflecting uncertainty around the scope and duration of the conflict and its implications for global growth. However, volatility later retracted as the risk of a broader regional military escalation appeared less likely. Global credit spreads widened only modestly before stabilizing near prior levels, supported by strong demand and resilient underlying fundamentals.
-
Top contributors to performance relative to the MSCI All Country World (ex-US) Growth Index:
-
Security selection within the financials sector strengthened the fund's relative performance.
-
An underweight allocation to the communication services sector further benefited relative performance.
-
-
Top detractors from performance relative to the MSCI All Country World (ex-US) Growth Index:
-
Security selection and an underweight allocation to the information technology sector weakened the fund's relative performance.
-
Security selection and an overweight allocation to the consumer staples sector also hindered relative results.
-
FUND PERFORMANCE
The fund’s past performance is not a good predictor of the fund’s future performance. The graph and table below do not reflect the deduction of taxes that a shareholder would pay on fund distributions or the redemption of fund shares. The graph and table below assume reinvestment of dividends and capital gain distributions.
Growth of a Hypothetical $10,000 Investment
This graph shows the performance of a hypothetical $10,000 investment in Class R1 over a ten year period or since inception, if shorter, in comparison to (i) a broad measure of market performance and (ii) an additional index that MFS believes more closely reflects the market segments in which the fund invests.
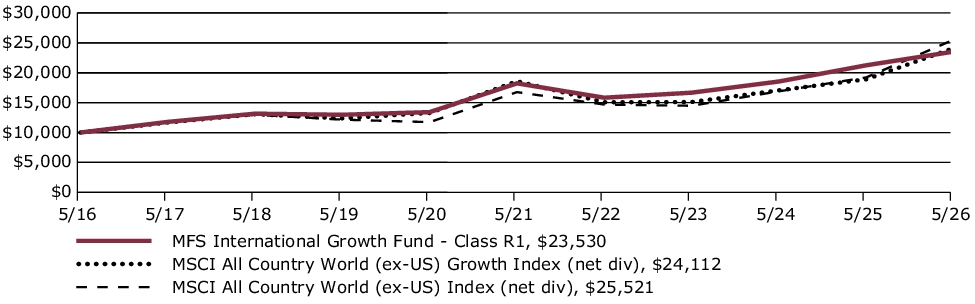
Average Annual Total Returns through 5/31/26
This table shows the average annual total returns of the class of shares noted for the periods shown, both with (if any) and without sales charges. It also shows the average annual total returns of (i) a broad measure of market performance and (ii) an additional index that MFS believes more closely reflects the market segments in which the fund invests, over the same periods.
| Share Class | 1-yr | 5-yr | 10-yr |
| R1 without sales charge | 10.75% | 5.24% | 8.93% |
| Comparative Benchmark(s) | |||
| MSCI All Country World (ex-US) Index (net div) ∆ | 32.77% | 8.77% | 9.82% |
| MSCI All Country World (ex-US) Growth Index (net div) ∆ | 27.50% | 5.35% | 9.20% |
|
∆
|
Source: FactSet Research Systems Inc.
|
Visit mfs.com/perf/r1 for more recent performance information.
FUND STATISTICS AS OF 5/31/26
| Net Assets ($): | 23,028,645,857 | Total Management Fee ($)#: | 139,387,645 | |
| Total Number of Holdings: | 85 | Portfolio Turnover Rate (%): | 16 |
# Includes the effect of any management fee waivers, if applicable.
Where the fund holds derivatives, they are not included in the total number of portfolio holdings.
PORTFOLIO COMPOSITION (BASED ON TOTAL INVESTMENTS AS OF 5/31/26)
Portfolio structure
| Equities | 98.5% |
| Money Market Funds | 1.5% |
Top ten holdings
| Taiwan Semiconductor Manufacturing Co. Ltd. | 7.3% |
| Schneider Electric SE | 4.0% |
| Resonac Holdings Corp. | 3.7% |
| SAP SE | 3.2% |
| Nestle S.A. | 3.0% |
| Delta Electronics, Inc. | 2.9% |
| AstraZeneca PLC | 2.8% |
| AIA Group Ltd. | 2.7% |
| Rolls-Royce Holdings PLC | 2.4% |
| Agnico Eagle Mines Ltd. | 2.4% |
Issuer country weightings
| Taiwan | 11.6% |
| Japan | 11.4% |
| United Kingdom | 11.0% |
| France | 10.9% |
| Germany | 8.6% |
| Canada | 7.3% |
| Switzerland | 7.0% |
| Netherlands | 4.3% |
| United States | 4.2% |
| Other Countries | 23.7% |
Top ten holdings
| Taiwan Semiconductor Manufacturing Co. Ltd. | 7.3% |
| Schneider Electric SE | 4.0% |
| Resonac Holdings Corp. | 3.7% |
| SAP SE | 3.2% |
| Nestle S.A. | 3.0% |
| Delta Electronics, Inc. | 2.9% |
| AstraZeneca PLC | 2.8% |
| AIA Group Ltd. | 2.7% |
| Rolls-Royce Holdings PLC | 2.4% |
| Agnico Eagle Mines Ltd. | 2.4% |
FUND EXPENSES
What were the fund costs for the last year?
| (based on a hypothetical $10,000 investment) | ||
| Class Name | Costs of a $10,000 investment | Costs paid as a percentage of a $10,000 investment |
| I | $83 | 0.78% |
MANAGEMENT'S DISCUSSION OF FUND PERFORMANCE
-
For the twelve months ended May 31, 2026, Class I shares of the MFS International Growth Fund (fund) provided a total return of 11.85%, at net asset value. This compares with a return of 32.77% for the fund’s benchmark, the MSCI All Country World (ex-US) Index (net div). The fund's other benchmark, the MSCI All Country World (ex-US) Growth Index (net div), generated a return of 27.50%.
-
Global equity markets reached record levels during the period, withstanding considerable volatility amid tariffs, geopolitical conflict and high levels of uncertainty. A new geopolitical event distressed markets at the end of the period as US and Israeli forces launched strikes against Iran, disrupting Mideast oil and natural gas exports. During the period, a pro-growth tax and spending bill was signed into law in the US, while in Europe, renewed focus on defense and infrastructure spending brightened the economic outlook. In Japan, the election of a pro-growth prime minister sent stocks to new highs prior to the conflict in Iran. Optimism over artificial intelligence remained high.
-
Considerable progress was made in trade talks between the US and many major trading partners, with a fragile truce between the US and China extended through late 2026. While the US Supreme Court struck down part of the Trump administration’s tariff strategy, the administration began deploying other authorities to largely replace the ones that were ruled unconstitutional.
-
Early in the period, moderating inflation pressures allowed many global central banks to ease monetary policy. Amid a difficult policymaking environment and slower job growth, the Federal Reserve resumed easing policy in September and delivered quarter-point rate cuts in October and December before pausing.
-
In fixed income markets, previously range-bound global bond yields spiked following the onset of the Middle East conflict, as energy-driven inflation fears appeared to have rattled bond investors. US rate volatility (as measured by the Merrill Lynch Option Volatility Estimate (MOVE) Index) similarly rose from intra-period lows, reflecting uncertainty around the scope and duration of the conflict and its implications for global growth. However, volatility later retracted as the risk of a broader regional military escalation appeared less likely. Global credit spreads widened only modestly before stabilizing near prior levels, supported by strong demand and resilient underlying fundamentals.
-
Top contributors to performance relative to the MSCI All Country World (ex-US) Growth Index:
-
Security selection within the financials sector strengthened the fund's relative performance.
-
An underweight allocation to the communication services sector further benefited relative performance.
-
-
Top detractors from performance relative to the MSCI All Country World (ex-US) Growth Index:
-
Security selection and an underweight allocation to the information technology sector weakened the fund's relative performance.
-
Security selection and an overweight allocation to the consumer staples sector also hindered relative results.
-
FUND PERFORMANCE
The fund’s past performance is not a good predictor of the fund’s future performance. The graph and table below do not reflect the deduction of taxes that a shareholder would pay on fund distributions or the redemption of fund shares. The graph and table below assume reinvestment of dividends and capital gain distributions.
Growth of a Hypothetical $10,000 Investment
This graph shows the performance of a hypothetical $10,000 investment in Class I over a ten year period or since inception, if shorter, in comparison to (i) a broad measure of market performance and (ii) an additional index that MFS believes more closely reflects the market segments in which the fund invests.
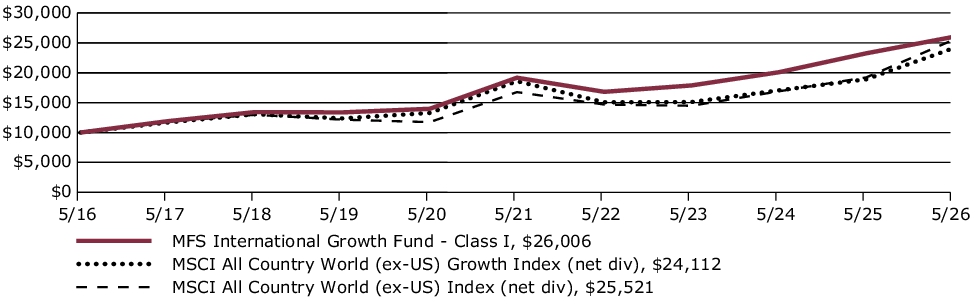
Average Annual Total Returns through 5/31/26
This table shows the average annual total returns of the class of shares noted for the periods shown, both with (if any) and without sales charges. It also shows the average annual total returns of (i) a broad measure of market performance and (ii) an additional index that MFS believes more closely reflects the market segments in which the fund invests, over the same periods.
| Share Class | 1-yr | 5-yr | 10-yr |
| I without sales charge | 11.85% | 6.29% | 10.03% |
| Comparative Benchmark(s) | |||
| MSCI All Country World (ex-US) Index (net div) ∆ | 32.77% | 8.77% | 9.82% |
| MSCI All Country World (ex-US) Growth Index (net div) ∆ | 27.50% | 5.35% | 9.20% |
|
∆
|
Source: FactSet Research Systems Inc.
|
Visit mfs.com/perf/i for more recent performance information.
FUND STATISTICS AS OF 5/31/26
| Net Assets ($): | 23,028,645,857 | Total Management Fee ($)#: | 139,387,645 | |
| Total Number of Holdings: | 85 | Portfolio Turnover Rate (%): | 16 |
# Includes the effect of any management fee waivers, if applicable.
Where the fund holds derivatives, they are not included in the total number of portfolio holdings.
PORTFOLIO COMPOSITION (BASED ON TOTAL INVESTMENTS AS OF 5/31/26)
Portfolio structure
| Equities | 98.5% |
| Money Market Funds | 1.5% |
Top ten holdings
| Taiwan Semiconductor Manufacturing Co. Ltd. | 7.3% |
| Schneider Electric SE | 4.0% |
| Resonac Holdings Corp. | 3.7% |
| SAP SE | 3.2% |
| Nestle S.A. | 3.0% |
| Delta Electronics, Inc. | 2.9% |
| AstraZeneca PLC | 2.8% |
| AIA Group Ltd. | 2.7% |
| Rolls-Royce Holdings PLC | 2.4% |
| Agnico Eagle Mines Ltd. | 2.4% |
Issuer country weightings
| Taiwan | 11.6% |
| Japan | 11.4% |
| United Kingdom | 11.0% |
| France | 10.9% |
| Germany | 8.6% |
| Canada | 7.3% |
| Switzerland | 7.0% |
| Netherlands | 4.3% |
| United States | 4.2% |
| Other Countries | 23.7% |
Top ten holdings
| Taiwan Semiconductor Manufacturing Co. Ltd. | 7.3% |
| Schneider Electric SE | 4.0% |
| Resonac Holdings Corp. | 3.7% |
| SAP SE | 3.2% |
| Nestle S.A. | 3.0% |
| Delta Electronics, Inc. | 2.9% |
| AstraZeneca PLC | 2.8% |
| AIA Group Ltd. | 2.7% |
| Rolls-Royce Holdings PLC | 2.4% |
| Agnico Eagle Mines Ltd. | 2.4% |
FUND EXPENSES
What were the fund costs for the last year?
| (based on a hypothetical $10,000 investment) | ||
| Class Name | Costs of a $10,000 investment | Costs paid as a percentage of a $10,000 investment |
| C | $188 | 1.78% |
MANAGEMENT'S DISCUSSION OF FUND PERFORMANCE
-
For the twelve months ended May 31, 2026, Class C shares of the MFS International Growth Fund (fund) provided a total return of 10.73%, at net asset value. This compares with a return of 32.77% for the fund’s benchmark, the MSCI All Country World (ex-US) Index (net div). The fund's other benchmark, the MSCI All Country World (ex-US) Growth Index (net div), generated a return of 27.50%.
-
Global equity markets reached record levels during the period, withstanding considerable volatility amid tariffs, geopolitical conflict and high levels of uncertainty. A new geopolitical event distressed markets at the end of the period as US and Israeli forces launched strikes against Iran, disrupting Mideast oil and natural gas exports. During the period, a pro-growth tax and spending bill was signed into law in the US, while in Europe, renewed focus on defense and infrastructure spending brightened the economic outlook. In Japan, the election of a pro-growth prime minister sent stocks to new highs prior to the conflict in Iran. Optimism over artificial intelligence remained high.
-
Considerable progress was made in trade talks between the US and many major trading partners, with a fragile truce between the US and China extended through late 2026. While the US Supreme Court struck down part of the Trump administration’s tariff strategy, the administration began deploying other authorities to largely replace the ones that were ruled unconstitutional.
-
Early in the period, moderating inflation pressures allowed many global central banks to ease monetary policy. Amid a difficult policymaking environment and slower job growth, the Federal Reserve resumed easing policy in September and delivered quarter-point rate cuts in October and December before pausing.
-
In fixed income markets, previously range-bound global bond yields spiked following the onset of the Middle East conflict, as energy-driven inflation fears appeared to have rattled bond investors. US rate volatility (as measured by the Merrill Lynch Option Volatility Estimate (MOVE) Index) similarly rose from intra-period lows, reflecting uncertainty around the scope and duration of the conflict and its implications for global growth. However, volatility later retracted as the risk of a broader regional military escalation appeared less likely. Global credit spreads widened only modestly before stabilizing near prior levels, supported by strong demand and resilient underlying fundamentals.
-
Top contributors to performance relative to the MSCI All Country World (ex-US) Growth Index:
-
Security selection within the financials sector strengthened the fund's relative performance.
-
An underweight allocation to the communication services sector further benefited relative performance.
-
-
Top detractors from performance relative to the MSCI All Country World (ex-US) Growth Index:
-
Security selection and an underweight allocation to the information technology sector weakened the fund's relative performance.
-
Security selection and an overweight allocation to the consumer staples sector also hindered relative results.
-
FUND PERFORMANCE
The fund’s past performance is not a good predictor of the fund’s future performance. The graph and table below do not reflect the deduction of taxes that a shareholder would pay on fund distributions or the redemption of fund shares. The graph and table below assume reinvestment of dividends and capital gain distributions.
Growth of a Hypothetical $10,000 Investment
This graph shows the performance of a hypothetical $10,000 investment in Class C over a ten year period or since inception, if shorter, in comparison to (i) a broad measure of market performance and (ii) an additional index that MFS believes more closely reflects the market segments in which the fund invests.
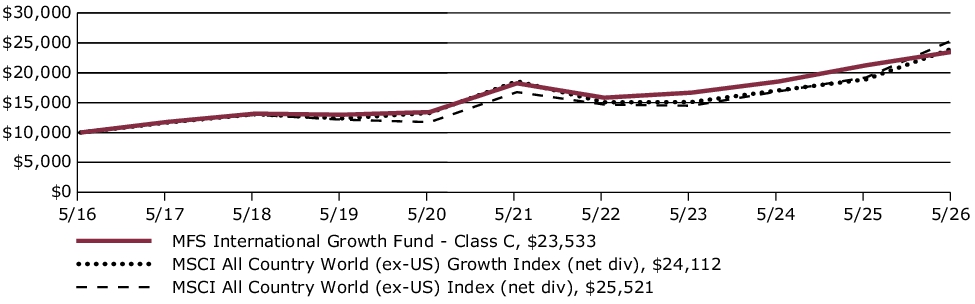
Average Annual Total Returns through 5/31/26
This table shows the average annual total returns of the class of shares noted for the periods shown, both with (if any) and without sales charges. It also shows the average annual total returns of (i) a broad measure of market performance and (ii) an additional index that MFS believes more closely reflects the market segments in which the fund invests, over the same periods.
| Share Class | 1-yr | 5-yr | 10-yr |
| C without sales charge | 10.73% | 5.23% | 8.94% |
| C with CDSC (1% for 12 months)× | 9.73% | 5.23% | 8.94% |
| Comparative Benchmark(s) | |||
| MSCI All Country World (ex-US) Index (net div) ∆ | 32.77% | 8.77% | 9.82% |
| MSCI All Country World (ex-US) Growth Index (net div) ∆ | 27.50% | 5.35% | 9.20% |
|
∆
|
Source: FactSet Research Systems Inc.
|
|
×
|
Assuming redemption at the end of the applicable period.
|
Visit mfs.com/perf/c for more recent performance information.
FUND STATISTICS AS OF 5/31/26
| Net Assets ($): | 23,028,645,857 | Total Management Fee ($)#: | 139,387,645 | |
| Total Number of Holdings: | 85 | Portfolio Turnover Rate (%): | 16 |
# Includes the effect of any management fee waivers, if applicable.
Where the fund holds derivatives, they are not included in the total number of portfolio holdings.
PORTFOLIO COMPOSITION (BASED ON TOTAL INVESTMENTS AS OF 5/31/26)
Portfolio structure
| Equities | 98.5% |
| Money Market Funds | 1.5% |
Top ten holdings
| Taiwan Semiconductor Manufacturing Co. Ltd. | 7.3% |
| Schneider Electric SE | 4.0% |
| Resonac Holdings Corp. | 3.7% |
| SAP SE | 3.2% |
| Nestle S.A. | 3.0% |
| Delta Electronics, Inc. | 2.9% |
| AstraZeneca PLC | 2.8% |
| AIA Group Ltd. | 2.7% |
| Rolls-Royce Holdings PLC | 2.4% |
| Agnico Eagle Mines Ltd. | 2.4% |
Issuer country weightings
| Taiwan | 11.6% |
| Japan | 11.4% |
| United Kingdom | 11.0% |
| France | 10.9% |
| Germany | 8.6% |
| Canada | 7.3% |
| Switzerland | 7.0% |
| Netherlands | 4.3% |
| United States | 4.2% |
| Other Countries | 23.7% |
Top ten holdings
| Taiwan Semiconductor Manufacturing Co. Ltd. | 7.3% |
| Schneider Electric SE | 4.0% |
| Resonac Holdings Corp. | 3.7% |
| SAP SE | 3.2% |
| Nestle S.A. | 3.0% |
| Delta Electronics, Inc. | 2.9% |
| AstraZeneca PLC | 2.8% |
| AIA Group Ltd. | 2.7% |
| Rolls-Royce Holdings PLC | 2.4% |
| Agnico Eagle Mines Ltd. | 2.4% |
FUND EXPENSES
What were the fund costs for the last year?
| (based on a hypothetical $10,000 investment) | ||
| Class Name | Costs of a $10,000 investment | Costs paid as a percentage of a $10,000 investment |
| B | $188 | 1.78% |
MANAGEMENT'S DISCUSSION OF FUND PERFORMANCE
-
For the twelve months ended May 31, 2026, Class B shares of the MFS International Growth Fund (fund) provided a total return of 10.74%, at net asset value. This compares with a return of 32.77% for the fund’s benchmark, the MSCI All Country World (ex-US) Index (net div). The fund's other benchmark, the MSCI All Country World (ex-US) Growth Index (net div), generated a return of 27.50%.
-
Global equity markets reached record levels during the period, withstanding considerable volatility amid tariffs, geopolitical conflict and high levels of uncertainty. A new geopolitical event distressed markets at the end of the period as US and Israeli forces launched strikes against Iran, disrupting Mideast oil and natural gas exports. During the period, a pro-growth tax and spending bill was signed into law in the US, while in Europe, renewed focus on defense and infrastructure spending brightened the economic outlook. In Japan, the election of a pro-growth prime minister sent stocks to new highs prior to the conflict in Iran. Optimism over artificial intelligence remained high.
-
Considerable progress was made in trade talks between the US and many major trading partners, with a fragile truce between the US and China extended through late 2026. While the US Supreme Court struck down part of the Trump administration’s tariff strategy, the administration began deploying other authorities to largely replace the ones that were ruled unconstitutional.
-
Early in the period, moderating inflation pressures allowed many global central banks to ease monetary policy. Amid a difficult policymaking environment and slower job growth, the Federal Reserve resumed easing policy in September and delivered quarter-point rate cuts in October and December before pausing.
-
In fixed income markets, previously range-bound global bond yields spiked following the onset of the Middle East conflict, as energy-driven inflation fears appeared to have rattled bond investors. US rate volatility (as measured by the Merrill Lynch Option Volatility Estimate (MOVE) Index) similarly rose from intra-period lows, reflecting uncertainty around the scope and duration of the conflict and its implications for global growth. However, volatility later retracted as the risk of a broader regional military escalation appeared less likely. Global credit spreads widened only modestly before stabilizing near prior levels, supported by strong demand and resilient underlying fundamentals.
-
Top contributors to performance relative to the MSCI All Country World (ex-US) Growth Index:
-
Security selection within the financials sector strengthened the fund's relative performance.
-
An underweight allocation to the communication services sector further benefited relative performance.
-
-
Top detractors from performance relative to the MSCI All Country World (ex-US) Growth Index:
-
Security selection and an underweight allocation to the information technology sector weakened the fund's relative performance.
-
Security selection and an overweight allocation to the consumer staples sector also hindered relative results.
-
FUND PERFORMANCE
The fund’s past performance is not a good predictor of the fund’s future performance. The graph and table below do not reflect the deduction of taxes that a shareholder would pay on fund distributions or the redemption of fund shares. The graph and table below assume reinvestment of dividends and capital gain distributions.
Growth of a Hypothetical $10,000 Investment
This graph shows the performance of a hypothetical $10,000 investment in Class B over a ten year period or since inception, if shorter, in comparison to (i) a broad measure of market performance and (ii) an additional index that MFS believes more closely reflects the market segments in which the fund invests.
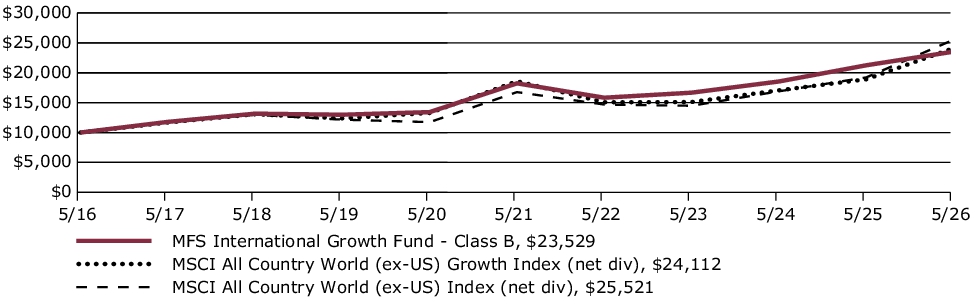
Average Annual Total Returns through 5/31/26
This table shows the average annual total returns of the class of shares noted for the periods shown, both with (if any) and without sales charges. It also shows the average annual total returns of (i) a broad measure of market performance and (ii) an additional index that MFS believes more closely reflects the market segments in which the fund invests, over the same periods.
| Share Class | 1-yr | 5-yr | 10-yr |
| B without sales charge | 10.74% | 5.24% | 8.93% |
| B with CDSC (declining over six years from 4% to 0%)x | 6.74% | 4.91% | 8.93% |
| Comparative Benchmark(s) | |||
| MSCI All Country World (ex-US) Index (net div) ∆ | 32.77% | 8.77% | 9.82% |
| MSCI All Country World (ex-US) Growth Index (net div) ∆ | 27.50% | 5.35% | 9.20% |
|
∆
|
Source: FactSet Research Systems Inc.
|
|
×
|
Assuming redemption at the end of the applicable period.
|
Visit mfs.com/perf/b for more recent performance information.
FUND STATISTICS AS OF 5/31/26
| Net Assets ($): | 23,028,645,857 | Total Management Fee ($)#: | 139,387,645 | |
| Total Number of Holdings: | 85 | Portfolio Turnover Rate (%): | 16 |
# Includes the effect of any management fee waivers, if applicable.
Where the fund holds derivatives, they are not included in the total number of portfolio holdings.
PORTFOLIO COMPOSITION (BASED ON TOTAL INVESTMENTS AS OF 5/31/26)
Portfolio structure
| Equities | 98.5% |
| Money Market Funds | 1.5% |
Top ten holdings
| Taiwan Semiconductor Manufacturing Co. Ltd. | 7.3% |
| Schneider Electric SE | 4.0% |
| Resonac Holdings Corp. | 3.7% |
| SAP SE | 3.2% |
| Nestle S.A. | 3.0% |
| Delta Electronics, Inc. | 2.9% |
| AstraZeneca PLC | 2.8% |
| AIA Group Ltd. | 2.7% |
| Rolls-Royce Holdings PLC | 2.4% |
| Agnico Eagle Mines Ltd. | 2.4% |
Issuer country weightings
| Taiwan | 11.6% |
| Japan | 11.4% |
| United Kingdom | 11.0% |
| France | 10.9% |
| Germany | 8.6% |
| Canada | 7.3% |
| Switzerland | 7.0% |
| Netherlands | 4.3% |
| United States | 4.2% |
| Other Countries | 23.7% |
Top ten holdings
| Taiwan Semiconductor Manufacturing Co. Ltd. | 7.3% |
| Schneider Electric SE | 4.0% |
| Resonac Holdings Corp. | 3.7% |
| SAP SE | 3.2% |
| Nestle S.A. | 3.0% |
| Delta Electronics, Inc. | 2.9% |
| AstraZeneca PLC | 2.8% |
| AIA Group Ltd. | 2.7% |
| Rolls-Royce Holdings PLC | 2.4% |
| Agnico Eagle Mines Ltd. | 2.4% |
FUND EXPENSES
What were the fund costs for the last year?
| (based on a hypothetical $10,000 investment) | ||
| Class Name | Costs of a $10,000 investment | Costs paid as a percentage of a $10,000 investment |
| A | $109 | 1.03% |
MANAGEMENT'S DISCUSSION OF FUND PERFORMANCE
-
For the twelve months ended May 31, 2026, Class A shares of the MFS International Growth Fund (fund) provided a total return of 11.57%, at net asset value. This compares with a return of 32.77% for the fund’s benchmark, the MSCI All Country World (ex-US) Index (net div). The fund's other benchmark, the MSCI All Country World (ex-US) Growth Index (net div), generated a return of 27.50%.
-
Global equity markets reached record levels during the period, withstanding considerable volatility amid tariffs, geopolitical conflict and high levels of uncertainty. A new geopolitical event distressed markets at the end of the period as US and Israeli forces launched strikes against Iran, disrupting Mideast oil and natural gas exports. During the period, a pro-growth tax and spending bill was signed into law in the US, while in Europe, renewed focus on defense and infrastructure spending brightened the economic outlook. In Japan, the election of a pro-growth prime minister sent stocks to new highs prior to the conflict in Iran. Optimism over artificial intelligence remained high.
-
Considerable progress was made in trade talks between the US and many major trading partners, with a fragile truce between the US and China extended through late 2026. While the US Supreme Court struck down part of the Trump administration’s tariff strategy, the administration began deploying other authorities to largely replace the ones that were ruled unconstitutional.
-
Early in the period, moderating inflation pressures allowed many global central banks to ease monetary policy. Amid a difficult policymaking environment and slower job growth, the Federal Reserve resumed easing policy in September and delivered quarter-point rate cuts in October and December before pausing.
-
In fixed income markets, previously range-bound global bond yields spiked following the onset of the Middle East conflict, as energy-driven inflation fears appeared to have rattled bond investors. US rate volatility (as measured by the Merrill Lynch Option Volatility Estimate (MOVE) Index) similarly rose from intra-period lows, reflecting uncertainty around the scope and duration of the conflict and its implications for global growth. However, volatility later retracted as the risk of a broader regional military escalation appeared less likely. Global credit spreads widened only modestly before stabilizing near prior levels, supported by strong demand and resilient underlying fundamentals.
-
Top contributors to performance relative to the MSCI All Country World (ex-US) Growth Index:
-
Security selection within the financials sector strengthened the fund's relative performance.
-
An underweight allocation to the communication services sector further benefited relative performance.
-
-
Top detractors from performance relative to the MSCI All Country World (ex-US) Growth Index:
-
Security selection and an underweight allocation to the information technology sector weakened the fund's relative performance.
-
Security selection and an overweight allocation to the consumer staples sector also hindered relative results.
-
FUND PERFORMANCE
The fund’s past performance is not a good predictor of the fund’s future performance. The graph and table below do not reflect the deduction of taxes that a shareholder would pay on fund distributions or the redemption of fund shares. The graph and table below assume reinvestment of dividends and capital gain distributions.
Growth of a Hypothetical $10,000 Investment
This graph shows the performance of a hypothetical $10,000 investment in Class A over a ten year period or since inception, if shorter, in comparison to (i) a broad measure of market performance and (ii) an additional index that MFS believes more closely reflects the market segments in which the fund invests. This graph includes the deduction of the maximum applicable sales charge.
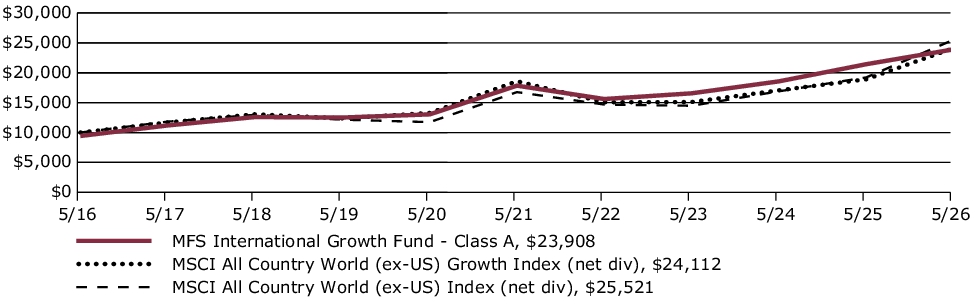
Average Annual Total Returns through 5/31/26
This table shows the average annual total returns of the class of shares noted for the periods shown, both with (if any) and without sales charges. It also shows the average annual total returns of (i) a broad measure of market performance and (ii) an additional index that MFS believes more closely reflects the market segments in which the fund invests, over the same periods.
| Share Class | 1-yr | 5-yr | 10-yr |
| A without sales charge | 11.57% | 6.03% | 9.76% |
| A with initial sales charge (5.75%) | 5.16% | 4.78% | 9.11% |
| Comparative Benchmark(s) | |||
| MSCI All Country World (ex-US) Index (net div) ∆ | 32.77% | 8.77% | 9.82% |
| MSCI All Country World (ex-US) Growth Index (net div) ∆ | 27.50% | 5.35% | 9.20% |
|
∆
|
Source: FactSet Research Systems Inc.
|
Visit mfs.com/perf/a for more recent performance information.
FUND STATISTICS AS OF 5/31/26
| Net Assets ($): | 23,028,645,857 | Total Management Fee ($)#: | 139,387,645 | |
| Total Number of Holdings: | 85 | Portfolio Turnover Rate (%): | 16 |
# Includes the effect of any management fee waivers, if applicable.
Where the fund holds derivatives, they are not included in the total number of portfolio holdings.
PORTFOLIO COMPOSITION (BASED ON TOTAL INVESTMENTS AS OF 5/31/26)
Portfolio structure
| Equities | 98.5% |
| Money Market Funds | 1.5% |
Top ten holdings
| Taiwan Semiconductor Manufacturing Co. Ltd. | 7.3% |
| Schneider Electric SE | 4.0% |
| Resonac Holdings Corp. | 3.7% |
| SAP SE | 3.2% |
| Nestle S.A. | 3.0% |
| Delta Electronics, Inc. | 2.9% |
| AstraZeneca PLC | 2.8% |
| AIA Group Ltd. | 2.7% |
| Rolls-Royce Holdings PLC | 2.4% |
| Agnico Eagle Mines Ltd. | 2.4% |
Issuer country weightings
| Taiwan | 11.6% |
| Japan | 11.4% |
| United Kingdom | 11.0% |
| France | 10.9% |
| Germany | 8.6% |
| Canada | 7.3% |
| Switzerland | 7.0% |
| Netherlands | 4.3% |
| United States | 4.2% |
| Other Countries | 23.7% |
Top ten holdings
| Taiwan Semiconductor Manufacturing Co. Ltd. | 7.3% |
| Schneider Electric SE | 4.0% |
| Resonac Holdings Corp. | 3.7% |
| SAP SE | 3.2% |
| Nestle S.A. | 3.0% |
| Delta Electronics, Inc. | 2.9% |
| AstraZeneca PLC | 2.8% |
| AIA Group Ltd. | 2.7% |
| Rolls-Royce Holdings PLC | 2.4% |
| Agnico Eagle Mines Ltd. | 2.4% |
This report describes certain changes to the Fund that occurred during the reporting period.
FUND EXPENSES
What were the fund costs for the last year?
| (based on a hypothetical $10,000 investment) | ||
| Class Name | Costs of a $10,000 investment | Costs paid as a percentage of a $10,000 investment |
| A | $110 | 0.99% |
MANAGEMENT'S DISCUSSION OF FUND PERFORMANCE
-
For the twelve months ended May 31, 2026, Class A shares of the MFS International Intrinsic Equity Fund (fund) provided a total return of 21.44%, at net asset value. This compares with a return of 22.80% for the fund’s benchmark, the MSCI EAFE (Europe, Australasia, Far East) Index (net div).
-
Global equity markets reached record levels during the period, withstanding considerable volatility amid tariffs, geopolitical conflict and high levels of uncertainty. A new geopolitical event distressed markets at the end of the period as US and Israeli forces launched strikes against Iran, disrupting Mideast oil and natural gas exports. During the period, a pro-growth tax and spending bill was signed into law in the US, while in Europe, renewed focus on defense and infrastructure spending brightened the economic outlook. In Japan, the election of a pro-growth prime minister sent stocks to new highs prior to the conflict in Iran. Optimism over artificial intelligence remained high.
-
Considerable progress was made in trade talks between the US and many major trading partners, with a fragile truce between the US and China extended through late 2026. While the US Supreme Court struck down part of the Trump administration’s tariff strategy, the administration began deploying other authorities to largely replace the ones that were ruled unconstitutional.
-
Early in the period, moderating inflation pressures allowed many global central banks to ease monetary policy. Amid a difficult policymaking environment and slower job growth, the Federal Reserve resumed easing policy in September and delivered quarter-point rate cuts in October and December before pausing.
-
In fixed income markets, previously range-bound global bond yields spiked following the onset of the Middle East conflict, as energy-driven inflation fears appeared to have rattled bond investors. US rate volatility (as measured by the Merrill Lynch Option Volatility Estimate (MOVE) Index) similarly rose from intra-period lows, reflecting uncertainty around the scope and duration of the conflict and its implications for global growth. However, volatility later retracted as the risk of a broader regional military escalation appeared less likely. Global credit spreads widened only modestly before stabilizing near prior levels, supported by strong demand and resilient underlying fundamentals.
-
Top contributors to performance relative to the MSCI EAFE Index:
-
The fund's underweight allocation to the consumer discretionary sector strengthened relative performance.
-
An overweight allocation and security selection within the energy sector also benefited relative performance. Additionally, an overweight allocation to the materials sector further supported relative results.
-
-
Top detractors from performance relative to the MSCI EAFE Index:
-
Security selection within the consumer staples, industrials, and information technology sectors weakened relative performance.
-
The fund’s cash and/or cash equivalents position also held back relative performance.
-
FUND PERFORMANCE
The fund’s past performance is not a good predictor of the fund’s future performance. The graph and table below do not reflect the deduction of taxes that a shareholder would pay on fund distributions or the redemption of fund shares. The graph and table below assume reinvestment of dividends and capital gain distributions.
Growth of a Hypothetical $10,000 Investment
This graph shows the performance of a hypothetical $10,000 investment in Class A over a ten year period or since inception, if shorter, in comparison to a broad measure of market performance. This graph includes the deduction of the maximum applicable sales charge.
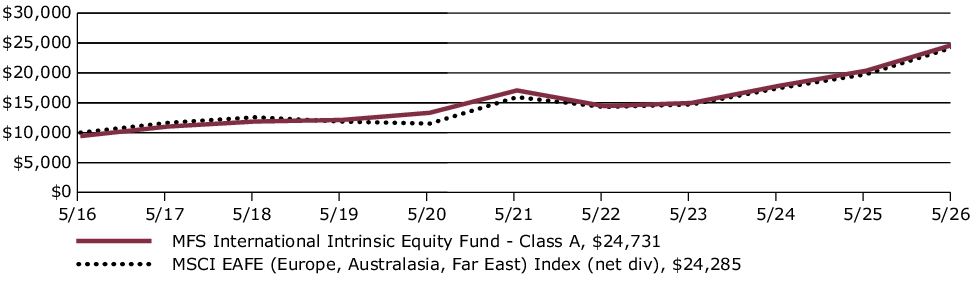
Average Annual Total Returns through 5/31/26
This table shows the average annual total returns of the class of shares noted for the periods shown, both with (if any) and without sales charges. It also shows the average annual total returns of a broad measure of market performance over the same periods.
| Share Class | 1-yr | 5-yr | 10-yr |
| A without sales charge | 21.44% | 7.71% | 10.13% |
| A with initial sales charge (5.75%) | 14.46% | 6.44% | 9.48% |
| Comparative Benchmark(s) | |||
| MSCI EAFE (Europe, Australasia, Far East) Index (net div) ∆ | 22.80% | 8.79% | 9.28% |
|
∆
|
Source: FactSet Research Systems Inc.
|
Visit mfs.com/perf/a for more recent performance information.
FUND STATISTICS AS OF 5/31/26
| Net Assets ($): | 24,946,587,541 | Total Management Fee ($)#: | 150,428,012 | |
| Total Number of Holdings: | 93 | Portfolio Turnover Rate (%): | 21 |
# Includes the effect of any management fee waivers, if applicable.
Where the fund holds derivatives, they are not included in the total number of portfolio holdings.
PORTFOLIO COMPOSITION (BASED ON TOTAL INVESTMENTS AS OF 5/31/26)
Portfolio structure
| Equities | 96.5% |
| Money Market Funds | 3.5% |
Top ten holdings
| Taiwan Semiconductor Manufacturing Co. Ltd., ADR | 3.8% |
| Franco-Nevada Corp. | 3.5% |
| Schneider Electric SE | 3.1% |
| Legrand S.A. | 3.0% |
| TotalEnergies SE | 2.8% |
| Deutsche Boerse AG | 2.4% |
| Wheaton Precious Metals Corp. | 2.2% |
| Resona Holdings, Inc. | 2.1% |
| UBS Group AG | 2.0% |
| NatWest Group PLC | 2.0% |
Issuer country weightings
| United Kingdom | 16.0% |
| France | 15.4% |
| Japan | 13.6% |
| Switzerland | 9.0% |
| Canada | 8.3% |
| United States | 8.1% |
| Germany | 7.8% |
| Ireland | 4.5% |
| Taiwan | 3.8% |
| Other Countries | 13.5% |
Top ten holdings
| Taiwan Semiconductor Manufacturing Co. Ltd., ADR | 3.8% |
| Franco-Nevada Corp. | 3.5% |
| Schneider Electric SE | 3.1% |
| Legrand S.A. | 3.0% |
| TotalEnergies SE | 2.8% |
| Deutsche Boerse AG | 2.4% |
| Wheaton Precious Metals Corp. | 2.2% |
| Resona Holdings, Inc. | 2.1% |
| UBS Group AG | 2.0% |
| NatWest Group PLC | 2.0% |
MATERIAL FUND CHANGES
This is a summary of certain changes to the fund since June 1, 2025. For more complete information, you may review the fund's prospectus as amended, which is available at funds.mfs.com or upon request at 1‑800‑225‑2606.
Effective April 30, 2026, the MFS International Intrinsic Value Fund was renamed to the MFS International Intrinsic Equity Fund. In connection with the name change, the fund adopted a policy to invest at least 80% of its assets in equity securities.
This is a summary of certain changes to the fund since June 1, 2025. For more complete information, you may review the fund's prospectus as amended, which is available at funds.mfs.com or upon request at 1‑800‑225‑2606.
This report describes certain changes to the Fund that occurred during the reporting period.
FUND EXPENSES
What were the fund costs for the last year?
| (based on a hypothetical $10,000 investment) | ||
| Class Name | Costs of a $10,000 investment | Costs paid as a percentage of a $10,000 investment |
| B | $191 | 1.73% |
MANAGEMENT'S DISCUSSION OF FUND PERFORMANCE
-
For the twelve months ended May 31, 2026, Class B shares of the MFS International Intrinsic Equity Fund (fund) provided a total return of 20.53%, at net asset value. This compares with a return of 22.80% for the fund’s benchmark, the MSCI EAFE (Europe, Australasia, Far East) Index (net div).
-
Global equity markets reached record levels during the period, withstanding considerable volatility amid tariffs, geopolitical conflict and high levels of uncertainty. A new geopolitical event distressed markets at the end of the period as US and Israeli forces launched strikes against Iran, disrupting Mideast oil and natural gas exports. During the period, a pro-growth tax and spending bill was signed into law in the US, while in Europe, renewed focus on defense and infrastructure spending brightened the economic outlook. In Japan, the election of a pro-growth prime minister sent stocks to new highs prior to the conflict in Iran. Optimism over artificial intelligence remained high.
-
Considerable progress was made in trade talks between the US and many major trading partners, with a fragile truce between the US and China extended through late 2026. While the US Supreme Court struck down part of the Trump administration’s tariff strategy, the administration began deploying other authorities to largely replace the ones that were ruled unconstitutional.
-
Early in the period, moderating inflation pressures allowed many global central banks to ease monetary policy. Amid a difficult policymaking environment and slower job growth, the Federal Reserve resumed easing policy in September and delivered quarter-point rate cuts in October and December before pausing.
-
In fixed income markets, previously range-bound global bond yields spiked following the onset of the Middle East conflict, as energy-driven inflation fears appeared to have rattled bond investors. US rate volatility (as measured by the Merrill Lynch Option Volatility Estimate (MOVE) Index) similarly rose from intra-period lows, reflecting uncertainty around the scope and duration of the conflict and its implications for global growth. However, volatility later retracted as the risk of a broader regional military escalation appeared less likely. Global credit spreads widened only modestly before stabilizing near prior levels, supported by strong demand and resilient underlying fundamentals.
-
Top contributors to performance relative to the MSCI EAFE Index:
-
The fund's underweight allocation to the consumer discretionary sector strengthened relative performance.
-
An overweight allocation and security selection within the energy sector also benefited relative performance. Additionally, an overweight allocation to the materials sector further supported relative results.
-
-
Top detractors from performance relative to the MSCI EAFE Index:
-
Security selection within the consumer staples, industrials, and information technology sectors weakened relative performance.
-
The fund’s cash and/or cash equivalents position also held back relative performance.
-
FUND PERFORMANCE
The fund’s past performance is not a good predictor of the fund’s future performance. The graph and table below do not reflect the deduction of taxes that a shareholder would pay on fund distributions or the redemption of fund shares. The graph and table below assume reinvestment of dividends and capital gain distributions.
Growth of a Hypothetical $10,000 Investment
This graph shows the performance of a hypothetical $10,000 investment in Class B over a ten year period or since inception, if shorter, in comparison to a broad measure of market performance.
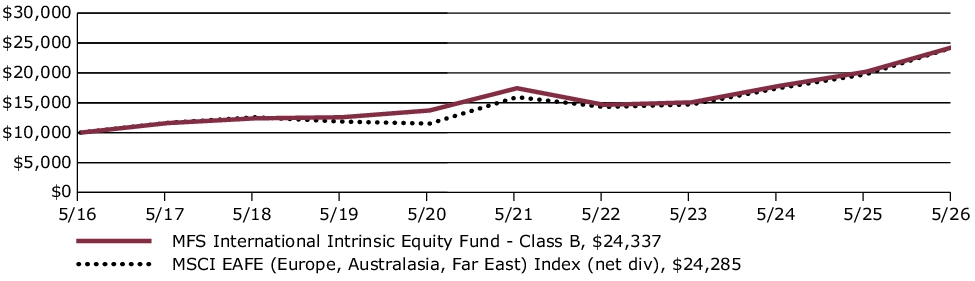
Average Annual Total Returns through 5/31/26
This table shows the average annual total returns of the class of shares noted for the periods shown, both with (if any) and without sales charges. It also shows the average annual total returns of a broad measure of market performance over the same periods.
| Share Class | 1-yr | 5-yr | 10-yr |
| B without sales charge | 20.53% | 6.90% | 9.30% |
| B with CDSC (declining over six years from 4% to 0%)× | 16.53% | 6.64% | 9.30% |
| Comparative Benchmark(s) | |||
| MSCI EAFE (Europe, Australasia, Far East) Index (net div) ∆ | 22.80% | 8.79% | 9.28% |
|
∆
|
Source: FactSet Research Systems Inc.
|
|
×
|
Assuming redemption at the end of the applicable period.
|
Visit mfs.com/perf/b for more recent performance information.
FUND STATISTICS AS OF 5/31/26
| Net Assets ($): | 24,946,587,541 | Total Management Fee ($)#: | 150,428,012 | |
| Total Number of Holdings: | 93 | Portfolio Turnover Rate (%): | 21 |
# Includes the effect of any management fee waivers, if applicable.
Where the fund holds derivatives, they are not included in the total number of portfolio holdings.
PORTFOLIO COMPOSITION (BASED ON TOTAL INVESTMENTS AS OF 5/31/26)
Portfolio structure
| Equities | 96.5% |
| Money Market Funds | 3.5% |
Top ten holdings
| Taiwan Semiconductor Manufacturing Co. Ltd., ADR | 3.8% |
| Franco-Nevada Corp. | 3.5% |
| Schneider Electric SE | 3.1% |
| Legrand S.A. | 3.0% |
| TotalEnergies SE | 2.8% |
| Deutsche Boerse AG | 2.4% |
| Wheaton Precious Metals Corp. | 2.2% |
| Resona Holdings, Inc. | 2.1% |
| UBS Group AG | 2.0% |
| NatWest Group PLC | 2.0% |
Issuer country weightings
| United Kingdom | 16.0% |
| France | 15.4% |
| Japan | 13.6% |
| Switzerland | 9.0% |
| Canada | 8.3% |
| United States | 8.1% |
| Germany | 7.8% |
| Ireland | 4.5% |
| Taiwan | 3.8% |
| Other Countries | 13.5% |
Top ten holdings
| Taiwan Semiconductor Manufacturing Co. Ltd., ADR | 3.8% |
| Franco-Nevada Corp. | 3.5% |
| Schneider Electric SE | 3.1% |
| Legrand S.A. | 3.0% |
| TotalEnergies SE | 2.8% |
| Deutsche Boerse AG | 2.4% |
| Wheaton Precious Metals Corp. | 2.2% |
| Resona Holdings, Inc. | 2.1% |
| UBS Group AG | 2.0% |
| NatWest Group PLC | 2.0% |
MATERIAL FUND CHANGES
This is a summary of certain changes to the fund since June 1, 2025. For more complete information, you may review the fund's prospectus as amended, which is available at funds.mfs.com or upon request at 1‑800‑225‑2606.
Effective April 30, 2026, the MFS International Intrinsic Value Fund was renamed to the MFS International Intrinsic Equity Fund. In connection with the name change, the fund adopted a policy to invest at least 80% of its assets in equity securities.
This is a summary of certain changes to the fund since June 1, 2025. For more complete information, you may review the fund's prospectus as amended, which is available at funds.mfs.com or upon request at 1‑800‑225‑2606.
This report describes certain changes to the Fund that occurred during the reporting period.
FUND EXPENSES
What were the fund costs for the last year?
| (based on a hypothetical $10,000 investment) | ||
| Class Name | Costs of a $10,000 investment | Costs paid as a percentage of a $10,000 investment |
| C | $192 | 1.74% |
MANAGEMENT'S DISCUSSION OF FUND PERFORMANCE
-
For the twelve months ended May 31, 2026, Class C shares of the MFS International Intrinsic Equity Fund (fund) provided a total return of 20.54%, at net asset value. This compares with a return of 22.80% for the fund’s benchmark, the MSCI EAFE (Europe, Australasia, Far East) Index (net div).
-
Global equity markets reached record levels during the period, withstanding considerable volatility amid tariffs, geopolitical conflict and high levels of uncertainty. A new geopolitical event distressed markets at the end of the period as US and Israeli forces launched strikes against Iran, disrupting Mideast oil and natural gas exports. During the period, a pro-growth tax and spending bill was signed into law in the US, while in Europe, renewed focus on defense and infrastructure spending brightened the economic outlook. In Japan, the election of a pro-growth prime minister sent stocks to new highs prior to the conflict in Iran. Optimism over artificial intelligence remained high.
-
Considerable progress was made in trade talks between the US and many major trading partners, with a fragile truce between the US and China extended through late 2026. While the US Supreme Court struck down part of the Trump administration’s tariff strategy, the administration began deploying other authorities to largely replace the ones that were ruled unconstitutional.
-
Early in the period, moderating inflation pressures allowed many global central banks to ease monetary policy. Amid a difficult policymaking environment and slower job growth, the Federal Reserve resumed easing policy in September and delivered quarter-point rate cuts in October and December before pausing.
-
In fixed income markets, previously range-bound global bond yields spiked following the onset of the Middle East conflict, as energy-driven inflation fears appeared to have rattled bond investors. US rate volatility (as measured by the Merrill Lynch Option Volatility Estimate (MOVE) Index) similarly rose from intra-period lows, reflecting uncertainty around the scope and duration of the conflict and its implications for global growth. However, volatility later retracted as the risk of a broader regional military escalation appeared less likely. Global credit spreads widened only modestly before stabilizing near prior levels, supported by strong demand and resilient underlying fundamentals.
-
Top contributors to performance relative to the MSCI EAFE Index:
-
The fund's underweight allocation to the consumer discretionary sector strengthened relative performance.
-
An overweight allocation and security selection within the energy sector also benefited relative performance. Additionally, an overweight allocation to the materials sector further supported relative results.
-
-
Top detractors from performance relative to the MSCI EAFE Index:
-
Security selection within the consumer staples, industrials, and information technology sectors weakened relative performance.
-
The fund’s cash and/or cash equivalents position also held back relative performance.
-
FUND PERFORMANCE
The fund’s past performance is not a good predictor of the fund’s future performance. The graph and table below do not reflect the deduction of taxes that a shareholder would pay on fund distributions or the redemption of fund shares. The graph and table below assume reinvestment of dividends and capital gain distributions.
Growth of a Hypothetical $10,000 Investment
This graph shows the performance of a hypothetical $10,000 investment in Class C over a ten year period or since inception, if shorter, in comparison to a broad measure of market performance.
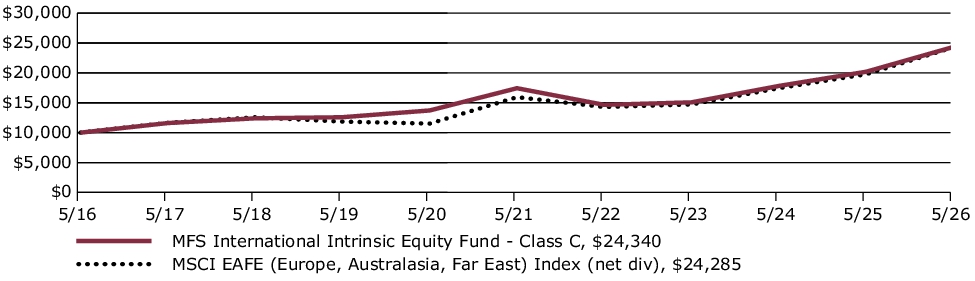
Average Annual Total Returns through 5/31/26
This table shows the average annual total returns of the class of shares noted for the periods shown, both with (if any) and without sales charges. It also shows the average annual total returns of a broad measure of market performance over the same periods.
| Share Class | 1-yr | 5-yr | 10-yr |
| C without sales charge | 20.54% | 6.90% | 9.30% |
| C with CDSC (1% for 12 months)× | 19.54% | 6.90% | 9.30% |
| Comparative Benchmark(s) | |||
| MSCI EAFE (Europe, Australasia, Far East) Index (net div) ∆ | 22.80% | 8.79% | 9.28% |
|
∆
|
Source: FactSet Research Systems Inc.
|
|
×
|
Assuming redemption at the end of the applicable period.
|
Visit mfs.com/perf/c for more recent performance information.
FUND STATISTICS AS OF 5/31/26
| Net Assets ($): | 24,946,587,541 | Total Management Fee ($)#: | 150,428,012 | |
| Total Number of Holdings: | 93 | Portfolio Turnover Rate (%): | 21 |
# Includes the effect of any management fee waivers, if applicable.
Where the fund holds derivatives, they are not included in the total number of portfolio holdings.
PORTFOLIO COMPOSITION (BASED ON TOTAL INVESTMENTS AS OF 5/31/26)
Portfolio structure
| Equities | 96.5% |
| Money Market Funds | 3.5% |
Top ten holdings
| Taiwan Semiconductor Manufacturing Co. Ltd., ADR | 3.8% |
| Franco-Nevada Corp. | 3.5% |
| Schneider Electric SE | 3.1% |
| Legrand S.A. | 3.0% |
| TotalEnergies SE | 2.8% |
| Deutsche Boerse AG | 2.4% |
| Wheaton Precious Metals Corp. | 2.2% |
| Resona Holdings, Inc. | 2.1% |
| UBS Group AG | 2.0% |
| NatWest Group PLC | 2.0% |
Issuer country weightings
| United Kingdom | 16.0% |
| France | 15.4% |
| Japan | 13.6% |
| Switzerland | 9.0% |
| Canada | 8.3% |
| United States | 8.1% |
| Germany | 7.8% |
| Ireland | 4.5% |
| Taiwan | 3.8% |
| Other Countries | 13.5% |
Top ten holdings
| Taiwan Semiconductor Manufacturing Co. Ltd., ADR | 3.8% |
| Franco-Nevada Corp. | 3.5% |
| Schneider Electric SE | 3.1% |
| Legrand S.A. | 3.0% |
| TotalEnergies SE | 2.8% |
| Deutsche Boerse AG | 2.4% |
| Wheaton Precious Metals Corp. | 2.2% |
| Resona Holdings, Inc. | 2.1% |
| UBS Group AG | 2.0% |
| NatWest Group PLC | 2.0% |
MATERIAL FUND CHANGES
This is a summary of certain changes to the fund since June 1, 2025. For more complete information, you may review the fund's prospectus as amended, which is available at funds.mfs.com or upon request at 1‑800‑225‑2606.
Effective April 30, 2026, the MFS International Intrinsic Value Fund was renamed to the MFS International Intrinsic Equity Fund. In connection with the name change, the fund adopted a policy to invest at least 80% of its assets in equity securities.
This is a summary of certain changes to the fund since June 1, 2025. For more complete information, you may review the fund's prospectus as amended, which is available at funds.mfs.com or upon request at 1‑800‑225‑2606.
This report describes certain changes to the Fund that occurred during the reporting period.
FUND EXPENSES
What were the fund costs for the last year?
| (based on a hypothetical $10,000 investment) | ||
| Class Name | Costs of a $10,000 investment | Costs paid as a percentage of a $10,000 investment |
| I | $82 | 0.74% |
MANAGEMENT'S DISCUSSION OF FUND PERFORMANCE
-
For the twelve months ended May 31, 2026, Class I shares of the MFS International Intrinsic Equity Fund (fund) provided a total return of 21.74%, at net asset value. This compares with a return of 22.80% for the fund’s benchmark, the MSCI EAFE (Europe, Australasia, Far East) Index (net div).
-
Global equity markets reached record levels during the period, withstanding considerable volatility amid tariffs, geopolitical conflict and high levels of uncertainty. A new geopolitical event distressed markets at the end of the period as US and Israeli forces launched strikes against Iran, disrupting Mideast oil and natural gas exports. During the period, a pro-growth tax and spending bill was signed into law in the US, while in Europe, renewed focus on defense and infrastructure spending brightened the economic outlook. In Japan, the election of a pro-growth prime minister sent stocks to new highs prior to the conflict in Iran. Optimism over artificial intelligence remained high.
-
Considerable progress was made in trade talks between the US and many major trading partners, with a fragile truce between the US and China extended through late 2026. While the US Supreme Court struck down part of the Trump administration’s tariff strategy, the administration began deploying other authorities to largely replace the ones that were ruled unconstitutional.
-
Early in the period, moderating inflation pressures allowed many global central banks to ease monetary policy. Amid a difficult policymaking environment and slower job growth, the Federal Reserve resumed easing policy in September and delivered quarter-point rate cuts in October and December before pausing.
-
In fixed income markets, previously range-bound global bond yields spiked following the onset of the Middle East conflict, as energy-driven inflation fears appeared to have rattled bond investors. US rate volatility (as measured by the Merrill Lynch Option Volatility Estimate (MOVE) Index) similarly rose from intra-period lows, reflecting uncertainty around the scope and duration of the conflict and its implications for global growth. However, volatility later retracted as the risk of a broader regional military escalation appeared less likely. Global credit spreads widened only modestly before stabilizing near prior levels, supported by strong demand and resilient underlying fundamentals.
-
Top contributors to performance relative to the MSCI EAFE Index:
-
The fund's underweight allocation to the consumer discretionary sector strengthened relative performance.
-
An overweight allocation and security selection within the energy sector also benefited relative performance. Additionally, an overweight allocation to the materials sector further supported relative results.
-
-
Top detractors from performance relative to the MSCI EAFE Index:
-
Security selection within the consumer staples, industrials, and information technology sectors weakened relative performance.
-
The fund’s cash and/or cash equivalents position also held back relative performance.
-
FUND PERFORMANCE
The fund’s past performance is not a good predictor of the fund’s future performance. The graph and table below do not reflect the deduction of taxes that a shareholder would pay on fund distributions or the redemption of fund shares. The graph and table below assume reinvestment of dividends and capital gain distributions.
Growth of a Hypothetical $10,000 Investment
This graph shows the performance of a hypothetical $10,000 investment in Class I over a ten year period or since inception, if shorter, in comparison to a broad measure of market performance.
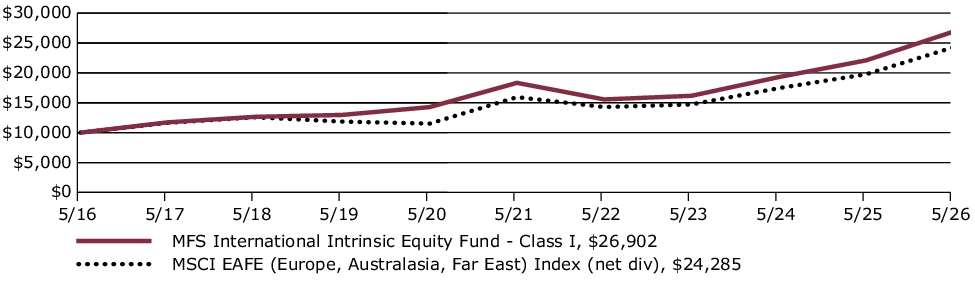
Average Annual Total Returns through 5/31/26
This table shows the average annual total returns of the class of shares noted for the periods shown, both with (if any) and without sales charges. It also shows the average annual total returns of a broad measure of market performance over the same periods.
| Share Class | 1-yr | 5-yr | 10-yr |
| I without sales charge | 21.74% | 7.97% | 10.40% |
| Comparative Benchmark(s) | |||
| MSCI EAFE (Europe, Australasia, Far East) Index (net div) ∆ | 22.80% | 8.79% | 9.28% |
|
∆
|
Source: FactSet Research Systems Inc.
|
Visit mfs.com/perf/i for more recent performance information.
FUND STATISTICS AS OF 5/31/26
| Net Assets ($): | 24,946,587,541 | Total Management Fee ($)#: | 150,428,012 | |
| Total Number of Holdings: | 93 | Portfolio Turnover Rate (%): | 21 |
# Includes the effect of any management fee waivers, if applicable.
Where the fund holds derivatives, they are not included in the total number of portfolio holdings.
PORTFOLIO COMPOSITION (BASED ON TOTAL INVESTMENTS AS OF 5/31/26)
Portfolio structure
| Equities | 96.5% |
| Money Market Funds | 3.5% |
Top ten holdings
| Taiwan Semiconductor Manufacturing Co. Ltd., ADR | 3.8% |
| Franco-Nevada Corp. | 3.5% |
| Schneider Electric SE | 3.1% |
| Legrand S.A. | 3.0% |
| TotalEnergies SE | 2.8% |
| Deutsche Boerse AG | 2.4% |
| Wheaton Precious Metals Corp. | 2.2% |
| Resona Holdings, Inc. | 2.1% |
| UBS Group AG | 2.0% |
| NatWest Group PLC | 2.0% |
Issuer country weightings
| United Kingdom | 16.0% |
| France | 15.4% |
| Japan | 13.6% |
| Switzerland | 9.0% |
| Canada | 8.3% |
| United States | 8.1% |
| Germany | 7.8% |
| Ireland | 4.5% |
| Taiwan | 3.8% |
| Other Countries | 13.5% |
Top ten holdings
| Taiwan Semiconductor Manufacturing Co. Ltd., ADR | 3.8% |
| Franco-Nevada Corp. | 3.5% |
| Schneider Electric SE | 3.1% |
| Legrand S.A. | 3.0% |
| TotalEnergies SE | 2.8% |
| Deutsche Boerse AG | 2.4% |
| Wheaton Precious Metals Corp. | 2.2% |
| Resona Holdings, Inc. | 2.1% |
| UBS Group AG | 2.0% |
| NatWest Group PLC | 2.0% |
MATERIAL FUND CHANGES
This is a summary of certain changes to the fund since June 1, 2025. For more complete information, you may review the fund's prospectus as amended, which is available at funds.mfs.com or upon request at 1‑800‑225‑2606.
Effective April 30, 2026, the MFS International Intrinsic Value Fund was renamed to the MFS International Intrinsic Equity Fund. In connection with the name change, the fund adopted a policy to invest at least 80% of its assets in equity securities.
This is a summary of certain changes to the fund since June 1, 2025. For more complete information, you may review the fund's prospectus as amended, which is available at funds.mfs.com or upon request at 1‑800‑225‑2606.
This report describes certain changes to the Fund that occurred during the reporting period.
FUND EXPENSES
What were the fund costs for the last year?
| (based on a hypothetical $10,000 investment) | ||
| Class Name | Costs of a $10,000 investment | Costs paid as a percentage of a $10,000 investment |
| R1 | $192 | 1.74% |
MANAGEMENT'S DISCUSSION OF FUND PERFORMANCE
-
For the twelve months ended May 31, 2026, Class R1 shares of the MFS International Intrinsic Equity Fund (fund) provided a total return of 20.54%, at net asset value. This compares with a return of 22.80% for the fund’s benchmark, the MSCI EAFE (Europe, Australasia, Far East) Index (net div).
-
Global equity markets reached record levels during the period, withstanding considerable volatility amid tariffs, geopolitical conflict and high levels of uncertainty. A new geopolitical event distressed markets at the end of the period as US and Israeli forces launched strikes against Iran, disrupting Mideast oil and natural gas exports. During the period, a pro-growth tax and spending bill was signed into law in the US, while in Europe, renewed focus on defense and infrastructure spending brightened the economic outlook. In Japan, the election of a pro-growth prime minister sent stocks to new highs prior to the conflict in Iran. Optimism over artificial intelligence remained high.
-
Considerable progress was made in trade talks between the US and many major trading partners, with a fragile truce between the US and China extended through late 2026. While the US Supreme Court struck down part of the Trump administration’s tariff strategy, the administration began deploying other authorities to largely replace the ones that were ruled unconstitutional.
-
Early in the period, moderating inflation pressures allowed many global central banks to ease monetary policy. Amid a difficult policymaking environment and slower job growth, the Federal Reserve resumed easing policy in September and delivered quarter-point rate cuts in October and December before pausing.
-
In fixed income markets, previously range-bound global bond yields spiked following the onset of the Middle East conflict, as energy-driven inflation fears appeared to have rattled bond investors. US rate volatility (as measured by the Merrill Lynch Option Volatility Estimate (MOVE) Index) similarly rose from intra-period lows, reflecting uncertainty around the scope and duration of the conflict and its implications for global growth. However, volatility later retracted as the risk of a broader regional military escalation appeared less likely. Global credit spreads widened only modestly before stabilizing near prior levels, supported by strong demand and resilient underlying fundamentals.
-
Top contributors to performance relative to the MSCI EAFE Index:
-
The fund's underweight allocation to the consumer discretionary sector strengthened relative performance.
-
An overweight allocation and security selection within the energy sector also benefited relative performance. Additionally, an overweight allocation to the materials sector further supported relative results.
-
-
Top detractors from performance relative to the MSCI EAFE Index:
-
Security selection within the consumer staples, industrials, and information technology sectors weakened relative performance.
-
The fund’s cash and/or cash equivalents position also held back relative performance.
-
FUND PERFORMANCE
The fund’s past performance is not a good predictor of the fund’s future performance. The graph and table below do not reflect the deduction of taxes that a shareholder would pay on fund distributions or the redemption of fund shares. The graph and table below assume reinvestment of dividends and capital gain distributions.
Growth of a Hypothetical $10,000 Investment
This graph shows the performance of a hypothetical $10,000 investment in Class R1 over a ten year period or since inception, if shorter, in comparison to a broad measure of market performance.
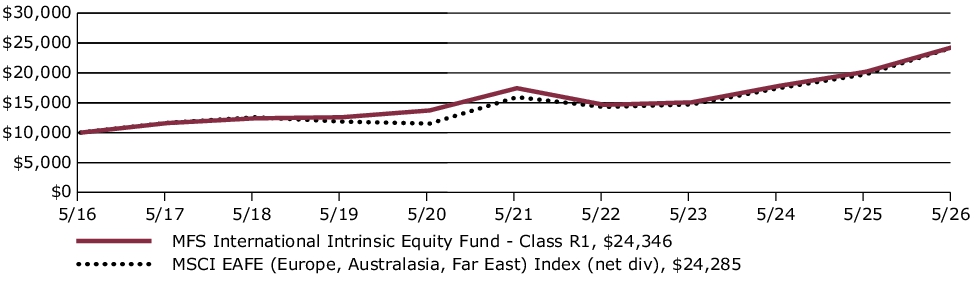
Average Annual Total Returns through 5/31/26
This table shows the average annual total returns of the class of shares noted for the periods shown, both with (if any) and without sales charges. It also shows the average annual total returns of a broad measure of market performance over the same periods.
| Share Class | 1-yr | 5-yr | 10-yr |
| R1 without sales charge | 20.54% | 6.90% | 9.31% |
| Comparative Benchmark(s) | |||
| MSCI EAFE (Europe, Australasia, Far East) Index (net div) ∆ | 22.80% | 8.79% | 9.28% |
|
∆
|
Source: FactSet Research Systems Inc.
|
Visit mfs.com/perf/r1 for more recent performance information.
FUND STATISTICS AS OF 5/31/26
| Net Assets ($): | 24,946,587,541 | Total Management Fee ($)#: | 150,428,012 | |
| Total Number of Holdings: | 93 | Portfolio Turnover Rate (%): | 21 |
# Includes the effect of any management fee waivers, if applicable.
Where the fund holds derivatives, they are not included in the total number of portfolio holdings.
PORTFOLIO COMPOSITION (BASED ON TOTAL INVESTMENTS AS OF 5/31/26)
Portfolio structure
| Equities | 96.5% |
| Money Market Funds | 3.5% |
Top ten holdings
| Taiwan Semiconductor Manufacturing Co. Ltd., ADR | 3.8% |
| Franco-Nevada Corp. | 3.5% |
| Schneider Electric SE | 3.1% |
| Legrand S.A. | 3.0% |
| TotalEnergies SE | 2.8% |
| Deutsche Boerse AG | 2.4% |
| Wheaton Precious Metals Corp. | 2.2% |
| Resona Holdings, Inc. | 2.1% |
| UBS Group AG | 2.0% |
| NatWest Group PLC | 2.0% |
Issuer country weightings
| United Kingdom | 16.0% |
| France | 15.4% |
| Japan | 13.6% |
| Switzerland | 9.0% |
| Canada | 8.3% |
| United States | 8.1% |
| Germany | 7.8% |
| Ireland | 4.5% |
| Taiwan | 3.8% |
| Other Countries | 13.5% |
Top ten holdings
| Taiwan Semiconductor Manufacturing Co. Ltd., ADR | 3.8% |
| Franco-Nevada Corp. | 3.5% |
| Schneider Electric SE | 3.1% |
| Legrand S.A. | 3.0% |
| TotalEnergies SE | 2.8% |
| Deutsche Boerse AG | 2.4% |
| Wheaton Precious Metals Corp. | 2.2% |
| Resona Holdings, Inc. | 2.1% |
| UBS Group AG | 2.0% |
| NatWest Group PLC | 2.0% |
MATERIAL FUND CHANGES
This is a summary of certain changes to the fund since June 1, 2025. For more complete information, you may review the fund's prospectus as amended, which is available at funds.mfs.com or upon request at 1‑800‑225‑2606.
Effective April 30, 2026, the MFS International Intrinsic Value Fund was renamed to the MFS International Intrinsic Equity Fund. In connection with the name change, the fund adopted a policy to invest at least 80% of its assets in equity securities.
This is a summary of certain changes to the fund since June 1, 2025. For more complete information, you may review the fund's prospectus as amended, which is available at funds.mfs.com or upon request at 1‑800‑225‑2606.
This report describes certain changes to the Fund that occurred during the reporting period.
FUND EXPENSES
What were the fund costs for the last year?
| (based on a hypothetical $10,000 investment) | ||
| Class Name | Costs of a $10,000 investment | Costs paid as a percentage of a $10,000 investment |
| R2 | $137 | 1.24% |
MANAGEMENT'S DISCUSSION OF FUND PERFORMANCE
-
For the twelve months ended May 31, 2026, Class R2 shares of the MFS International Intrinsic Equity Fund (fund) provided a total return of 21.14%, at net asset value. This compares with a return of 22.80% for the fund’s benchmark, the MSCI EAFE (Europe, Australasia, Far East) Index (net div).
-
Global equity markets reached record levels during the period, withstanding considerable volatility amid tariffs, geopolitical conflict and high levels of uncertainty. A new geopolitical event distressed markets at the end of the period as US and Israeli forces launched strikes against Iran, disrupting Mideast oil and natural gas exports. During the period, a pro-growth tax and spending bill was signed into law in the US, while in Europe, renewed focus on defense and infrastructure spending brightened the economic outlook. In Japan, the election of a pro-growth prime minister sent stocks to new highs prior to the conflict in Iran. Optimism over artificial intelligence remained high.
-
Considerable progress was made in trade talks between the US and many major trading partners, with a fragile truce between the US and China extended through late 2026. While the US Supreme Court struck down part of the Trump administration’s tariff strategy, the administration began deploying other authorities to largely replace the ones that were ruled unconstitutional.
-
Early in the period, moderating inflation pressures allowed many global central banks to ease monetary policy. Amid a difficult policymaking environment and slower job growth, the Federal Reserve resumed easing policy in September and delivered quarter-point rate cuts in October and December before pausing.
-
In fixed income markets, previously range-bound global bond yields spiked following the onset of the Middle East conflict, as energy-driven inflation fears appeared to have rattled bond investors. US rate volatility (as measured by the Merrill Lynch Option Volatility Estimate (MOVE) Index) similarly rose from intra-period lows, reflecting uncertainty around the scope and duration of the conflict and its implications for global growth. However, volatility later retracted as the risk of a broader regional military escalation appeared less likely. Global credit spreads widened only modestly before stabilizing near prior levels, supported by strong demand and resilient underlying fundamentals.
-
Top contributors to performance relative to the MSCI EAFE Index:
-
The fund's underweight allocation to the consumer discretionary sector strengthened relative performance.
-
An overweight allocation and security selection within the energy sector also benefited relative performance. Additionally, an overweight allocation to the materials sector further supported relative results.
-
-
Top detractors from performance relative to the MSCI EAFE Index:
-
Security selection within the consumer staples, industrials, and information technology sectors weakened relative performance.
-
The fund’s cash and/or cash equivalents position also held back relative performance.
-
FUND PERFORMANCE
The fund’s past performance is not a good predictor of the fund’s future performance. The graph and table below do not reflect the deduction of taxes that a shareholder would pay on fund distributions or the redemption of fund shares. The graph and table below assume reinvestment of dividends and capital gain distributions.
Growth of a Hypothetical $10,000 Investment
This graph shows the performance of a hypothetical $10,000 investment in Class R2 over a ten year period or since inception, if shorter, in comparison to a broad measure of market performance.
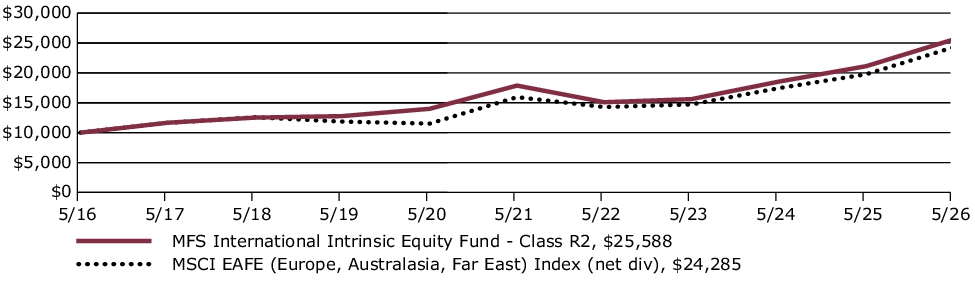
Average Annual Total Returns through 5/31/26
This table shows the average annual total returns of the class of shares noted for the periods shown, both with (if any) and without sales charges. It also shows the average annual total returns of a broad measure of market performance over the same periods.
| Share Class | 1-yr | 5-yr | 10-yr |
| R2 without sales charge | 21.14% | 7.44% | 9.85% |
| Comparative Benchmark(s) | |||
| MSCI EAFE (Europe, Australasia, Far East) Index (net div) ∆ | 22.80% | 8.79% | 9.28% |
|
∆
|
Source: FactSet Research Systems Inc.
|
Visit mfs.com/perf/r2 for more recent performance information.
FUND STATISTICS AS OF 5/31/26
| Net Assets ($): | 24,946,587,541 | Total Management Fee ($)#: | 150,428,012 | |
| Total Number of Holdings: | 93 | Portfolio Turnover Rate (%): | 21 |
# Includes the effect of any management fee waivers, if applicable.
Where the fund holds derivatives, they are not included in the total number of portfolio holdings.
PORTFOLIO COMPOSITION (BASED ON TOTAL INVESTMENTS AS OF 5/31/26)
Portfolio structure
| Equities | 96.5% |
| Money Market Funds | 3.5% |
Top ten holdings
| Taiwan Semiconductor Manufacturing Co. Ltd., ADR | 3.8% |
| Franco-Nevada Corp. | 3.5% |
| Schneider Electric SE | 3.1% |
| Legrand S.A. | 3.0% |
| TotalEnergies SE | 2.8% |
| Deutsche Boerse AG | 2.4% |
| Wheaton Precious Metals Corp. | 2.2% |
| Resona Holdings, Inc. | 2.1% |
| UBS Group AG | 2.0% |
| NatWest Group PLC | 2.0% |
Issuer country weightings
| United Kingdom | 16.0% |
| France | 15.4% |
| Japan | 13.6% |
| Switzerland | 9.0% |
| Canada | 8.3% |
| United States | 8.1% |
| Germany | 7.8% |
| Ireland | 4.5% |
| Taiwan | 3.8% |
| Other Countries | 13.5% |
Top ten holdings
| Taiwan Semiconductor Manufacturing Co. Ltd., ADR | 3.8% |
| Franco-Nevada Corp. | 3.5% |
| Schneider Electric SE | 3.1% |
| Legrand S.A. | 3.0% |
| TotalEnergies SE | 2.8% |
| Deutsche Boerse AG | 2.4% |
| Wheaton Precious Metals Corp. | 2.2% |
| Resona Holdings, Inc. | 2.1% |
| UBS Group AG | 2.0% |
| NatWest Group PLC | 2.0% |
MATERIAL FUND CHANGES
This is a summary of certain changes to the fund since June 1, 2025. For more complete information, you may review the fund's prospectus as amended, which is available at funds.mfs.com or upon request at 1‑800‑225‑2606.
Effective April 30, 2026, the MFS International Intrinsic Value Fund was renamed to the MFS International Intrinsic Equity Fund. In connection with the name change, the fund adopted a policy to invest at least 80% of its assets in equity securities.
This is a summary of certain changes to the fund since June 1, 2025. For more complete information, you may review the fund's prospectus as amended, which is available at funds.mfs.com or upon request at 1‑800‑225‑2606.
This report describes certain changes to the Fund that occurred during the reporting period.
FUND EXPENSES
What were the fund costs for the last year?
| (based on a hypothetical $10,000 investment) | ||
| Class Name | Costs of a $10,000 investment | Costs paid as a percentage of a $10,000 investment |
| R3 | $110 | 0.99% |
MANAGEMENT'S DISCUSSION OF FUND PERFORMANCE
-
For the twelve months ended May 31, 2026, Class R3 shares of the MFS International Intrinsic Equity Fund (fund) provided a total return of 21.43%, at net asset value. This compares with a return of 22.80% for the fund’s benchmark, the MSCI EAFE (Europe, Australasia, Far East) Index (net div).
-
Global equity markets reached record levels during the period, withstanding considerable volatility amid tariffs, geopolitical conflict and high levels of uncertainty. A new geopolitical event distressed markets at the end of the period as US and Israeli forces launched strikes against Iran, disrupting Mideast oil and natural gas exports. During the period, a pro-growth tax and spending bill was signed into law in the US, while in Europe, renewed focus on defense and infrastructure spending brightened the economic outlook. In Japan, the election of a pro-growth prime minister sent stocks to new highs prior to the conflict in Iran. Optimism over artificial intelligence remained high.
-
Considerable progress was made in trade talks between the US and many major trading partners, with a fragile truce between the US and China extended through late 2026. While the US Supreme Court struck down part of the Trump administration’s tariff strategy, the administration began deploying other authorities to largely replace the ones that were ruled unconstitutional.
-
Early in the period, moderating inflation pressures allowed many global central banks to ease monetary policy. Amid a difficult policymaking environment and slower job growth, the Federal Reserve resumed easing policy in September and delivered quarter-point rate cuts in October and December before pausing.
-
In fixed income markets, previously range-bound global bond yields spiked following the onset of the Middle East conflict, as energy-driven inflation fears appeared to have rattled bond investors. US rate volatility (as measured by the Merrill Lynch Option Volatility Estimate (MOVE) Index) similarly rose from intra-period lows, reflecting uncertainty around the scope and duration of the conflict and its implications for global growth. However, volatility later retracted as the risk of a broader regional military escalation appeared less likely. Global credit spreads widened only modestly before stabilizing near prior levels, supported by strong demand and resilient underlying fundamentals.
-
Top contributors to performance relative to the MSCI EAFE Index:
-
The fund's underweight allocation to the consumer discretionary sector strengthened relative performance.
-
An overweight allocation and security selection within the energy sector also benefited relative performance. Additionally, an overweight allocation to the materials sector further supported relative results.
-
-
Top detractors from performance relative to the MSCI EAFE Index:
-
Security selection within the consumer staples, industrials, and information technology sectors weakened relative performance.
-
The fund’s cash and/or cash equivalents position also held back relative performance.
-
FUND PERFORMANCE
The fund’s past performance is not a good predictor of the fund’s future performance. The graph and table below do not reflect the deduction of taxes that a shareholder would pay on fund distributions or the redemption of fund shares. The graph and table below assume reinvestment of dividends and capital gain distributions.
Growth of a Hypothetical $10,000 Investment
This graph shows the performance of a hypothetical $10,000 investment in Class R3 over a ten year period or since inception, if shorter, in comparison to a broad measure of market performance.
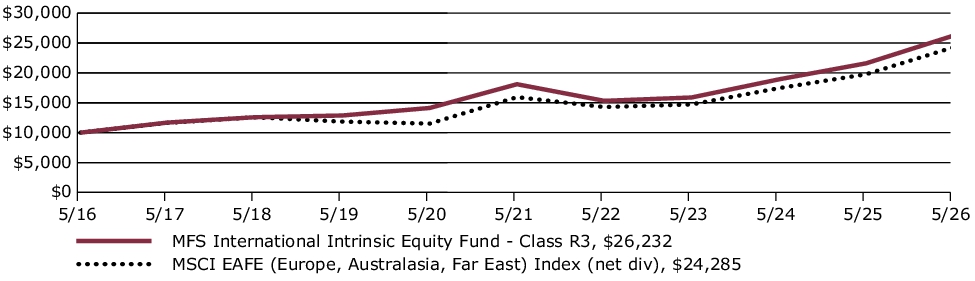
Average Annual Total Returns through 5/31/26
This table shows the average annual total returns of the class of shares noted for the periods shown, both with (if any) and without sales charges. It also shows the average annual total returns of a broad measure of market performance over the same periods.
| Share Class | 1-yr | 5-yr | 10-yr |
| R3 without sales charge | 21.43% | 7.70% | 10.12% |
| Comparative Benchmark(s) | |||
| MSCI EAFE (Europe, Australasia, Far East) Index (net div) ∆ | 22.80% | 8.79% | 9.28% |
|
∆
|
Source: FactSet Research Systems Inc.
|
Visit mfs.com/perf/r3 for more recent performance information.
FUND STATISTICS AS OF 5/31/26
| Net Assets ($): | 24,946,587,541 | Total Management Fee ($)#: | 150,428,012 | |
| Total Number of Holdings: | 93 | Portfolio Turnover Rate (%): | 21 |
# Includes the effect of any management fee waivers, if applicable.
Where the fund holds derivatives, they are not included in the total number of portfolio holdings.
PORTFOLIO COMPOSITION (BASED ON TOTAL INVESTMENTS AS OF 5/31/26)
Portfolio structure
| Equities | 96.5% |
| Money Market Funds | 3.5% |
Top ten holdings
| Taiwan Semiconductor Manufacturing Co. Ltd., ADR | 3.8% |
| Franco-Nevada Corp. | 3.5% |
| Schneider Electric SE | 3.1% |
| Legrand S.A. | 3.0% |
| TotalEnergies SE | 2.8% |
| Deutsche Boerse AG | 2.4% |
| Wheaton Precious Metals Corp. | 2.2% |
| Resona Holdings, Inc. | 2.1% |
| UBS Group AG | 2.0% |
| NatWest Group PLC | 2.0% |
Issuer country weightings
| United Kingdom | 16.0% |
| France | 15.4% |
| Japan | 13.6% |
| Switzerland | 9.0% |
| Canada | 8.3% |
| United States | 8.1% |
| Germany | 7.8% |
| Ireland | 4.5% |
| Taiwan | 3.8% |
| Other Countries | 13.5% |
Top ten holdings
| Taiwan Semiconductor Manufacturing Co. Ltd., ADR | 3.8% |
| Franco-Nevada Corp. | 3.5% |
| Schneider Electric SE | 3.1% |
| Legrand S.A. | 3.0% |
| TotalEnergies SE | 2.8% |
| Deutsche Boerse AG | 2.4% |
| Wheaton Precious Metals Corp. | 2.2% |
| Resona Holdings, Inc. | 2.1% |
| UBS Group AG | 2.0% |
| NatWest Group PLC | 2.0% |
MATERIAL FUND CHANGES
This is a summary of certain changes to the fund since June 1, 2025. For more complete information, you may review the fund's prospectus as amended, which is available at funds.mfs.com or upon request at 1‑800‑225‑2606.
Effective April 30, 2026, the MFS International Intrinsic Value Fund was renamed to the MFS International Intrinsic Equity Fund. In connection with the name change, the fund adopted a policy to invest at least 80% of its assets in equity securities.
This is a summary of certain changes to the fund since June 1, 2025. For more complete information, you may review the fund's prospectus as amended, which is available at funds.mfs.com or upon request at 1‑800‑225‑2606.
This report describes certain changes to the Fund that occurred during the reporting period.
FUND EXPENSES
What were the fund costs for the last year?
| (based on a hypothetical $10,000 investment) | ||
| Class Name | Costs of a $10,000 investment | Costs paid as a percentage of a $10,000 investment |
| R4 | $82 | 0.74% |
MANAGEMENT'S DISCUSSION OF FUND PERFORMANCE
-
For the twelve months ended May 31, 2026, Class R4 shares of the MFS International Intrinsic Equity Fund (fund) provided a total return of 21.75%, at net asset value. This compares with a return of 22.80% for the fund’s benchmark, the MSCI EAFE (Europe, Australasia, Far East) Index (net div).
-
Global equity markets reached record levels during the period, withstanding considerable volatility amid tariffs, geopolitical conflict and high levels of uncertainty. A new geopolitical event distressed markets at the end of the period as US and Israeli forces launched strikes against Iran, disrupting Mideast oil and natural gas exports. During the period, a pro-growth tax and spending bill was signed into law in the US, while in Europe, renewed focus on defense and infrastructure spending brightened the economic outlook. In Japan, the election of a pro-growth prime minister sent stocks to new highs prior to the conflict in Iran. Optimism over artificial intelligence remained high.
-
Considerable progress was made in trade talks between the US and many major trading partners, with a fragile truce between the US and China extended through late 2026. While the US Supreme Court struck down part of the Trump administration’s tariff strategy, the administration began deploying other authorities to largely replace the ones that were ruled unconstitutional.
-
Early in the period, moderating inflation pressures allowed many global central banks to ease monetary policy. Amid a difficult policymaking environment and slower job growth, the Federal Reserve resumed easing policy in September and delivered quarter-point rate cuts in October and December before pausing.
-
In fixed income markets, previously range-bound global bond yields spiked following the onset of the Middle East conflict, as energy-driven inflation fears appeared to have rattled bond investors. US rate volatility (as measured by the Merrill Lynch Option Volatility Estimate (MOVE) Index) similarly rose from intra-period lows, reflecting uncertainty around the scope and duration of the conflict and its implications for global growth. However, volatility later retracted as the risk of a broader regional military escalation appeared less likely. Global credit spreads widened only modestly before stabilizing near prior levels, supported by strong demand and resilient underlying fundamentals.
-
Top contributors to performance relative to the MSCI EAFE Index:
-
The fund's underweight allocation to the consumer discretionary sector strengthened relative performance.
-
An overweight allocation and security selection within the energy sector also benefited relative performance. Additionally, an overweight allocation to the materials sector further supported relative results.
-
-
Top detractors from performance relative to the MSCI EAFE Index:
-
Security selection within the consumer staples, industrials, and information technology sectors weakened relative performance.
-
The fund’s cash and/or cash equivalents position also held back relative performance.
-
FUND PERFORMANCE
The fund’s past performance is not a good predictor of the fund’s future performance. The graph and table below do not reflect the deduction of taxes that a shareholder would pay on fund distributions or the redemption of fund shares. The graph and table below assume reinvestment of dividends and capital gain distributions.
Growth of a Hypothetical $10,000 Investment
This graph shows the performance of a hypothetical $10,000 investment in Class R4 over a ten year period or since inception, if shorter, in comparison to a broad measure of market performance.
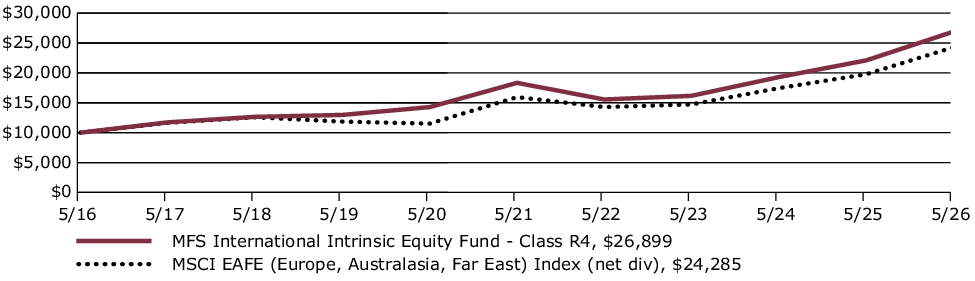
Average Annual Total Returns through 5/31/26
This table shows the average annual total returns of the class of shares noted for the periods shown, both with (if any) and without sales charges. It also shows the average annual total returns of a broad measure of market performance over the same periods.
| Share Class | 1-yr | 5-yr | 10-yr |
| R4 without sales charge | 21.75% | 7.97% | 10.40% |
| Comparative Benchmark(s) | |||
| MSCI EAFE (Europe, Australasia, Far East) Index (net div) ∆ | 22.80% | 8.79% | 9.28% |
|
∆
|
Source: FactSet Research Systems Inc.
|
Visit mfs.com/perf/r4 for more recent performance information.
FUND STATISTICS AS OF 5/31/26
| Net Assets ($): | 24,946,587,541 | Total Management Fee ($)#: | 150,428,012 | |
| Total Number of Holdings: | 93 | Portfolio Turnover Rate (%): | 21 |
# Includes the effect of any management fee waivers, if applicable.
Where the fund holds derivatives, they are not included in the total number of portfolio holdings.
PORTFOLIO COMPOSITION (BASED ON TOTAL INVESTMENTS AS OF 5/31/26)
Portfolio structure
| Equities | 96.5% |
| Money Market Funds | 3.5% |
Top ten holdings
| Taiwan Semiconductor Manufacturing Co. Ltd., ADR | 3.8% |
| Franco-Nevada Corp. | 3.5% |
| Schneider Electric SE | 3.1% |
| Legrand S.A. | 3.0% |
| TotalEnergies SE | 2.8% |
| Deutsche Boerse AG | 2.4% |
| Wheaton Precious Metals Corp. | 2.2% |
| Resona Holdings, Inc. | 2.1% |
| UBS Group AG | 2.0% |
| NatWest Group PLC | 2.0% |
Issuer country weightings
| United Kingdom | 16.0% |
| France | 15.4% |
| Japan | 13.6% |
| Switzerland | 9.0% |
| Canada | 8.3% |
| United States | 8.1% |
| Germany | 7.8% |
| Ireland | 4.5% |
| Taiwan | 3.8% |
| Other Countries | 13.5% |
Top ten holdings
| Taiwan Semiconductor Manufacturing Co. Ltd., ADR | 3.8% |
| Franco-Nevada Corp. | 3.5% |
| Schneider Electric SE | 3.1% |
| Legrand S.A. | 3.0% |
| TotalEnergies SE | 2.8% |
| Deutsche Boerse AG | 2.4% |
| Wheaton Precious Metals Corp. | 2.2% |
| Resona Holdings, Inc. | 2.1% |
| UBS Group AG | 2.0% |
| NatWest Group PLC | 2.0% |
MATERIAL FUND CHANGES
This is a summary of certain changes to the fund since June 1, 2025. For more complete information, you may review the fund's prospectus as amended, which is available at funds.mfs.com or upon request at 1‑800‑225‑2606.
Effective April 30, 2026, the MFS International Intrinsic Value Fund was renamed to the MFS International Intrinsic Equity Fund. In connection with the name change, the fund adopted a policy to invest at least 80% of its assets in equity securities.
This is a summary of certain changes to the fund since June 1, 2025. For more complete information, you may review the fund's prospectus as amended, which is available at funds.mfs.com or upon request at 1‑800‑225‑2606.
This report describes certain changes to the Fund that occurred during the reporting period.
FUND EXPENSES
What were the fund costs for the last year?
| (based on a hypothetical $10,000 investment) | ||
| Class Name | Costs of a $10,000 investment | Costs paid as a percentage of a $10,000 investment |
| R6 | $71 | 0.64% |
MANAGEMENT'S DISCUSSION OF FUND PERFORMANCE
-
For the twelve months ended May 31, 2026, Class R6 shares of the MFS International Intrinsic Equity Fund (fund) provided a total return of 21.88%, at net asset value. This compares with a return of 22.80% for the fund’s benchmark, the MSCI EAFE (Europe, Australasia, Far East) Index (net div).
-
Global equity markets reached record levels during the period, withstanding considerable volatility amid tariffs, geopolitical conflict and high levels of uncertainty. A new geopolitical event distressed markets at the end of the period as US and Israeli forces launched strikes against Iran, disrupting Mideast oil and natural gas exports. During the period, a pro-growth tax and spending bill was signed into law in the US, while in Europe, renewed focus on defense and infrastructure spending brightened the economic outlook. In Japan, the election of a pro-growth prime minister sent stocks to new highs prior to the conflict in Iran. Optimism over artificial intelligence remained high.
-
Considerable progress was made in trade talks between the US and many major trading partners, with a fragile truce between the US and China extended through late 2026. While the US Supreme Court struck down part of the Trump administration’s tariff strategy, the administration began deploying other authorities to largely replace the ones that were ruled unconstitutional.
-
Early in the period, moderating inflation pressures allowed many global central banks to ease monetary policy. Amid a difficult policymaking environment and slower job growth, the Federal Reserve resumed easing policy in September and delivered quarter-point rate cuts in October and December before pausing.
-
In fixed income markets, previously range-bound global bond yields spiked following the onset of the Middle East conflict, as energy-driven inflation fears appeared to have rattled bond investors. US rate volatility (as measured by the Merrill Lynch Option Volatility Estimate (MOVE) Index) similarly rose from intra-period lows, reflecting uncertainty around the scope and duration of the conflict and its implications for global growth. However, volatility later retracted as the risk of a broader regional military escalation appeared less likely. Global credit spreads widened only modestly before stabilizing near prior levels, supported by strong demand and resilient underlying fundamentals.
-
Top contributors to performance relative to the MSCI EAFE Index:
-
The fund's underweight allocation to the consumer discretionary sector strengthened relative performance.
-
An overweight allocation and security selection within the energy sector also benefited relative performance. Additionally, an overweight allocation to the materials sector further supported relative results.
-
-
Top detractors from performance relative to the MSCI EAFE Index:
-
Security selection within the consumer staples, industrials, and information technology sectors weakened relative performance.
-
The fund’s cash and/or cash equivalents position also held back relative performance.
-
FUND PERFORMANCE
The fund’s past performance is not a good predictor of the fund’s future performance. The graph and table below do not reflect the deduction of taxes that a shareholder would pay on fund distributions or the redemption of fund shares. The graph and table below assume reinvestment of dividends and capital gain distributions.
Growth of a Hypothetical $10,000 Investment
This graph shows the performance of a hypothetical $10,000 investment in Class R6 over a ten year period or since inception, if shorter, in comparison to a broad measure of market performance.
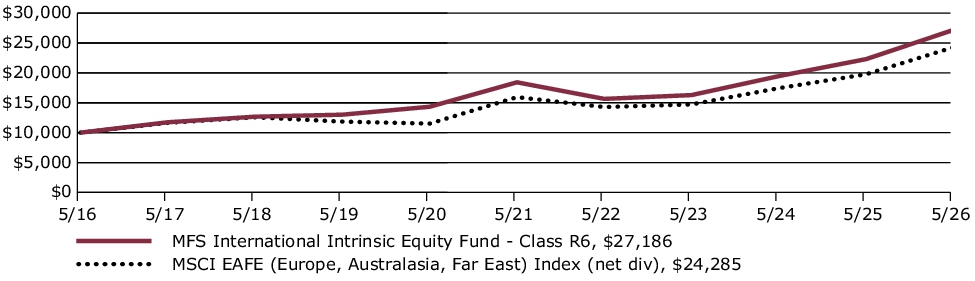
Average Annual Total Returns through 5/31/26
This table shows the average annual total returns of the class of shares noted for the periods shown, both with (if any) and without sales charges. It also shows the average annual total returns of a broad measure of market performance over the same periods.
| Share Class | 1-yr | 5-yr | 10-yr |
| R6 without sales charge | 21.88% | 8.09% | 10.52% |
| Comparative Benchmark(s) | |||
| MSCI EAFE (Europe, Australasia, Far East) Index (net div) ∆ | 22.80% | 8.79% | 9.28% |
|
∆
|
Source: FactSet Research Systems Inc.
|
Visit mfs.com/perf/r6 for more recent performance information.
FUND STATISTICS AS OF 5/31/26
| Net Assets ($): | 24,946,587,541 | Total Management Fee ($)#: | 150,428,012 | |
| Total Number of Holdings: | 93 | Portfolio Turnover Rate (%): | 21 |
# Includes the effect of any management fee waivers, if applicable.
Where the fund holds derivatives, they are not included in the total number of portfolio holdings.
PORTFOLIO COMPOSITION (BASED ON TOTAL INVESTMENTS AS OF 5/31/26)
Portfolio structure
| Equities | 96.5% |
| Money Market Funds | 3.5% |
Top ten holdings
| Taiwan Semiconductor Manufacturing Co. Ltd., ADR | 3.8% |
| Franco-Nevada Corp. | 3.5% |
| Schneider Electric SE | 3.1% |
| Legrand S.A. | 3.0% |
| TotalEnergies SE | 2.8% |
| Deutsche Boerse AG | 2.4% |
| Wheaton Precious Metals Corp. | 2.2% |
| Resona Holdings, Inc. | 2.1% |
| UBS Group AG | 2.0% |
| NatWest Group PLC | 2.0% |
Issuer country weightings
| United Kingdom | 16.0% |
| France | 15.4% |
| Japan | 13.6% |
| Switzerland | 9.0% |
| Canada | 8.3% |
| United States | 8.1% |
| Germany | 7.8% |
| Ireland | 4.5% |
| Taiwan | 3.8% |
| Other Countries | 13.5% |
Top ten holdings
| Taiwan Semiconductor Manufacturing Co. Ltd., ADR | 3.8% |
| Franco-Nevada Corp. | 3.5% |
| Schneider Electric SE | 3.1% |
| Legrand S.A. | 3.0% |
| TotalEnergies SE | 2.8% |
| Deutsche Boerse AG | 2.4% |
| Wheaton Precious Metals Corp. | 2.2% |
| Resona Holdings, Inc. | 2.1% |
| UBS Group AG | 2.0% |
| NatWest Group PLC | 2.0% |
MATERIAL FUND CHANGES
This is a summary of certain changes to the fund since June 1, 2025. For more complete information, you may review the fund's prospectus as amended, which is available at funds.mfs.com or upon request at 1‑800‑225‑2606.
Effective April 30, 2026, the MFS International Intrinsic Value Fund was renamed to the MFS International Intrinsic Equity Fund. In connection with the name change, the fund adopted a policy to invest at least 80% of its assets in equity securities.
This is a summary of certain changes to the fund since June 1, 2025. For more complete information, you may review the fund's prospectus as amended, which is available at funds.mfs.com or upon request at 1‑800‑225‑2606.
FUND EXPENSES
What were the fund costs for the last year?
| (based on a hypothetical $10,000 investment) | ||
| Class Name | Costs of a $10,000 investment ~ | Costs paid as a percentage of a $10,000 investment ~ |
| R6 | $59 | 0.58% |
˜ Expenses are direct expenses and do not include underlying fund fees and expenses.
MANAGEMENT'S DISCUSSION OF FUND PERFORMANCE
-
The MFS Managed Wealth Fund's (fund) investment objective is to seek total return. MFS seeks to achieve the fund’s objective by generating returns from (1) a strategic allocation to three MFS equity funds, referred to as underlying funds, and (2) a tactical asset allocation overlay primarily using derivative instruments to seek to decrease the volatility of the fund’s returns by reducing the fund’s exposure to the equity and/or currency markets as represented by the underlying funds and also to potentially expose the fund to asset classes and/or markets in which the underlying funds have little or no exposure. In addition, MFS may seek to limit the fund’s exposure to certain extreme market events. It is expected that the fund will generally have lower volatility than the overall equity market and will generally underperform the equity markets during periods of rising equity markets.
-
For the twelve months ended May 31, 2026, Class R6 shares of the fund provided a total return of 4.30%, at net asset value. This compares with a return of 29.78% for the fund’s benchmark, the Standard & Poor's 500 Stock Index. The fund's other benchmark, the ICE BofA 0-3 Month U.S. Treasury Bill Index, generated a return of 3.99%.
-
Global equity markets reached record levels during the period, withstanding considerable volatility amid tariffs, geopolitical conflict and high levels of uncertainty. A new geopolitical event distressed markets at the end of the period as US and Israeli forces launched strikes against Iran, disrupting Mideast oil and natural gas exports. During the period, a pro-growth tax and spending bill was signed into law in the US, while in Europe, renewed focus on defense and infrastructure spending brightened the economic outlook. In Japan, the election of a pro-growth prime minister sent stocks to new highs prior to the conflict in Iran. Optimism over artificial intelligence remained high.
-
Considerable progress was made in trade talks between the US and many major trading partners, with a fragile truce between the US and China extended through late 2026. While the US Supreme Court struck down part of the Trump administration’s tariff strategy, the administration began deploying other authorities to largely replace the ones that were ruled unconstitutional.
-
Early in the period, moderating inflation pressures allowed many global central banks to ease monetary policy. Amid a difficult policymaking environment and slower job growth, the Federal Reserve resumed easing policy in September and delivered quarter-point rate cuts in October and December before pausing.
-
In fixed income markets, previously range-bound global bond yields spiked following the onset of the Middle East conflict, as energy-driven inflation fears appeared to have rattled bond investors. US rate volatility (as measured by the Merrill Lynch Option Volatility Estimate (MOVE) Index) similarly rose from intra-period lows, reflecting uncertainty around the scope and duration of the conflict and its implications for global growth. However, volatility later retracted as the risk of a broader regional military escalation appeared less likely. Global credit spreads widened only modestly before stabilizing near prior levels, supported by strong demand and resilient underlying fundamentals.
-
Top contributors to absolute performance:
-
The fund's allocation to the MFS Growth Fund, MFS International Equity Fund, and the MFS Value Fund benefited performance.
-
-
Top detractors from absolute performance:
-
The fund's short exposure to futures contracts on the Russell 1000® Value Index, Russell 1000® Growth Index, and MSCI EAFE Index held back performance.
-
FUND PERFORMANCE
The fund’s past performance is not a good predictor of the fund’s future performance. The graph and table below do not reflect the deduction of taxes that a shareholder would pay on fund distributions or the redemption of fund shares. The graph and table below assume reinvestment of dividends and capital gain distributions.
Growth of a Hypothetical $10,000 Investment*
This graph shows the performance of a hypothetical $10,000 investment in Class R6 over a ten year period or since inception, if shorter, in comparison to (i) a broad measure of market performance and (ii) an additional index that MFS believes corresponds to the fund’s investment strategies.
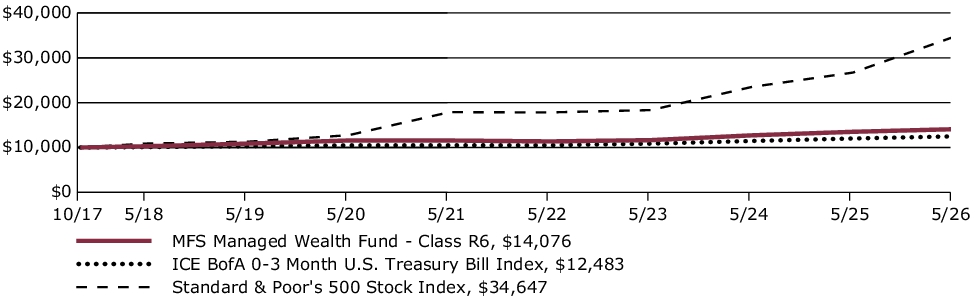
Average Annual Total Returns through 5/31/26
This table shows the average annual total returns of the class of shares noted for the periods shown, both with (if any) and without sales charges. It also shows the average annual total returns of (i) a broad measure of market performance and (ii) an additional index that MFS believes corresponds to the fund’s investment strategies, over the same periods.
| Share Class | 1-yr | 5-yr | Life* |
| R6 without sales charge | 4.30% | 4.03% | 4.02% |
| Comparative Benchmark(s) | |||
| Standard & Poor's 500 Stock Index ∆ | 29.78% | 14.15% | 15.41% |
| ICE BofA 0-3 Month U.S. Treasury Bill Index ∆ | 3.99% | 3.53% | 2.59% |
|
*
|
For the period from the commencement of the class's investment operations, October 2, 2017 through May 31, 2026.
|
|
∆
|
Source: FactSet Research Systems Inc.
|
Visit mfs.com/perf/r6 for more recent performance information.
FUND STATISTICS AS OF 5/31/26
| Net Assets ($): | 35,585,444 | Total Management Fee ($)#: | 124,322 | |
| Total Number of Holdings: | 15 | Portfolio Turnover Rate (%): | 11 |
# Includes the effect of any management fee waivers, if applicable.
PORTFOLIO COMPOSITION (BASED ON TOTAL NET ASSETS AS OF 5/31/26)
Portfolio structure
| Active Security Selection (a) |
Derivative Overlay Positions (b) |
Net Market Exposure (c) |
||
| Strategic Allocation | MFS International Equity Fund | 30.8% | ||
| MFS Growth Fund | 30.8% | |||
| MFS Value Fund | 30.1% | |||
| Market Exposure Overlay | Mini Russell 1000 Growth Future JUN 18 26 | (7.2)% | ||
| Mini Russell 1000 Value Index Future JUN 18 26 | (12.5)% | |||
| Mini MSCI EAFE Index Future JUN 19 26 | (12.7)% | |||
| Net Equity Exposure | 59.3% | |||
| Standard & Poor's 500 Index Option 6200.00 PUT JUN 18 26 | (0.1)% | |||
| Standard & Poor's 500 Index Option 5400.00 PUT SEP 18 26 | (0.3)% | |||
| Standard & Poor's 500 Index Option 5500.00 PUT DEC 18 26 | (0.5)% | |||
| Standard & Poors Index Option PUT(s) | (0.9)% | |||
| STOXX Europe 600 Price Index Option 490.00 PUT DEC 18 26 | 0.6% | |||
| STOXX Europe 600 Price Index Option 545.00 PUT DEC 18 26 | (1.4)% | |||
| STOXX Europe 600 Price Index PUT(s) | (0.8)% | |||
| Downside Hedge(s) | (1.7)% | |||
| Net Equivalent Equity Exposure | 92.3% | (34.7)% | 57.6% | |
| Limited Maturity U.S. Treasury Notes | 1.9% | |||
| Cash | Cash & Cash Equivalents (d) | 6.3% | ||
| Other (e) | 34.2% | |||
| Total Net Exposure Summary | 100.0% |
(a) Represents the actively managed portion of the portfolio and for purposes of this presentation, components include the value of securities, less any securities sold short. The bond component will include any accrued interest amounts. This also reflects the equivalent exposure of certain derivative positions. These amounts may be negative from time to time.
(b) Represents the tactical overlay portion of the portfolio which is how the fund manages its exposure to markets and currencies through the use of derivative positions. Percentages reflect the equivalent exposure of those derivative positions.
(c) For purposes of this presentation, the components include the value of securities, less any securities sold short, and reflect the impact of the equivalent exposure of all derivative positions. These amounts may be negative from time to time. The bond component will include any accrued interest amounts.
(d) Cash & Cash Equivalents includes any cash, investments in money market funds, short-term securities, and other assets less liabilities.
(e) Other includes currency derivatives and/or the offsetting of the leverage produced by derivative positions.
Portfolio Composition presents the value of securities, including equivalent exposure of derivative positions. Equivalent exposure is a reasonable approximation of the amount of the underlying asset the portfolio would have to hold to have the same price sensitivity of the derivative contract. Bonds include any accrued interest amounts.
Where the fund holds convertible bonds, they are treated as part of the equity portion of the portfolio.
(a) Represents the actively managed portion of the portfolio and for purposes of this presentation, components include the value of securities, less any securities sold short. The bond component will include any accrued interest amounts. This also reflects the equivalent exposure of certain derivative positions. These amounts may be negative from time to time.
(b) Represents the tactical overlay portion of the portfolio which is how the fund manages its exposure to markets and currencies through the use of derivative positions. Percentages reflect the equivalent exposure of those derivative positions.
(c) For purposes of this presentation, the components include the value of securities, less any securities sold short, and reflect the impact of the equivalent exposure of all derivative positions. These amounts may be negative from time to time. The bond component will include any accrued interest amounts.
(d) Cash & Cash Equivalents includes any cash, investments in money market funds, short-term securities, and other assets less liabilities.
(e) Other includes currency derivatives and/or the offsetting of the leverage produced by derivative positions.
Portfolio Composition presents the value of securities, including equivalent exposure of derivative positions. Equivalent exposure is a reasonable approximation of the amount of the underlying asset the portfolio would have to hold to have the same price sensitivity of the derivative contract. Bonds include any accrued interest amounts.
Where the fund holds convertible bonds, they are treated as part of the equity portion of the portfolio.
FUND EXPENSES
What were the fund costs for the last year?
| (based on a hypothetical $10,000 investment) | ||
| Class Name | Costs of a $10,000 investment ~ | Costs paid as a percentage of a $10,000 investment ~ |
| R4 | $68 | 0.67% |
˜ Expenses are direct expenses and do not include underlying fund fees and expenses.
MANAGEMENT'S DISCUSSION OF FUND PERFORMANCE
-
The MFS Managed Wealth Fund's (fund) investment objective is to seek total return. MFS seeks to achieve the fund’s objective by generating returns from (1) a strategic allocation to three MFS equity funds, referred to as underlying funds, and (2) a tactical asset allocation overlay primarily using derivative instruments to seek to decrease the volatility of the fund’s returns by reducing the fund’s exposure to the equity and/or currency markets as represented by the underlying funds and also to potentially expose the fund to asset classes and/or markets in which the underlying funds have little or no exposure. In addition, MFS may seek to limit the fund’s exposure to certain extreme market events. It is expected that the fund will generally have lower volatility than the overall equity market and will generally underperform the equity markets during periods of rising equity markets.
-
For the twelve months ended May 31, 2026, Class R4 shares of the fund provided a total return of 4.31%, at net asset value. This compares with a return of 29.78% for the fund’s benchmark, the Standard & Poor's 500 Stock Index. The fund's other benchmark, the ICE BofA 0-3 Month U.S. Treasury Bill Index, generated a return of 3.99%.
-
Global equity markets reached record levels during the period, withstanding considerable volatility amid tariffs, geopolitical conflict and high levels of uncertainty. A new geopolitical event distressed markets at the end of the period as US and Israeli forces launched strikes against Iran, disrupting Mideast oil and natural gas exports. During the period, a pro-growth tax and spending bill was signed into law in the US, while in Europe, renewed focus on defense and infrastructure spending brightened the economic outlook. In Japan, the election of a pro-growth prime minister sent stocks to new highs prior to the conflict in Iran. Optimism over artificial intelligence remained high.
-
Considerable progress was made in trade talks between the US and many major trading partners, with a fragile truce between the US and China extended through late 2026. While the US Supreme Court struck down part of the Trump administration’s tariff strategy, the administration began deploying other authorities to largely replace the ones that were ruled unconstitutional.
-
Early in the period, moderating inflation pressures allowed many global central banks to ease monetary policy. Amid a difficult policymaking environment and slower job growth, the Federal Reserve resumed easing policy in September and delivered quarter-point rate cuts in October and December before pausing.
-
In fixed income markets, previously range-bound global bond yields spiked following the onset of the Middle East conflict, as energy-driven inflation fears appeared to have rattled bond investors. US rate volatility (as measured by the Merrill Lynch Option Volatility Estimate (MOVE) Index) similarly rose from intra-period lows, reflecting uncertainty around the scope and duration of the conflict and its implications for global growth. However, volatility later retracted as the risk of a broader regional military escalation appeared less likely. Global credit spreads widened only modestly before stabilizing near prior levels, supported by strong demand and resilient underlying fundamentals.
-
Top contributors to absolute performance:
-
The fund's allocation to the MFS Growth Fund, MFS International Equity Fund, and the MFS Value Fund benefited performance.
-
-
Top detractors from absolute performance:
-
The fund's short exposure to futures contracts on the Russell 1000® Value Index, Russell 1000® Growth Index, and MSCI EAFE Index held back performance.
-
FUND PERFORMANCE
The fund’s past performance is not a good predictor of the fund’s future performance. The graph and table below do not reflect the deduction of taxes that a shareholder would pay on fund distributions or the redemption of fund shares. The graph and table below assume reinvestment of dividends and capital gain distributions.
Growth of a Hypothetical $10,000 Investment
This graph shows the performance of a hypothetical $10,000 investment in Class R4 over a ten year period or since inception, if shorter, in comparison to (i) a broad measure of market performance and (ii) an additional index that MFS believes corresponds to the fund’s investment strategies.
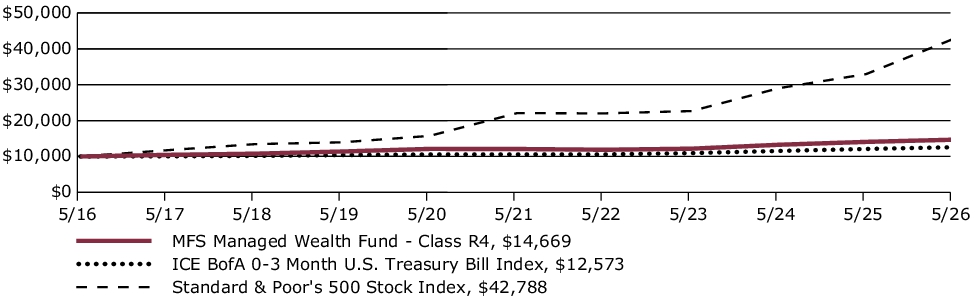
Average Annual Total Returns through 5/31/26
This table shows the average annual total returns of the class of shares noted for the periods shown, both with (if any) and without sales charges. It also shows the average annual total returns of (i) a broad measure of market performance and (ii) an additional index that MFS believes corresponds to the fund’s investment strategies, over the same periods.
| Share Class | 1-yr | 5-yr | 10-yr |
| R4 without sales charge | 4.31% | 3.96% | 3.91% |
| Comparative Benchmark(s) | |||
| Standard & Poor's 500 Stock Index ∆ | 29.78% | 14.15% | 15.65% |
| ICE BofA 0-3 Month U.S. Treasury Bill Index ∆ | 3.99% | 3.53% | 2.32% |
|
∆
|
Source: FactSet Research Systems Inc.
|
Visit mfs.com/perf/r4 for more recent performance information.
FUND STATISTICS AS OF 5/31/26
| Net Assets ($): | 35,585,444 | Total Management Fee ($)#: | 124,322 | |
| Total Number of Holdings: | 15 | Portfolio Turnover Rate (%): | 11 |
# Includes the effect of any management fee waivers, if applicable.
PORTFOLIO COMPOSITION (BASED ON TOTAL NET ASSETS AS OF 5/31/26)
Portfolio structure
| Active Security Selection (a) |
Derivative Overlay Positions (b) |
Net Market Exposure (c) |
||
| Strategic Allocation | MFS International Equity Fund | 30.8% | ||
| MFS Growth Fund | 30.8% | |||
| MFS Value Fund | 30.1% | |||
| Market Exposure Overlay | Mini Russell 1000 Growth Future JUN 18 26 | (7.2)% | ||
| Mini Russell 1000 Value Index Future JUN 18 26 | (12.5)% | |||
| Mini MSCI EAFE Index Future JUN 19 26 | (12.7)% | |||
| Net Equity Exposure | 59.3% | |||
| Standard & Poor's 500 Index Option 6200.00 PUT JUN 18 26 | (0.1)% | |||
| Standard & Poor's 500 Index Option 5400.00 PUT SEP 18 26 | (0.3)% | |||
| Standard & Poor's 500 Index Option 5500.00 PUT DEC 18 26 | (0.5)% | |||
| Standard & Poors Index Option PUT(s) | (0.9)% | |||
| STOXX Europe 600 Price Index Option 490.00 PUT DEC 18 26 | 0.6% | |||
| STOXX Europe 600 Price Index Option 545.00 PUT DEC 18 26 | (1.4)% | |||
| STOXX Europe 600 Price Index PUT(s) | (0.8)% | |||
| Downside Hedge(s) | (1.7)% | |||
| Net Equivalent Equity Exposure | 92.3% | (34.7)% | 57.6% | |
| Limited Maturity U.S. Treasury Notes | 1.9% | |||
| Cash | Cash & Cash Equivalents (d) | 6.3% | ||
| Other (e) | 34.2% | |||
| Total Net Exposure Summary | 100.0% |
(a) Represents the actively managed portion of the portfolio and for purposes of this presentation, components include the value of securities, less any securities sold short. The bond component will include any accrued interest amounts. This also reflects the equivalent exposure of certain derivative positions. These amounts may be negative from time to time.
(b) Represents the tactical overlay portion of the portfolio which is how the fund manages its exposure to markets and currencies through the use of derivative positions. Percentages reflect the equivalent exposure of those derivative positions.
(c) For purposes of this presentation, the components include the value of securities, less any securities sold short, and reflect the impact of the equivalent exposure of all derivative positions. These amounts may be negative from time to time. The bond component will include any accrued interest amounts.
(d) Cash & Cash Equivalents includes any cash, investments in money market funds, short-term securities, and other assets less liabilities.
(e) Other includes currency derivatives and/or the offsetting of the leverage produced by derivative positions.
Portfolio Composition presents the value of securities, including equivalent exposure of derivative positions. Equivalent exposure is a reasonable approximation of the amount of the underlying asset the portfolio would have to hold to have the same price sensitivity of the derivative contract. Bonds include any accrued interest amounts.
Where the fund holds convertible bonds, they are treated as part of the equity portion of the portfolio.
(a) Represents the actively managed portion of the portfolio and for purposes of this presentation, components include the value of securities, less any securities sold short. The bond component will include any accrued interest amounts. This also reflects the equivalent exposure of certain derivative positions. These amounts may be negative from time to time.
(b) Represents the tactical overlay portion of the portfolio which is how the fund manages its exposure to markets and currencies through the use of derivative positions. Percentages reflect the equivalent exposure of those derivative positions.
(c) For purposes of this presentation, the components include the value of securities, less any securities sold short, and reflect the impact of the equivalent exposure of all derivative positions. These amounts may be negative from time to time. The bond component will include any accrued interest amounts.
(d) Cash & Cash Equivalents includes any cash, investments in money market funds, short-term securities, and other assets less liabilities.
(e) Other includes currency derivatives and/or the offsetting of the leverage produced by derivative positions.
Portfolio Composition presents the value of securities, including equivalent exposure of derivative positions. Equivalent exposure is a reasonable approximation of the amount of the underlying asset the portfolio would have to hold to have the same price sensitivity of the derivative contract. Bonds include any accrued interest amounts.
Where the fund holds convertible bonds, they are treated as part of the equity portion of the portfolio.
FUND EXPENSES
What were the fund costs for the last year?
| (based on a hypothetical $10,000 investment) | ||
| Class Name | Costs of a $10,000 investment ~ | Costs paid as a percentage of a $10,000 investment ~ |
| R3 | $94 | 0.92% |
˜ Expenses are direct expenses and do not include underlying fund fees and expenses.
MANAGEMENT'S DISCUSSION OF FUND PERFORMANCE
-
The MFS Managed Wealth Fund's (fund) investment objective is to seek total return. MFS seeks to achieve the fund’s objective by generating returns from (1) a strategic allocation to three MFS equity funds, referred to as underlying funds, and (2) a tactical asset allocation overlay primarily using derivative instruments to seek to decrease the volatility of the fund’s returns by reducing the fund’s exposure to the equity and/or currency markets as represented by the underlying funds and also to potentially expose the fund to asset classes and/or markets in which the underlying funds have little or no exposure. In addition, MFS may seek to limit the fund’s exposure to certain extreme market events. It is expected that the fund will generally have lower volatility than the overall equity market and will generally underperform the equity markets during periods of rising equity markets.
-
For the twelve months ended May 31, 2026, Class R3 shares of the fund provided a total return of 3.93%, at net asset value. This compares with a return of 29.78% for the fund’s benchmark, the Standard & Poor's 500 Stock Index. The fund's other benchmark, the ICE BofA 0-3 Month U.S. Treasury Bill Index, generated a return of 3.99%.
-
Global equity markets reached record levels during the period, withstanding considerable volatility amid tariffs, geopolitical conflict and high levels of uncertainty. A new geopolitical event distressed markets at the end of the period as US and Israeli forces launched strikes against Iran, disrupting Mideast oil and natural gas exports. During the period, a pro-growth tax and spending bill was signed into law in the US, while in Europe, renewed focus on defense and infrastructure spending brightened the economic outlook. In Japan, the election of a pro-growth prime minister sent stocks to new highs prior to the conflict in Iran. Optimism over artificial intelligence remained high.
-
Considerable progress was made in trade talks between the US and many major trading partners, with a fragile truce between the US and China extended through late 2026. While the US Supreme Court struck down part of the Trump administration’s tariff strategy, the administration began deploying other authorities to largely replace the ones that were ruled unconstitutional.
-
Early in the period, moderating inflation pressures allowed many global central banks to ease monetary policy. Amid a difficult policymaking environment and slower job growth, the Federal Reserve resumed easing policy in September and delivered quarter-point rate cuts in October and December before pausing.
-
In fixed income markets, previously range-bound global bond yields spiked following the onset of the Middle East conflict, as energy-driven inflation fears appeared to have rattled bond investors. US rate volatility (as measured by the Merrill Lynch Option Volatility Estimate (MOVE) Index) similarly rose from intra-period lows, reflecting uncertainty around the scope and duration of the conflict and its implications for global growth. However, volatility later retracted as the risk of a broader regional military escalation appeared less likely. Global credit spreads widened only modestly before stabilizing near prior levels, supported by strong demand and resilient underlying fundamentals.
-
Top contributors to absolute performance:
-
The fund's allocation to the MFS Growth Fund, MFS International Equity Fund, and the MFS Value Fund benefited performance.
-
-
Top detractors from absolute performance:
-
The fund's short exposure to futures contracts on the Russell 1000® Value Index, Russell 1000® Growth Index, and MSCI EAFE Index held back performance.
-
FUND PERFORMANCE
The fund’s past performance is not a good predictor of the fund’s future performance. The graph and table below do not reflect the deduction of taxes that a shareholder would pay on fund distributions or the redemption of fund shares. The graph and table below assume reinvestment of dividends and capital gain distributions.
Growth of a Hypothetical $10,000 Investment
This graph shows the performance of a hypothetical $10,000 investment in Class R3 over a ten year period or since inception, if shorter, in comparison to (i) a broad measure of market performance and (ii) an additional index that MFS believes corresponds to the fund’s investment strategies.
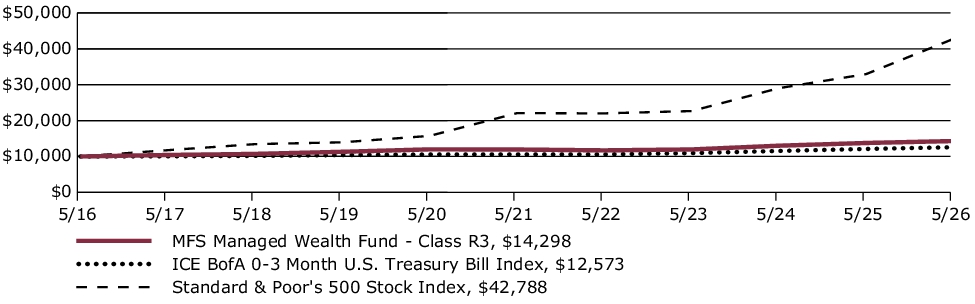
Average Annual Total Returns through 5/31/26
This table shows the average annual total returns of the class of shares noted for the periods shown, both with (if any) and without sales charges. It also shows the average annual total returns of (i) a broad measure of market performance and (ii) an additional index that MFS believes corresponds to the fund’s investment strategies, over the same periods.
| Share Class | 1-yr | 5-yr | 10-yr |
| R3 without sales charge | 3.93% | 3.68% | 3.64% |
| Comparative Benchmark(s) | |||
| Standard & Poor's 500 Stock Index ∆ | 29.78% | 14.15% | 15.65% |
| ICE BofA 0-3 Month U.S. Treasury Bill Index ∆ | 3.99% | 3.53% | 2.32% |
|
∆
|
Source: FactSet Research Systems Inc.
|
Visit mfs.com/perf/r3 for more recent performance information.
FUND STATISTICS AS OF 5/31/26
| Net Assets ($): | 35,585,444 | Total Management Fee ($)#: | 124,322 | |
| Total Number of Holdings: | 15 | Portfolio Turnover Rate (%): | 11 |
# Includes the effect of any management fee waivers, if applicable.
PORTFOLIO COMPOSITION (BASED ON TOTAL NET ASSETS AS OF 5/31/26)
Portfolio structure
| Active Security Selection (a) |
Derivative Overlay Positions (b) |
Net Market Exposure (c) |
||
| Strategic Allocation | MFS International Equity Fund | 30.8% | ||
| MFS Growth Fund | 30.8% | |||
| MFS Value Fund | 30.1% | |||
| Market Exposure Overlay | Mini Russell 1000 Growth Future JUN 18 26 | (7.2)% | ||
| Mini Russell 1000 Value Index Future JUN 18 26 | (12.5)% | |||
| Mini MSCI EAFE Index Future JUN 19 26 | (12.7)% | |||
| Net Equity Exposure | 59.3% | |||
| Standard & Poor's 500 Index Option 6200.00 PUT JUN 18 26 | (0.1)% | |||
| Standard & Poor's 500 Index Option 5400.00 PUT SEP 18 26 | (0.3)% | |||
| Standard & Poor's 500 Index Option 5500.00 PUT DEC 18 26 | (0.5)% | |||
| Standard & Poors Index Option PUT(s) | (0.9)% | |||
| STOXX Europe 600 Price Index Option 490.00 PUT DEC 18 26 | 0.6% | |||
| STOXX Europe 600 Price Index Option 545.00 PUT DEC 18 26 | (1.4)% | |||
| STOXX Europe 600 Price Index PUT(s) | (0.8)% | |||
| Downside Hedge(s) | (1.7)% | |||
| Net Equivalent Equity Exposure | 92.3% | (34.7)% | 57.6% | |
| Limited Maturity U.S. Treasury Notes | 1.9% | |||
| Cash | Cash & Cash Equivalents (d) | 6.3% | ||
| Other (e) | 34.2% | |||
| Total Net Exposure Summary | 100.0% |
(a) Represents the actively managed portion of the portfolio and for purposes of this presentation, components include the value of securities, less any securities sold short. The bond component will include any accrued interest amounts. This also reflects the equivalent exposure of certain derivative positions. These amounts may be negative from time to time.
(b) Represents the tactical overlay portion of the portfolio which is how the fund manages its exposure to markets and currencies through the use of derivative positions. Percentages reflect the equivalent exposure of those derivative positions.
(c) For purposes of this presentation, the components include the value of securities, less any securities sold short, and reflect the impact of the equivalent exposure of all derivative positions. These amounts may be negative from time to time. The bond component will include any accrued interest amounts.
(d) Cash & Cash Equivalents includes any cash, investments in money market funds, short-term securities, and other assets less liabilities.
(e) Other includes currency derivatives and/or the offsetting of the leverage produced by derivative positions.
Portfolio Composition presents the value of securities, including equivalent exposure of derivative positions. Equivalent exposure is a reasonable approximation of the amount of the underlying asset the portfolio would have to hold to have the same price sensitivity of the derivative contract. Bonds include any accrued interest amounts.
Where the fund holds convertible bonds, they are treated as part of the equity portion of the portfolio.
(a) Represents the actively managed portion of the portfolio and for purposes of this presentation, components include the value of securities, less any securities sold short. The bond component will include any accrued interest amounts. This also reflects the equivalent exposure of certain derivative positions. These amounts may be negative from time to time.
(b) Represents the tactical overlay portion of the portfolio which is how the fund manages its exposure to markets and currencies through the use of derivative positions. Percentages reflect the equivalent exposure of those derivative positions.
(c) For purposes of this presentation, the components include the value of securities, less any securities sold short, and reflect the impact of the equivalent exposure of all derivative positions. These amounts may be negative from time to time. The bond component will include any accrued interest amounts.
(d) Cash & Cash Equivalents includes any cash, investments in money market funds, short-term securities, and other assets less liabilities.
(e) Other includes currency derivatives and/or the offsetting of the leverage produced by derivative positions.
Portfolio Composition presents the value of securities, including equivalent exposure of derivative positions. Equivalent exposure is a reasonable approximation of the amount of the underlying asset the portfolio would have to hold to have the same price sensitivity of the derivative contract. Bonds include any accrued interest amounts.
Where the fund holds convertible bonds, they are treated as part of the equity portion of the portfolio.
FUND EXPENSES
What were the fund costs for the last year?
| (based on a hypothetical $10,000 investment) | ||
| Class Name | Costs of a $10,000 investment ~ | Costs paid as a percentage of a $10,000 investment ~ |
| R2 | $119 | 1.17% |
˜ Expenses are direct expenses and do not include underlying fund fees and expenses.
MANAGEMENT'S DISCUSSION OF FUND PERFORMANCE
-
The MFS Managed Wealth Fund's (fund) investment objective is to seek total return. MFS seeks to achieve the fund’s objective by generating returns from (1) a strategic allocation to three MFS equity funds, referred to as underlying funds, and (2) a tactical asset allocation overlay primarily using derivative instruments to seek to decrease the volatility of the fund’s returns by reducing the fund’s exposure to the equity and/or currency markets as represented by the underlying funds and also to potentially expose the fund to asset classes and/or markets in which the underlying funds have little or no exposure. In addition, MFS may seek to limit the fund’s exposure to certain extreme market events. It is expected that the fund will generally have lower volatility than the overall equity market and will generally underperform the equity markets during periods of rising equity markets.
-
For the twelve months ended May 31, 2026, Class R2 shares of the fund provided a total return of 3.73%, at net asset value. This compares with a return of 29.78% for the fund’s benchmark, the Standard & Poor's 500 Stock Index. The fund's other benchmark, the ICE BofA 0-3 Month U.S. Treasury Bill Index, generated a return of 3.99%.
-
Global equity markets reached record levels during the period, withstanding considerable volatility amid tariffs, geopolitical conflict and high levels of uncertainty. A new geopolitical event distressed markets at the end of the period as US and Israeli forces launched strikes against Iran, disrupting Mideast oil and natural gas exports. During the period, a pro-growth tax and spending bill was signed into law in the US, while in Europe, renewed focus on defense and infrastructure spending brightened the economic outlook. In Japan, the election of a pro-growth prime minister sent stocks to new highs prior to the conflict in Iran. Optimism over artificial intelligence remained high.
-
Considerable progress was made in trade talks between the US and many major trading partners, with a fragile truce between the US and China extended through late 2026. While the US Supreme Court struck down part of the Trump administration’s tariff strategy, the administration began deploying other authorities to largely replace the ones that were ruled unconstitutional.
-
Early in the period, moderating inflation pressures allowed many global central banks to ease monetary policy. Amid a difficult policymaking environment and slower job growth, the Federal Reserve resumed easing policy in September and delivered quarter-point rate cuts in October and December before pausing.
-
In fixed income markets, previously range-bound global bond yields spiked following the onset of the Middle East conflict, as energy-driven inflation fears appeared to have rattled bond investors. US rate volatility (as measured by the Merrill Lynch Option Volatility Estimate (MOVE) Index) similarly rose from intra-period lows, reflecting uncertainty around the scope and duration of the conflict and its implications for global growth. However, volatility later retracted as the risk of a broader regional military escalation appeared less likely. Global credit spreads widened only modestly before stabilizing near prior levels, supported by strong demand and resilient underlying fundamentals.
-
Top contributors to absolute performance:
-
The fund's allocation to the MFS Growth Fund, MFS International Equity Fund, and the MFS Value Fund benefited performance.
-
-
Top detractors from absolute performance:
-
The fund's short exposure to futures contracts on the Russell 1000® Value Index, Russell 1000® Growth Index, and MSCI EAFE Index held back performance.
-
FUND PERFORMANCE
The fund’s past performance is not a good predictor of the fund’s future performance. The graph and table below do not reflect the deduction of taxes that a shareholder would pay on fund distributions or the redemption of fund shares. The graph and table below assume reinvestment of dividends and capital gain distributions.
Growth of a Hypothetical $10,000 Investment
This graph shows the performance of a hypothetical $10,000 investment in Class R2 over a ten year period or since inception, if shorter, in comparison to (i) a broad measure of market performance and (ii) an additional index that MFS believes corresponds to the fund’s investment strategies.
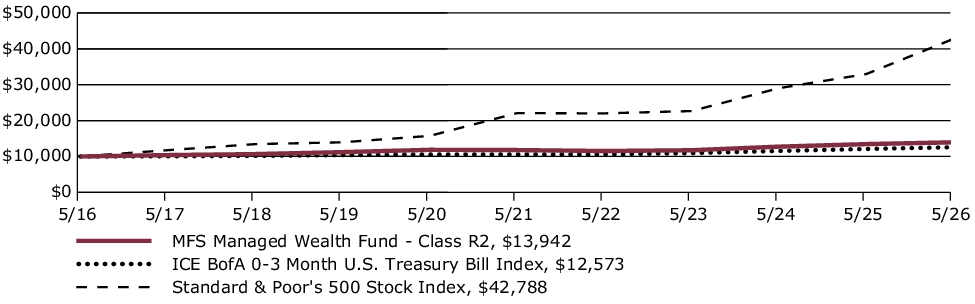
Average Annual Total Returns through 5/31/26
This table shows the average annual total returns of the class of shares noted for the periods shown, both with (if any) and without sales charges. It also shows the average annual total returns of (i) a broad measure of market performance and (ii) an additional index that MFS believes corresponds to the fund’s investment strategies, over the same periods.
| Share Class | 1-yr | 5-yr | 10-yr |
| R2 without sales charge | 3.73% | 3.43% | 3.38% |
| Comparative Benchmark(s) | |||
| Standard & Poor's 500 Stock Index ∆ | 29.78% | 14.15% | 15.65% |
| ICE BofA 0-3 Month U.S. Treasury Bill Index ∆ | 3.99% | 3.53% | 2.32% |
|
∆
|
Source: FactSet Research Systems Inc.
|
Visit mfs.com/perf/r2 for more recent performance information.
FUND STATISTICS AS OF 5/31/26
| Net Assets ($): | 35,585,444 | Total Management Fee ($)#: | 124,322 | |
| Total Number of Holdings: | 15 | Portfolio Turnover Rate (%): | 11 |
# Includes the effect of any management fee waivers, if applicable.
PORTFOLIO COMPOSITION (BASED ON TOTAL NET ASSETS AS OF 5/31/26)
Portfolio structure
| Active Security Selection (a) |
Derivative Overlay Positions (b) |
Net Market Exposure (c) |
||
| Strategic Allocation | MFS International Equity Fund | 30.8% | ||
| MFS Growth Fund | 30.8% | |||
| MFS Value Fund | 30.1% | |||
| Market Exposure Overlay | Mini Russell 1000 Growth Future JUN 18 26 | (7.2)% | ||
| Mini Russell 1000 Value Index Future JUN 18 26 | (12.5)% | |||
| Mini MSCI EAFE Index Future JUN 19 26 | (12.7)% | |||
| Net Equity Exposure | 59.3% | |||
| Standard & Poor's 500 Index Option 6200.00 PUT JUN 18 26 | (0.1)% | |||
| Standard & Poor's 500 Index Option 5400.00 PUT SEP 18 26 | (0.3)% | |||
| Standard & Poor's 500 Index Option 5500.00 PUT DEC 18 26 | (0.5)% | |||
| Standard & Poors Index Option PUT(s) | (0.9)% | |||
| STOXX Europe 600 Price Index Option 490.00 PUT DEC 18 26 | 0.6% | |||
| STOXX Europe 600 Price Index Option 545.00 PUT DEC 18 26 | (1.4)% | |||
| STOXX Europe 600 Price Index PUT(s) | (0.8)% | |||
| Downside Hedge(s) | (1.7)% | |||
| Net Equivalent Equity Exposure | 92.3% | (34.7)% | 57.6% | |
| Limited Maturity U.S. Treasury Notes | 1.9% | |||
| Cash | Cash & Cash Equivalents (d) | 6.3% | ||
| Other (e) | 34.2% | |||
| Total Net Exposure Summary | 100.0% |
(a) Represents the actively managed portion of the portfolio and for purposes of this presentation, components include the value of securities, less any securities sold short. The bond component will include any accrued interest amounts. This also reflects the equivalent exposure of certain derivative positions. These amounts may be negative from time to time.
(b) Represents the tactical overlay portion of the portfolio which is how the fund manages its exposure to markets and currencies through the use of derivative positions. Percentages reflect the equivalent exposure of those derivative positions.
(c) For purposes of this presentation, the components include the value of securities, less any securities sold short, and reflect the impact of the equivalent exposure of all derivative positions. These amounts may be negative from time to time. The bond component will include any accrued interest amounts.
(d) Cash & Cash Equivalents includes any cash, investments in money market funds, short-term securities, and other assets less liabilities.
(e) Other includes currency derivatives and/or the offsetting of the leverage produced by derivative positions.
Portfolio Composition presents the value of securities, including equivalent exposure of derivative positions. Equivalent exposure is a reasonable approximation of the amount of the underlying asset the portfolio would have to hold to have the same price sensitivity of the derivative contract. Bonds include any accrued interest amounts.
Where the fund holds convertible bonds, they are treated as part of the equity portion of the portfolio.
(a) Represents the actively managed portion of the portfolio and for purposes of this presentation, components include the value of securities, less any securities sold short. The bond component will include any accrued interest amounts. This also reflects the equivalent exposure of certain derivative positions. These amounts may be negative from time to time.
(b) Represents the tactical overlay portion of the portfolio which is how the fund manages its exposure to markets and currencies through the use of derivative positions. Percentages reflect the equivalent exposure of those derivative positions.
(c) For purposes of this presentation, the components include the value of securities, less any securities sold short, and reflect the impact of the equivalent exposure of all derivative positions. These amounts may be negative from time to time. The bond component will include any accrued interest amounts.
(d) Cash & Cash Equivalents includes any cash, investments in money market funds, short-term securities, and other assets less liabilities.
(e) Other includes currency derivatives and/or the offsetting of the leverage produced by derivative positions.
Portfolio Composition presents the value of securities, including equivalent exposure of derivative positions. Equivalent exposure is a reasonable approximation of the amount of the underlying asset the portfolio would have to hold to have the same price sensitivity of the derivative contract. Bonds include any accrued interest amounts.
Where the fund holds convertible bonds, they are treated as part of the equity portion of the portfolio.
FUND EXPENSES
What were the fund costs for the last year?
| (based on a hypothetical $10,000 investment) | ||
| Class Name | Costs of a $10,000 investment ~ | Costs paid as a percentage of a $10,000 investment ~ |
| R1 | $170 | 1.67% |
˜ Expenses are direct expenses and do not include underlying fund fees and expenses.
MANAGEMENT'S DISCUSSION OF FUND PERFORMANCE
-
The MFS Managed Wealth Fund's (fund) investment objective is to seek total return. MFS seeks to achieve the fund’s objective by generating returns from (1) a strategic allocation to three MFS equity funds, referred to as underlying funds, and (2) a tactical asset allocation overlay primarily using derivative instruments to seek to decrease the volatility of the fund’s returns by reducing the fund’s exposure to the equity and/or currency markets as represented by the underlying funds and also to potentially expose the fund to asset classes and/or markets in which the underlying funds have little or no exposure. In addition, MFS may seek to limit the fund’s exposure to certain extreme market events. It is expected that the fund will generally have lower volatility than the overall equity market and will generally underperform the equity markets during periods of rising equity markets.
-
For the twelve months ended May 31, 2026, Class R1 shares of the fund provided a total return of 3.23%, at net asset value. This compares with a return of 29.78% for the fund’s benchmark, the Standard & Poor's 500 Stock Index. The fund's other benchmark, the ICE BofA 0-3 Month U.S. Treasury Bill Index, generated a return of 3.99%.
-
Global equity markets reached record levels during the period, withstanding considerable volatility amid tariffs, geopolitical conflict and high levels of uncertainty. A new geopolitical event distressed markets at the end of the period as US and Israeli forces launched strikes against Iran, disrupting Mideast oil and natural gas exports. During the period, a pro-growth tax and spending bill was signed into law in the US, while in Europe, renewed focus on defense and infrastructure spending brightened the economic outlook. In Japan, the election of a pro-growth prime minister sent stocks to new highs prior to the conflict in Iran. Optimism over artificial intelligence remained high.
-
Considerable progress was made in trade talks between the US and many major trading partners, with a fragile truce between the US and China extended through late 2026. While the US Supreme Court struck down part of the Trump administration’s tariff strategy, the administration began deploying other authorities to largely replace the ones that were ruled unconstitutional.
-
Early in the period, moderating inflation pressures allowed many global central banks to ease monetary policy. Amid a difficult policymaking environment and slower job growth, the Federal Reserve resumed easing policy in September and delivered quarter-point rate cuts in October and December before pausing.
-
In fixed income markets, previously range-bound global bond yields spiked following the onset of the Middle East conflict, as energy-driven inflation fears appeared to have rattled bond investors. US rate volatility (as measured by the Merrill Lynch Option Volatility Estimate (MOVE) Index) similarly rose from intra-period lows, reflecting uncertainty around the scope and duration of the conflict and its implications for global growth. However, volatility later retracted as the risk of a broader regional military escalation appeared less likely. Global credit spreads widened only modestly before stabilizing near prior levels, supported by strong demand and resilient underlying fundamentals.
-
Top contributors to absolute performance:
-
The fund's allocation to the MFS Growth Fund, MFS International Equity Fund, and the MFS Value Fund benefited performance.
-
-
Top detractors from absolute performance:
-
The fund's short exposure to futures contracts on the Russell 1000® Value Index, Russell 1000® Growth Index, and MSCI EAFE Index held back performance.
-
FUND PERFORMANCE
The fund’s past performance is not a good predictor of the fund’s future performance. The graph and table below do not reflect the deduction of taxes that a shareholder would pay on fund distributions or the redemption of fund shares. The graph and table below assume reinvestment of dividends and capital gain distributions.
Growth of a Hypothetical $10,000 Investment
This graph shows the performance of a hypothetical $10,000 investment in Class R1 over a ten year period or since inception, if shorter, in comparison to (i) a broad measure of market performance and (ii) an additional index that MFS believes corresponds to the fund’s investment strategies.
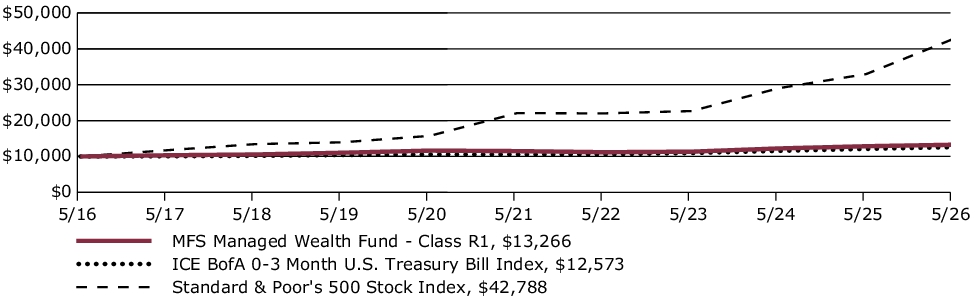
Average Annual Total Returns through 5/31/26
This table shows the average annual total returns of the class of shares noted for the periods shown, both with (if any) and without sales charges. It also shows the average annual total returns of (i) a broad measure of market performance and (ii) an additional index that MFS believes corresponds to the fund’s investment strategies, over the same periods.
| Share Class | 1-yr | 5-yr | 10-yr |
| R1 without sales charge | 3.23% | 2.92% | 2.87% |
| Comparative Benchmark(s) | |||
| Standard & Poor's 500 Stock Index ∆ | 29.78% | 14.15% | 15.65% |
| ICE BofA 0-3 Month U.S. Treasury Bill Index ∆ | 3.99% | 3.53% | 2.32% |
|
∆
|
Source: FactSet Research Systems Inc.
|
Visit mfs.com/perf/r1 for more recent performance information.
FUND STATISTICS AS OF 5/31/26
| Net Assets ($): | 35,585,444 | Total Management Fee ($)#: | 124,322 | |
| Total Number of Holdings: | 15 | Portfolio Turnover Rate (%): | 11 |
# Includes the effect of any management fee waivers, if applicable.
PORTFOLIO COMPOSITION (BASED ON TOTAL NET ASSETS AS OF 5/31/26)
Portfolio structure
| Active Security Selection (a) |
Derivative Overlay Positions (b) |
Net Market Exposure (c) |
||
| Strategic Allocation | MFS International Equity Fund | 30.8% | ||
| MFS Growth Fund | 30.8% | |||
| MFS Value Fund | 30.1% | |||
| Market Exposure Overlay | Mini Russell 1000 Growth Future JUN 18 26 | (7.2)% | ||
| Mini Russell 1000 Value Index Future JUN 18 26 | (12.5)% | |||
| Mini MSCI EAFE Index Future JUN 19 26 | (12.7)% | |||
| Net Equity Exposure | 59.3% | |||
| Standard & Poor's 500 Index Option 6200.00 PUT JUN 18 26 | (0.1)% | |||
| Standard & Poor's 500 Index Option 5400.00 PUT SEP 18 26 | (0.3)% | |||
| Standard & Poor's 500 Index Option 5500.00 PUT DEC 18 26 | (0.5)% | |||
| Standard & Poors Index Option PUT(s) | (0.9)% | |||
| STOXX Europe 600 Price Index Option 490.00 PUT DEC 18 26 | 0.6% | |||
| STOXX Europe 600 Price Index Option 545.00 PUT DEC 18 26 | (1.4)% | |||
| STOXX Europe 600 Price Index PUT(s) | (0.8)% | |||
| Downside Hedge(s) | (1.7)% | |||
| Net Equivalent Equity Exposure | 92.3% | (34.7)% | 57.6% | |
| Limited Maturity U.S. Treasury Notes | 1.9% | |||
| Cash | Cash & Cash Equivalents (d) | 6.3% | ||
| Other (e) | 34.2% | |||
| Total Net Exposure Summary | 100.0% |
(a) Represents the actively managed portion of the portfolio and for purposes of this presentation, components include the value of securities, less any securities sold short. The bond component will include any accrued interest amounts. This also reflects the equivalent exposure of certain derivative positions. These amounts may be negative from time to time.
(b) Represents the tactical overlay portion of the portfolio which is how the fund manages its exposure to markets and currencies through the use of derivative positions. Percentages reflect the equivalent exposure of those derivative positions.
(c) For purposes of this presentation, the components include the value of securities, less any securities sold short, and reflect the impact of the equivalent exposure of all derivative positions. These amounts may be negative from time to time. The bond component will include any accrued interest amounts.
(d) Cash & Cash Equivalents includes any cash, investments in money market funds, short-term securities, and other assets less liabilities.
(e) Other includes currency derivatives and/or the offsetting of the leverage produced by derivative positions.
Portfolio Composition presents the value of securities, including equivalent exposure of derivative positions. Equivalent exposure is a reasonable approximation of the amount of the underlying asset the portfolio would have to hold to have the same price sensitivity of the derivative contract. Bonds include any accrued interest amounts.
Where the fund holds convertible bonds, they are treated as part of the equity portion of the portfolio.
(a) Represents the actively managed portion of the portfolio and for purposes of this presentation, components include the value of securities, less any securities sold short. The bond component will include any accrued interest amounts. This also reflects the equivalent exposure of certain derivative positions. These amounts may be negative from time to time.
(b) Represents the tactical overlay portion of the portfolio which is how the fund manages its exposure to markets and currencies through the use of derivative positions. Percentages reflect the equivalent exposure of those derivative positions.
(c) For purposes of this presentation, the components include the value of securities, less any securities sold short, and reflect the impact of the equivalent exposure of all derivative positions. These amounts may be negative from time to time. The bond component will include any accrued interest amounts.
(d) Cash & Cash Equivalents includes any cash, investments in money market funds, short-term securities, and other assets less liabilities.
(e) Other includes currency derivatives and/or the offsetting of the leverage produced by derivative positions.
Portfolio Composition presents the value of securities, including equivalent exposure of derivative positions. Equivalent exposure is a reasonable approximation of the amount of the underlying asset the portfolio would have to hold to have the same price sensitivity of the derivative contract. Bonds include any accrued interest amounts.
Where the fund holds convertible bonds, they are treated as part of the equity portion of the portfolio.
FUND EXPENSES
What were the fund costs for the last year?
| (based on a hypothetical $10,000 investment) | ||
| Class Name | Costs of a $10,000 investment ~ | Costs paid as a percentage of a $10,000 investment ~ |
| I | $68 | 0.67% |
˜ Expenses are direct expenses and do not include underlying fund fees and expenses.
MANAGEMENT'S DISCUSSION OF FUND PERFORMANCE
-
The MFS Managed Wealth Fund's (fund) investment objective is to seek total return. MFS seeks to achieve the fund’s objective by generating returns from (1) a strategic allocation to three MFS equity funds, referred to as underlying funds, and (2) a tactical asset allocation overlay primarily using derivative instruments to seek to decrease the volatility of the fund’s returns by reducing the fund’s exposure to the equity and/or currency markets as represented by the underlying funds and also to potentially expose the fund to asset classes and/or markets in which the underlying funds have little or no exposure. In addition, MFS may seek to limit the fund’s exposure to certain extreme market events. It is expected that the fund will generally have lower volatility than the overall equity market and will generally underperform the equity markets during periods of rising equity markets.
-
For the twelve months ended May 31, 2026, Class I shares of the fund provided a total return of 4.31%, at net asset value. This compares with a return of 29.78% for the fund’s benchmark, the Standard & Poor's 500 Stock Index. The fund's other benchmark, the ICE BofA 0-3 Month U.S. Treasury Bill Index, generated a return of 3.99%.
-
Global equity markets reached record levels during the period, withstanding considerable volatility amid tariffs, geopolitical conflict and high levels of uncertainty. A new geopolitical event distressed markets at the end of the period as US and Israeli forces launched strikes against Iran, disrupting Mideast oil and natural gas exports. During the period, a pro-growth tax and spending bill was signed into law in the US, while in Europe, renewed focus on defense and infrastructure spending brightened the economic outlook. In Japan, the election of a pro-growth prime minister sent stocks to new highs prior to the conflict in Iran. Optimism over artificial intelligence remained high.
-
Considerable progress was made in trade talks between the US and many major trading partners, with a fragile truce between the US and China extended through late 2026. While the US Supreme Court struck down part of the Trump administration’s tariff strategy, the administration began deploying other authorities to largely replace the ones that were ruled unconstitutional.
-
Early in the period, moderating inflation pressures allowed many global central banks to ease monetary policy. Amid a difficult policymaking environment and slower job growth, the Federal Reserve resumed easing policy in September and delivered quarter-point rate cuts in October and December before pausing.
-
In fixed income markets, previously range-bound global bond yields spiked following the onset of the Middle East conflict, as energy-driven inflation fears appeared to have rattled bond investors. US rate volatility (as measured by the Merrill Lynch Option Volatility Estimate (MOVE) Index) similarly rose from intra-period lows, reflecting uncertainty around the scope and duration of the conflict and its implications for global growth. However, volatility later retracted as the risk of a broader regional military escalation appeared less likely. Global credit spreads widened only modestly before stabilizing near prior levels, supported by strong demand and resilient underlying fundamentals.
-
Top contributors to absolute performance:
-
The fund's allocation to the MFS Growth Fund, MFS International Equity Fund, and the MFS Value Fund benefited performance.
-
-
Top detractors from absolute performance:
-
The fund's short exposure to futures contracts on the Russell 1000® Value Index, Russell 1000® Growth Index, and MSCI EAFE Index held back performance.
-
FUND PERFORMANCE
The fund’s past performance is not a good predictor of the fund’s future performance. The graph and table below do not reflect the deduction of taxes that a shareholder would pay on fund distributions or the redemption of fund shares. The graph and table below assume reinvestment of dividends and capital gain distributions.
Growth of a Hypothetical $10,000 Investment
This graph shows the performance of a hypothetical $10,000 investment in Class I over a ten year period or since inception, if shorter, in comparison to (i) a broad measure of market performance and (ii) an additional index that MFS believes corresponds to the fund’s investment strategies.
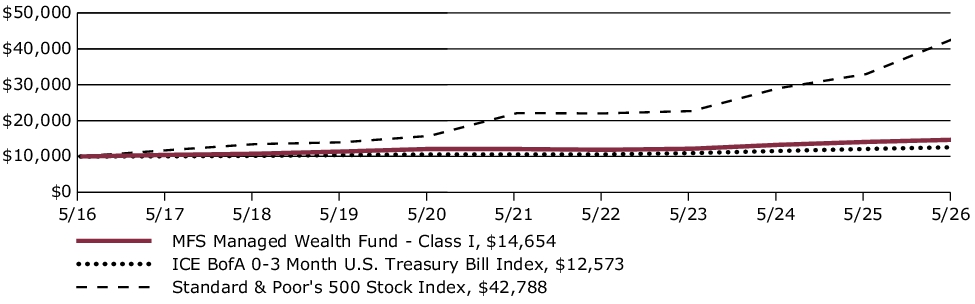
Average Annual Total Returns through 5/31/26
This table shows the average annual total returns of the class of shares noted for the periods shown, both with (if any) and without sales charges. It also shows the average annual total returns of (i) a broad measure of market performance and (ii) an additional index that MFS believes corresponds to the fund’s investment strategies, over the same periods.
| Share Class | 1-yr | 5-yr | 10-yr |
| I without sales charge | 4.31% | 3.96% | 3.90% |
| Comparative Benchmark(s) | |||
| Standard & Poor's 500 Stock Index ∆ | 29.78% | 14.15% | 15.65% |
| ICE BofA 0-3 Month U.S. Treasury Bill Index ∆ | 3.99% | 3.53% | 2.32% |
|
∆
|
Source: FactSet Research Systems Inc.
|
Visit mfs.com/perf/i for more recent performance information.
FUND STATISTICS AS OF 5/31/26
| Net Assets ($): | 35,585,444 | Total Management Fee ($)#: | 124,322 | |
| Total Number of Holdings: | 15 | Portfolio Turnover Rate (%): | 11 |
# Includes the effect of any management fee waivers, if applicable.
PORTFOLIO COMPOSITION (BASED ON TOTAL NET ASSETS AS OF 5/31/26)
Portfolio structure
| Active Security Selection (a) |
Derivative Overlay Positions (b) |
Net Market Exposure (c) |
||
| Strategic Allocation | MFS International Equity Fund | 30.8% | ||
| MFS Growth Fund | 30.8% | |||
| MFS Value Fund | 30.1% | |||
| Market Exposure Overlay | Mini Russell 1000 Growth Future JUN 18 26 | (7.2)% | ||
| Mini Russell 1000 Value Index Future JUN 18 26 | (12.5)% | |||
| Mini MSCI EAFE Index Future JUN 19 26 | (12.7)% | |||
| Net Equity Exposure | 59.3% | |||
| Standard & Poor's 500 Index Option 6200.00 PUT JUN 18 26 | (0.1)% | |||
| Standard & Poor's 500 Index Option 5400.00 PUT SEP 18 26 | (0.3)% | |||
| Standard & Poor's 500 Index Option 5500.00 PUT DEC 18 26 | (0.5)% | |||
| Standard & Poors Index Option PUT(s) | (0.9)% | |||
| STOXX Europe 600 Price Index Option 490.00 PUT DEC 18 26 | 0.6% | |||
| STOXX Europe 600 Price Index Option 545.00 PUT DEC 18 26 | (1.4)% | |||
| STOXX Europe 600 Price Index PUT(s) | (0.8)% | |||
| Downside Hedge(s) | (1.7)% | |||
| Net Equivalent Equity Exposure | 92.3% | (34.7)% | 57.6% | |
| Limited Maturity U.S. Treasury Notes | 1.9% | |||
| Cash | Cash & Cash Equivalents (d) | 6.3% | ||
| Other (e) | 34.2% | |||
| Total Net Exposure Summary | 100.0% |
(a) Represents the actively managed portion of the portfolio and for purposes of this presentation, components include the value of securities, less any securities sold short. The bond component will include any accrued interest amounts. This also reflects the equivalent exposure of certain derivative positions. These amounts may be negative from time to time.
(b) Represents the tactical overlay portion of the portfolio which is how the fund manages its exposure to markets and currencies through the use of derivative positions. Percentages reflect the equivalent exposure of those derivative positions.
(c) For purposes of this presentation, the components include the value of securities, less any securities sold short, and reflect the impact of the equivalent exposure of all derivative positions. These amounts may be negative from time to time. The bond component will include any accrued interest amounts.
(d) Cash & Cash Equivalents includes any cash, investments in money market funds, short-term securities, and other assets less liabilities.
(e) Other includes currency derivatives and/or the offsetting of the leverage produced by derivative positions.
Portfolio Composition presents the value of securities, including equivalent exposure of derivative positions. Equivalent exposure is a reasonable approximation of the amount of the underlying asset the portfolio would have to hold to have the same price sensitivity of the derivative contract. Bonds include any accrued interest amounts.
Where the fund holds convertible bonds, they are treated as part of the equity portion of the portfolio.
(a) Represents the actively managed portion of the portfolio and for purposes of this presentation, components include the value of securities, less any securities sold short. The bond component will include any accrued interest amounts. This also reflects the equivalent exposure of certain derivative positions. These amounts may be negative from time to time.
(b) Represents the tactical overlay portion of the portfolio which is how the fund manages its exposure to markets and currencies through the use of derivative positions. Percentages reflect the equivalent exposure of those derivative positions.
(c) For purposes of this presentation, the components include the value of securities, less any securities sold short, and reflect the impact of the equivalent exposure of all derivative positions. These amounts may be negative from time to time. The bond component will include any accrued interest amounts.
(d) Cash & Cash Equivalents includes any cash, investments in money market funds, short-term securities, and other assets less liabilities.
(e) Other includes currency derivatives and/or the offsetting of the leverage produced by derivative positions.
Portfolio Composition presents the value of securities, including equivalent exposure of derivative positions. Equivalent exposure is a reasonable approximation of the amount of the underlying asset the portfolio would have to hold to have the same price sensitivity of the derivative contract. Bonds include any accrued interest amounts.
Where the fund holds convertible bonds, they are treated as part of the equity portion of the portfolio.
FUND EXPENSES
What were the fund costs for the last year?
| (based on a hypothetical $10,000 investment) | ||
| Class Name | Costs of a $10,000 investment ~ | Costs paid as a percentage of a $10,000 investment ~ |
| C | $170 | 1.67% |
˜ Expenses are direct expenses and do not include underlying fund fees and expenses.
MANAGEMENT'S DISCUSSION OF FUND PERFORMANCE
-
The MFS Managed Wealth Fund's (fund) investment objective is to seek total return. MFS seeks to achieve the fund’s objective by generating returns from (1) a strategic allocation to three MFS equity funds, referred to as underlying funds, and (2) a tactical asset allocation overlay primarily using derivative instruments to seek to decrease the volatility of the fund’s returns by reducing the fund’s exposure to the equity and/or currency markets as represented by the underlying funds and also to potentially expose the fund to asset classes and/or markets in which the underlying funds have little or no exposure. In addition, MFS may seek to limit the fund’s exposure to certain extreme market events. It is expected that the fund will generally have lower volatility than the overall equity market and will generally underperform the equity markets during periods of rising equity markets.
-
For the twelve months ended May 31, 2026, Class C shares of the fund provided a total return of 3.16%, at net asset value. This compares with a return of 29.78% for the fund’s benchmark, the Standard & Poor's 500 Stock Index. The fund's other benchmark, the ICE BofA 0-3 Month U.S. Treasury Bill Index, generated a return of 3.99%.
-
Global equity markets reached record levels during the period, withstanding considerable volatility amid tariffs, geopolitical conflict and high levels of uncertainty. A new geopolitical event distressed markets at the end of the period as US and Israeli forces launched strikes against Iran, disrupting Mideast oil and natural gas exports. During the period, a pro-growth tax and spending bill was signed into law in the US, while in Europe, renewed focus on defense and infrastructure spending brightened the economic outlook. In Japan, the election of a pro-growth prime minister sent stocks to new highs prior to the conflict in Iran. Optimism over artificial intelligence remained high.
-
Considerable progress was made in trade talks between the US and many major trading partners, with a fragile truce between the US and China extended through late 2026. While the US Supreme Court struck down part of the Trump administration’s tariff strategy, the administration began deploying other authorities to largely replace the ones that were ruled unconstitutional.
-
Early in the period, moderating inflation pressures allowed many global central banks to ease monetary policy. Amid a difficult policymaking environment and slower job growth, the Federal Reserve resumed easing policy in September and delivered quarter-point rate cuts in October and December before pausing.
-
In fixed income markets, previously range-bound global bond yields spiked following the onset of the Middle East conflict, as energy-driven inflation fears appeared to have rattled bond investors. US rate volatility (as measured by the Merrill Lynch Option Volatility Estimate (MOVE) Index) similarly rose from intra-period lows, reflecting uncertainty around the scope and duration of the conflict and its implications for global growth. However, volatility later retracted as the risk of a broader regional military escalation appeared less likely. Global credit spreads widened only modestly before stabilizing near prior levels, supported by strong demand and resilient underlying fundamentals.
-
Top contributors to absolute performance:
-
The fund's allocation to the MFS Growth Fund, MFS International Equity Fund, and the MFS Value Fund benefited performance.
-
-
Top detractors from absolute performance:
-
The fund's short exposure to futures contracts on the Russell 1000® Value Index, Russell 1000® Growth Index, and MSCI EAFE Index held back performance.
-
FUND PERFORMANCE
The fund’s past performance is not a good predictor of the fund’s future performance. The graph and table below do not reflect the deduction of taxes that a shareholder would pay on fund distributions or the redemption of fund shares. The graph and table below assume reinvestment of dividends and capital gain distributions.
Growth of a Hypothetical $10,000 Investment
This graph shows the performance of a hypothetical $10,000 investment in Class C over a ten year period or since inception, if shorter, in comparison to (i) a broad measure of market performance and (ii) an additional index that MFS believes corresponds to the fund’s investment strategies.
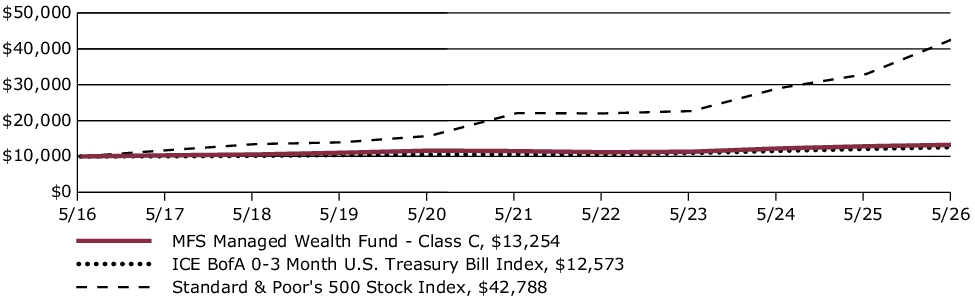
Average Annual Total Returns through 5/31/26
This table shows the average annual total returns of the class of shares noted for the periods shown, both with (if any) and without sales charges. It also shows the average annual total returns of (i) a broad measure of market performance and (ii) an additional index that MFS believes corresponds to the fund’s investment strategies, over the same periods.
| Share Class | 1-yr | 5-yr | 10-yr |
| C without sales charge | 3.16% | 2.91% | 2.86% |
| C with CDSC (1% for 12 months)× | 2.16% | 2.91% | 2.86% |
| Comparative Benchmark(s) | |||
| Standard & Poor's 500 Stock Index ∆ | 29.78% | 14.15% | 15.65% |
| ICE BofA 0-3 Month U.S. Treasury Bill Index ∆ | 3.99% | 3.53% | 2.32% |
|
∆
|
Source: FactSet Research Systems Inc.
|
|
×
|
Assuming redemption at the end of the applicable period.
|
Visit mfs.com/perf/c for more recent performance information.
FUND STATISTICS AS OF 5/31/26
| Net Assets ($): | 35,585,444 | Total Management Fee ($)#: | 124,322 | |
| Total Number of Holdings: | 15 | Portfolio Turnover Rate (%): | 11 |
# Includes the effect of any management fee waivers, if applicable.
PORTFOLIO COMPOSITION (BASED ON TOTAL NET ASSETS AS OF 5/31/26)
Portfolio structure
| Active Security Selection (a) |
Derivative Overlay Positions (b) |
Net Market Exposure (c) |
||
| Strategic Allocation | MFS International Equity Fund | 30.8% | ||
| MFS Growth Fund | 30.8% | |||
| MFS Value Fund | 30.1% | |||
| Market Exposure Overlay | Mini Russell 1000 Growth Future JUN 18 26 | (7.2)% | ||
| Mini Russell 1000 Value Index Future JUN 18 26 | (12.5)% | |||
| Mini MSCI EAFE Index Future JUN 19 26 | (12.7)% | |||
| Net Equity Exposure | 59.3% | |||
| Standard & Poor's 500 Index Option 6200.00 PUT JUN 18 26 | (0.1)% | |||
| Standard & Poor's 500 Index Option 5400.00 PUT SEP 18 26 | (0.3)% | |||
| Standard & Poor's 500 Index Option 5500.00 PUT DEC 18 26 | (0.5)% | |||
| Standard & Poors Index Option PUT(s) | (0.9)% | |||
| STOXX Europe 600 Price Index Option 490.00 PUT DEC 18 26 | 0.6% | |||
| STOXX Europe 600 Price Index Option 545.00 PUT DEC 18 26 | (1.4)% | |||
| STOXX Europe 600 Price Index PUT(s) | (0.8)% | |||
| Downside Hedge(s) | (1.7)% | |||
| Net Equivalent Equity Exposure | 92.3% | (34.7)% | 57.6% | |
| Limited Maturity U.S. Treasury Notes | 1.9% | |||
| Cash | Cash & Cash Equivalents (d) | 6.3% | ||
| Other (e) | 34.2% | |||
| Total Net Exposure Summary | 100.0% |
(a) Represents the actively managed portion of the portfolio and for purposes of this presentation, components include the value of securities, less any securities sold short. The bond component will include any accrued interest amounts. This also reflects the equivalent exposure of certain derivative positions. These amounts may be negative from time to time.
(b) Represents the tactical overlay portion of the portfolio which is how the fund manages its exposure to markets and currencies through the use of derivative positions. Percentages reflect the equivalent exposure of those derivative positions.
(c) For purposes of this presentation, the components include the value of securities, less any securities sold short, and reflect the impact of the equivalent exposure of all derivative positions. These amounts may be negative from time to time. The bond component will include any accrued interest amounts.
(d) Cash & Cash Equivalents includes any cash, investments in money market funds, short-term securities, and other assets less liabilities.
(e) Other includes currency derivatives and/or the offsetting of the leverage produced by derivative positions.
Portfolio Composition presents the value of securities, including equivalent exposure of derivative positions. Equivalent exposure is a reasonable approximation of the amount of the underlying asset the portfolio would have to hold to have the same price sensitivity of the derivative contract. Bonds include any accrued interest amounts.
Where the fund holds convertible bonds, they are treated as part of the equity portion of the portfolio.
(a) Represents the actively managed portion of the portfolio and for purposes of this presentation, components include the value of securities, less any securities sold short. The bond component will include any accrued interest amounts. This also reflects the equivalent exposure of certain derivative positions. These amounts may be negative from time to time.
(b) Represents the tactical overlay portion of the portfolio which is how the fund manages its exposure to markets and currencies through the use of derivative positions. Percentages reflect the equivalent exposure of those derivative positions.
(c) For purposes of this presentation, the components include the value of securities, less any securities sold short, and reflect the impact of the equivalent exposure of all derivative positions. These amounts may be negative from time to time. The bond component will include any accrued interest amounts.
(d) Cash & Cash Equivalents includes any cash, investments in money market funds, short-term securities, and other assets less liabilities.
(e) Other includes currency derivatives and/or the offsetting of the leverage produced by derivative positions.
Portfolio Composition presents the value of securities, including equivalent exposure of derivative positions. Equivalent exposure is a reasonable approximation of the amount of the underlying asset the portfolio would have to hold to have the same price sensitivity of the derivative contract. Bonds include any accrued interest amounts.
Where the fund holds convertible bonds, they are treated as part of the equity portion of the portfolio.
FUND EXPENSES
What were the fund costs for the last year?
| (based on a hypothetical $10,000 investment) | ||
| Class Name | Costs of a $10,000 investment ~ | Costs paid as a percentage of a $10,000 investment ~ |
| B | $170 | 1.67% |
˜ Expenses are direct expenses and do not include underlying fund fees and expenses.
MANAGEMENT'S DISCUSSION OF FUND PERFORMANCE
-
The MFS Managed Wealth Fund's (fund) investment objective is to seek total return. MFS seeks to achieve the fund’s objective by generating returns from (1) a strategic allocation to three MFS equity funds, referred to as underlying funds, and (2) a tactical asset allocation overlay primarily using derivative instruments to seek to decrease the volatility of the fund’s returns by reducing the fund’s exposure to the equity and/or currency markets as represented by the underlying funds and also to potentially expose the fund to asset classes and/or markets in which the underlying funds have little or no exposure. In addition, MFS may seek to limit the fund’s exposure to certain extreme market events. It is expected that the fund will generally have lower volatility than the overall equity market and will generally underperform the equity markets during periods of rising equity markets.
-
For the twelve months ended May 31, 2026, Class B shares of the fund provided a total return of 3.23%, at net asset value. This compares with a return of 29.78% for the fund’s benchmark, the Standard & Poor's 500 Stock Index. The fund's other benchmark, the ICE BofA 0-3 Month U.S. Treasury Bill Index, generated a return of 3.99%.
-
Global equity markets reached record levels during the period, withstanding considerable volatility amid tariffs, geopolitical conflict and high levels of uncertainty. A new geopolitical event distressed markets at the end of the period as US and Israeli forces launched strikes against Iran, disrupting Mideast oil and natural gas exports. During the period, a pro-growth tax and spending bill was signed into law in the US, while in Europe, renewed focus on defense and infrastructure spending brightened the economic outlook. In Japan, the election of a pro-growth prime minister sent stocks to new highs prior to the conflict in Iran. Optimism over artificial intelligence remained high.
-
Considerable progress was made in trade talks between the US and many major trading partners, with a fragile truce between the US and China extended through late 2026. While the US Supreme Court struck down part of the Trump administration’s tariff strategy, the administration began deploying other authorities to largely replace the ones that were ruled unconstitutional.
-
Early in the period, moderating inflation pressures allowed many global central banks to ease monetary policy. Amid a difficult policymaking environment and slower job growth, the Federal Reserve resumed easing policy in September and delivered quarter-point rate cuts in October and December before pausing.
-
In fixed income markets, previously range-bound global bond yields spiked following the onset of the Middle East conflict, as energy-driven inflation fears appeared to have rattled bond investors. US rate volatility (as measured by the Merrill Lynch Option Volatility Estimate (MOVE) Index) similarly rose from intra-period lows, reflecting uncertainty around the scope and duration of the conflict and its implications for global growth. However, volatility later retracted as the risk of a broader regional military escalation appeared less likely. Global credit spreads widened only modestly before stabilizing near prior levels, supported by strong demand and resilient underlying fundamentals.
-
Top contributors to absolute performance:
-
The fund's allocation to the MFS Growth Fund, MFS International Equity Fund, and the MFS Value Fund benefited performance.
-
-
Top detractors from absolute performance:
-
The fund's short exposure to futures contracts on the Russell 1000® Value Index, Russell 1000® Growth Index, and MSCI EAFE Index held back performance.
-
FUND PERFORMANCE
The fund’s past performance is not a good predictor of the fund’s future performance. The graph and table below do not reflect the deduction of taxes that a shareholder would pay on fund distributions or the redemption of fund shares. The graph and table below assume reinvestment of dividends and capital gain distributions.
Growth of a Hypothetical $10,000 Investment
This graph shows the performance of a hypothetical $10,000 investment in Class B over a ten year period or since inception, if shorter, in comparison to (i) a broad measure of market performance and (ii) an additional index that MFS believes corresponds to the fund’s investment strategies.
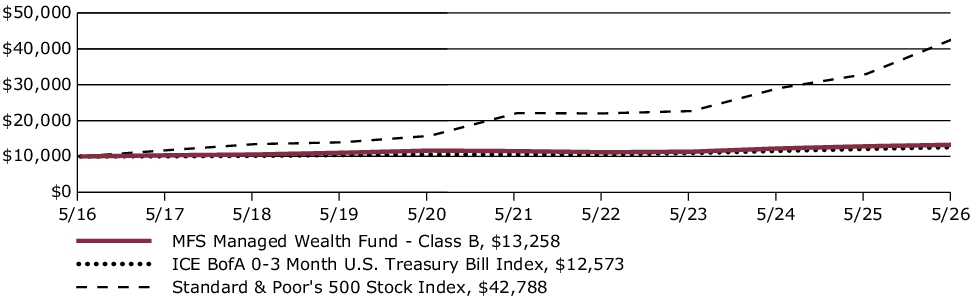
Average Annual Total Returns through 5/31/26
This table shows the average annual total returns of the class of shares noted for the periods shown, both with (if any) and without sales charges. It also shows the average annual total returns of (i) a broad measure of market performance and (ii) an additional index that MFS believes corresponds to the fund’s investment strategies, over the same periods.
| Share Class | 1-yr | 5-yr | 10-yr |
| B without sales charge | 3.23% | 2.92% | 2.86% |
| B with CDSC (declining over six years from 4% to 0%)× | (0.77)% | 2.56% | 2.86% |
| Comparative Benchmark(s) | |||
| Standard & Poor's 500 Stock Index ∆ | 29.78% | 14.15% | 15.65% |
| ICE BofA 0-3 Month U.S. Treasury Bill Index ∆ | 3.99% | 3.53% | 2.32% |
|
∆
|
Source: FactSet Research Systems Inc.
|
|
×
|
Assuming redemption at the end of the applicable period.
|
Visit mfs.com/perf/b for more recent performance information.
FUND STATISTICS AS OF 5/31/26
| Net Assets ($): | 35,585,444 | Total Management Fee ($)#: | 124,322 | |
| Total Number of Holdings: | 15 | Portfolio Turnover Rate (%): | 11 |
# Includes the effect of any management fee waivers, if applicable.
PORTFOLIO COMPOSITION (BASED ON TOTAL NET ASSETS AS OF 5/31/26)
Portfolio structure
| Active Security Selection (a) |
Derivative Overlay Positions (b) |
Net Market Exposure (c) |
||
| Strategic Allocation | MFS International Equity Fund | 30.8% | ||
| MFS Growth Fund | 30.8% | |||
| MFS Value Fund | 30.1% | |||
| Market Exposure Overlay | Mini Russell 1000 Growth Future JUN 18 26 | (7.2)% | ||
| Mini Russell 1000 Value Index Future JUN 18 26 | (12.5)% | |||
| Mini MSCI EAFE Index Future JUN 19 26 | (12.7)% | |||
| Net Equity Exposure | 59.3% | |||
| Standard & Poor's 500 Index Option 6200.00 PUT JUN 18 26 | (0.1)% | |||
| Standard & Poor's 500 Index Option 5400.00 PUT SEP 18 26 | (0.3)% | |||
| Standard & Poor's 500 Index Option 5500.00 PUT DEC 18 26 | (0.5)% | |||
| Standard & Poors Index Option PUT(s) | (0.9)% | |||
| STOXX Europe 600 Price Index Option 490.00 PUT DEC 18 26 | 0.6% | |||
| STOXX Europe 600 Price Index Option 545.00 PUT DEC 18 26 | (1.4)% | |||
| STOXX Europe 600 Price Index PUT(s) | (0.8)% | |||
| Downside Hedge(s) | (1.7)% | |||
| Net Equivalent Equity Exposure | 92.3% | (34.7)% | 57.6% | |
| Limited Maturity U.S. Treasury Notes | 1.9% | |||
| Cash | Cash & Cash Equivalents (d) | 6.3% | ||
| Other (e) | 34.2% | |||
| Total Net Exposure Summary | 100.0% |
(a) Represents the actively managed portion of the portfolio and for purposes of this presentation, components include the value of securities, less any securities sold short. The bond component will include any accrued interest amounts. This also reflects the equivalent exposure of certain derivative positions. These amounts may be negative from time to time.
(b) Represents the tactical overlay portion of the portfolio which is how the fund manages its exposure to markets and currencies through the use of derivative positions. Percentages reflect the equivalent exposure of those derivative positions.
(c) For purposes of this presentation, the components include the value of securities, less any securities sold short, and reflect the impact of the equivalent exposure of all derivative positions. These amounts may be negative from time to time. The bond component will include any accrued interest amounts.
(d) Cash & Cash Equivalents includes any cash, investments in money market funds, short-term securities, and other assets less liabilities.
(e) Other includes currency derivatives and/or the offsetting of the leverage produced by derivative positions.
Portfolio Composition presents the value of securities, including equivalent exposure of derivative positions. Equivalent exposure is a reasonable approximation of the amount of the underlying asset the portfolio would have to hold to have the same price sensitivity of the derivative contract. Bonds include any accrued interest amounts.
Where the fund holds convertible bonds, they are treated as part of the equity portion of the portfolio.
(a) Represents the actively managed portion of the portfolio and for purposes of this presentation, components include the value of securities, less any securities sold short. The bond component will include any accrued interest amounts. This also reflects the equivalent exposure of certain derivative positions. These amounts may be negative from time to time.
(b) Represents the tactical overlay portion of the portfolio which is how the fund manages its exposure to markets and currencies through the use of derivative positions. Percentages reflect the equivalent exposure of those derivative positions.
(c) For purposes of this presentation, the components include the value of securities, less any securities sold short, and reflect the impact of the equivalent exposure of all derivative positions. These amounts may be negative from time to time. The bond component will include any accrued interest amounts.
(d) Cash & Cash Equivalents includes any cash, investments in money market funds, short-term securities, and other assets less liabilities.
(e) Other includes currency derivatives and/or the offsetting of the leverage produced by derivative positions.
Portfolio Composition presents the value of securities, including equivalent exposure of derivative positions. Equivalent exposure is a reasonable approximation of the amount of the underlying asset the portfolio would have to hold to have the same price sensitivity of the derivative contract. Bonds include any accrued interest amounts.
Where the fund holds convertible bonds, they are treated as part of the equity portion of the portfolio.
FUND EXPENSES
What were the fund costs for the last year?
| (based on a hypothetical $10,000 investment) | ||
| Class Name | Costs of a $10,000 investment ~ | Costs paid as a percentage of a $10,000 investment ~ |
| A | $94 | 0.92% |
˜ Expenses are direct expenses and do not include underlying fund fees and expenses.
MANAGEMENT'S DISCUSSION OF FUND PERFORMANCE
-
The MFS Managed Wealth Fund's (fund) investment objective is to seek total return. MFS seeks to achieve the fund’s objective by generating returns from (1) a strategic allocation to three MFS equity funds, referred to as underlying funds, and (2) a tactical asset allocation overlay primarily using derivative instruments to seek to decrease the volatility of the fund’s returns by reducing the fund’s exposure to the equity and/or currency markets as represented by the underlying funds and also to potentially expose the fund to asset classes and/or markets in which the underlying funds have little or no exposure. In addition, MFS may seek to limit the fund’s exposure to certain extreme market events. It is expected that the fund will generally have lower volatility than the overall equity market and will generally underperform the equity markets during periods of rising equity markets.
-
For the twelve months ended May 31, 2026, Class A shares of the fund provided a total return of 4.03%, at net asset value. This compares with a return of 29.78% for the fund’s benchmark, the Standard & Poor's 500 Stock Index. The fund's other benchmark, the ICE BofA 0-3 Month U.S. Treasury Bill Index, generated a return of 3.99%.
-
Global equity markets reached record levels during the period, withstanding considerable volatility amid tariffs, geopolitical conflict and high levels of uncertainty. A new geopolitical event distressed markets at the end of the period as US and Israeli forces launched strikes against Iran, disrupting Mideast oil and natural gas exports. During the period, a pro-growth tax and spending bill was signed into law in the US, while in Europe, renewed focus on defense and infrastructure spending brightened the economic outlook. In Japan, the election of a pro-growth prime minister sent stocks to new highs prior to the conflict in Iran. Optimism over artificial intelligence remained high.
-
Considerable progress was made in trade talks between the US and many major trading partners, with a fragile truce between the US and China extended through late 2026. While the US Supreme Court struck down part of the Trump administration’s tariff strategy, the administration began deploying other authorities to largely replace the ones that were ruled unconstitutional.
-
Early in the period, moderating inflation pressures allowed many global central banks to ease monetary policy. Amid a difficult policymaking environment and slower job growth, the Federal Reserve resumed easing policy in September and delivered quarter-point rate cuts in October and December before pausing.
-
In fixed income markets, previously range-bound global bond yields spiked following the onset of the Middle East conflict, as energy-driven inflation fears appeared to have rattled bond investors. US rate volatility (as measured by the Merrill Lynch Option Volatility Estimate (MOVE) Index) similarly rose from intra-period lows, reflecting uncertainty around the scope and duration of the conflict and its implications for global growth. However, volatility later retracted as the risk of a broader regional military escalation appeared less likely. Global credit spreads widened only modestly before stabilizing near prior levels, supported by strong demand and resilient underlying fundamentals.
-
Top contributors to absolute performance:
-
The fund's allocation to the MFS Growth Fund, MFS International Equity Fund, and the MFS Value Fund benefited performance.
-
-
Top detractors from absolute performance:
-
The fund's short exposure to futures contracts on the Russell 1000® Value Index, Russell 1000® Growth Index, and MSCI EAFE Index held back performance.
-
FUND PERFORMANCE
The fund’s past performance is not a good predictor of the fund’s future performance. The graph and table below do not reflect the deduction of taxes that a shareholder would pay on fund distributions or the redemption of fund shares. The graph and table below assume reinvestment of dividends and capital gain distributions.
Growth of a Hypothetical $10,000 Investment
This graph shows the performance of a hypothetical $10,000 investment in Class A over a ten year period or since inception, if shorter, in comparison to (i) a broad measure of market performance and (ii) an additional index that MFS believes corresponds to the fund’s investment strategies. This graph includes the deduction of the maximum applicable sales charge.
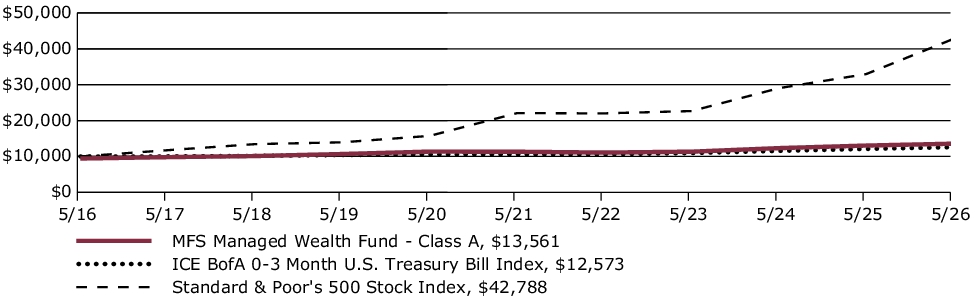
Average Annual Total Returns through 5/31/26
This table shows the average annual total returns of the class of shares noted for the periods shown, both with (if any) and without sales charges. It also shows the average annual total returns of (i) a broad measure of market performance and (ii) an additional index that MFS believes corresponds to the fund’s investment strategies, over the same periods.
| Share Class | 1-yr | 5-yr | 10-yr |
| A without sales charge | 4.03% | 3.70% | 3.71% |
| A with initial sales charge (5.75%) | (1.95)% | 2.48% | 3.09% |
| Comparative Benchmark(s) | |||
| Standard & Poor's 500 Stock Index ∆ | 29.78% | 14.15% | 15.65% |
| ICE BofA 0-3 Month U.S. Treasury Bill Index ∆ | 3.99% | 3.53% | 2.32% |
|
∆
|
Source: FactSet Research Systems Inc.
|
Visit mfs.com/perf/a for more recent performance information.
FUND STATISTICS AS OF 5/31/26
| Net Assets ($): | 35,585,444 | Total Management Fee ($)#: | 124,322 | |
| Total Number of Holdings: | 15 | Portfolio Turnover Rate (%): | 11 |
# Includes the effect of any management fee waivers, if applicable.
PORTFOLIO COMPOSITION (BASED ON TOTAL NET ASSETS AS OF 5/31/26)
Portfolio structure
| Active Security Selection (a) |
Derivative Overlay Positions (b) |
Net Market Exposure (c) |
||
| Strategic Allocation | MFS International Equity Fund | 30.8% | ||
| MFS Growth Fund | 30.8% | |||
| MFS Value Fund | 30.1% | |||
| Market Exposure Overlay | Mini Russell 1000 Growth Future JUN 18 26 | (7.2)% | ||
| Mini Russell 1000 Value Index Future JUN 18 26 | (12.5)% | |||
| Mini MSCI EAFE Index Future JUN 19 26 | (12.7)% | |||
| Net Equity Exposure | 59.3% | |||
| Standard & Poor's 500 Index Option 6200.00 PUT JUN 18 26 | (0.1)% | |||
| Standard & Poor's 500 Index Option 5400.00 PUT SEP 18 26 | (0.3)% | |||
| Standard & Poor's 500 Index Option 5500.00 PUT DEC 18 26 | (0.5)% | |||
| Standard & Poors Index Option PUT(s) | (0.9)% | |||
| STOXX Europe 600 Price Index Option 490.00 PUT DEC 18 26 | 0.6% | |||
| STOXX Europe 600 Price Index Option 545.00 PUT DEC 18 26 | (1.4)% | |||
| STOXX Europe 600 Price Index PUT(s) | (0.8)% | |||
| Downside Hedge(s) | (1.7)% | |||
| Net Equivalent Equity Exposure | 92.3% | (34.7)% | 57.6% | |
| Limited Maturity U.S. Treasury Notes | 1.9% | |||
| Cash | Cash & Cash Equivalents (d) | 6.3% | ||
| Other (e) | 34.2% | |||
| Total Net Exposure Summary | 100.0% |
(a) Represents the actively managed portion of the portfolio and for purposes of this presentation, components include the value of securities, less any securities sold short. The bond component will include any accrued interest amounts. This also reflects the equivalent exposure of certain derivative positions. These amounts may be negative from time to time.
(b) Represents the tactical overlay portion of the portfolio which is how the fund manages its exposure to markets and currencies through the use of derivative positions. Percentages reflect the equivalent exposure of those derivative positions.
(c) For purposes of this presentation, the components include the value of securities, less any securities sold short, and reflect the impact of the equivalent exposure of all derivative positions. These amounts may be negative from time to time. The bond component will include any accrued interest amounts.
(d) Cash & Cash Equivalents includes any cash, investments in money market funds, short-term securities, and other assets less liabilities.
(e) Other includes currency derivatives and/or the offsetting of the leverage produced by derivative positions.
Portfolio Composition presents the value of securities, including equivalent exposure of derivative positions. Equivalent exposure is a reasonable approximation of the amount of the underlying asset the portfolio would have to hold to have the same price sensitivity of the derivative contract. Bonds include any accrued interest amounts.
Where the fund holds convertible bonds, they are treated as part of the equity portion of the portfolio.
(a) Represents the actively managed portion of the portfolio and for purposes of this presentation, components include the value of securities, less any securities sold short. The bond component will include any accrued interest amounts. This also reflects the equivalent exposure of certain derivative positions. These amounts may be negative from time to time.
(b) Represents the tactical overlay portion of the portfolio which is how the fund manages its exposure to markets and currencies through the use of derivative positions. Percentages reflect the equivalent exposure of those derivative positions.
(c) For purposes of this presentation, the components include the value of securities, less any securities sold short, and reflect the impact of the equivalent exposure of all derivative positions. These amounts may be negative from time to time. The bond component will include any accrued interest amounts.
(d) Cash & Cash Equivalents includes any cash, investments in money market funds, short-term securities, and other assets less liabilities.
(e) Other includes currency derivatives and/or the offsetting of the leverage produced by derivative positions.
Portfolio Composition presents the value of securities, including equivalent exposure of derivative positions. Equivalent exposure is a reasonable approximation of the amount of the underlying asset the portfolio would have to hold to have the same price sensitivity of the derivative contract. Bonds include any accrued interest amounts.
Where the fund holds convertible bonds, they are treated as part of the equity portion of the portfolio.
This report describes certain changes to the Fund that occurred during the reporting period.
FUND EXPENSES
What were the fund costs for the last year?
| (based on a hypothetical $10,000 investment) | ||
| Class Name | Costs of a $10,000 investment | Costs paid as a percentage of a $10,000 investment |
| A | $76 | 0.67% |
MANAGEMENT'S DISCUSSION OF FUND PERFORMANCE
-
For the twelve months ended May 31, 2026, Class A shares of the MFS Blended Research Growth Equity Fund (fund) provided a total return of 28.27%, at net asset value. This compares with a return of 29.45% for the fund’s benchmark, the Russell 3000® Index. The fund's other benchmark, the Russell 1000® Growth Index, generated a return of 28.66%.
-
Global equity markets reached record levels during the period, withstanding considerable volatility amid tariffs, geopolitical conflict and high levels of uncertainty. A new geopolitical event distressed markets at the end of the period as US and Israeli forces launched strikes against Iran, disrupting Mideast oil and natural gas exports. During the period, a pro-growth tax and spending bill was signed into law in the US, while in Europe, renewed focus on defense and infrastructure spending brightened the economic outlook. In Japan, the election of a pro-growth prime minister sent stocks to new highs prior to the conflict in Iran. Optimism over artificial intelligence remained high.
-
Considerable progress was made in trade talks between the US and many major trading partners, with a fragile truce between the US and China extended through late 2026. While the US Supreme Court struck down part of the Trump administration’s tariff strategy, the administration began deploying other authorities to largely replace the ones that were ruled unconstitutional.
-
Early in the period, moderating inflation pressures allowed many global central banks to ease monetary policy. Amid a difficult policymaking environment and slower job growth, the Federal Reserve resumed easing policy in September and delivered quarter-point rate cuts in October and December before pausing.
-
In fixed income markets, previously range-bound global bond yields spiked following the onset of the Middle East conflict, as energy-driven inflation fears appeared to have rattled bond investors. US rate volatility (as measured by the Merrill Lynch Option Volatility Estimate (MOVE) Index) similarly rose from intra-period lows, reflecting uncertainty around the scope and duration of the conflict and its implications for global growth. However, volatility later retracted as the risk of a broader regional military escalation appeared less likely. Global credit spreads widened only modestly before stabilizing near prior levels, supported by strong demand and resilient underlying fundamentals.
-
Top contributors to performance relative to the Russell 1000® Growth Index:
-
Security selection within the financials and consumer discretionary sectors strengthened the fund's relative performance.
-
-
Top detractors from performance relative to the Russell 1000® Growth Index:
-
Security selection within the communication services and information technology sectors held back relative performance.
-
FUND PERFORMANCE
The fund’s past performance is not a good predictor of the fund’s future performance. The graph and table below do not reflect the deduction of taxes that a shareholder would pay on fund distributions or the redemption of fund shares. The graph and table below assume reinvestment of dividends and capital gain distributions.
Growth of a Hypothetical $10,000 Investment
This graph shows the performance of a hypothetical $10,000 investment in Class A over a ten year period or since inception, if shorter, in comparison to (i) a broad measure of market performance and (ii) an additional index that MFS believes more closely reflects the market segments in which the fund invests. This graph includes the deduction of the maximum applicable sales charge.
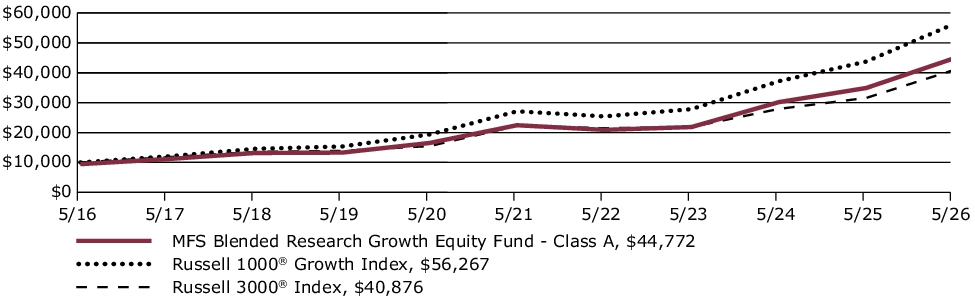
Average Annual Total Returns through 5/31/26
This table shows the average annual total returns of the class of shares noted for the periods shown, both with (if any) and without sales charges. It also shows the average annual total returns of (i) a broad measure of market performance and (ii) an additional index that MFS believes more closely reflects the market segments in which the fund invests, over the same periods.
| Share Class | 1-yr | 5-yr | 10-yr |
| A without sales charge | 28.27% | 14.81% | 16.86% |
| A with initial sales charge (5.75%) | 20.89% | 13.45% | 16.17% |
| Comparative Benchmark(s) | |||
| Russell 3000® Index ∆ | 29.45% | 12.92% | 15.12% |
| Russell 1000® Growth Index ∆ | 28.66% | 15.73% | 18.86% |
|
∆
|
Source: FactSet Research Systems Inc.
|
Visit mfs.com/perf/a for more recent performance information.
FUND STATISTICS AS OF 5/31/26
| Net Assets ($): | 655,925,871 | Total Management Fee ($)#: | 1,421,778 | |
| Total Number of Holdings: | 72 | Portfolio Turnover Rate (%): | 52 |
# Includes the effect of any management fee waivers, if applicable.
Where the fund holds derivatives, they are not included in the total number of portfolio holdings.
PORTFOLIO COMPOSITION (BASED ON TOTAL INVESTMENTS AS OF 5/31/26)
Portfolio structure
| Equities | 99.7% |
| Money Market Funds | 0.3% |
Equity sectors
| Information Technology | 53.0% |
| Communication Services | 13.0% |
| Consumer Discretionary | 11.8% |
| Health Care | 7.2% |
| Financials | 6.1% |
| Industrials | 5.1% |
| Consumer Staples | 2.5% |
| Utilities | 0.6% |
| Energy | 0.3% |
| Real Estate | 0.1% |
Top ten holdings
| NVIDIA Corp. | 14.2% |
| Apple, Inc. | 12.8% |
| Microsoft Corp. | 8.5% |
| Broadcom, Inc. | 4.7% |
| Alphabet, Inc., "A" | 4.1% |
| Amazon.com, Inc. | 4.1% |
| Meta Platforms, Inc., "A" | 3.1% |
| Alphabet, Inc., "C" | 2.9% |
| Tesla, Inc. | 2.4% |
| Datadog, Inc., "A" | 1.8% |
MFS uses the Global Industry Classification Standard (GICS®) for sector/industry reporting. MFS has applied its own internal sector/industry classification methodology for equity securities and non-equity securities that are unclassified by GICS.
Top ten holdings
| NVIDIA Corp. | 14.2% |
| Apple, Inc. | 12.8% |
| Microsoft Corp. | 8.5% |
| Broadcom, Inc. | 4.7% |
| Alphabet, Inc., "A" | 4.1% |
| Amazon.com, Inc. | 4.1% |
| Meta Platforms, Inc., "A" | 3.1% |
| Alphabet, Inc., "C" | 2.9% |
| Tesla, Inc. | 2.4% |
| Datadog, Inc., "A" | 1.8% |
MATERIAL FUND CHANGES
This is a summary of certain changes to the fund since June 1, 2025. For more complete information, you may review the fund's prospectus as amended, which is available at funds.mfs.com or upon request at 1‑800‑225‑2606.
Effective October 1, 2025, the management fee is computed daily and paid monthly at the following annual rates based on the fund’s average daily net assets: 0.25% up to $5 billion; and 0.225% in excess of $5 billion.
Effective October 1, 2025, for Class A shares, the investment adviser has agreed in writing to pay a portion of the fund’s total annual operating expenses, excluding interest, taxes, extraordinary expenses, brokerage and transaction costs, certain tax reclaim recovery expenses (including contingency fees and closing agreement expenses), and investment-related expenses, such that total operating expenses do not exceed 0.64% annually of the class’s average daily net assets. This written agreement will continue until modified by the fund’s Board of Trustees, but such agreement will continue at least until September 30, 2027.
Effective October 1, 2025, the management fee is computed daily and paid monthly at the following annual rates based on the fund’s average daily net assets: 0.25% up to $5 billion; and 0.225% in excess of $5 billion.
Effective October 1, 2025, for Class A shares, the investment adviser has agreed in writing to pay a portion of the fund’s total annual operating expenses, excluding interest, taxes, extraordinary expenses, brokerage and transaction costs, certain tax reclaim recovery expenses (including contingency fees and closing agreement expenses), and investment-related expenses, such that total operating expenses do not exceed 0.64% annually of the class’s average daily net assets. This written agreement will continue until modified by the fund’s Board of Trustees, but such agreement will continue at least until September 30, 2027.
This is a summary of certain changes to the fund since June 1, 2025. For more complete information, you may review the fund's prospectus as amended, which is available at funds.mfs.com or upon request at 1‑800‑225‑2606.
This report describes certain changes to the Fund that occurred during the reporting period.
FUND EXPENSES
What were the fund costs for the last year?
| (based on a hypothetical $10,000 investment) | ||
| Class Name | Costs of a $10,000 investment | Costs paid as a percentage of a $10,000 investment |
| B | $161 | 1.42% |
MANAGEMENT'S DISCUSSION OF FUND PERFORMANCE
-
For the twelve months ended May 31, 2026, Class B shares of the MFS Blended Research Growth Equity Fund (fund) provided a total return of 27.31%, at net asset value. This compares with a return of 29.45% for the fund’s benchmark, the Russell 3000® Index. The fund's other benchmark, the Russell 1000® Growth Index, generated a return of 28.66%.
-
Global equity markets reached record levels during the period, withstanding considerable volatility amid tariffs, geopolitical conflict and high levels of uncertainty. A new geopolitical event distressed markets at the end of the period as US and Israeli forces launched strikes against Iran, disrupting Mideast oil and natural gas exports. During the period, a pro-growth tax and spending bill was signed into law in the US, while in Europe, renewed focus on defense and infrastructure spending brightened the economic outlook. In Japan, the election of a pro-growth prime minister sent stocks to new highs prior to the conflict in Iran. Optimism over artificial intelligence remained high.
-
Considerable progress was made in trade talks between the US and many major trading partners, with a fragile truce between the US and China extended through late 2026. While the US Supreme Court struck down part of the Trump administration’s tariff strategy, the administration began deploying other authorities to largely replace the ones that were ruled unconstitutional.
-
Early in the period, moderating inflation pressures allowed many global central banks to ease monetary policy. Amid a difficult policymaking environment and slower job growth, the Federal Reserve resumed easing policy in September and delivered quarter-point rate cuts in October and December before pausing.
-
In fixed income markets, previously range-bound global bond yields spiked following the onset of the Middle East conflict, as energy-driven inflation fears appeared to have rattled bond investors. US rate volatility (as measured by the Merrill Lynch Option Volatility Estimate (MOVE) Index) similarly rose from intra-period lows, reflecting uncertainty around the scope and duration of the conflict and its implications for global growth. However, volatility later retracted as the risk of a broader regional military escalation appeared less likely. Global credit spreads widened only modestly before stabilizing near prior levels, supported by strong demand and resilient underlying fundamentals.
-
Top contributors to performance relative to the Russell 1000® Growth Index:
-
Security selection within the financials and consumer discretionary sectors strengthened the fund's relative performance.
-
-
Top detractors from performance relative to the Russell 1000® Growth Index:
-
Security selection within the communication services and information technology sectors held back relative performance.
-
FUND PERFORMANCE
The fund’s past performance is not a good predictor of the fund’s future performance. The graph and table below do not reflect the deduction of taxes that a shareholder would pay on fund distributions or the redemption of fund shares. The graph and table below assume reinvestment of dividends and capital gain distributions.
Growth of a Hypothetical $10,000 Investment
This graph shows the performance of a hypothetical $10,000 investment in Class B over a ten year period or since inception, if shorter, in comparison to (i) a broad measure of market performance and (ii) an additional index that MFS believes more closely reflects the market segments in which the fund invests.
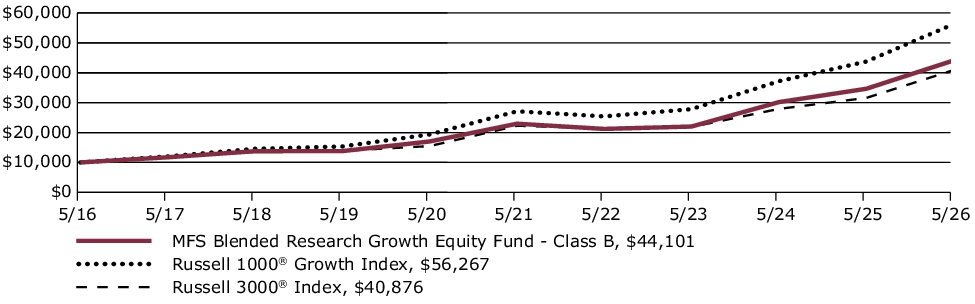
Average Annual Total Returns through 5/31/26
This table shows the average annual total returns of the class of shares noted for the periods shown, both with (if any) and without sales charges. It also shows the average annual total returns of (i) a broad measure of market performance and (ii) an additional index that MFS believes more closely reflects the market segments in which the fund invests, over the same periods.
| Share Class | 1-yr | 5-yr | 10-yr |
| B without sales charge | 27.31% | 13.95% | 16.00% |
| B with CDSC (declining over six years from 4% to 0%)× | 23.31% | 13.72% | 16.00% |
| Comparative Benchmark(s) | |||
| Russell 3000® Index ∆ | 29.45% | 12.92% | 15.12% |
| Russell 1000® Growth Index ∆ | 28.66% | 15.73% | 18.86% |
|
∆
|
Source: FactSet Research Systems Inc.
|
|
×
|
Assuming redemption at the end of the applicable period.
|
Visit mfs.com/perf/b for more recent performance information.
FUND STATISTICS AS OF 5/31/26
| Net Assets ($): | 655,925,871 | Total Management Fee ($)#: | 1,421,778 | |
| Total Number of Holdings: | 72 | Portfolio Turnover Rate (%): | 52 |
# Includes the effect of any management fee waivers, if applicable.
Where the fund holds derivatives, they are not included in the total number of portfolio holdings.
PORTFOLIO COMPOSITION (BASED ON TOTAL INVESTMENTS AS OF 5/31/26)
Portfolio structure
| Equities | 99.7% |
| Money Market Funds | 0.3% |
Equity sectors
| Information Technology | 53.0% |
| Communication Services | 13.0% |
| Consumer Discretionary | 11.8% |
| Health Care | 7.2% |
| Financials | 6.1% |
| Industrials | 5.1% |
| Consumer Staples | 2.5% |
| Utilities | 0.6% |
| Energy | 0.3% |
| Real Estate | 0.1% |
Top ten holdings
| NVIDIA Corp. | 14.2% |
| Apple, Inc. | 12.8% |
| Microsoft Corp. | 8.5% |
| Broadcom, Inc. | 4.7% |
| Alphabet, Inc., "A" | 4.1% |
| Amazon.com, Inc. | 4.1% |
| Meta Platforms, Inc., "A" | 3.1% |
| Alphabet, Inc., "C" | 2.9% |
| Tesla, Inc. | 2.4% |
| Datadog, Inc., "A" | 1.8% |
MFS uses the Global Industry Classification Standard (GICS®) for sector/industry reporting. MFS has applied its own internal sector/industry classification methodology for equity securities and non-equity securities that are unclassified by GICS.
Top ten holdings
| NVIDIA Corp. | 14.2% |
| Apple, Inc. | 12.8% |
| Microsoft Corp. | 8.5% |
| Broadcom, Inc. | 4.7% |
| Alphabet, Inc., "A" | 4.1% |
| Amazon.com, Inc. | 4.1% |
| Meta Platforms, Inc., "A" | 3.1% |
| Alphabet, Inc., "C" | 2.9% |
| Tesla, Inc. | 2.4% |
| Datadog, Inc., "A" | 1.8% |
MATERIAL FUND CHANGES
This is a summary of certain changes to the fund since June 1, 2025. For more complete information, you may review the fund's prospectus as amended, which is available at funds.mfs.com or upon request at 1‑800‑225‑2606.
Effective October 1, 2025, the management fee is computed daily and paid monthly at the following annual rates based on the fund’s average daily net assets: 0.25% up to $5 billion; and 0.225% in excess of $5 billion.
Effective October 1, 2025, for Class B shares, the investment adviser has agreed in writing to pay a portion of the fund’s total annual operating expenses, excluding interest, taxes, extraordinary expenses, brokerage and transaction costs, certain tax reclaim recovery expenses (including contingency fees and closing agreement expenses), and investment-related expenses, such that total operating expenses do not exceed 1.39% annually of the class’s average daily net assets. This written agreement will continue until modified by the fund’s Board of Trustees, but such agreement will continue at least until September 30, 2027.
Effective October 1, 2025, the management fee is computed daily and paid monthly at the following annual rates based on the fund’s average daily net assets: 0.25% up to $5 billion; and 0.225% in excess of $5 billion.
Effective October 1, 2025, for Class B shares, the investment adviser has agreed in writing to pay a portion of the fund’s total annual operating expenses, excluding interest, taxes, extraordinary expenses, brokerage and transaction costs, certain tax reclaim recovery expenses (including contingency fees and closing agreement expenses), and investment-related expenses, such that total operating expenses do not exceed 1.39% annually of the class’s average daily net assets. This written agreement will continue until modified by the fund’s Board of Trustees, but such agreement will continue at least until September 30, 2027.
This is a summary of certain changes to the fund since June 1, 2025. For more complete information, you may review the fund's prospectus as amended, which is available at funds.mfs.com or upon request at 1‑800‑225‑2606.
This report describes certain changes to the Fund that occurred during the reporting period.
FUND EXPENSES
What were the fund costs for the last year?
| (based on a hypothetical $10,000 investment) | ||
| Class Name | Costs of a $10,000 investment | Costs paid as a percentage of a $10,000 investment |
| C | $161 | 1.42% |
MANAGEMENT'S DISCUSSION OF FUND PERFORMANCE
-
For the twelve months ended May 31, 2026, Class C shares of the MFS Blended Research Growth Equity Fund (fund) provided a total return of 27.32%, at net asset value. This compares with a return of 29.45% for the fund’s benchmark, the Russell 3000® Index. The fund's other benchmark, the Russell 1000® Growth Index, generated a return of 28.66%.
-
Global equity markets reached record levels during the period, withstanding considerable volatility amid tariffs, geopolitical conflict and high levels of uncertainty. A new geopolitical event distressed markets at the end of the period as US and Israeli forces launched strikes against Iran, disrupting Mideast oil and natural gas exports. During the period, a pro-growth tax and spending bill was signed into law in the US, while in Europe, renewed focus on defense and infrastructure spending brightened the economic outlook. In Japan, the election of a pro-growth prime minister sent stocks to new highs prior to the conflict in Iran. Optimism over artificial intelligence remained high.
-
Considerable progress was made in trade talks between the US and many major trading partners, with a fragile truce between the US and China extended through late 2026. While the US Supreme Court struck down part of the Trump administration’s tariff strategy, the administration began deploying other authorities to largely replace the ones that were ruled unconstitutional.
-
Early in the period, moderating inflation pressures allowed many global central banks to ease monetary policy. Amid a difficult policymaking environment and slower job growth, the Federal Reserve resumed easing policy in September and delivered quarter-point rate cuts in October and December before pausing.
-
In fixed income markets, previously range-bound global bond yields spiked following the onset of the Middle East conflict, as energy-driven inflation fears appeared to have rattled bond investors. US rate volatility (as measured by the Merrill Lynch Option Volatility Estimate (MOVE) Index) similarly rose from intra-period lows, reflecting uncertainty around the scope and duration of the conflict and its implications for global growth. However, volatility later retracted as the risk of a broader regional military escalation appeared less likely. Global credit spreads widened only modestly before stabilizing near prior levels, supported by strong demand and resilient underlying fundamentals.
-
Top contributors to performance relative to the Russell 1000® Growth Index:
-
Security selection within the financials and consumer discretionary sectors strengthened the fund's relative performance.
-
-
Top detractors from performance relative to the Russell 1000® Growth Index:
-
Security selection within the communication services and information technology sectors held back relative performance.
-
FUND PERFORMANCE
The fund’s past performance is not a good predictor of the fund’s future performance. The graph and table below do not reflect the deduction of taxes that a shareholder would pay on fund distributions or the redemption of fund shares. The graph and table below assume reinvestment of dividends and capital gain distributions.
Growth of a Hypothetical $10,000 Investment
This graph shows the performance of a hypothetical $10,000 investment in Class C over a ten year period or since inception, if shorter, in comparison to (i) a broad measure of market performance and (ii) an additional index that MFS believes more closely reflects the market segments in which the fund invests.
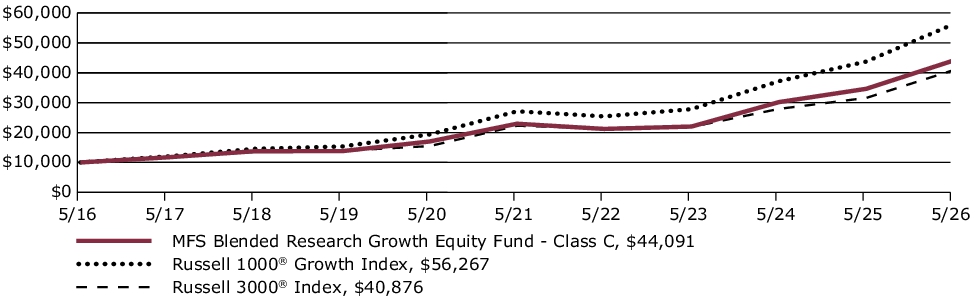
Average Annual Total Returns through 5/31/26
This table shows the average annual total returns of the class of shares noted for the periods shown, both with (if any) and without sales charges. It also shows the average annual total returns of (i) a broad measure of market performance and (ii) an additional index that MFS believes more closely reflects the market segments in which the fund invests, over the same periods.
| Share Class | 1-yr | 5-yr | 10-yr |
| C without sales charge | 27.32% | 13.95% | 15.99% |
| C with CDSC (1% for 12 months)× | 26.32% | 13.95% | 15.99% |
| Comparative Benchmark(s) | |||
| Russell 3000® Index ∆ | 29.45% | 12.92% | 15.12% |
| Russell 1000® Growth Index ∆ | 28.66% | 15.73% | 18.86% |
|
∆
|
Source: FactSet Research Systems Inc.
|
|
×
|
Assuming redemption at the end of the applicable period.
|
Visit mfs.com/perf/c for more recent performance information.
FUND STATISTICS AS OF 5/31/26
| Net Assets ($): | 655,925,871 | Total Management Fee ($)#: | 1,421,778 | |
| Total Number of Holdings: | 72 | Portfolio Turnover Rate (%): | 52 |
# Includes the effect of any management fee waivers, if applicable.
Where the fund holds derivatives, they are not included in the total number of portfolio holdings.
PORTFOLIO COMPOSITION (BASED ON TOTAL INVESTMENTS AS OF 5/31/26)
Portfolio structure
| Equities | 99.7% |
| Money Market Funds | 0.3% |
Equity sectors
| Information Technology | 53.0% |
| Communication Services | 13.0% |
| Consumer Discretionary | 11.8% |
| Health Care | 7.2% |
| Financials | 6.1% |
| Industrials | 5.1% |
| Consumer Staples | 2.5% |
| Utilities | 0.6% |
| Energy | 0.3% |
| Real Estate | 0.1% |
Top ten holdings
| NVIDIA Corp. | 14.2% |
| Apple, Inc. | 12.8% |
| Microsoft Corp. | 8.5% |
| Broadcom, Inc. | 4.7% |
| Alphabet, Inc., "A" | 4.1% |
| Amazon.com, Inc. | 4.1% |
| Meta Platforms, Inc., "A" | 3.1% |
| Alphabet, Inc., "C" | 2.9% |
| Tesla, Inc. | 2.4% |
| Datadog, Inc., "A" | 1.8% |
MFS uses the Global Industry Classification Standard (GICS®) for sector/industry reporting. MFS has applied its own internal sector/industry classification methodology for equity securities and non-equity securities that are unclassified by GICS.
Top ten holdings
| NVIDIA Corp. | 14.2% |
| Apple, Inc. | 12.8% |
| Microsoft Corp. | 8.5% |
| Broadcom, Inc. | 4.7% |
| Alphabet, Inc., "A" | 4.1% |
| Amazon.com, Inc. | 4.1% |
| Meta Platforms, Inc., "A" | 3.1% |
| Alphabet, Inc., "C" | 2.9% |
| Tesla, Inc. | 2.4% |
| Datadog, Inc., "A" | 1.8% |
MATERIAL FUND CHANGES
This is a summary of certain changes to the fund since June 1, 2025. For more complete information, you may review the fund's prospectus as amended, which is available at funds.mfs.com or upon request at 1‑800‑225‑2606.
Effective October 1, 2025, the management fee is computed daily and paid monthly at the following annual rates based on the fund’s average daily net assets: 0.25% up to $5 billion; and 0.225% in excess of $5 billion.
Effective October 1, 2025, for Class C shares, the investment adviser has agreed in writing to pay a portion of the fund’s total annual operating expenses, excluding interest, taxes, extraordinary expenses, brokerage and transaction costs, certain tax reclaim recovery expenses (including contingency fees and closing agreement expenses), and investment-related expenses, such that total operating expenses do not exceed 1.39% annually of the class’s average daily net assets. This written agreement will continue until modified by the fund’s Board of Trustees, but such agreement will continue at least until September 30, 2027.
Effective October 1, 2025, the management fee is computed daily and paid monthly at the following annual rates based on the fund’s average daily net assets: 0.25% up to $5 billion; and 0.225% in excess of $5 billion.
Effective October 1, 2025, for Class C shares, the investment adviser has agreed in writing to pay a portion of the fund’s total annual operating expenses, excluding interest, taxes, extraordinary expenses, brokerage and transaction costs, certain tax reclaim recovery expenses (including contingency fees and closing agreement expenses), and investment-related expenses, such that total operating expenses do not exceed 1.39% annually of the class’s average daily net assets. This written agreement will continue until modified by the fund’s Board of Trustees, but such agreement will continue at least until September 30, 2027.
This is a summary of certain changes to the fund since June 1, 2025. For more complete information, you may review the fund's prospectus as amended, which is available at funds.mfs.com or upon request at 1‑800‑225‑2606.
This report describes certain changes to the Fund that occurred during the reporting period.
FUND EXPENSES
What were the fund costs for the last year?
| (based on a hypothetical $10,000 investment) | ||
| Class Name | Costs of a $10,000 investment | Costs paid as a percentage of a $10,000 investment |
| I | $47 | 0.41% |
MANAGEMENT'S DISCUSSION OF FUND PERFORMANCE
-
For the twelve months ended May 31, 2026, Class I shares of the MFS Blended Research Growth Equity Fund (fund) provided a total return of 28.58%, at net asset value. This compares with a return of 29.45% for the fund’s benchmark, the Russell 3000® Index. The fund's other benchmark, the Russell 1000® Growth Index, generated a return of 28.66%.
-
Global equity markets reached record levels during the period, withstanding considerable volatility amid tariffs, geopolitical conflict and high levels of uncertainty. A new geopolitical event distressed markets at the end of the period as US and Israeli forces launched strikes against Iran, disrupting Mideast oil and natural gas exports. During the period, a pro-growth tax and spending bill was signed into law in the US, while in Europe, renewed focus on defense and infrastructure spending brightened the economic outlook. In Japan, the election of a pro-growth prime minister sent stocks to new highs prior to the conflict in Iran. Optimism over artificial intelligence remained high.
-
Considerable progress was made in trade talks between the US and many major trading partners, with a fragile truce between the US and China extended through late 2026. While the US Supreme Court struck down part of the Trump administration’s tariff strategy, the administration began deploying other authorities to largely replace the ones that were ruled unconstitutional.
-
Early in the period, moderating inflation pressures allowed many global central banks to ease monetary policy. Amid a difficult policymaking environment and slower job growth, the Federal Reserve resumed easing policy in September and delivered quarter-point rate cuts in October and December before pausing.
-
In fixed income markets, previously range-bound global bond yields spiked following the onset of the Middle East conflict, as energy-driven inflation fears appeared to have rattled bond investors. US rate volatility (as measured by the Merrill Lynch Option Volatility Estimate (MOVE) Index) similarly rose from intra-period lows, reflecting uncertainty around the scope and duration of the conflict and its implications for global growth. However, volatility later retracted as the risk of a broader regional military escalation appeared less likely. Global credit spreads widened only modestly before stabilizing near prior levels, supported by strong demand and resilient underlying fundamentals.
-
Top contributors to performance relative to the Russell 1000® Growth Index:
-
Security selection within the financials and consumer discretionary sectors strengthened the fund's relative performance.
-
-
Top detractors from performance relative to the Russell 1000® Growth Index:
-
Security selection within the communication services and information technology sectors held back relative performance.
-
FUND PERFORMANCE
The fund’s past performance is not a good predictor of the fund’s future performance. The graph and table below do not reflect the deduction of taxes that a shareholder would pay on fund distributions or the redemption of fund shares. The graph and table below assume reinvestment of dividends and capital gain distributions.
Growth of a Hypothetical $10,000 Investment
This graph shows the performance of a hypothetical $10,000 investment in Class I over a ten year period or since inception, if shorter, in comparison to (i) a broad measure of market performance and (ii) an additional index that MFS believes more closely reflects the market segments in which the fund invests.
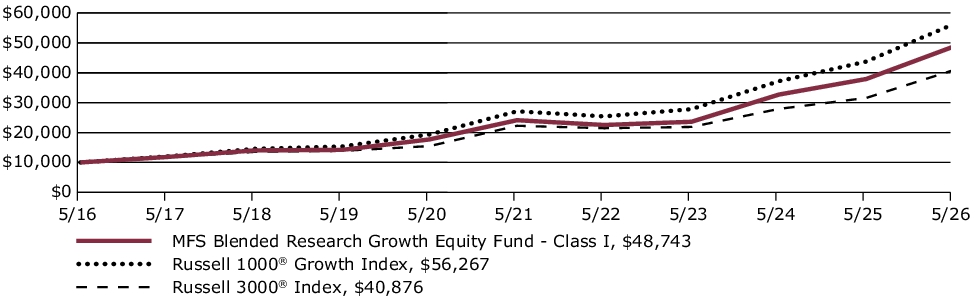
Average Annual Total Returns through 5/31/26
This table shows the average annual total returns of the class of shares noted for the periods shown, both with (if any) and without sales charges. It also shows the average annual total returns of (i) a broad measure of market performance and (ii) an additional index that MFS believes more closely reflects the market segments in which the fund invests, over the same periods.
| Share Class | 1-yr | 5-yr | 10-yr |
| I without sales charge | 28.58% | 15.10% | 17.16% |
| Comparative Benchmark(s) | |||
| Russell 3000® Index ∆ | 29.45% | 12.92% | 15.12% |
| Russell 1000® Growth Index ∆ | 28.66% | 15.73% | 18.86% |
|
∆
|
Source: FactSet Research Systems Inc.
|
Visit mfs.com/perf/i for more recent performance information.
FUND STATISTICS AS OF 5/31/26
| Net Assets ($): | 655,925,871 | Total Management Fee ($)#: | 1,421,778 | |
| Total Number of Holdings: | 72 | Portfolio Turnover Rate (%): | 52 |
# Includes the effect of any management fee waivers, if applicable.
Where the fund holds derivatives, they are not included in the total number of portfolio holdings.
PORTFOLIO COMPOSITION (BASED ON TOTAL INVESTMENTS AS OF 5/31/26)
Portfolio structure
| Equities | 99.7% |
| Money Market Funds | 0.3% |
Equity sectors
| Information Technology | 53.0% |
| Communication Services | 13.0% |
| Consumer Discretionary | 11.8% |
| Health Care | 7.2% |
| Financials | 6.1% |
| Industrials | 5.1% |
| Consumer Staples | 2.5% |
| Utilities | 0.6% |
| Energy | 0.3% |
| Real Estate | 0.1% |
Top ten holdings
| NVIDIA Corp. | 14.2% |
| Apple, Inc. | 12.8% |
| Microsoft Corp. | 8.5% |
| Broadcom, Inc. | 4.7% |
| Alphabet, Inc., "A" | 4.1% |
| Amazon.com, Inc. | 4.1% |
| Meta Platforms, Inc., "A" | 3.1% |
| Alphabet, Inc., "C" | 2.9% |
| Tesla, Inc. | 2.4% |
| Datadog, Inc., "A" | 1.8% |
MFS uses the Global Industry Classification Standard (GICS®) for sector/industry reporting. MFS has applied its own internal sector/industry classification methodology for equity securities and non-equity securities that are unclassified by GICS.
Top ten holdings
| NVIDIA Corp. | 14.2% |
| Apple, Inc. | 12.8% |
| Microsoft Corp. | 8.5% |
| Broadcom, Inc. | 4.7% |
| Alphabet, Inc., "A" | 4.1% |
| Amazon.com, Inc. | 4.1% |
| Meta Platforms, Inc., "A" | 3.1% |
| Alphabet, Inc., "C" | 2.9% |
| Tesla, Inc. | 2.4% |
| Datadog, Inc., "A" | 1.8% |
MATERIAL FUND CHANGES
This is a summary of certain changes to the fund since June 1, 2025. For more complete information, you may review the fund's prospectus as amended, which is available at funds.mfs.com or upon request at 1‑800‑225‑2606.
Effective October 1, 2025, the management fee is computed daily and paid monthly at the following annual rates based on the fund’s average daily net assets: 0.25% up to $5 billion; and 0.225% in excess of $5 billion.
Effective October 1, 2025, for Class I shares, the investment adviser has agreed in writing to pay a portion of the fund’s total annual operating expenses, excluding interest, taxes, extraordinary expenses, brokerage and transaction costs, certain tax reclaim recovery expenses (including contingency fees and closing agreement expenses), and investment-related expenses, such that total operating expenses do not exceed 0.39% annually of the class’s average daily net assets. This written agreement will continue until modified by the fund’s Board of Trustees, but such agreement will continue at least until September 30, 2027.
Effective October 1, 2025, the management fee is computed daily and paid monthly at the following annual rates based on the fund’s average daily net assets: 0.25% up to $5 billion; and 0.225% in excess of $5 billion.
Effective October 1, 2025, for Class I shares, the investment adviser has agreed in writing to pay a portion of the fund’s total annual operating expenses, excluding interest, taxes, extraordinary expenses, brokerage and transaction costs, certain tax reclaim recovery expenses (including contingency fees and closing agreement expenses), and investment-related expenses, such that total operating expenses do not exceed 0.39% annually of the class’s average daily net assets. This written agreement will continue until modified by the fund’s Board of Trustees, but such agreement will continue at least until September 30, 2027.
This is a summary of certain changes to the fund since June 1, 2025. For more complete information, you may review the fund's prospectus as amended, which is available at funds.mfs.com or upon request at 1‑800‑225‑2606.
This report describes certain changes to the Fund that occurred during the reporting period.
FUND EXPENSES
What were the fund costs for the last year?
| (based on a hypothetical $10,000 investment) | ||
| Class Name | Costs of a $10,000 investment | Costs paid as a percentage of a $10,000 investment |
| R1 | $161 | 1.42% |
MANAGEMENT'S DISCUSSION OF FUND PERFORMANCE
-
For the twelve months ended May 31, 2026, Class R1 shares of the MFS Blended Research Growth Equity Fund (fund) provided a total return of 27.32%, at net asset value. This compares with a return of 29.45% for the fund’s benchmark, the Russell 3000® Index. The fund's other benchmark, the Russell 1000® Growth Index, generated a return of 28.66%.
-
Global equity markets reached record levels during the period, withstanding considerable volatility amid tariffs, geopolitical conflict and high levels of uncertainty. A new geopolitical event distressed markets at the end of the period as US and Israeli forces launched strikes against Iran, disrupting Mideast oil and natural gas exports. During the period, a pro-growth tax and spending bill was signed into law in the US, while in Europe, renewed focus on defense and infrastructure spending brightened the economic outlook. In Japan, the election of a pro-growth prime minister sent stocks to new highs prior to the conflict in Iran. Optimism over artificial intelligence remained high.
-
Considerable progress was made in trade talks between the US and many major trading partners, with a fragile truce between the US and China extended through late 2026. While the US Supreme Court struck down part of the Trump administration’s tariff strategy, the administration began deploying other authorities to largely replace the ones that were ruled unconstitutional.
-
Early in the period, moderating inflation pressures allowed many global central banks to ease monetary policy. Amid a difficult policymaking environment and slower job growth, the Federal Reserve resumed easing policy in September and delivered quarter-point rate cuts in October and December before pausing.
-
In fixed income markets, previously range-bound global bond yields spiked following the onset of the Middle East conflict, as energy-driven inflation fears appeared to have rattled bond investors. US rate volatility (as measured by the Merrill Lynch Option Volatility Estimate (MOVE) Index) similarly rose from intra-period lows, reflecting uncertainty around the scope and duration of the conflict and its implications for global growth. However, volatility later retracted as the risk of a broader regional military escalation appeared less likely. Global credit spreads widened only modestly before stabilizing near prior levels, supported by strong demand and resilient underlying fundamentals.
-
Top contributors to performance relative to the Russell 1000® Growth Index:
-
Security selection within the financials and consumer discretionary sectors strengthened the fund's relative performance.
-
-
Top detractors from performance relative to the Russell 1000® Growth Index:
-
Security selection within the communication services and information technology sectors held back relative performance.
-
FUND PERFORMANCE
The fund’s past performance is not a good predictor of the fund’s future performance. The graph and table below do not reflect the deduction of taxes that a shareholder would pay on fund distributions or the redemption of fund shares. The graph and table below assume reinvestment of dividends and capital gain distributions.
Growth of a Hypothetical $10,000 Investment
This graph shows the performance of a hypothetical $10,000 investment in Class R1 over a ten year period or since inception, if shorter, in comparison to (i) a broad measure of market performance and (ii) an additional index that MFS believes more closely reflects the market segments in which the fund invests.
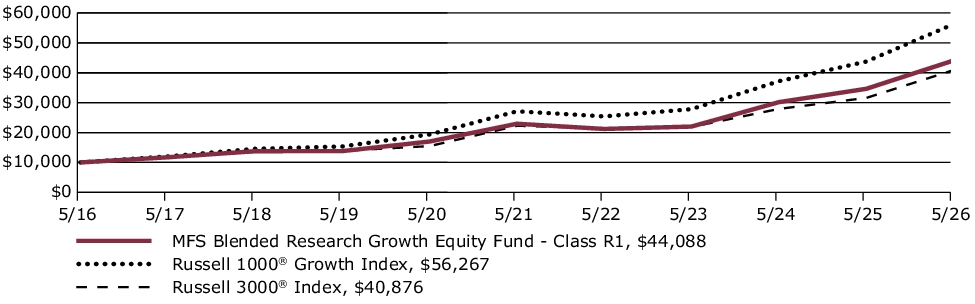
Average Annual Total Returns through 5/31/26
This table shows the average annual total returns of the class of shares noted for the periods shown, both with (if any) and without sales charges. It also shows the average annual total returns of (i) a broad measure of market performance and (ii) an additional index that MFS believes more closely reflects the market segments in which the fund invests, over the same periods.
| Share Class | 1-yr | 5-yr | 10-yr |
| R1 without sales charge | 27.32% | 13.96% | 15.99% |
| Comparative Benchmark(s) | |||
| Russell 3000® Index ∆ | 29.45% | 12.92% | 15.12% |
| Russell 1000® Growth Index ∆ | 28.66% | 15.73% | 18.86% |
|
∆
|
Source: FactSet Research Systems Inc.
|
Visit mfs.com/perf/r1 for more recent performance information.
FUND STATISTICS AS OF 5/31/26
| Net Assets ($): | 655,925,871 | Total Management Fee ($)#: | 1,421,778 | |
| Total Number of Holdings: | 72 | Portfolio Turnover Rate (%): | 52 |
# Includes the effect of any management fee waivers, if applicable.
Where the fund holds derivatives, they are not included in the total number of portfolio holdings.
PORTFOLIO COMPOSITION (BASED ON TOTAL INVESTMENTS AS OF 5/31/26)
Portfolio structure
| Equities | 99.7% |
| Money Market Funds | 0.3% |
Equity sectors
| Information Technology | 53.0% |
| Communication Services | 13.0% |
| Consumer Discretionary | 11.8% |
| Health Care | 7.2% |
| Financials | 6.1% |
| Industrials | 5.1% |
| Consumer Staples | 2.5% |
| Utilities | 0.6% |
| Energy | 0.3% |
| Real Estate | 0.1% |
Top ten holdings
| NVIDIA Corp. | 14.2% |
| Apple, Inc. | 12.8% |
| Microsoft Corp. | 8.5% |
| Broadcom, Inc. | 4.7% |
| Alphabet, Inc., "A" | 4.1% |
| Amazon.com, Inc. | 4.1% |
| Meta Platforms, Inc., "A" | 3.1% |
| Alphabet, Inc., "C" | 2.9% |
| Tesla, Inc. | 2.4% |
| Datadog, Inc., "A" | 1.8% |
MFS uses the Global Industry Classification Standard (GICS®) for sector/industry reporting. MFS has applied its own internal sector/industry classification methodology for equity securities and non-equity securities that are unclassified by GICS.
Top ten holdings
| NVIDIA Corp. | 14.2% |
| Apple, Inc. | 12.8% |
| Microsoft Corp. | 8.5% |
| Broadcom, Inc. | 4.7% |
| Alphabet, Inc., "A" | 4.1% |
| Amazon.com, Inc. | 4.1% |
| Meta Platforms, Inc., "A" | 3.1% |
| Alphabet, Inc., "C" | 2.9% |
| Tesla, Inc. | 2.4% |
| Datadog, Inc., "A" | 1.8% |
MATERIAL FUND CHANGES
This is a summary of certain changes to the fund since June 1, 2025. For more complete information, you may review the fund's prospectus as amended, which is available at funds.mfs.com or upon request at 1‑800‑225‑2606.
Effective October 1, 2025, the management fee is computed daily and paid monthly at the following annual rates based on the fund’s average daily net assets: 0.25% up to $5 billion; and 0.225% in excess of $5 billion.
Effective October 1, 2025, for Class R1 shares, the investment adviser has agreed in writing to pay a portion of the fund’s total annual operating expenses, excluding interest, taxes, extraordinary expenses, brokerage and transaction costs, certain tax reclaim recovery expenses (including contingency fees and closing agreement expenses), and investment-related expenses, such that total operating expenses do not exceed 1.39% annually of the class’s average daily net assets. This written agreement will continue until modified by the fund’s Board of Trustees, but such agreement will continue at least until September 30, 2027.
Effective October 1, 2025, the management fee is computed daily and paid monthly at the following annual rates based on the fund’s average daily net assets: 0.25% up to $5 billion; and 0.225% in excess of $5 billion.
Effective October 1, 2025, for Class R1 shares, the investment adviser has agreed in writing to pay a portion of the fund’s total annual operating expenses, excluding interest, taxes, extraordinary expenses, brokerage and transaction costs, certain tax reclaim recovery expenses (including contingency fees and closing agreement expenses), and investment-related expenses, such that total operating expenses do not exceed 1.39% annually of the class’s average daily net assets. This written agreement will continue until modified by the fund’s Board of Trustees, but such agreement will continue at least until September 30, 2027.
This is a summary of certain changes to the fund since June 1, 2025. For more complete information, you may review the fund's prospectus as amended, which is available at funds.mfs.com or upon request at 1‑800‑225‑2606.
This report describes certain changes to the Fund that occurred during the reporting period.
FUND EXPENSES
What were the fund costs for the last year?
| (based on a hypothetical $10,000 investment) | ||
| Class Name | Costs of a $10,000 investment | Costs paid as a percentage of a $10,000 investment |
| R2 | $105 | 0.92% |
MANAGEMENT'S DISCUSSION OF FUND PERFORMANCE
-
For the twelve months ended May 31, 2026, Class R2 shares of the MFS Blended Research Growth Equity Fund (fund) provided a total return of 27.96%, at net asset value. This compares with a return of 29.45% for the fund’s benchmark, the Russell 3000® Index. The fund's other benchmark, the Russell 1000® Growth Index, generated a return of 28.66%.
-
Global equity markets reached record levels during the period, withstanding considerable volatility amid tariffs, geopolitical conflict and high levels of uncertainty. A new geopolitical event distressed markets at the end of the period as US and Israeli forces launched strikes against Iran, disrupting Mideast oil and natural gas exports. During the period, a pro-growth tax and spending bill was signed into law in the US, while in Europe, renewed focus on defense and infrastructure spending brightened the economic outlook. In Japan, the election of a pro-growth prime minister sent stocks to new highs prior to the conflict in Iran. Optimism over artificial intelligence remained high.
-
Considerable progress was made in trade talks between the US and many major trading partners, with a fragile truce between the US and China extended through late 2026. While the US Supreme Court struck down part of the Trump administration’s tariff strategy, the administration began deploying other authorities to largely replace the ones that were ruled unconstitutional.
-
Early in the period, moderating inflation pressures allowed many global central banks to ease monetary policy. Amid a difficult policymaking environment and slower job growth, the Federal Reserve resumed easing policy in September and delivered quarter-point rate cuts in October and December before pausing.
-
In fixed income markets, previously range-bound global bond yields spiked following the onset of the Middle East conflict, as energy-driven inflation fears appeared to have rattled bond investors. US rate volatility (as measured by the Merrill Lynch Option Volatility Estimate (MOVE) Index) similarly rose from intra-period lows, reflecting uncertainty around the scope and duration of the conflict and its implications for global growth. However, volatility later retracted as the risk of a broader regional military escalation appeared less likely. Global credit spreads widened only modestly before stabilizing near prior levels, supported by strong demand and resilient underlying fundamentals.
-
Top contributors to performance relative to the Russell 1000® Growth Index:
-
Security selection within the financials and consumer discretionary sectors strengthened the fund's relative performance.
-
-
Top detractors from performance relative to the Russell 1000® Growth Index:
-
Security selection within the communication services and information technology sectors held back relative performance.
-
FUND PERFORMANCE
The fund’s past performance is not a good predictor of the fund’s future performance. The graph and table below do not reflect the deduction of taxes that a shareholder would pay on fund distributions or the redemption of fund shares. The graph and table below assume reinvestment of dividends and capital gain distributions.
Growth of a Hypothetical $10,000 Investment
This graph shows the performance of a hypothetical $10,000 investment in Class R2 over a ten year period or since inception, if shorter, in comparison to (i) a broad measure of market performance and (ii) an additional index that MFS believes more closely reflects the market segments in which the fund invests.
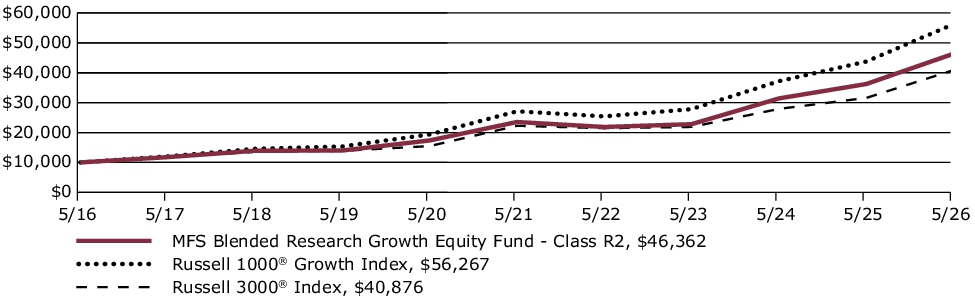
Average Annual Total Returns through 5/31/26
This table shows the average annual total returns of the class of shares noted for the periods shown, both with (if any) and without sales charges. It also shows the average annual total returns of (i) a broad measure of market performance and (ii) an additional index that MFS believes more closely reflects the market segments in which the fund invests, over the same periods.
| Share Class | 1-yr | 5-yr | 10-yr |
| R2 without sales charge | 27.96% | 14.53% | 16.58% |
| Comparative Benchmark(s) | |||
| Russell 3000® Index ∆ | 29.45% | 12.92% | 15.12% |
| Russell 1000® Growth Index ∆ | 28.66% | 15.73% | 18.86% |
|
∆
|
Source: FactSet Research Systems Inc.
|
Visit mfs.com/perf/r2 for more recent performance information.
FUND STATISTICS AS OF 5/31/26
| Net Assets ($): | 655,925,871 | Total Management Fee ($)#: | 1,421,778 | |
| Total Number of Holdings: | 72 | Portfolio Turnover Rate (%): | 52 |
# Includes the effect of any management fee waivers, if applicable.
Where the fund holds derivatives, they are not included in the total number of portfolio holdings.
PORTFOLIO COMPOSITION (BASED ON TOTAL INVESTMENTS AS OF 5/31/26)
Portfolio structure
| Equities | 99.7% |
| Money Market Funds | 0.3% |
Equity sectors
| Information Technology | 53.0% |
| Communication Services | 13.0% |
| Consumer Discretionary | 11.8% |
| Health Care | 7.2% |
| Financials | 6.1% |
| Industrials | 5.1% |
| Consumer Staples | 2.5% |
| Utilities | 0.6% |
| Energy | 0.3% |
| Real Estate | 0.1% |
Top ten holdings
| NVIDIA Corp. | 14.2% |
| Apple, Inc. | 12.8% |
| Microsoft Corp. | 8.5% |
| Broadcom, Inc. | 4.7% |
| Alphabet, Inc., "A" | 4.1% |
| Amazon.com, Inc. | 4.1% |
| Meta Platforms, Inc., "A" | 3.1% |
| Alphabet, Inc., "C" | 2.9% |
| Tesla, Inc. | 2.4% |
| Datadog, Inc., "A" | 1.8% |
MFS uses the Global Industry Classification Standard (GICS®) for sector/industry reporting. MFS has applied its own internal sector/industry classification methodology for equity securities and non-equity securities that are unclassified by GICS.
Top ten holdings
| NVIDIA Corp. | 14.2% |
| Apple, Inc. | 12.8% |
| Microsoft Corp. | 8.5% |
| Broadcom, Inc. | 4.7% |
| Alphabet, Inc., "A" | 4.1% |
| Amazon.com, Inc. | 4.1% |
| Meta Platforms, Inc., "A" | 3.1% |
| Alphabet, Inc., "C" | 2.9% |
| Tesla, Inc. | 2.4% |
| Datadog, Inc., "A" | 1.8% |
MATERIAL FUND CHANGES
This is a summary of certain changes to the fund since June 1, 2025. For more complete information, you may review the fund's prospectus as amended, which is available at funds.mfs.com or upon request at 1‑800‑225‑2606.
Effective October 1, 2025, the management fee is computed daily and paid monthly at the following annual rates based on the fund’s average daily net assets: 0.25% up to $5 billion; and 0.225% in excess of $5 billion.
Effective October 1, 2025, for Class R2 shares, the investment adviser has agreed in writing to pay a portion of the fund’s total annual operating expenses, excluding interest, taxes, extraordinary expenses, brokerage and transaction costs, certain tax reclaim recovery expenses (including contingency fees and closing agreement expenses), and investment-related expenses, such that total operating expenses do not exceed 0.89% annually of the class’s average daily net assets. This written agreement will continue until modified by the fund’s Board of Trustees, but such agreement will continue at least until September 30, 2027.
Effective October 1, 2025, the management fee is computed daily and paid monthly at the following annual rates based on the fund’s average daily net assets: 0.25% up to $5 billion; and 0.225% in excess of $5 billion.
Effective October 1, 2025, for Class R2 shares, the investment adviser has agreed in writing to pay a portion of the fund’s total annual operating expenses, excluding interest, taxes, extraordinary expenses, brokerage and transaction costs, certain tax reclaim recovery expenses (including contingency fees and closing agreement expenses), and investment-related expenses, such that total operating expenses do not exceed 0.89% annually of the class’s average daily net assets. This written agreement will continue until modified by the fund’s Board of Trustees, but such agreement will continue at least until September 30, 2027.
This is a summary of certain changes to the fund since June 1, 2025. For more complete information, you may review the fund's prospectus as amended, which is available at funds.mfs.com or upon request at 1‑800‑225‑2606.
This report describes certain changes to the Fund that occurred during the reporting period.
FUND EXPENSES
What were the fund costs for the last year?
| (based on a hypothetical $10,000 investment) | ||
| Class Name | Costs of a $10,000 investment | Costs paid as a percentage of a $10,000 investment |
| R3 | $76 | 0.67% |
MANAGEMENT'S DISCUSSION OF FUND PERFORMANCE
-
For the twelve months ended May 31, 2026, Class R3 shares of the MFS Blended Research Growth Equity Fund (fund) provided a total return of 28.29%, at net asset value. This compares with a return of 29.45% for the fund’s benchmark, the Russell 3000® Index. The fund's other benchmark, the Russell 1000® Growth Index, generated a return of 28.66%.
-
Global equity markets reached record levels during the period, withstanding considerable volatility amid tariffs, geopolitical conflict and high levels of uncertainty. A new geopolitical event distressed markets at the end of the period as US and Israeli forces launched strikes against Iran, disrupting Mideast oil and natural gas exports. During the period, a pro-growth tax and spending bill was signed into law in the US, while in Europe, renewed focus on defense and infrastructure spending brightened the economic outlook. In Japan, the election of a pro-growth prime minister sent stocks to new highs prior to the conflict in Iran. Optimism over artificial intelligence remained high.
-
Considerable progress was made in trade talks between the US and many major trading partners, with a fragile truce between the US and China extended through late 2026. While the US Supreme Court struck down part of the Trump administration’s tariff strategy, the administration began deploying other authorities to largely replace the ones that were ruled unconstitutional.
-
Early in the period, moderating inflation pressures allowed many global central banks to ease monetary policy. Amid a difficult policymaking environment and slower job growth, the Federal Reserve resumed easing policy in September and delivered quarter-point rate cuts in October and December before pausing.
-
In fixed income markets, previously range-bound global bond yields spiked following the onset of the Middle East conflict, as energy-driven inflation fears appeared to have rattled bond investors. US rate volatility (as measured by the Merrill Lynch Option Volatility Estimate (MOVE) Index) similarly rose from intra-period lows, reflecting uncertainty around the scope and duration of the conflict and its implications for global growth. However, volatility later retracted as the risk of a broader regional military escalation appeared less likely. Global credit spreads widened only modestly before stabilizing near prior levels, supported by strong demand and resilient underlying fundamentals.
-
Top contributors to performance relative to the Russell 1000® Growth Index:
-
Security selection within the financials and consumer discretionary sectors strengthened the fund's relative performance.
-
-
Top detractors from performance relative to the Russell 1000® Growth Index:
-
Security selection within the communication services and information technology sectors held back relative performance.
-
FUND PERFORMANCE
The fund’s past performance is not a good predictor of the fund’s future performance. The graph and table below do not reflect the deduction of taxes that a shareholder would pay on fund distributions or the redemption of fund shares. The graph and table below assume reinvestment of dividends and capital gain distributions.
Growth of a Hypothetical $10,000 Investment
This graph shows the performance of a hypothetical $10,000 investment in Class R3 over a ten year period or since inception, if shorter, in comparison to (i) a broad measure of market performance and (ii) an additional index that MFS believes more closely reflects the market segments in which the fund invests.
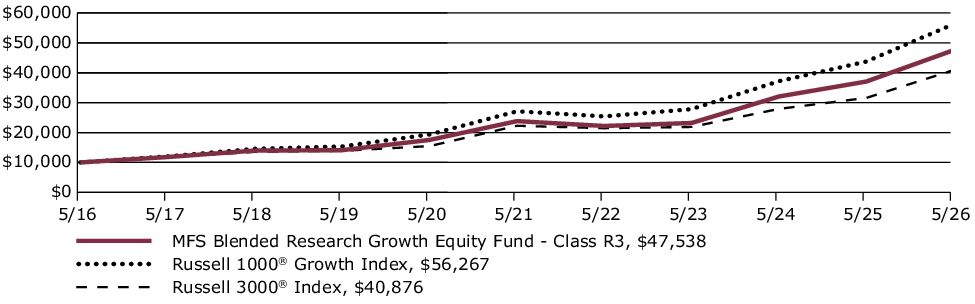
Average Annual Total Returns through 5/31/26
This table shows the average annual total returns of the class of shares noted for the periods shown, both with (if any) and without sales charges. It also shows the average annual total returns of (i) a broad measure of market performance and (ii) an additional index that MFS believes more closely reflects the market segments in which the fund invests, over the same periods.
| Share Class | 1-yr | 5-yr | 10-yr |
| R3 without sales charge | 28.29% | 14.82% | 16.87% |
| Comparative Benchmark(s) | |||
| Russell 3000® Index ∆ | 29.45% | 12.92% | 15.12% |
| Russell 1000® Growth Index ∆ | 28.66% | 15.73% | 18.86% |
|
∆
|
Source: FactSet Research Systems Inc.
|
Visit mfs.com/perf/r3 for more recent performance information.
FUND STATISTICS AS OF 5/31/26
| Net Assets ($): | 655,925,871 | Total Management Fee ($)#: | 1,421,778 | |
| Total Number of Holdings: | 72 | Portfolio Turnover Rate (%): | 52 |
# Includes the effect of any management fee waivers, if applicable.
Where the fund holds derivatives, they are not included in the total number of portfolio holdings.
PORTFOLIO COMPOSITION (BASED ON TOTAL INVESTMENTS AS OF 5/31/26)
Portfolio structure
| Equities | 99.7% |
| Money Market Funds | 0.3% |
Equity sectors
| Information Technology | 53.0% |
| Communication Services | 13.0% |
| Consumer Discretionary | 11.8% |
| Health Care | 7.2% |
| Financials | 6.1% |
| Industrials | 5.1% |
| Consumer Staples | 2.5% |
| Utilities | 0.6% |
| Energy | 0.3% |
| Real Estate | 0.1% |
Top ten holdings
| NVIDIA Corp. | 14.2% |
| Apple, Inc. | 12.8% |
| Microsoft Corp. | 8.5% |
| Broadcom, Inc. | 4.7% |
| Alphabet, Inc., "A" | 4.1% |
| Amazon.com, Inc. | 4.1% |
| Meta Platforms, Inc., "A" | 3.1% |
| Alphabet, Inc., "C" | 2.9% |
| Tesla, Inc. | 2.4% |
| Datadog, Inc., "A" | 1.8% |
MFS uses the Global Industry Classification Standard (GICS®) for sector/industry reporting. MFS has applied its own internal sector/industry classification methodology for equity securities and non-equity securities that are unclassified by GICS.
Top ten holdings
| NVIDIA Corp. | 14.2% |
| Apple, Inc. | 12.8% |
| Microsoft Corp. | 8.5% |
| Broadcom, Inc. | 4.7% |
| Alphabet, Inc., "A" | 4.1% |
| Amazon.com, Inc. | 4.1% |
| Meta Platforms, Inc., "A" | 3.1% |
| Alphabet, Inc., "C" | 2.9% |
| Tesla, Inc. | 2.4% |
| Datadog, Inc., "A" | 1.8% |
MATERIAL FUND CHANGES
This is a summary of certain changes to the fund since June 1, 2025. For more complete information, you may review the fund's prospectus as amended, which is available at funds.mfs.com or upon request at 1‑800‑225‑2606.
Effective October 1, 2025, the management fee is computed daily and paid monthly at the following annual rates based on the fund’s average daily net assets: 0.25% up to $5 billion; and 0.225% in excess of $5 billion.
Effective October 1, 2025, for Class R3 shares, the investment adviser has agreed in writing to pay a portion of the fund’s total annual operating expenses, excluding interest, taxes, extraordinary expenses, brokerage and transaction costs, certain tax reclaim recovery expenses (including contingency fees and closing agreement expenses), and investment-related expenses, such that total operating expenses do not exceed 0.64% annually of the class’s average daily net assets. This written agreement will continue until modified by the fund’s Board of Trustees, but such agreement will continue at least until September 30, 2027.
Effective October 1, 2025, the management fee is computed daily and paid monthly at the following annual rates based on the fund’s average daily net assets: 0.25% up to $5 billion; and 0.225% in excess of $5 billion.
Effective October 1, 2025, for Class R3 shares, the investment adviser has agreed in writing to pay a portion of the fund’s total annual operating expenses, excluding interest, taxes, extraordinary expenses, brokerage and transaction costs, certain tax reclaim recovery expenses (including contingency fees and closing agreement expenses), and investment-related expenses, such that total operating expenses do not exceed 0.64% annually of the class’s average daily net assets. This written agreement will continue until modified by the fund’s Board of Trustees, but such agreement will continue at least until September 30, 2027.
This is a summary of certain changes to the fund since June 1, 2025. For more complete information, you may review the fund's prospectus as amended, which is available at funds.mfs.com or upon request at 1‑800‑225‑2606.
This report describes certain changes to the Fund that occurred during the reporting period.
FUND EXPENSES
What were the fund costs for the last year?
| (based on a hypothetical $10,000 investment) | ||
| Class Name | Costs of a $10,000 investment | Costs paid as a percentage of a $10,000 investment |
| R4 | $48 | 0.42% |
MANAGEMENT'S DISCUSSION OF FUND PERFORMANCE
-
For the twelve months ended May 31, 2026, Class R4 shares of the MFS Blended Research Growth Equity Fund (fund) provided a total return of 28.60%, at net asset value. This compares with a return of 29.45% for the fund’s benchmark, the Russell 3000® Index. The fund's other benchmark, the Russell 1000® Growth Index, generated a return of 28.66%.
-
Global equity markets reached record levels during the period, withstanding considerable volatility amid tariffs, geopolitical conflict and high levels of uncertainty. A new geopolitical event distressed markets at the end of the period as US and Israeli forces launched strikes against Iran, disrupting Mideast oil and natural gas exports. During the period, a pro-growth tax and spending bill was signed into law in the US, while in Europe, renewed focus on defense and infrastructure spending brightened the economic outlook. In Japan, the election of a pro-growth prime minister sent stocks to new highs prior to the conflict in Iran. Optimism over artificial intelligence remained high.
-
Considerable progress was made in trade talks between the US and many major trading partners, with a fragile truce between the US and China extended through late 2026. While the US Supreme Court struck down part of the Trump administration’s tariff strategy, the administration began deploying other authorities to largely replace the ones that were ruled unconstitutional.
-
Early in the period, moderating inflation pressures allowed many global central banks to ease monetary policy. Amid a difficult policymaking environment and slower job growth, the Federal Reserve resumed easing policy in September and delivered quarter-point rate cuts in October and December before pausing.
-
In fixed income markets, previously range-bound global bond yields spiked following the onset of the Middle East conflict, as energy-driven inflation fears appeared to have rattled bond investors. US rate volatility (as measured by the Merrill Lynch Option Volatility Estimate (MOVE) Index) similarly rose from intra-period lows, reflecting uncertainty around the scope and duration of the conflict and its implications for global growth. However, volatility later retracted as the risk of a broader regional military escalation appeared less likely. Global credit spreads widened only modestly before stabilizing near prior levels, supported by strong demand and resilient underlying fundamentals.
-
Top contributors to performance relative to the Russell 1000® Growth Index:
-
Security selection within the financials and consumer discretionary sectors strengthened the fund's relative performance.
-
-
Top detractors from performance relative to the Russell 1000® Growth Index:
-
Security selection within the communication services and information technology sectors held back relative performance.
-
FUND PERFORMANCE
The fund’s past performance is not a good predictor of the fund’s future performance. The graph and table below do not reflect the deduction of taxes that a shareholder would pay on fund distributions or the redemption of fund shares. The graph and table below assume reinvestment of dividends and capital gain distributions.
Growth of a Hypothetical $10,000 Investment
This graph shows the performance of a hypothetical $10,000 investment in Class R4 over a ten year period or since inception, if shorter, in comparison to (i) a broad measure of market performance and (ii) an additional index that MFS believes more closely reflects the market segments in which the fund invests.
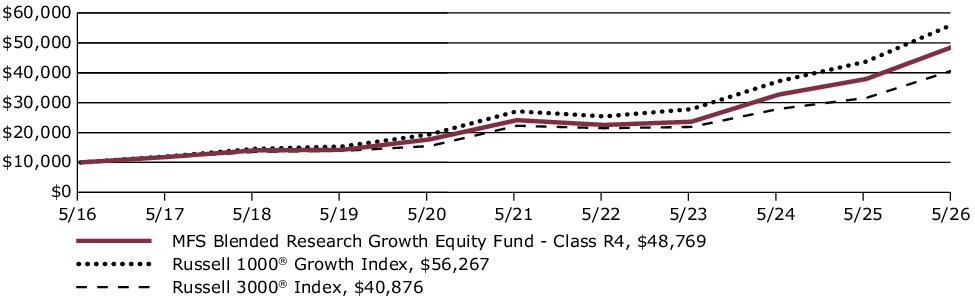
Average Annual Total Returns through 5/31/26
This table shows the average annual total returns of the class of shares noted for the periods shown, both with (if any) and without sales charges. It also shows the average annual total returns of (i) a broad measure of market performance and (ii) an additional index that MFS believes more closely reflects the market segments in which the fund invests, over the same periods.
| Share Class | 1-yr | 5-yr | 10-yr |
| R4 without sales charge | 28.60% | 15.10% | 17.17% |
| Comparative Benchmark(s) | |||
| Russell 3000® Index ∆ | 29.45% | 12.92% | 15.12% |
| Russell 1000® Growth Index ∆ | 28.66% | 15.73% | 18.86% |
|
∆
|
Source: FactSet Research Systems Inc.
|
Visit mfs.com/perf/r4 for more recent performance information.
FUND STATISTICS AS OF 5/31/26
| Net Assets ($): | 655,925,871 | Total Management Fee ($)#: | 1,421,778 | |
| Total Number of Holdings: | 72 | Portfolio Turnover Rate (%): | 52 |
# Includes the effect of any management fee waivers, if applicable.
Where the fund holds derivatives, they are not included in the total number of portfolio holdings.
PORTFOLIO COMPOSITION (BASED ON TOTAL INVESTMENTS AS OF 5/31/26)
Portfolio structure
| Equities | 99.7% |
| Money Market Funds | 0.3% |
Equity sectors
| Information Technology | 53.0% |
| Communication Services | 13.0% |
| Consumer Discretionary | 11.8% |
| Health Care | 7.2% |
| Financials | 6.1% |
| Industrials | 5.1% |
| Consumer Staples | 2.5% |
| Utilities | 0.6% |
| Energy | 0.3% |
| Real Estate | 0.1% |
Top ten holdings
| NVIDIA Corp. | 14.2% |
| Apple, Inc. | 12.8% |
| Microsoft Corp. | 8.5% |
| Broadcom, Inc. | 4.7% |
| Alphabet, Inc., "A" | 4.1% |
| Amazon.com, Inc. | 4.1% |
| Meta Platforms, Inc., "A" | 3.1% |
| Alphabet, Inc., "C" | 2.9% |
| Tesla, Inc. | 2.4% |
| Datadog, Inc., "A" | 1.8% |
MFS uses the Global Industry Classification Standard (GICS®) for sector/industry reporting. MFS has applied its own internal sector/industry classification methodology for equity securities and non-equity securities that are unclassified by GICS.
Top ten holdings
| NVIDIA Corp. | 14.2% |
| Apple, Inc. | 12.8% |
| Microsoft Corp. | 8.5% |
| Broadcom, Inc. | 4.7% |
| Alphabet, Inc., "A" | 4.1% |
| Amazon.com, Inc. | 4.1% |
| Meta Platforms, Inc., "A" | 3.1% |
| Alphabet, Inc., "C" | 2.9% |
| Tesla, Inc. | 2.4% |
| Datadog, Inc., "A" | 1.8% |
MATERIAL FUND CHANGES
This is a summary of certain changes to the fund since June 1, 2025. For more complete information, you may review the fund's prospectus as amended, which is available at funds.mfs.com or upon request at 1‑800‑225‑2606.
Effective October 1, 2025, the management fee is computed daily and paid monthly at the following annual rates based on the fund’s average daily net assets: 0.25% up to $5 billion; and 0.225% in excess of $5 billion.
Effective October 1, 2025, for Class R4 shares, the investment adviser has agreed in writing to pay a portion of the fund’s total annual operating expenses, excluding interest, taxes, extraordinary expenses, brokerage and transaction costs, certain tax reclaim recovery expenses (including contingency fees and closing agreement expenses), and investment-related expenses, such that total operating expenses do not exceed 0.39% annually of the class’s average daily net assets. This written agreement will continue until modified by the fund’s Board of Trustees, but such agreement will continue at least until September 30, 2027.
Effective October 1, 2025, the management fee is computed daily and paid monthly at the following annual rates based on the fund’s average daily net assets: 0.25% up to $5 billion; and 0.225% in excess of $5 billion.
Effective October 1, 2025, for Class R4 shares, the investment adviser has agreed in writing to pay a portion of the fund’s total annual operating expenses, excluding interest, taxes, extraordinary expenses, brokerage and transaction costs, certain tax reclaim recovery expenses (including contingency fees and closing agreement expenses), and investment-related expenses, such that total operating expenses do not exceed 0.39% annually of the class’s average daily net assets. This written agreement will continue until modified by the fund’s Board of Trustees, but such agreement will continue at least until September 30, 2027.
This is a summary of certain changes to the fund since June 1, 2025. For more complete information, you may review the fund's prospectus as amended, which is available at funds.mfs.com or upon request at 1‑800‑225‑2606.
This report describes certain changes to the Fund that occurred during the reporting period.
FUND EXPENSES
What were the fund costs for the last year?
| (based on a hypothetical $10,000 investment) | ||
| Class Name | Costs of a $10,000 investment | Costs paid as a percentage of a $10,000 investment |
| R6 | $40 | 0.35% |
MANAGEMENT'S DISCUSSION OF FUND PERFORMANCE
-
For the twelve months ended May 31, 2026, Class R6 shares of the MFS Blended Research Growth Equity Fund (fund) provided a total return of 28.70%, at net asset value. This compares with a return of 29.45% for the fund’s benchmark, the Russell 3000® Index. The fund's other benchmark, the Russell 1000® Growth Index, generated a return of 28.66%.
-
Global equity markets reached record levels during the period, withstanding considerable volatility amid tariffs, geopolitical conflict and high levels of uncertainty. A new geopolitical event distressed markets at the end of the period as US and Israeli forces launched strikes against Iran, disrupting Mideast oil and natural gas exports. During the period, a pro-growth tax and spending bill was signed into law in the US, while in Europe, renewed focus on defense and infrastructure spending brightened the economic outlook. In Japan, the election of a pro-growth prime minister sent stocks to new highs prior to the conflict in Iran. Optimism over artificial intelligence remained high.
-
Considerable progress was made in trade talks between the US and many major trading partners, with a fragile truce between the US and China extended through late 2026. While the US Supreme Court struck down part of the Trump administration’s tariff strategy, the administration began deploying other authorities to largely replace the ones that were ruled unconstitutional.
-
Early in the period, moderating inflation pressures allowed many global central banks to ease monetary policy. Amid a difficult policymaking environment and slower job growth, the Federal Reserve resumed easing policy in September and delivered quarter-point rate cuts in October and December before pausing.
-
In fixed income markets, previously range-bound global bond yields spiked following the onset of the Middle East conflict, as energy-driven inflation fears appeared to have rattled bond investors. US rate volatility (as measured by the Merrill Lynch Option Volatility Estimate (MOVE) Index) similarly rose from intra-period lows, reflecting uncertainty around the scope and duration of the conflict and its implications for global growth. However, volatility later retracted as the risk of a broader regional military escalation appeared less likely. Global credit spreads widened only modestly before stabilizing near prior levels, supported by strong demand and resilient underlying fundamentals.
-
Top contributors to performance relative to the Russell 1000® Growth Index:
-
Security selection within the financials and consumer discretionary sectors strengthened the fund's relative performance.
-
-
Top detractors from performance relative to the Russell 1000® Growth Index:
-
Security selection within the communication services and information technology sectors held back relative performance.
-
FUND PERFORMANCE
The fund’s past performance is not a good predictor of the fund’s future performance. The graph and table below do not reflect the deduction of taxes that a shareholder would pay on fund distributions or the redemption of fund shares. The graph and table below assume reinvestment of dividends and capital gain distributions.
Growth of a Hypothetical $10,000 Investment
This graph shows the performance of a hypothetical $10,000 investment in Class R6 over a ten year period or since inception, if shorter, in comparison to (i) a broad measure of market performance and (ii) an additional index that MFS believes more closely reflects the market segments in which the fund invests.
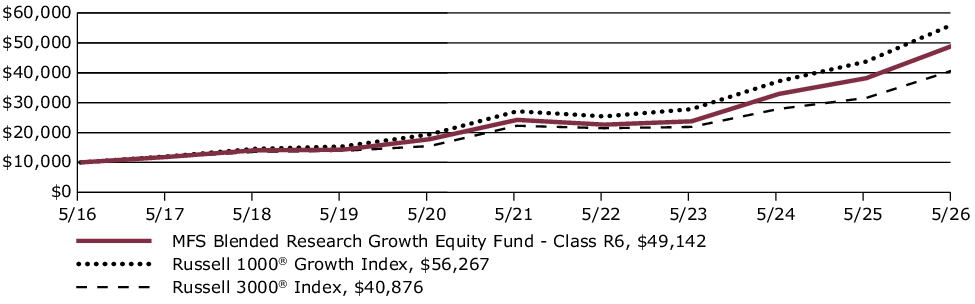
Average Annual Total Returns through 5/31/26
This table shows the average annual total returns of the class of shares noted for the periods shown, both with (if any) and without sales charges. It also shows the average annual total returns of (i) a broad measure of market performance and (ii) an additional index that MFS believes more closely reflects the market segments in which the fund invests, over the same periods.
| Share Class | 1-yr | 5-yr | 10-yr |
| R6 without sales charge | 28.70% | 15.19% | 17.26% |
| Comparative Benchmark(s) | |||
| Russell 3000® Index ∆ | 29.45% | 12.92% | 15.12% |
| Russell 1000® Growth Index ∆ | 28.66% | 15.73% | 18.86% |
|
∆
|
Source: FactSet Research Systems Inc.
|
Visit mfs.com/perf/r6 for more recent performance information.
FUND STATISTICS AS OF 5/31/26
| Net Assets ($): | 655,925,871 | Total Management Fee ($)#: | 1,421,778 | |
| Total Number of Holdings: | 72 | Portfolio Turnover Rate (%): | 52 |
# Includes the effect of any management fee waivers, if applicable.
Where the fund holds derivatives, they are not included in the total number of portfolio holdings.
PORTFOLIO COMPOSITION (BASED ON TOTAL INVESTMENTS AS OF 5/31/26)
Portfolio structure
| Equities | 99.7% |
| Money Market Funds | 0.3% |
Equity sectors
| Information Technology | 53.0% |
| Communication Services | 13.0% |
| Consumer Discretionary | 11.8% |
| Health Care | 7.2% |
| Financials | 6.1% |
| Industrials | 5.1% |
| Consumer Staples | 2.5% |
| Utilities | 0.6% |
| Energy | 0.3% |
| Real Estate | 0.1% |
Top ten holdings
| NVIDIA Corp. | 14.2% |
| Apple, Inc. | 12.8% |
| Microsoft Corp. | 8.5% |
| Broadcom, Inc. | 4.7% |
| Alphabet, Inc., "A" | 4.1% |
| Amazon.com, Inc. | 4.1% |
| Meta Platforms, Inc., "A" | 3.1% |
| Alphabet, Inc., "C" | 2.9% |
| Tesla, Inc. | 2.4% |
| Datadog, Inc., "A" | 1.8% |
MFS uses the Global Industry Classification Standard (GICS®) for sector/industry reporting. MFS has applied its own internal sector/industry classification methodology for equity securities and non-equity securities that are unclassified by GICS.
Top ten holdings
| NVIDIA Corp. | 14.2% |
| Apple, Inc. | 12.8% |
| Microsoft Corp. | 8.5% |
| Broadcom, Inc. | 4.7% |
| Alphabet, Inc., "A" | 4.1% |
| Amazon.com, Inc. | 4.1% |
| Meta Platforms, Inc., "A" | 3.1% |
| Alphabet, Inc., "C" | 2.9% |
| Tesla, Inc. | 2.4% |
| Datadog, Inc., "A" | 1.8% |
MATERIAL FUND CHANGES
This is a summary of certain changes to the fund since June 1, 2025. For more complete information, you may review the fund's prospectus as amended, which is available at funds.mfs.com or upon request at 1‑800‑225‑2606.
Effective October 1, 2025, the management fee is computed daily and paid monthly at the following annual rates based on the fund’s average daily net assets: 0.25% up to $5 billion; and 0.225% in excess of $5 billion.
Effective October 1, 2025, for Class R6 shares, the investment adviser has agreed in writing to pay a portion of the fund’s total annual operating expenses, excluding interest, taxes, extraordinary expenses, brokerage and transaction costs, certain tax reclaim recovery expenses (including contingency fees and closing agreement expenses), and investment-related expenses, such that total operating expenses do not exceed 0.33% annually of the class’s average daily net assets. This written agreement will continue until modified by the fund’s Board of Trustees, but such agreement will continue at least until September 30, 2027.
Effective October 1, 2025, the management fee is computed daily and paid monthly at the following annual rates based on the fund’s average daily net assets: 0.25% up to $5 billion; and 0.225% in excess of $5 billion.
Effective October 1, 2025, for Class R6 shares, the investment adviser has agreed in writing to pay a portion of the fund’s total annual operating expenses, excluding interest, taxes, extraordinary expenses, brokerage and transaction costs, certain tax reclaim recovery expenses (including contingency fees and closing agreement expenses), and investment-related expenses, such that total operating expenses do not exceed 0.33% annually of the class’s average daily net assets. This written agreement will continue until modified by the fund’s Board of Trustees, but such agreement will continue at least until September 30, 2027.
This is a summary of certain changes to the fund since June 1, 2025. For more complete information, you may review the fund's prospectus as amended, which is available at funds.mfs.com or upon request at 1‑800‑225‑2606.
FUND EXPENSES
What were the fund costs for the last year?
| (based on a hypothetical $10,000 investment) | ||
| Class Name | Costs of a $10,000 investment | Costs paid as a percentage of a $10,000 investment |
| R6 | $75 | 0.64% |
MANAGEMENT'S DISCUSSION OF FUND PERFORMANCE
-
For the twelve months ended May 31, 2026, Class R6 shares of the MFS Blended Research Small Cap Equity Fund (fund) provided a total return of 32.96%, at net asset value. This compares with a return of 29.45% for the fund’s benchmark, the Russell 3000® Index. The fund's other benchmark, the Russell 2000® Index, generated a return of 43.08%.
-
Global equity markets reached record levels during the period, withstanding considerable volatility amid tariffs, geopolitical conflict and high levels of uncertainty. A new geopolitical event distressed markets at the end of the period as US and Israeli forces launched strikes against Iran, disrupting Mideast oil and natural gas exports. During the period, a pro-growth tax and spending bill was signed into law in the US, while in Europe, renewed focus on defense and infrastructure spending brightened the economic outlook. In Japan, the election of a pro-growth prime minister sent stocks to new highs prior to the conflict in Iran. Optimism over artificial intelligence remained high.
-
Considerable progress was made in trade talks between the US and many major trading partners, with a fragile truce between the US and China extended through late 2026. While the US Supreme Court struck down part of the Trump administration’s tariff strategy, the administration began deploying other authorities to largely replace the ones that were ruled unconstitutional.
-
Early in the period, moderating inflation pressures allowed many global central banks to ease monetary policy. Amid a difficult policymaking environment and slower job growth, the Federal Reserve resumed easing policy in September and delivered quarter-point rate cuts in October and December before pausing.
-
In fixed income markets, previously range-bound global bond yields spiked following the onset of the Middle East conflict, as energy-driven inflation fears appeared to have rattled bond investors. US rate volatility (as measured by the Merrill Lynch Option Volatility Estimate (MOVE) Index) similarly rose from intra-period lows, reflecting uncertainty around the scope and duration of the conflict and its implications for global growth. However, volatility later retracted as the risk of a broader regional military escalation appeared less likely. Global credit spreads widened only modestly before stabilizing near prior levels, supported by strong demand and resilient underlying fundamentals.
-
Top contributors to performance relative to the Russell 2000® Index:
-
Security selection within the industrials sector strengthened the fund's relative performance.
-
-
Top detractors from performance relative to the Russell 2000® Index:
-
Security selection within the health care, information technology, and materials sectors held back relative performance.
-
FUND PERFORMANCE
The fund’s past performance is not a good predictor of the fund’s future performance. The graph and table below do not reflect the deduction of taxes that a shareholder would pay on fund distributions or the redemption of fund shares. The graph and table below assume reinvestment of dividends and capital gain distributions.
Growth of a Hypothetical $10,000 Investment
This graph shows the performance of a hypothetical $10,000 investment in Class R6 over a ten year period or since inception, if shorter, in comparison to (i) a broad measure of market performance and (ii) an additional index that MFS believes more closely reflects the market segments in which the fund invests.
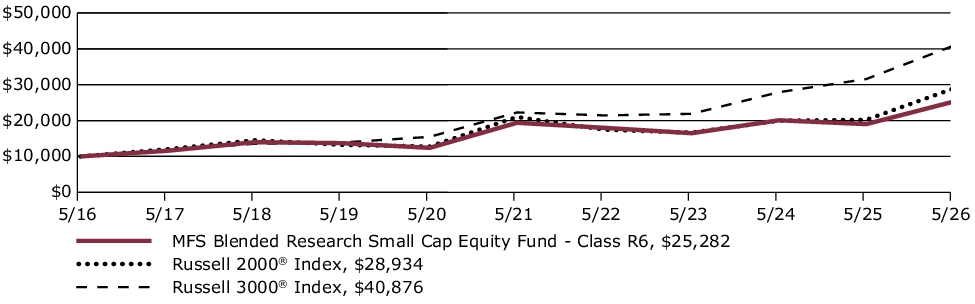
Average Annual Total Returns through 5/31/26
This table shows the average annual total returns of the class of shares noted for the periods shown, both with (if any) and without sales charges. It also shows the average annual total returns of (i) a broad measure of market performance and (ii) an additional index that MFS believes more closely reflects the market segments in which the fund invests, over the same periods.
| Share Class | 1-yr | 5-yr | 10-yr |
| R6 without sales charge | 32.96% | 5.45% | 9.72% |
| Comparative Benchmark(s) | |||
| Russell 3000® Index ∆ | 29.45% | 12.92% | 15.12% |
| Russell 2000® Index ∆ | 43.08% | 6.61% | 11.21% |
|
∆
|
Source: FactSet Research Systems Inc.
|
Visit mfs.com/perf/r6 for more recent performance information.
FUND STATISTICS AS OF 5/31/26
| Net Assets ($): | 326,447,876 | Total Management Fee ($)#: | 2,005,584 | |
| Total Number of Holdings: | 236 | Portfolio Turnover Rate (%): | 73 |
# Includes the effect of any management fee waivers, if applicable.
Where the fund holds derivatives, they are not included in the total number of portfolio holdings.
PORTFOLIO COMPOSITION (BASED ON TOTAL INVESTMENTS AS OF 5/31/26)
Portfolio structure
| Equities | 97.7% |
| Money Market Funds | 2.3% |
Equity sectors
| Industrials | 18.9% |
| Information Technology | 18.8% |
| Health Care | 15.9% |
| Financials | 15.6% |
| Consumer Discretionary | 7.1% |
| Materials | 5.2% |
| Energy | 5.1% |
| Real Estate | 4.2% |
| Utilities | 3.1% |
| Communication Services | 2.0% |
| Consumer Staples | 1.8% |
Top ten holdings
| Corsair Gaming, Inc. | 2.0% |
| Bloom Energy Corp. | 1.9% |
| MYR Group, Inc. | 1.7% |
| Formfactor, Inc. | 1.7% |
| UMB Financial Corp. | 1.5% |
| Modine Manufacturing Co. | 1.5% |
| Portland General Electric Co. | 1.5% |
| Weatherford International PLC | 1.4% |
| Popular, Inc. | 1.4% |
| Advanced Energy Industries, Inc. | 1.4% |
MFS uses the Global Industry Classification Standard (GICS®) for sector/industry reporting. MFS has applied its own internal sector/industry classification methodology for equity securities and non-equity securities that are unclassified by GICS.
Top ten holdings
| Corsair Gaming, Inc. | 2.0% |
| Bloom Energy Corp. | 1.9% |
| MYR Group, Inc. | 1.7% |
| Formfactor, Inc. | 1.7% |
| UMB Financial Corp. | 1.5% |
| Modine Manufacturing Co. | 1.5% |
| Portland General Electric Co. | 1.5% |
| Weatherford International PLC | 1.4% |
| Popular, Inc. | 1.4% |
| Advanced Energy Industries, Inc. | 1.4% |
FUND EXPENSES
What were the fund costs for the last year?
| (based on a hypothetical $10,000 investment) | ||
| Class Name | Costs of a $10,000 investment | Costs paid as a percentage of a $10,000 investment |
| R4 | $86 | 0.74% |
MANAGEMENT'S DISCUSSION OF FUND PERFORMANCE
-
For the twelve months ended May 31, 2026, Class R4 shares of the MFS Blended Research Small Cap Equity Fund (fund) provided a total return of 32.81%, at net asset value. This compares with a return of 29.45% for the fund’s benchmark, the Russell 3000® Index. The fund's other benchmark, the Russell 2000® Index, generated a return of 43.08%.
-
Global equity markets reached record levels during the period, withstanding considerable volatility amid tariffs, geopolitical conflict and high levels of uncertainty. A new geopolitical event distressed markets at the end of the period as US and Israeli forces launched strikes against Iran, disrupting Mideast oil and natural gas exports. During the period, a pro-growth tax and spending bill was signed into law in the US, while in Europe, renewed focus on defense and infrastructure spending brightened the economic outlook. In Japan, the election of a pro-growth prime minister sent stocks to new highs prior to the conflict in Iran. Optimism over artificial intelligence remained high.
-
Considerable progress was made in trade talks between the US and many major trading partners, with a fragile truce between the US and China extended through late 2026. While the US Supreme Court struck down part of the Trump administration’s tariff strategy, the administration began deploying other authorities to largely replace the ones that were ruled unconstitutional.
-
Early in the period, moderating inflation pressures allowed many global central banks to ease monetary policy. Amid a difficult policymaking environment and slower job growth, the Federal Reserve resumed easing policy in September and delivered quarter-point rate cuts in October and December before pausing.
-
In fixed income markets, previously range-bound global bond yields spiked following the onset of the Middle East conflict, as energy-driven inflation fears appeared to have rattled bond investors. US rate volatility (as measured by the Merrill Lynch Option Volatility Estimate (MOVE) Index) similarly rose from intra-period lows, reflecting uncertainty around the scope and duration of the conflict and its implications for global growth. However, volatility later retracted as the risk of a broader regional military escalation appeared less likely. Global credit spreads widened only modestly before stabilizing near prior levels, supported by strong demand and resilient underlying fundamentals.
-
Top contributors to performance relative to the Russell 2000® Index:
-
Security selection within the industrials sector strengthened the fund's relative performance.
-
-
Top detractors from performance relative to the Russell 2000® Index:
-
Security selection within the health care, information technology, and materials sectors held back relative performance.
-
FUND PERFORMANCE
The fund’s past performance is not a good predictor of the fund’s future performance. The graph and table below do not reflect the deduction of taxes that a shareholder would pay on fund distributions or the redemption of fund shares. The graph and table below assume reinvestment of dividends and capital gain distributions.
Growth of a Hypothetical $10,000 Investment
This graph shows the performance of a hypothetical $10,000 investment in Class R4 over a ten year period or since inception, if shorter, in comparison to (i) a broad measure of market performance and (ii) an additional index that MFS believes more closely reflects the market segments in which the fund invests.
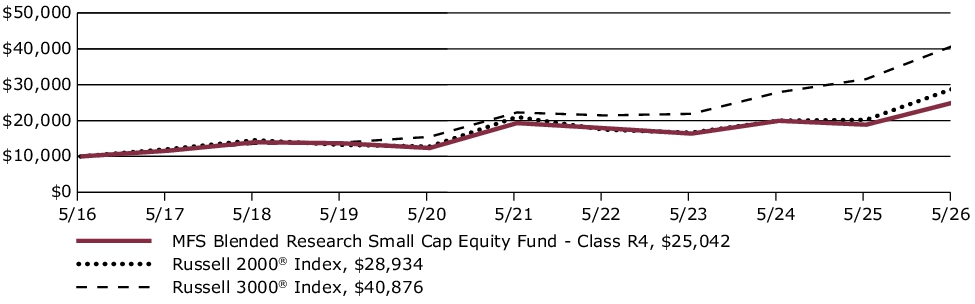
Average Annual Total Returns through 5/31/26
This table shows the average annual total returns of the class of shares noted for the periods shown, both with (if any) and without sales charges. It also shows the average annual total returns of (i) a broad measure of market performance and (ii) an additional index that MFS believes more closely reflects the market segments in which the fund invests, over the same periods.
| Share Class | 1-yr | 5-yr | 10-yr |
| R4 without sales charge | 32.81% | 5.35% | 9.61% |
| Comparative Benchmark(s) | |||
| Russell 3000® Index ∆ | 29.45% | 12.92% | 15.12% |
| Russell 2000® Index ∆ | 43.08% | 6.61% | 11.21% |
|
∆
|
Source: FactSet Research Systems Inc.
|
Visit mfs.com/perf/r4 for more recent performance information.
FUND STATISTICS AS OF 5/31/26
| Net Assets ($): | 326,447,876 | Total Management Fee ($)#: | 2,005,584 | |
| Total Number of Holdings: | 236 | Portfolio Turnover Rate (%): | 73 |
# Includes the effect of any management fee waivers, if applicable.
Where the fund holds derivatives, they are not included in the total number of portfolio holdings.
PORTFOLIO COMPOSITION (BASED ON TOTAL INVESTMENTS AS OF 5/31/26)
Portfolio structure
| Equities | 97.7% |
| Money Market Funds | 2.3% |
Equity sectors
| Industrials | 18.9% |
| Information Technology | 18.8% |
| Health Care | 15.9% |
| Financials | 15.6% |
| Consumer Discretionary | 7.1% |
| Materials | 5.2% |
| Energy | 5.1% |
| Real Estate | 4.2% |
| Utilities | 3.1% |
| Communication Services | 2.0% |
| Consumer Staples | 1.8% |
Top ten holdings
| Corsair Gaming, Inc. | 2.0% |
| Bloom Energy Corp. | 1.9% |
| MYR Group, Inc. | 1.7% |
| Formfactor, Inc. | 1.7% |
| UMB Financial Corp. | 1.5% |
| Modine Manufacturing Co. | 1.5% |
| Portland General Electric Co. | 1.5% |
| Weatherford International PLC | 1.4% |
| Popular, Inc. | 1.4% |
| Advanced Energy Industries, Inc. | 1.4% |
MFS uses the Global Industry Classification Standard (GICS®) for sector/industry reporting. MFS has applied its own internal sector/industry classification methodology for equity securities and non-equity securities that are unclassified by GICS.
Top ten holdings
| Corsair Gaming, Inc. | 2.0% |
| Bloom Energy Corp. | 1.9% |
| MYR Group, Inc. | 1.7% |
| Formfactor, Inc. | 1.7% |
| UMB Financial Corp. | 1.5% |
| Modine Manufacturing Co. | 1.5% |
| Portland General Electric Co. | 1.5% |
| Weatherford International PLC | 1.4% |
| Popular, Inc. | 1.4% |
| Advanced Energy Industries, Inc. | 1.4% |
FUND EXPENSES
What were the fund costs for the last year?
| (based on a hypothetical $10,000 investment) | ||
| Class Name | Costs of a $10,000 investment | Costs paid as a percentage of a $10,000 investment |
| R3 | $115 | 0.99% |
MANAGEMENT'S DISCUSSION OF FUND PERFORMANCE
-
For the twelve months ended May 31, 2026, Class R3 shares of the MFS Blended Research Small Cap Equity Fund (fund) provided a total return of 32.48%, at net asset value. This compares with a return of 29.45% for the fund’s benchmark, the Russell 3000® Index. The fund's other benchmark, the Russell 2000® Index, generated a return of 43.08%.
-
Global equity markets reached record levels during the period, withstanding considerable volatility amid tariffs, geopolitical conflict and high levels of uncertainty. A new geopolitical event distressed markets at the end of the period as US and Israeli forces launched strikes against Iran, disrupting Mideast oil and natural gas exports. During the period, a pro-growth tax and spending bill was signed into law in the US, while in Europe, renewed focus on defense and infrastructure spending brightened the economic outlook. In Japan, the election of a pro-growth prime minister sent stocks to new highs prior to the conflict in Iran. Optimism over artificial intelligence remained high.
-
Considerable progress was made in trade talks between the US and many major trading partners, with a fragile truce between the US and China extended through late 2026. While the US Supreme Court struck down part of the Trump administration’s tariff strategy, the administration began deploying other authorities to largely replace the ones that were ruled unconstitutional.
-
Early in the period, moderating inflation pressures allowed many global central banks to ease monetary policy. Amid a difficult policymaking environment and slower job growth, the Federal Reserve resumed easing policy in September and delivered quarter-point rate cuts in October and December before pausing.
-
In fixed income markets, previously range-bound global bond yields spiked following the onset of the Middle East conflict, as energy-driven inflation fears appeared to have rattled bond investors. US rate volatility (as measured by the Merrill Lynch Option Volatility Estimate (MOVE) Index) similarly rose from intra-period lows, reflecting uncertainty around the scope and duration of the conflict and its implications for global growth. However, volatility later retracted as the risk of a broader regional military escalation appeared less likely. Global credit spreads widened only modestly before stabilizing near prior levels, supported by strong demand and resilient underlying fundamentals.
-
Top contributors to performance relative to the Russell 2000® Index:
-
Security selection within the industrials sector strengthened the fund's relative performance.
-
-
Top detractors from performance relative to the Russell 2000® Index:
-
Security selection within the health care, information technology, and materials sectors held back relative performance.
-
FUND PERFORMANCE
The fund’s past performance is not a good predictor of the fund’s future performance. The graph and table below do not reflect the deduction of taxes that a shareholder would pay on fund distributions or the redemption of fund shares. The graph and table below assume reinvestment of dividends and capital gain distributions.
Growth of a Hypothetical $10,000 Investment
This graph shows the performance of a hypothetical $10,000 investment in Class R3 over a ten year period or since inception, if shorter, in comparison to (i) a broad measure of market performance and (ii) an additional index that MFS believes more closely reflects the market segments in which the fund invests.
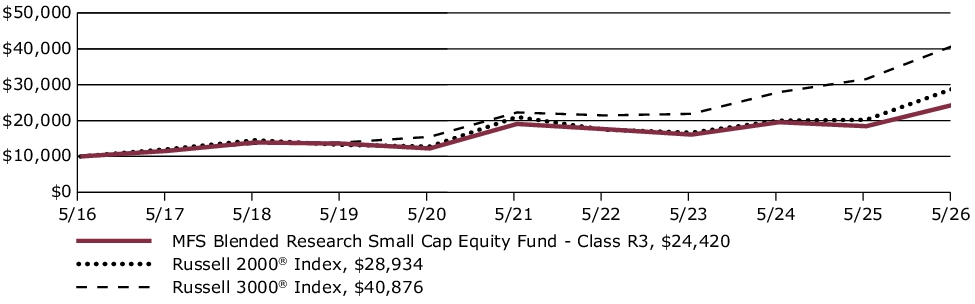
Average Annual Total Returns through 5/31/26
This table shows the average annual total returns of the class of shares noted for the periods shown, both with (if any) and without sales charges. It also shows the average annual total returns of (i) a broad measure of market performance and (ii) an additional index that MFS believes more closely reflects the market segments in which the fund invests, over the same periods.
| Share Class | 1-yr | 5-yr | 10-yr |
| R3 without sales charge | 32.48% | 5.08% | 9.34% |
| Comparative Benchmark(s) | |||
| Russell 3000® Index ∆ | 29.45% | 12.92% | 15.12% |
| Russell 2000® Index ∆ | 43.08% | 6.61% | 11.21% |
|
∆
|
Source: FactSet Research Systems Inc.
|
Visit mfs.com/perf/r3 for more recent performance information.
FUND STATISTICS AS OF 5/31/26
| Net Assets ($): | 326,447,876 | Total Management Fee ($)#: | 2,005,584 | |
| Total Number of Holdings: | 236 | Portfolio Turnover Rate (%): | 73 |
# Includes the effect of any management fee waivers, if applicable.
Where the fund holds derivatives, they are not included in the total number of portfolio holdings.
PORTFOLIO COMPOSITION (BASED ON TOTAL INVESTMENTS AS OF 5/31/26)
Portfolio structure
| Equities | 97.7% |
| Money Market Funds | 2.3% |
Equity sectors
| Industrials | 18.9% |
| Information Technology | 18.8% |
| Health Care | 15.9% |
| Financials | 15.6% |
| Consumer Discretionary | 7.1% |
| Materials | 5.2% |
| Energy | 5.1% |
| Real Estate | 4.2% |
| Utilities | 3.1% |
| Communication Services | 2.0% |
| Consumer Staples | 1.8% |
Top ten holdings
| Corsair Gaming, Inc. | 2.0% |
| Bloom Energy Corp. | 1.9% |
| MYR Group, Inc. | 1.7% |
| Formfactor, Inc. | 1.7% |
| UMB Financial Corp. | 1.5% |
| Modine Manufacturing Co. | 1.5% |
| Portland General Electric Co. | 1.5% |
| Weatherford International PLC | 1.4% |
| Popular, Inc. | 1.4% |
| Advanced Energy Industries, Inc. | 1.4% |
MFS uses the Global Industry Classification Standard (GICS®) for sector/industry reporting. MFS has applied its own internal sector/industry classification methodology for equity securities and non-equity securities that are unclassified by GICS.
Top ten holdings
| Corsair Gaming, Inc. | 2.0% |
| Bloom Energy Corp. | 1.9% |
| MYR Group, Inc. | 1.7% |
| Formfactor, Inc. | 1.7% |
| UMB Financial Corp. | 1.5% |
| Modine Manufacturing Co. | 1.5% |
| Portland General Electric Co. | 1.5% |
| Weatherford International PLC | 1.4% |
| Popular, Inc. | 1.4% |
| Advanced Energy Industries, Inc. | 1.4% |
FUND EXPENSES
What were the fund costs for the last year?
| (based on a hypothetical $10,000 investment) | ||
| Class Name | Costs of a $10,000 investment | Costs paid as a percentage of a $10,000 investment |
| R2 | $144 | 1.24% |
MANAGEMENT'S DISCUSSION OF FUND PERFORMANCE
-
For the twelve months ended May 31, 2026, Class R2 shares of the MFS Blended Research Small Cap Equity Fund (fund) provided a total return of 32.08%, at net asset value. This compares with a return of 29.45% for the fund’s benchmark, the Russell 3000® Index. The fund's other benchmark, the Russell 2000® Index, generated a return of 43.08%.
-
Global equity markets reached record levels during the period, withstanding considerable volatility amid tariffs, geopolitical conflict and high levels of uncertainty. A new geopolitical event distressed markets at the end of the period as US and Israeli forces launched strikes against Iran, disrupting Mideast oil and natural gas exports. During the period, a pro-growth tax and spending bill was signed into law in the US, while in Europe, renewed focus on defense and infrastructure spending brightened the economic outlook. In Japan, the election of a pro-growth prime minister sent stocks to new highs prior to the conflict in Iran. Optimism over artificial intelligence remained high.
-
Considerable progress was made in trade talks between the US and many major trading partners, with a fragile truce between the US and China extended through late 2026. While the US Supreme Court struck down part of the Trump administration’s tariff strategy, the administration began deploying other authorities to largely replace the ones that were ruled unconstitutional.
-
Early in the period, moderating inflation pressures allowed many global central banks to ease monetary policy. Amid a difficult policymaking environment and slower job growth, the Federal Reserve resumed easing policy in September and delivered quarter-point rate cuts in October and December before pausing.
-
In fixed income markets, previously range-bound global bond yields spiked following the onset of the Middle East conflict, as energy-driven inflation fears appeared to have rattled bond investors. US rate volatility (as measured by the Merrill Lynch Option Volatility Estimate (MOVE) Index) similarly rose from intra-period lows, reflecting uncertainty around the scope and duration of the conflict and its implications for global growth. However, volatility later retracted as the risk of a broader regional military escalation appeared less likely. Global credit spreads widened only modestly before stabilizing near prior levels, supported by strong demand and resilient underlying fundamentals.
-
Top contributors to performance relative to the Russell 2000® Index:
-
Security selection within the industrials sector strengthened the fund's relative performance.
-
-
Top detractors from performance relative to the Russell 2000® Index:
-
Security selection within the health care, information technology, and materials sectors held back relative performance.
-
FUND PERFORMANCE
The fund’s past performance is not a good predictor of the fund’s future performance. The graph and table below do not reflect the deduction of taxes that a shareholder would pay on fund distributions or the redemption of fund shares. The graph and table below assume reinvestment of dividends and capital gain distributions.
Growth of a Hypothetical $10,000 Investment
This graph shows the performance of a hypothetical $10,000 investment in Class R2 over a ten year period or since inception, if shorter, in comparison to (i) a broad measure of market performance and (ii) an additional index that MFS believes more closely reflects the market segments in which the fund invests.
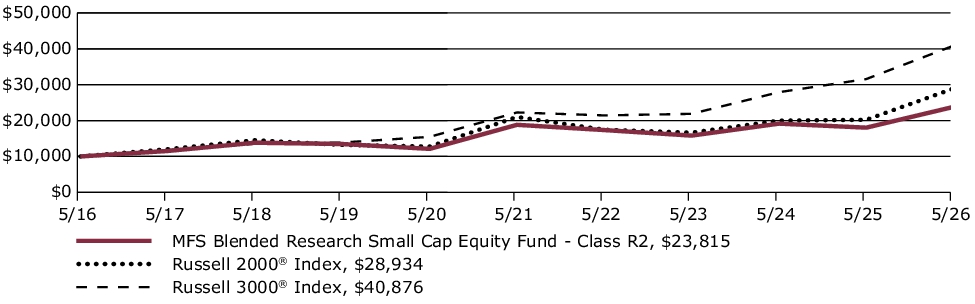
Average Annual Total Returns through 5/31/26
This table shows the average annual total returns of the class of shares noted for the periods shown, both with (if any) and without sales charges. It also shows the average annual total returns of (i) a broad measure of market performance and (ii) an additional index that MFS believes more closely reflects the market segments in which the fund invests, over the same periods.
| Share Class | 1-yr | 5-yr | 10-yr |
| R2 without sales charge | 32.08% | 4.82% | 9.06% |
| Comparative Benchmark(s) | |||
| Russell 3000® Index ∆ | 29.45% | 12.92% | 15.12% |
| Russell 2000® Index ∆ | 43.08% | 6.61% | 11.21% |
|
∆
|
Source: FactSet Research Systems Inc.
|
Visit mfs.com/perf/r2 for more recent performance information.
FUND STATISTICS AS OF 5/31/26
| Net Assets ($): | 326,447,876 | Total Management Fee ($)#: | 2,005,584 | |
| Total Number of Holdings: | 236 | Portfolio Turnover Rate (%): | 73 |
# Includes the effect of any management fee waivers, if applicable.
Where the fund holds derivatives, they are not included in the total number of portfolio holdings.
PORTFOLIO COMPOSITION (BASED ON TOTAL INVESTMENTS AS OF 5/31/26)
Portfolio structure
| Equities | 97.7% |
| Money Market Funds | 2.3% |
Equity sectors
| Industrials | 18.9% |
| Information Technology | 18.8% |
| Health Care | 15.9% |
| Financials | 15.6% |
| Consumer Discretionary | 7.1% |
| Materials | 5.2% |
| Energy | 5.1% |
| Real Estate | 4.2% |
| Utilities | 3.1% |
| Communication Services | 2.0% |
| Consumer Staples | 1.8% |
Top ten holdings
| Corsair Gaming, Inc. | 2.0% |
| Bloom Energy Corp. | 1.9% |
| MYR Group, Inc. | 1.7% |
| Formfactor, Inc. | 1.7% |
| UMB Financial Corp. | 1.5% |
| Modine Manufacturing Co. | 1.5% |
| Portland General Electric Co. | 1.5% |
| Weatherford International PLC | 1.4% |
| Popular, Inc. | 1.4% |
| Advanced Energy Industries, Inc. | 1.4% |
MFS uses the Global Industry Classification Standard (GICS®) for sector/industry reporting. MFS has applied its own internal sector/industry classification methodology for equity securities and non-equity securities that are unclassified by GICS.
Top ten holdings
| Corsair Gaming, Inc. | 2.0% |
| Bloom Energy Corp. | 1.9% |
| MYR Group, Inc. | 1.7% |
| Formfactor, Inc. | 1.7% |
| UMB Financial Corp. | 1.5% |
| Modine Manufacturing Co. | 1.5% |
| Portland General Electric Co. | 1.5% |
| Weatherford International PLC | 1.4% |
| Popular, Inc. | 1.4% |
| Advanced Energy Industries, Inc. | 1.4% |
FUND EXPENSES
What were the fund costs for the last year?
| (based on a hypothetical $10,000 investment) | ||
| Class Name | Costs of a $10,000 investment | Costs paid as a percentage of a $10,000 investment |
| R1 | $201 | 1.74% |
MANAGEMENT'S DISCUSSION OF FUND PERFORMANCE
-
For the twelve months ended May 31, 2026, Class R1 shares of the MFS Blended Research Small Cap Equity Fund (fund) provided a total return of 31.49%, at net asset value. This compares with a return of 29.45% for the fund’s benchmark, the Russell 3000® Index. The fund's other benchmark, the Russell 2000® Index, generated a return of 43.08%.
-
Global equity markets reached record levels during the period, withstanding considerable volatility amid tariffs, geopolitical conflict and high levels of uncertainty. A new geopolitical event distressed markets at the end of the period as US and Israeli forces launched strikes against Iran, disrupting Mideast oil and natural gas exports. During the period, a pro-growth tax and spending bill was signed into law in the US, while in Europe, renewed focus on defense and infrastructure spending brightened the economic outlook. In Japan, the election of a pro-growth prime minister sent stocks to new highs prior to the conflict in Iran. Optimism over artificial intelligence remained high.
-
Considerable progress was made in trade talks between the US and many major trading partners, with a fragile truce between the US and China extended through late 2026. While the US Supreme Court struck down part of the Trump administration’s tariff strategy, the administration began deploying other authorities to largely replace the ones that were ruled unconstitutional.
-
Early in the period, moderating inflation pressures allowed many global central banks to ease monetary policy. Amid a difficult policymaking environment and slower job growth, the Federal Reserve resumed easing policy in September and delivered quarter-point rate cuts in October and December before pausing.
-
In fixed income markets, previously range-bound global bond yields spiked following the onset of the Middle East conflict, as energy-driven inflation fears appeared to have rattled bond investors. US rate volatility (as measured by the Merrill Lynch Option Volatility Estimate (MOVE) Index) similarly rose from intra-period lows, reflecting uncertainty around the scope and duration of the conflict and its implications for global growth. However, volatility later retracted as the risk of a broader regional military escalation appeared less likely. Global credit spreads widened only modestly before stabilizing near prior levels, supported by strong demand and resilient underlying fundamentals.
-
Top contributors to performance relative to the Russell 2000® Index:
-
Security selection within the industrials sector strengthened the fund's relative performance.
-
-
Top detractors from performance relative to the Russell 2000® Index:
-
Security selection within the health care, information technology, and materials sectors held back relative performance.
-
FUND PERFORMANCE
The fund’s past performance is not a good predictor of the fund’s future performance. The graph and table below do not reflect the deduction of taxes that a shareholder would pay on fund distributions or the redemption of fund shares. The graph and table below assume reinvestment of dividends and capital gain distributions.
Growth of a Hypothetical $10,000 Investment
This graph shows the performance of a hypothetical $10,000 investment in Class R1 over a ten year period or since inception, if shorter, in comparison to (i) a broad measure of market performance and (ii) an additional index that MFS believes more closely reflects the market segments in which the fund invests.
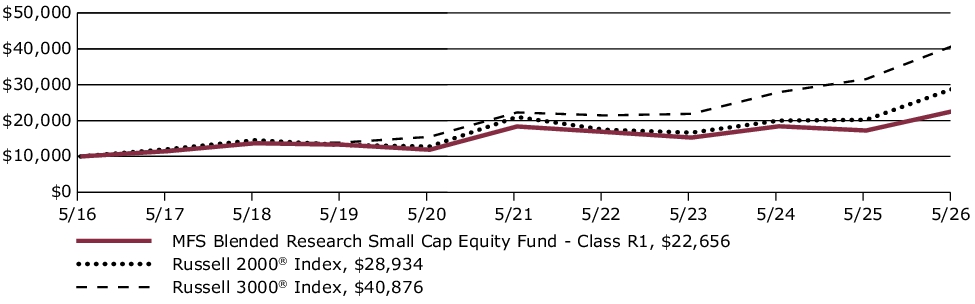
Average Annual Total Returns through 5/31/26
This table shows the average annual total returns of the class of shares noted for the periods shown, both with (if any) and without sales charges. It also shows the average annual total returns of (i) a broad measure of market performance and (ii) an additional index that MFS believes more closely reflects the market segments in which the fund invests, over the same periods.
| Share Class | 1-yr | 5-yr | 10-yr |
| R1 without sales charge | 31.49% | 4.30% | 8.52% |
| Comparative Benchmark(s) | |||
| Russell 3000® Index ∆ | 29.45% | 12.92% | 15.12% |
| Russell 2000® Index ∆ | 43.08% | 6.61% | 11.21% |
|
∆
|
Source: FactSet Research Systems Inc.
|
Visit mfs.com/perf/r1 for more recent performance information.
FUND STATISTICS AS OF 5/31/26
| Net Assets ($): | 326,447,876 | Total Management Fee ($)#: | 2,005,584 | |
| Total Number of Holdings: | 236 | Portfolio Turnover Rate (%): | 73 |
# Includes the effect of any management fee waivers, if applicable.
Where the fund holds derivatives, they are not included in the total number of portfolio holdings.
PORTFOLIO COMPOSITION (BASED ON TOTAL INVESTMENTS AS OF 5/31/26)
Portfolio structure
| Equities | 97.7% |
| Money Market Funds | 2.3% |
Equity sectors
| Industrials | 18.9% |
| Information Technology | 18.8% |
| Health Care | 15.9% |
| Financials | 15.6% |
| Consumer Discretionary | 7.1% |
| Materials | 5.2% |
| Energy | 5.1% |
| Real Estate | 4.2% |
| Utilities | 3.1% |
| Communication Services | 2.0% |
| Consumer Staples | 1.8% |
Top ten holdings
| Corsair Gaming, Inc. | 2.0% |
| Bloom Energy Corp. | 1.9% |
| MYR Group, Inc. | 1.7% |
| Formfactor, Inc. | 1.7% |
| UMB Financial Corp. | 1.5% |
| Modine Manufacturing Co. | 1.5% |
| Portland General Electric Co. | 1.5% |
| Weatherford International PLC | 1.4% |
| Popular, Inc. | 1.4% |
| Advanced Energy Industries, Inc. | 1.4% |
MFS uses the Global Industry Classification Standard (GICS®) for sector/industry reporting. MFS has applied its own internal sector/industry classification methodology for equity securities and non-equity securities that are unclassified by GICS.
Top ten holdings
| Corsair Gaming, Inc. | 2.0% |
| Bloom Energy Corp. | 1.9% |
| MYR Group, Inc. | 1.7% |
| Formfactor, Inc. | 1.7% |
| UMB Financial Corp. | 1.5% |
| Modine Manufacturing Co. | 1.5% |
| Portland General Electric Co. | 1.5% |
| Weatherford International PLC | 1.4% |
| Popular, Inc. | 1.4% |
| Advanced Energy Industries, Inc. | 1.4% |
FUND EXPENSES
What were the fund costs for the last year?
| (based on a hypothetical $10,000 investment) | ||
| Class Name | Costs of a $10,000 investment | Costs paid as a percentage of a $10,000 investment |
| I | $86 | 0.74% |
MANAGEMENT'S DISCUSSION OF FUND PERFORMANCE
-
For the twelve months ended May 31, 2026, Class I shares of the MFS Blended Research Small Cap Equity Fund (fund) provided a total return of 32.79%, at net asset value. This compares with a return of 29.45% for the fund’s benchmark, the Russell 3000® Index. The fund's other benchmark, the Russell 2000® Index, generated a return of 43.08%.
-
Global equity markets reached record levels during the period, withstanding considerable volatility amid tariffs, geopolitical conflict and high levels of uncertainty. A new geopolitical event distressed markets at the end of the period as US and Israeli forces launched strikes against Iran, disrupting Mideast oil and natural gas exports. During the period, a pro-growth tax and spending bill was signed into law in the US, while in Europe, renewed focus on defense and infrastructure spending brightened the economic outlook. In Japan, the election of a pro-growth prime minister sent stocks to new highs prior to the conflict in Iran. Optimism over artificial intelligence remained high.
-
Considerable progress was made in trade talks between the US and many major trading partners, with a fragile truce between the US and China extended through late 2026. While the US Supreme Court struck down part of the Trump administration’s tariff strategy, the administration began deploying other authorities to largely replace the ones that were ruled unconstitutional.
-
Early in the period, moderating inflation pressures allowed many global central banks to ease monetary policy. Amid a difficult policymaking environment and slower job growth, the Federal Reserve resumed easing policy in September and delivered quarter-point rate cuts in October and December before pausing.
-
In fixed income markets, previously range-bound global bond yields spiked following the onset of the Middle East conflict, as energy-driven inflation fears appeared to have rattled bond investors. US rate volatility (as measured by the Merrill Lynch Option Volatility Estimate (MOVE) Index) similarly rose from intra-period lows, reflecting uncertainty around the scope and duration of the conflict and its implications for global growth. However, volatility later retracted as the risk of a broader regional military escalation appeared less likely. Global credit spreads widened only modestly before stabilizing near prior levels, supported by strong demand and resilient underlying fundamentals.
-
Top contributors to performance relative to the Russell 2000® Index:
-
Security selection within the industrials sector strengthened the fund's relative performance.
-
-
Top detractors from performance relative to the Russell 2000® Index:
-
Security selection within the health care, information technology, and materials sectors held back relative performance.
-
FUND PERFORMANCE
The fund’s past performance is not a good predictor of the fund’s future performance. The graph and table below do not reflect the deduction of taxes that a shareholder would pay on fund distributions or the redemption of fund shares. The graph and table below assume reinvestment of dividends and capital gain distributions.
Growth of a Hypothetical $10,000 Investment
This graph shows the performance of a hypothetical $10,000 investment in Class I over a ten year period or since inception, if shorter, in comparison to (i) a broad measure of market performance and (ii) an additional index that MFS believes more closely reflects the market segments in which the fund invests.
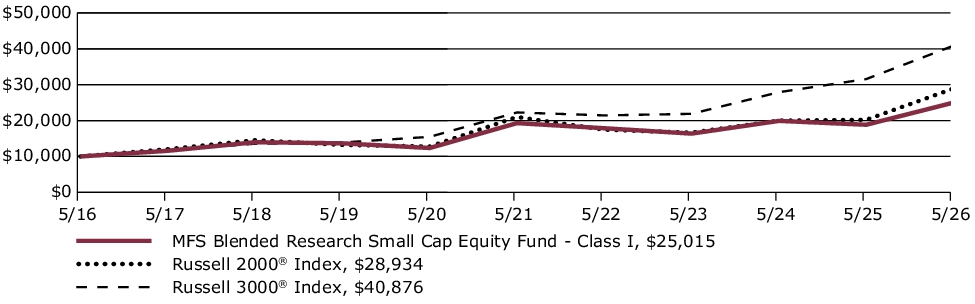
Average Annual Total Returns through 5/31/26
This table shows the average annual total returns of the class of shares noted for the periods shown, both with (if any) and without sales charges. It also shows the average annual total returns of (i) a broad measure of market performance and (ii) an additional index that MFS believes more closely reflects the market segments in which the fund invests, over the same periods.
| Share Class | 1-yr | 5-yr | 10-yr |
| I without sales charge | 32.79% | 5.34% | 9.60% |
| Comparative Benchmark(s) | |||
| Russell 3000® Index ∆ | 29.45% | 12.92% | 15.12% |
| Russell 2000® Index ∆ | 43.08% | 6.61% | 11.21% |
|
∆
|
Source: FactSet Research Systems Inc.
|
Visit mfs.com/perf/i for more recent performance information.
FUND STATISTICS AS OF 5/31/26
| Net Assets ($): | 326,447,876 | Total Management Fee ($)#: | 2,005,584 | |
| Total Number of Holdings: | 236 | Portfolio Turnover Rate (%): | 73 |
# Includes the effect of any management fee waivers, if applicable.
Where the fund holds derivatives, they are not included in the total number of portfolio holdings.
PORTFOLIO COMPOSITION (BASED ON TOTAL INVESTMENTS AS OF 5/31/26)
Portfolio structure
| Equities | 97.7% |
| Money Market Funds | 2.3% |
Equity sectors
| Industrials | 18.9% |
| Information Technology | 18.8% |
| Health Care | 15.9% |
| Financials | 15.6% |
| Consumer Discretionary | 7.1% |
| Materials | 5.2% |
| Energy | 5.1% |
| Real Estate | 4.2% |
| Utilities | 3.1% |
| Communication Services | 2.0% |
| Consumer Staples | 1.8% |
Top ten holdings
| Corsair Gaming, Inc. | 2.0% |
| Bloom Energy Corp. | 1.9% |
| MYR Group, Inc. | 1.7% |
| Formfactor, Inc. | 1.7% |
| UMB Financial Corp. | 1.5% |
| Modine Manufacturing Co. | 1.5% |
| Portland General Electric Co. | 1.5% |
| Weatherford International PLC | 1.4% |
| Popular, Inc. | 1.4% |
| Advanced Energy Industries, Inc. | 1.4% |
MFS uses the Global Industry Classification Standard (GICS®) for sector/industry reporting. MFS has applied its own internal sector/industry classification methodology for equity securities and non-equity securities that are unclassified by GICS.
Top ten holdings
| Corsair Gaming, Inc. | 2.0% |
| Bloom Energy Corp. | 1.9% |
| MYR Group, Inc. | 1.7% |
| Formfactor, Inc. | 1.7% |
| UMB Financial Corp. | 1.5% |
| Modine Manufacturing Co. | 1.5% |
| Portland General Electric Co. | 1.5% |
| Weatherford International PLC | 1.4% |
| Popular, Inc. | 1.4% |
| Advanced Energy Industries, Inc. | 1.4% |
FUND EXPENSES
What were the fund costs for the last year?
| (based on a hypothetical $10,000 investment) | ||
| Class Name | Costs of a $10,000 investment | Costs paid as a percentage of a $10,000 investment |
| C | $201 | 1.74% |
MANAGEMENT'S DISCUSSION OF FUND PERFORMANCE
-
For the twelve months ended May 31, 2026, Class C shares of the MFS Blended Research Small Cap Equity Fund (fund) provided a total return of 31.49%, at net asset value. This compares with a return of 29.45% for the fund’s benchmark, the Russell 3000® Index. The fund's other benchmark, the Russell 2000® Index, generated a return of 43.08%.
-
Global equity markets reached record levels during the period, withstanding considerable volatility amid tariffs, geopolitical conflict and high levels of uncertainty. A new geopolitical event distressed markets at the end of the period as US and Israeli forces launched strikes against Iran, disrupting Mideast oil and natural gas exports. During the period, a pro-growth tax and spending bill was signed into law in the US, while in Europe, renewed focus on defense and infrastructure spending brightened the economic outlook. In Japan, the election of a pro-growth prime minister sent stocks to new highs prior to the conflict in Iran. Optimism over artificial intelligence remained high.
-
Considerable progress was made in trade talks between the US and many major trading partners, with a fragile truce between the US and China extended through late 2026. While the US Supreme Court struck down part of the Trump administration’s tariff strategy, the administration began deploying other authorities to largely replace the ones that were ruled unconstitutional.
-
Early in the period, moderating inflation pressures allowed many global central banks to ease monetary policy. Amid a difficult policymaking environment and slower job growth, the Federal Reserve resumed easing policy in September and delivered quarter-point rate cuts in October and December before pausing.
-
In fixed income markets, previously range-bound global bond yields spiked following the onset of the Middle East conflict, as energy-driven inflation fears appeared to have rattled bond investors. US rate volatility (as measured by the Merrill Lynch Option Volatility Estimate (MOVE) Index) similarly rose from intra-period lows, reflecting uncertainty around the scope and duration of the conflict and its implications for global growth. However, volatility later retracted as the risk of a broader regional military escalation appeared less likely. Global credit spreads widened only modestly before stabilizing near prior levels, supported by strong demand and resilient underlying fundamentals.
-
Top contributors to performance relative to the Russell 2000® Index:
-
Security selection within the industrials sector strengthened the fund's relative performance.
-
-
Top detractors from performance relative to the Russell 2000® Index:
-
Security selection within the health care, information technology, and materials sectors held back relative performance.
-
FUND PERFORMANCE
The fund’s past performance is not a good predictor of the fund’s future performance. The graph and table below do not reflect the deduction of taxes that a shareholder would pay on fund distributions or the redemption of fund shares. The graph and table below assume reinvestment of dividends and capital gain distributions.
Growth of a Hypothetical $10,000 Investment
This graph shows the performance of a hypothetical $10,000 investment in Class C over a ten year period or since inception, if shorter, in comparison to (i) a broad measure of market performance and (ii) an additional index that MFS believes more closely reflects the market segments in which the fund invests.
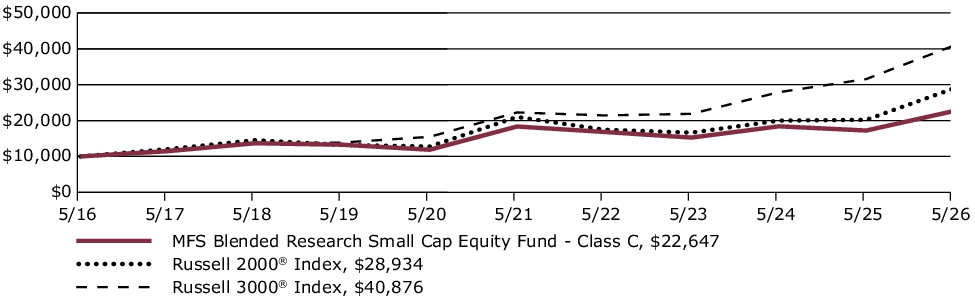
Average Annual Total Returns through 5/31/26
This table shows the average annual total returns of the class of shares noted for the periods shown, both with (if any) and without sales charges. It also shows the average annual total returns of (i) a broad measure of market performance and (ii) an additional index that MFS believes more closely reflects the market segments in which the fund invests, over the same periods.
| Share Class | 1-yr | 5-yr | 10-yr |
| C without sales charge | 31.49% | 4.30% | 8.52% |
| C with CDSC (1% for 12 months)× | 30.49% | 4.30% | 8.52% |
| Comparative Benchmark(s) | |||
| Russell 3000® Index ∆ | 29.45% | 12.92% | 15.12% |
| Russell 2000® Index ∆ | 43.08% | 6.61% | 11.21% |
|
∆
|
Source: FactSet Research Systems Inc.
|
|
×
|
Assuming redemption at the end of the applicable period.
|
Visit mfs.com/perf/c for more recent performance information.
FUND STATISTICS AS OF 5/31/26
| Net Assets ($): | 326,447,876 | Total Management Fee ($)#: | 2,005,584 | |
| Total Number of Holdings: | 236 | Portfolio Turnover Rate (%): | 73 |
# Includes the effect of any management fee waivers, if applicable.
Where the fund holds derivatives, they are not included in the total number of portfolio holdings.
PORTFOLIO COMPOSITION (BASED ON TOTAL INVESTMENTS AS OF 5/31/26)
Portfolio structure
| Equities | 97.7% |
| Money Market Funds | 2.3% |
Equity sectors
| Industrials | 18.9% |
| Information Technology | 18.8% |
| Health Care | 15.9% |
| Financials | 15.6% |
| Consumer Discretionary | 7.1% |
| Materials | 5.2% |
| Energy | 5.1% |
| Real Estate | 4.2% |
| Utilities | 3.1% |
| Communication Services | 2.0% |
| Consumer Staples | 1.8% |
Top ten holdings
| Corsair Gaming, Inc. | 2.0% |
| Bloom Energy Corp. | 1.9% |
| MYR Group, Inc. | 1.7% |
| Formfactor, Inc. | 1.7% |
| UMB Financial Corp. | 1.5% |
| Modine Manufacturing Co. | 1.5% |
| Portland General Electric Co. | 1.5% |
| Weatherford International PLC | 1.4% |
| Popular, Inc. | 1.4% |
| Advanced Energy Industries, Inc. | 1.4% |
MFS uses the Global Industry Classification Standard (GICS®) for sector/industry reporting. MFS has applied its own internal sector/industry classification methodology for equity securities and non-equity securities that are unclassified by GICS.
Top ten holdings
| Corsair Gaming, Inc. | 2.0% |
| Bloom Energy Corp. | 1.9% |
| MYR Group, Inc. | 1.7% |
| Formfactor, Inc. | 1.7% |
| UMB Financial Corp. | 1.5% |
| Modine Manufacturing Co. | 1.5% |
| Portland General Electric Co. | 1.5% |
| Weatherford International PLC | 1.4% |
| Popular, Inc. | 1.4% |
| Advanced Energy Industries, Inc. | 1.4% |
FUND EXPENSES
What were the fund costs for the last year?
| (based on a hypothetical $10,000 investment) | ||
| Class Name | Costs of a $10,000 investment | Costs paid as a percentage of a $10,000 investment |
| B | $201 | 1.74% |
MANAGEMENT'S DISCUSSION OF FUND PERFORMANCE
-
For the twelve months ended May 31, 2026, Class B shares of the MFS Blended Research Small Cap Equity Fund (fund) provided a total return of 31.44%, at net asset value. This compares with a return of 29.45% for the fund’s benchmark, the Russell 3000® Index. The fund's other benchmark, the Russell 2000® Index, generated a return of 43.08%.
-
Global equity markets reached record levels during the period, withstanding considerable volatility amid tariffs, geopolitical conflict and high levels of uncertainty. A new geopolitical event distressed markets at the end of the period as US and Israeli forces launched strikes against Iran, disrupting Mideast oil and natural gas exports. During the period, a pro-growth tax and spending bill was signed into law in the US, while in Europe, renewed focus on defense and infrastructure spending brightened the economic outlook. In Japan, the election of a pro-growth prime minister sent stocks to new highs prior to the conflict in Iran. Optimism over artificial intelligence remained high.
-
Considerable progress was made in trade talks between the US and many major trading partners, with a fragile truce between the US and China extended through late 2026. While the US Supreme Court struck down part of the Trump administration’s tariff strategy, the administration began deploying other authorities to largely replace the ones that were ruled unconstitutional.
-
Early in the period, moderating inflation pressures allowed many global central banks to ease monetary policy. Amid a difficult policymaking environment and slower job growth, the Federal Reserve resumed easing policy in September and delivered quarter-point rate cuts in October and December before pausing.
-
In fixed income markets, previously range-bound global bond yields spiked following the onset of the Middle East conflict, as energy-driven inflation fears appeared to have rattled bond investors. US rate volatility (as measured by the Merrill Lynch Option Volatility Estimate (MOVE) Index) similarly rose from intra-period lows, reflecting uncertainty around the scope and duration of the conflict and its implications for global growth. However, volatility later retracted as the risk of a broader regional military escalation appeared less likely. Global credit spreads widened only modestly before stabilizing near prior levels, supported by strong demand and resilient underlying fundamentals.
-
Top contributors to performance relative to the Russell 2000® Index:
-
Security selection within the industrials sector strengthened the fund's relative performance.
-
-
Top detractors from performance relative to the Russell 2000® Index:
-
Security selection within the health care, information technology, and materials sectors held back relative performance.
-
FUND PERFORMANCE
The fund’s past performance is not a good predictor of the fund’s future performance. The graph and table below do not reflect the deduction of taxes that a shareholder would pay on fund distributions or the redemption of fund shares. The graph and table below assume reinvestment of dividends and capital gain distributions.
Growth of a Hypothetical $10,000 Investment
This graph shows the performance of a hypothetical $10,000 investment in Class B over a ten year period or since inception, if shorter, in comparison to (i) a broad measure of market performance and (ii) an additional index that MFS believes more closely reflects the market segments in which the fund invests.
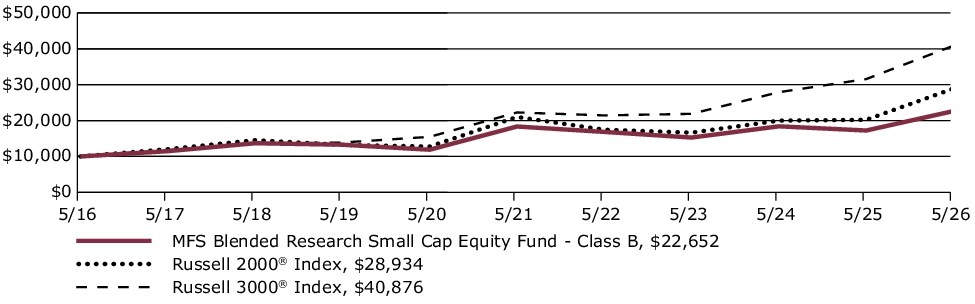
Average Annual Total Returns through 5/31/26
This table shows the average annual total returns of the class of shares noted for the periods shown, both with (if any) and without sales charges. It also shows the average annual total returns of (i) a broad measure of market performance and (ii) an additional index that MFS believes more closely reflects the market segments in which the fund invests, over the same periods.
| Share Class | 1-yr | 5-yr | 10-yr |
| B without sales charge | 31.44% | 4.30% | 8.52% |
| B with CDSC (declining over six years from 4% to 0%)× | 27.44% | 3.99% | 8.52% |
| Comparative Benchmark(s) | |||
| Russell 3000® Index ∆ | 29.45% | 12.92% | 15.12% |
| Russell 2000® Index ∆ | 43.08% | 6.61% | 11.21% |
|
∆
|
Source: FactSet Research Systems Inc.
|
|
×
|
Assuming redemption at the end of the applicable period.
|
Visit mfs.com/perf/b for more recent performance information.
FUND STATISTICS AS OF 5/31/26
| Net Assets ($): | 326,447,876 | Total Management Fee ($)#: | 2,005,584 | |
| Total Number of Holdings: | 236 | Portfolio Turnover Rate (%): | 73 |
# Includes the effect of any management fee waivers, if applicable.
Where the fund holds derivatives, they are not included in the total number of portfolio holdings.
PORTFOLIO COMPOSITION (BASED ON TOTAL INVESTMENTS AS OF 5/31/26)
Portfolio structure
| Equities | 97.7% |
| Money Market Funds | 2.3% |
Equity sectors
| Industrials | 18.9% |
| Information Technology | 18.8% |
| Health Care | 15.9% |
| Financials | 15.6% |
| Consumer Discretionary | 7.1% |
| Materials | 5.2% |
| Energy | 5.1% |
| Real Estate | 4.2% |
| Utilities | 3.1% |
| Communication Services | 2.0% |
| Consumer Staples | 1.8% |
Top ten holdings
| Corsair Gaming, Inc. | 2.0% |
| Bloom Energy Corp. | 1.9% |
| MYR Group, Inc. | 1.7% |
| Formfactor, Inc. | 1.7% |
| UMB Financial Corp. | 1.5% |
| Modine Manufacturing Co. | 1.5% |
| Portland General Electric Co. | 1.5% |
| Weatherford International PLC | 1.4% |
| Popular, Inc. | 1.4% |
| Advanced Energy Industries, Inc. | 1.4% |
MFS uses the Global Industry Classification Standard (GICS®) for sector/industry reporting. MFS has applied its own internal sector/industry classification methodology for equity securities and non-equity securities that are unclassified by GICS.
Top ten holdings
| Corsair Gaming, Inc. | 2.0% |
| Bloom Energy Corp. | 1.9% |
| MYR Group, Inc. | 1.7% |
| Formfactor, Inc. | 1.7% |
| UMB Financial Corp. | 1.5% |
| Modine Manufacturing Co. | 1.5% |
| Portland General Electric Co. | 1.5% |
| Weatherford International PLC | 1.4% |
| Popular, Inc. | 1.4% |
| Advanced Energy Industries, Inc. | 1.4% |
FUND EXPENSES
What were the fund costs for the last year?
| (based on a hypothetical $10,000 investment) | ||
| Class Name | Costs of a $10,000 investment | Costs paid as a percentage of a $10,000 investment |
| A | $115 | 0.99% |
MANAGEMENT'S DISCUSSION OF FUND PERFORMANCE
-
For the twelve months ended May 31, 2026, Class A shares of the MFS Blended Research Small Cap Equity Fund (fund) provided a total return of 32.41%, at net asset value. This compares with a return of 29.45% for the fund’s benchmark, the Russell 3000® Index. The fund's other benchmark, the Russell 2000® Index, generated a return of 43.08%.
-
Global equity markets reached record levels during the period, withstanding considerable volatility amid tariffs, geopolitical conflict and high levels of uncertainty. A new geopolitical event distressed markets at the end of the period as US and Israeli forces launched strikes against Iran, disrupting Mideast oil and natural gas exports. During the period, a pro-growth tax and spending bill was signed into law in the US, while in Europe, renewed focus on defense and infrastructure spending brightened the economic outlook. In Japan, the election of a pro-growth prime minister sent stocks to new highs prior to the conflict in Iran. Optimism over artificial intelligence remained high.
-
Considerable progress was made in trade talks between the US and many major trading partners, with a fragile truce between the US and China extended through late 2026. While the US Supreme Court struck down part of the Trump administration’s tariff strategy, the administration began deploying other authorities to largely replace the ones that were ruled unconstitutional.
-
Early in the period, moderating inflation pressures allowed many global central banks to ease monetary policy. Amid a difficult policymaking environment and slower job growth, the Federal Reserve resumed easing policy in September and delivered quarter-point rate cuts in October and December before pausing.
-
In fixed income markets, previously range-bound global bond yields spiked following the onset of the Middle East conflict, as energy-driven inflation fears appeared to have rattled bond investors. US rate volatility (as measured by the Merrill Lynch Option Volatility Estimate (MOVE) Index) similarly rose from intra-period lows, reflecting uncertainty around the scope and duration of the conflict and its implications for global growth. However, volatility later retracted as the risk of a broader regional military escalation appeared less likely. Global credit spreads widened only modestly before stabilizing near prior levels, supported by strong demand and resilient underlying fundamentals.
-
Top contributors to performance relative to the Russell 2000® Index:
-
Security selection within the industrials sector strengthened the fund's relative performance.
-
-
Top detractors from performance relative to the Russell 2000® Index:
-
Security selection within the health care, information technology, and materials sectors held back relative performance.
-
FUND PERFORMANCE
The fund’s past performance is not a good predictor of the fund’s future performance. The graph and table below do not reflect the deduction of taxes that a shareholder would pay on fund distributions or the redemption of fund shares. The graph and table below assume reinvestment of dividends and capital gain distributions.
Growth of a Hypothetical $10,000 Investment
This graph shows the performance of a hypothetical $10,000 investment in Class A over a ten year period or since inception, if shorter, in comparison to (i) a broad measure of market performance and (ii) an additional index that MFS believes more closely reflects the market segments in which the fund invests. This graph includes the deduction of the maximum applicable sales charge.
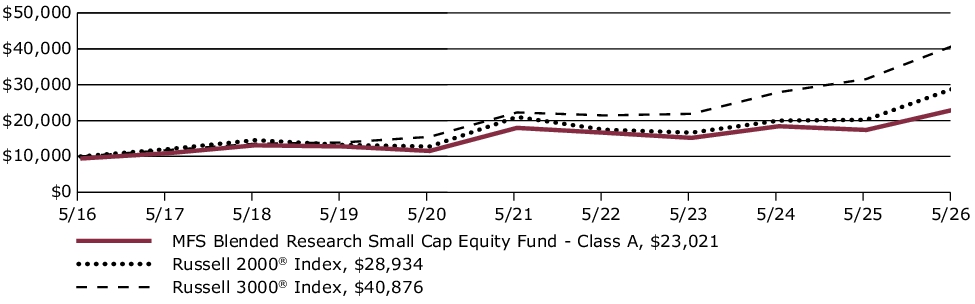
Average Annual Total Returns through 5/31/26
This table shows the average annual total returns of the class of shares noted for the periods shown, both with (if any) and without sales charges. It also shows the average annual total returns of (i) a broad measure of market performance and (ii) an additional index that MFS believes more closely reflects the market segments in which the fund invests, over the same periods.
| Share Class | 1-yr | 5-yr | 10-yr |
| A without sales charge | 32.41% | 5.09% | 9.34% |
| A with initial sales charge (5.75%) | 24.80% | 3.85% | 8.70% |
| Comparative Benchmark(s) | |||
| Russell 3000® Index ∆ | 29.45% | 12.92% | 15.12% |
| Russell 2000® Index ∆ | 43.08% | 6.61% | 11.21% |
|
∆
|
Source: FactSet Research Systems Inc.
|
Visit mfs.com/perf/a for more recent performance information.
FUND STATISTICS AS OF 5/31/26
| Net Assets ($): | 326,447,876 | Total Management Fee ($)#: | 2,005,584 | |
| Total Number of Holdings: | 236 | Portfolio Turnover Rate (%): | 73 |
# Includes the effect of any management fee waivers, if applicable.
Where the fund holds derivatives, they are not included in the total number of portfolio holdings.
PORTFOLIO COMPOSITION (BASED ON TOTAL INVESTMENTS AS OF 5/31/26)
Portfolio structure
| Equities | 97.7% |
| Money Market Funds | 2.3% |
Equity sectors
| Industrials | 18.9% |
| Information Technology | 18.8% |
| Health Care | 15.9% |
| Financials | 15.6% |
| Consumer Discretionary | 7.1% |
| Materials | 5.2% |
| Energy | 5.1% |
| Real Estate | 4.2% |
| Utilities | 3.1% |
| Communication Services | 2.0% |
| Consumer Staples | 1.8% |
Top ten holdings
| Corsair Gaming, Inc. | 2.0% |
| Bloom Energy Corp. | 1.9% |
| MYR Group, Inc. | 1.7% |
| Formfactor, Inc. | 1.7% |
| UMB Financial Corp. | 1.5% |
| Modine Manufacturing Co. | 1.5% |
| Portland General Electric Co. | 1.5% |
| Weatherford International PLC | 1.4% |
| Popular, Inc. | 1.4% |
| Advanced Energy Industries, Inc. | 1.4% |
MFS uses the Global Industry Classification Standard (GICS®) for sector/industry reporting. MFS has applied its own internal sector/industry classification methodology for equity securities and non-equity securities that are unclassified by GICS.
Top ten holdings
| Corsair Gaming, Inc. | 2.0% |
| Bloom Energy Corp. | 1.9% |
| MYR Group, Inc. | 1.7% |
| Formfactor, Inc. | 1.7% |
| UMB Financial Corp. | 1.5% |
| Modine Manufacturing Co. | 1.5% |
| Portland General Electric Co. | 1.5% |
| Weatherford International PLC | 1.4% |
| Popular, Inc. | 1.4% |
| Advanced Energy Industries, Inc. | 1.4% |
This report describes certain changes to the Fund that occurred during the reporting period.
FUND EXPENSES
What were the fund costs for the last year?
| (based on a hypothetical $10,000 investment) | ||
| Class Name | Costs of a $10,000 investment | Costs paid as a percentage of a $10,000 investment |
| A | $76 | 0.67% |
MANAGEMENT'S DISCUSSION OF FUND PERFORMANCE
-
For the twelve months ended May 31, 2026, Class A shares of the MFS Blended Research Value Equity Fund (fund) provided a total return of 26.71%, at net asset value. This compares with a return of 29.45% for the fund’s benchmark, the Russell 3000® Index. The fund's other benchmark, the Russell 1000® Value Index, generated a return of 28.55%.
-
Global equity markets reached record levels during the period, withstanding considerable volatility amid tariffs, geopolitical conflict and high levels of uncertainty. A new geopolitical event distressed markets at the end of the period as US and Israeli forces launched strikes against Iran, disrupting Mideast oil and natural gas exports. During the period, a pro-growth tax and spending bill was signed into law in the US, while in Europe, renewed focus on defense and infrastructure spending brightened the economic outlook. In Japan, the election of a pro-growth prime minister sent stocks to new highs prior to the conflict in Iran. Optimism over artificial intelligence remained high.
-
Considerable progress was made in trade talks between the US and many major trading partners, with a fragile truce between the US and China extended through late 2026. While the US Supreme Court struck down part of the Trump administration’s tariff strategy, the administration began deploying other authorities to largely replace the ones that were ruled unconstitutional.
-
Early in the period, moderating inflation pressures allowed many global central banks to ease monetary policy. Amid a difficult policymaking environment and slower job growth, the Federal Reserve resumed easing policy in September and delivered quarter-point rate cuts in October and December before pausing.
-
In fixed income markets, previously range-bound global bond yields spiked following the onset of the Middle East conflict, as energy-driven inflation fears appeared to have rattled bond investors. US rate volatility (as measured by the Merrill Lynch Option Volatility Estimate (MOVE) Index) similarly rose from intra-period lows, reflecting uncertainty around the scope and duration of the conflict and its implications for global growth. However, volatility later retracted as the risk of a broader regional military escalation appeared less likely. Global credit spreads widened only modestly before stabilizing near prior levels, supported by strong demand and resilient underlying fundamentals.
-
Top contributors to performance relative to the Russell 1000® Value Index:
-
Security selection within the energy, financials, and industrials sectors strengthened the fund's relative performance.
-
-
Top detractors from performance relative to the Russell 1000® Value Index:
-
Security selection within both the communication services and materials sectors held back relative performance.
-
The fund's underweight allocation to the information technology sector also detracted from relative returns.
-
FUND PERFORMANCE
The fund’s past performance is not a good predictor of the fund’s future performance. The graph and table below do not reflect the deduction of taxes that a shareholder would pay on fund distributions or the redemption of fund shares. The graph and table below assume reinvestment of dividends and capital gain distributions.
Growth of a Hypothetical $10,000 Investment
This graph shows the performance of a hypothetical $10,000 investment in Class A over a ten year period or since inception, if shorter, in comparison to (i) a broad measure of market performance and (ii) an additional index that MFS believes more closely reflects the market segments in which the fund invests. This graph includes the deduction of the maximum applicable sales charge.
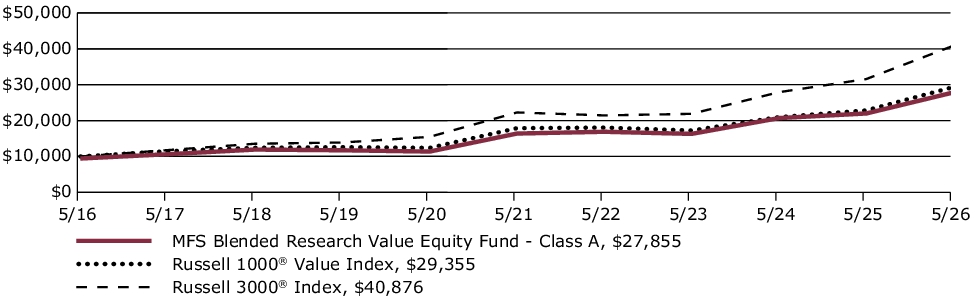
Average Annual Total Returns through 5/31/26
This table shows the average annual total returns of the class of shares noted for the periods shown, both with (if any) and without sales charges. It also shows the average annual total returns of (i) a broad measure of market performance and (ii) an additional index that MFS believes more closely reflects the market segments in which the fund invests, over the same periods.
| Share Class | 1-yr | 5-yr | 10-yr |
| A without sales charge | 26.71% | 11.19% | 11.45% |
| A with initial sales charge (5.75%) | 19.43% | 9.88% | 10.79% |
| Comparative Benchmark(s) | |||
| Russell 3000® Index ∆ | 29.45% | 12.92% | 15.12% |
| Russell 1000® Value Index ∆ | 28.55% | 10.42% | 11.37% |
|
∆
|
Source: FactSet Research Systems Inc.
|
Visit mfs.com/perf/a for more recent performance information.
FUND STATISTICS AS OF 5/31/26
| Net Assets ($): | 331,692,741 | Total Management Fee ($)#: | 893,778 | |
| Total Number of Holdings: | 126 | Portfolio Turnover Rate (%): | 50 |
# Includes the effect of any management fee waivers, if applicable.
Where the fund holds derivatives, they are not included in the total number of portfolio holdings.
PORTFOLIO COMPOSITION (BASED ON TOTAL INVESTMENTS AS OF 5/31/26)
Portfolio structure
| Equities | 99.3% |
| Money Market Funds | 0.7% |
Equity sectors
| Financials | 19.0% |
| Information Technology | 16.3% |
| Industrials | 12.1% |
| Health Care | 11.5% |
| Consumer Discretionary | 7.9% |
| Communication Services | 7.5% |
| Consumer Staples | 6.5% |
| Energy | 6.4% |
| Utilities | 4.8% |
| Real Estate | 4.0% |
| Materials | 3.3% |
Top ten holdings
| Alphabet, Inc., "A" | 3.1% |
| Johnson & Johnson | 2.9% |
| Amazon.com, Inc. | 2.7% |
| Micron Technology, Inc. | 2.6% |
| Caterpillar, Inc. | 2.0% |
| Citigroup, Inc. | 1.9% |
| Northern Trust Corp. | 1.6% |
| Wabtec Corp. | 1.5% |
| Flex Ltd. | 1.5% |
| Aramark | 1.5% |
MFS uses the Global Industry Classification Standard (GICS®) for sector/industry reporting. MFS has applied its own internal sector/industry classification methodology for equity securities and non-equity securities that are unclassified by GICS.
Top ten holdings
| Alphabet, Inc., "A" | 3.1% |
| Johnson & Johnson | 2.9% |
| Amazon.com, Inc. | 2.7% |
| Micron Technology, Inc. | 2.6% |
| Caterpillar, Inc. | 2.0% |
| Citigroup, Inc. | 1.9% |
| Northern Trust Corp. | 1.6% |
| Wabtec Corp. | 1.5% |
| Flex Ltd. | 1.5% |
| Aramark | 1.5% |
MATERIAL FUND CHANGES
This is a summary of certain changes to the fund since June 1, 2025. For more complete information, you may review the fund's prospectus as amended, which is available at funds.mfs.com or upon request at 1‑800‑225‑2606.
Effective October 1, 2025, the management fee is computed daily and paid monthly at the following annual rates based on the fund’s average daily net assets: 0.25% up to $5 billion; and 0.225% in excess of $5 billion.
Effective October 1, 2025, for Class A shares, the investment adviser has agreed in writing to pay a portion of the fund’s total annual operating expenses, excluding interest, taxes, extraordinary expenses, brokerage and transaction costs, certain tax reclaim recovery expenses (including contingency fees and closing agreement expenses), and investment-related expenses, such that total operating expenses do not exceed 0.64% annually of the class’s average daily net assets. This written agreement will continue until modified by the fund’s Board of Trustees, but such agreement will continue at least until September 30, 2027.
Effective October 1, 2025, the management fee is computed daily and paid monthly at the following annual rates based on the fund’s average daily net assets: 0.25% up to $5 billion; and 0.225% in excess of $5 billion.
Effective October 1, 2025, for Class A shares, the investment adviser has agreed in writing to pay a portion of the fund’s total annual operating expenses, excluding interest, taxes, extraordinary expenses, brokerage and transaction costs, certain tax reclaim recovery expenses (including contingency fees and closing agreement expenses), and investment-related expenses, such that total operating expenses do not exceed 0.64% annually of the class’s average daily net assets. This written agreement will continue until modified by the fund’s Board of Trustees, but such agreement will continue at least until September 30, 2027.
This is a summary of certain changes to the fund since June 1, 2025. For more complete information, you may review the fund's prospectus as amended, which is available at funds.mfs.com or upon request at 1‑800‑225‑2606.
This report describes certain changes to the Fund that occurred during the reporting period.
FUND EXPENSES
What were the fund costs for the last year?
| (based on a hypothetical $10,000 investment) | ||
| Class Name | Costs of a $10,000 investment | Costs paid as a percentage of a $10,000 investment |
| B | $160 | 1.42% |
MANAGEMENT'S DISCUSSION OF FUND PERFORMANCE
-
For the twelve months ended May 31, 2026, Class B shares of the MFS Blended Research Value Equity Fund (fund) provided a total return of 25.72%, at net asset value. This compares with a return of 29.45% for the fund’s benchmark, the Russell 3000® Index. The fund's other benchmark, the Russell 1000® Value Index, generated a return of 28.55%.
-
Global equity markets reached record levels during the period, withstanding considerable volatility amid tariffs, geopolitical conflict and high levels of uncertainty. A new geopolitical event distressed markets at the end of the period as US and Israeli forces launched strikes against Iran, disrupting Mideast oil and natural gas exports. During the period, a pro-growth tax and spending bill was signed into law in the US, while in Europe, renewed focus on defense and infrastructure spending brightened the economic outlook. In Japan, the election of a pro-growth prime minister sent stocks to new highs prior to the conflict in Iran. Optimism over artificial intelligence remained high.
-
Considerable progress was made in trade talks between the US and many major trading partners, with a fragile truce between the US and China extended through late 2026. While the US Supreme Court struck down part of the Trump administration’s tariff strategy, the administration began deploying other authorities to largely replace the ones that were ruled unconstitutional.
-
Early in the period, moderating inflation pressures allowed many global central banks to ease monetary policy. Amid a difficult policymaking environment and slower job growth, the Federal Reserve resumed easing policy in September and delivered quarter-point rate cuts in October and December before pausing.
-
In fixed income markets, previously range-bound global bond yields spiked following the onset of the Middle East conflict, as energy-driven inflation fears appeared to have rattled bond investors. US rate volatility (as measured by the Merrill Lynch Option Volatility Estimate (MOVE) Index) similarly rose from intra-period lows, reflecting uncertainty around the scope and duration of the conflict and its implications for global growth. However, volatility later retracted as the risk of a broader regional military escalation appeared less likely. Global credit spreads widened only modestly before stabilizing near prior levels, supported by strong demand and resilient underlying fundamentals.
-
Top contributors to performance relative to the Russell 1000® Value Index:
-
Security selection within the energy, financials, and industrials sectors strengthened the fund's relative performance.
-
-
Top detractors from performance relative to the Russell 1000® Value Index:
-
Security selection within both the communication services and materials sectors held back relative performance.
-
The fund's underweight allocation to the information technology sector also detracted from relative returns.
-
FUND PERFORMANCE
The fund’s past performance is not a good predictor of the fund’s future performance. The graph and table below do not reflect the deduction of taxes that a shareholder would pay on fund distributions or the redemption of fund shares. The graph and table below assume reinvestment of dividends and capital gain distributions.
Growth of a Hypothetical $10,000 Investment
This graph shows the performance of a hypothetical $10,000 investment in Class B over a ten year period or since inception, if shorter, in comparison to (i) a broad measure of market performance and (ii) an additional index that MFS believes more closely reflects the market segments in which the fund invests.
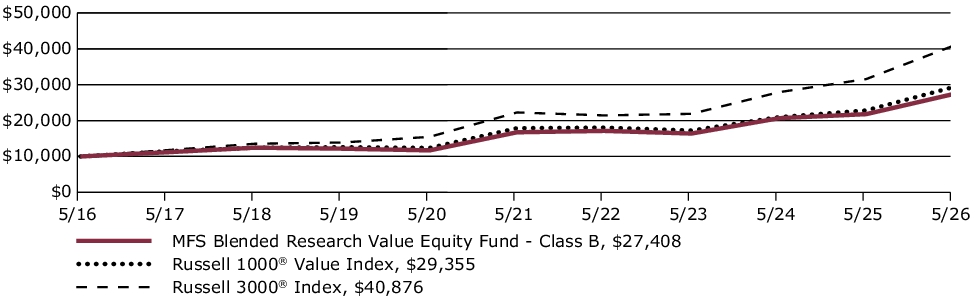
Average Annual Total Returns through 5/31/26
This table shows the average annual total returns of the class of shares noted for the periods shown, both with (if any) and without sales charges. It also shows the average annual total returns of (i) a broad measure of market performance and (ii) an additional index that MFS believes more closely reflects the market segments in which the fund invests, over the same periods.
| Share Class | 1-yr | 5-yr | 10-yr |
| B without sales charge | 25.72% | 10.36% | 10.61% |
| B with CDSC (declining over six years from 4% to 0%)× | 21.72% | 10.09% | 10.61% |
| Comparative Benchmark(s) | |||
| Russell 3000® Index ∆ | 29.45% | 12.92% | 15.12% |
| Russell 1000® Value Index ∆ | 28.55% | 10.42% | 11.37% |
|
∆
|
Source: FactSet Research Systems Inc.
|
|
×
|
Assuming redemption at the end of the applicable period.
|
Visit mfs.com/perf/b for more recent performance information.
FUND STATISTICS AS OF 5/31/26
| Net Assets ($): | 331,692,741 | Total Management Fee ($)#: | 893,778 | |
| Total Number of Holdings: | 126 | Portfolio Turnover Rate (%): | 50 |
# Includes the effect of any management fee waivers, if applicable.
Where the fund holds derivatives, they are not included in the total number of portfolio holdings.
PORTFOLIO COMPOSITION (BASED ON TOTAL INVESTMENTS AS OF 5/31/26)
Portfolio structure
| Equities | 99.3% |
| Money Market Funds | 0.7% |
Equity sectors
| Financials | 19.0% |
| Information Technology | 16.3% |
| Industrials | 12.1% |
| Health Care | 11.5% |
| Consumer Discretionary | 7.9% |
| Communication Services | 7.5% |
| Consumer Staples | 6.5% |
| Energy | 6.4% |
| Utilities | 4.8% |
| Real Estate | 4.0% |
| Materials | 3.3% |
Top ten holdings
| Alphabet, Inc., "A" | 3.1% |
| Johnson & Johnson | 2.9% |
| Amazon.com, Inc. | 2.7% |
| Micron Technology, Inc. | 2.6% |
| Caterpillar, Inc. | 2.0% |
| Citigroup, Inc. | 1.9% |
| Northern Trust Corp. | 1.6% |
| Wabtec Corp. | 1.5% |
| Flex Ltd. | 1.5% |
| Aramark | 1.5% |
MFS uses the Global Industry Classification Standard (GICS®) for sector/industry reporting. MFS has applied its own internal sector/industry classification methodology for equity securities and non-equity securities that are unclassified by GICS.
Top ten holdings
| Alphabet, Inc., "A" | 3.1% |
| Johnson & Johnson | 2.9% |
| Amazon.com, Inc. | 2.7% |
| Micron Technology, Inc. | 2.6% |
| Caterpillar, Inc. | 2.0% |
| Citigroup, Inc. | 1.9% |
| Northern Trust Corp. | 1.6% |
| Wabtec Corp. | 1.5% |
| Flex Ltd. | 1.5% |
| Aramark | 1.5% |
MATERIAL FUND CHANGES
This is a summary of certain changes to the fund since June 1, 2025. For more complete information, you may review the fund's prospectus as amended, which is available at funds.mfs.com or upon request at 1‑800‑225‑2606.
Effective October 1, 2025, the management fee is computed daily and paid monthly at the following annual rates based on the fund’s average daily net assets: 0.25% up to $5 billion; and 0.225% in excess of $5 billion.
Effective October 1, 2025, for Class B shares, the investment adviser has agreed in writing to pay a portion of the fund’s total annual operating expenses, excluding interest, taxes, extraordinary expenses, brokerage and transaction costs, certain tax reclaim recovery expenses (including contingency fees and closing agreement expenses), and investment-related expenses, such that total operating expenses do not exceed 1.39% annually of the class’s average daily net assets. This written agreement will continue until modified by the fund’s Board of Trustees, but such agreement will continue at least until September 30, 2027.
Effective October 1, 2025, the management fee is computed daily and paid monthly at the following annual rates based on the fund’s average daily net assets: 0.25% up to $5 billion; and 0.225% in excess of $5 billion.
Effective October 1, 2025, for Class B shares, the investment adviser has agreed in writing to pay a portion of the fund’s total annual operating expenses, excluding interest, taxes, extraordinary expenses, brokerage and transaction costs, certain tax reclaim recovery expenses (including contingency fees and closing agreement expenses), and investment-related expenses, such that total operating expenses do not exceed 1.39% annually of the class’s average daily net assets. This written agreement will continue until modified by the fund’s Board of Trustees, but such agreement will continue at least until September 30, 2027.
This is a summary of certain changes to the fund since June 1, 2025. For more complete information, you may review the fund's prospectus as amended, which is available at funds.mfs.com or upon request at 1‑800‑225‑2606.
This report describes certain changes to the Fund that occurred during the reporting period.
FUND EXPENSES
What were the fund costs for the last year?
| (based on a hypothetical $10,000 investment) | ||
| Class Name | Costs of a $10,000 investment | Costs paid as a percentage of a $10,000 investment |
| C | $160 | 1.42% |
MANAGEMENT'S DISCUSSION OF FUND PERFORMANCE
-
For the twelve months ended May 31, 2026, Class C shares of the MFS Blended Research Value Equity Fund (fund) provided a total return of 25.70%, at net asset value. This compares with a return of 29.45% for the fund’s benchmark, the Russell 3000® Index. The fund's other benchmark, the Russell 1000® Value Index, generated a return of 28.55%.
-
Global equity markets reached record levels during the period, withstanding considerable volatility amid tariffs, geopolitical conflict and high levels of uncertainty. A new geopolitical event distressed markets at the end of the period as US and Israeli forces launched strikes against Iran, disrupting Mideast oil and natural gas exports. During the period, a pro-growth tax and spending bill was signed into law in the US, while in Europe, renewed focus on defense and infrastructure spending brightened the economic outlook. In Japan, the election of a pro-growth prime minister sent stocks to new highs prior to the conflict in Iran. Optimism over artificial intelligence remained high.
-
Considerable progress was made in trade talks between the US and many major trading partners, with a fragile truce between the US and China extended through late 2026. While the US Supreme Court struck down part of the Trump administration’s tariff strategy, the administration began deploying other authorities to largely replace the ones that were ruled unconstitutional.
-
Early in the period, moderating inflation pressures allowed many global central banks to ease monetary policy. Amid a difficult policymaking environment and slower job growth, the Federal Reserve resumed easing policy in September and delivered quarter-point rate cuts in October and December before pausing.
-
In fixed income markets, previously range-bound global bond yields spiked following the onset of the Middle East conflict, as energy-driven inflation fears appeared to have rattled bond investors. US rate volatility (as measured by the Merrill Lynch Option Volatility Estimate (MOVE) Index) similarly rose from intra-period lows, reflecting uncertainty around the scope and duration of the conflict and its implications for global growth. However, volatility later retracted as the risk of a broader regional military escalation appeared less likely. Global credit spreads widened only modestly before stabilizing near prior levels, supported by strong demand and resilient underlying fundamentals.
-
Top contributors to performance relative to the Russell 1000® Value Index:
-
Security selection within the energy, financials, and industrials sectors strengthened the fund's relative performance.
-
-
Top detractors from performance relative to the Russell 1000® Value Index:
-
Security selection within both the communication services and materials sectors held back relative performance.
-
The fund's underweight allocation to the information technology sector also detracted from relative returns.
-
FUND PERFORMANCE
The fund’s past performance is not a good predictor of the fund’s future performance. The graph and table below do not reflect the deduction of taxes that a shareholder would pay on fund distributions or the redemption of fund shares. The graph and table below assume reinvestment of dividends and capital gain distributions.
Growth of a Hypothetical $10,000 Investment
This graph shows the performance of a hypothetical $10,000 investment in Class C over a ten year period or since inception, if shorter, in comparison to (i) a broad measure of market performance and (ii) an additional index that MFS believes more closely reflects the market segments in which the fund invests.
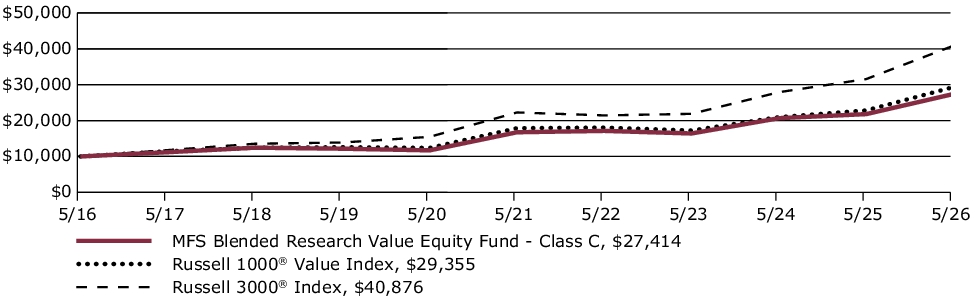
Average Annual Total Returns through 5/31/26
This table shows the average annual total returns of the class of shares noted for the periods shown, both with (if any) and without sales charges. It also shows the average annual total returns of (i) a broad measure of market performance and (ii) an additional index that MFS believes more closely reflects the market segments in which the fund invests, over the same periods.
| Share Class | 1-yr | 5-yr | 10-yr |
| C without sales charge | 25.70% | 10.36% | 10.61% |
| C with CDSC (1% for 12 months)× | 24.70% | 10.36% | 10.61% |
| Comparative Benchmark(s) | |||
| Russell 3000® Index ∆ | 29.45% | 12.92% | 15.12% |
| Russell 1000® Value Index ∆ | 28.55% | 10.42% | 11.37% |
|
∆
|
Source: FactSet Research Systems Inc.
|
|
×
|
Assuming redemption at the end of the applicable period.
|
Visit mfs.com/perf/c for more recent performance information.
FUND STATISTICS AS OF 5/31/26
| Net Assets ($): | 331,692,741 | Total Management Fee ($)#: | 893,778 | |
| Total Number of Holdings: | 126 | Portfolio Turnover Rate (%): | 50 |
# Includes the effect of any management fee waivers, if applicable.
Where the fund holds derivatives, they are not included in the total number of portfolio holdings.
PORTFOLIO COMPOSITION (BASED ON TOTAL INVESTMENTS AS OF 5/31/26)
Portfolio structure
| Equities | 99.3% |
| Money Market Funds | 0.7% |
Equity sectors
| Financials | 19.0% |
| Information Technology | 16.3% |
| Industrials | 12.1% |
| Health Care | 11.5% |
| Consumer Discretionary | 7.9% |
| Communication Services | 7.5% |
| Consumer Staples | 6.5% |
| Energy | 6.4% |
| Utilities | 4.8% |
| Real Estate | 4.0% |
| Materials | 3.3% |
Top ten holdings
| Alphabet, Inc., "A" | 3.1% |
| Johnson & Johnson | 2.9% |
| Amazon.com, Inc. | 2.7% |
| Micron Technology, Inc. | 2.6% |
| Caterpillar, Inc. | 2.0% |
| Citigroup, Inc. | 1.9% |
| Northern Trust Corp. | 1.6% |
| Wabtec Corp. | 1.5% |
| Flex Ltd. | 1.5% |
| Aramark | 1.5% |
MFS uses the Global Industry Classification Standard (GICS®) for sector/industry reporting. MFS has applied its own internal sector/industry classification methodology for equity securities and non-equity securities that are unclassified by GICS.
Top ten holdings
| Alphabet, Inc., "A" | 3.1% |
| Johnson & Johnson | 2.9% |
| Amazon.com, Inc. | 2.7% |
| Micron Technology, Inc. | 2.6% |
| Caterpillar, Inc. | 2.0% |
| Citigroup, Inc. | 1.9% |
| Northern Trust Corp. | 1.6% |
| Wabtec Corp. | 1.5% |
| Flex Ltd. | 1.5% |
| Aramark | 1.5% |
MATERIAL FUND CHANGES
This is a summary of certain changes to the fund since June 1, 2025. For more complete information, you may review the fund's prospectus as amended, which is available at funds.mfs.com or upon request at 1‑800‑225‑2606.
Effective October 1, 2025, the management fee is computed daily and paid monthly at the following annual rates based on the fund’s average daily net assets: 0.25% up to $5 billion; and 0.225% in excess of $5 billion.
Effective October 1, 2025, for Class C shares, the investment adviser has agreed in writing to pay a portion of the fund’s total annual operating expenses, excluding interest, taxes, extraordinary expenses, brokerage and transaction costs, certain tax reclaim recovery expenses (including contingency fees and closing agreement expenses), and investment-related expenses, such that total operating expenses do not exceed 1.39% annually of the class’s average daily net assets. This written agreement will continue until modified by the fund’s Board of Trustees, but such agreement will continue at least until September 30, 2027.
Effective October 1, 2025, the management fee is computed daily and paid monthly at the following annual rates based on the fund’s average daily net assets: 0.25% up to $5 billion; and 0.225% in excess of $5 billion.
Effective October 1, 2025, for Class C shares, the investment adviser has agreed in writing to pay a portion of the fund’s total annual operating expenses, excluding interest, taxes, extraordinary expenses, brokerage and transaction costs, certain tax reclaim recovery expenses (including contingency fees and closing agreement expenses), and investment-related expenses, such that total operating expenses do not exceed 1.39% annually of the class’s average daily net assets. This written agreement will continue until modified by the fund’s Board of Trustees, but such agreement will continue at least until September 30, 2027.
This is a summary of certain changes to the fund since June 1, 2025. For more complete information, you may review the fund's prospectus as amended, which is available at funds.mfs.com or upon request at 1‑800‑225‑2606.
This report describes certain changes to the Fund that occurred during the reporting period.
FUND EXPENSES
What were the fund costs for the last year?
| (based on a hypothetical $10,000 investment) | ||
| Class Name | Costs of a $10,000 investment | Costs paid as a percentage of a $10,000 investment |
| I | $48 | 0.42% |
MANAGEMENT'S DISCUSSION OF FUND PERFORMANCE
-
For the twelve months ended May 31, 2026, Class I shares of the MFS Blended Research Value Equity Fund (fund) provided a total return of 26.99%, at net asset value. This compares with a return of 29.45% for the fund’s benchmark, the Russell 3000® Index. The fund's other benchmark, the Russell 1000® Value Index, generated a return of 28.55%.
-
Global equity markets reached record levels during the period, withstanding considerable volatility amid tariffs, geopolitical conflict and high levels of uncertainty. A new geopolitical event distressed markets at the end of the period as US and Israeli forces launched strikes against Iran, disrupting Mideast oil and natural gas exports. During the period, a pro-growth tax and spending bill was signed into law in the US, while in Europe, renewed focus on defense and infrastructure spending brightened the economic outlook. In Japan, the election of a pro-growth prime minister sent stocks to new highs prior to the conflict in Iran. Optimism over artificial intelligence remained high.
-
Considerable progress was made in trade talks between the US and many major trading partners, with a fragile truce between the US and China extended through late 2026. While the US Supreme Court struck down part of the Trump administration’s tariff strategy, the administration began deploying other authorities to largely replace the ones that were ruled unconstitutional.
-
Early in the period, moderating inflation pressures allowed many global central banks to ease monetary policy. Amid a difficult policymaking environment and slower job growth, the Federal Reserve resumed easing policy in September and delivered quarter-point rate cuts in October and December before pausing.
-
In fixed income markets, previously range-bound global bond yields spiked following the onset of the Middle East conflict, as energy-driven inflation fears appeared to have rattled bond investors. US rate volatility (as measured by the Merrill Lynch Option Volatility Estimate (MOVE) Index) similarly rose from intra-period lows, reflecting uncertainty around the scope and duration of the conflict and its implications for global growth. However, volatility later retracted as the risk of a broader regional military escalation appeared less likely. Global credit spreads widened only modestly before stabilizing near prior levels, supported by strong demand and resilient underlying fundamentals.
-
Top contributors to performance relative to the Russell 1000® Value Index:
-
Security selection within the energy, financials, and industrials sectors strengthened the fund's relative performance.
-
-
Top detractors from performance relative to the Russell 1000® Value Index:
-
Security selection within both the communication services and materials sectors held back relative performance.
-
The fund's underweight allocation to the information technology sector also detracted from relative returns.
-
FUND PERFORMANCE
The fund’s past performance is not a good predictor of the fund’s future performance. The graph and table below do not reflect the deduction of taxes that a shareholder would pay on fund distributions or the redemption of fund shares. The graph and table below assume reinvestment of dividends and capital gain distributions.
Growth of a Hypothetical $10,000 Investment
This graph shows the performance of a hypothetical $10,000 investment in Class I over a ten year period or since inception, if shorter, in comparison to (i) a broad measure of market performance and (ii) an additional index that MFS believes more closely reflects the market segments in which the fund invests.
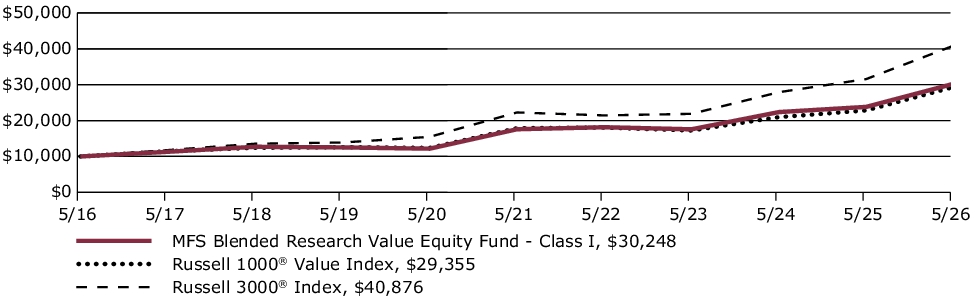
Average Annual Total Returns through 5/31/26
This table shows the average annual total returns of the class of shares noted for the periods shown, both with (if any) and without sales charges. It also shows the average annual total returns of (i) a broad measure of market performance and (ii) an additional index that MFS believes more closely reflects the market segments in which the fund invests, over the same periods.
| Share Class | 1-yr | 5-yr | 10-yr |
| I without sales charge | 26.99% | 11.46% | 11.70% |
| Comparative Benchmark(s) | |||
| Russell 3000® Index ∆ | 29.45% | 12.92% | 15.12% |
| Russell 1000® Value Index ∆ | 28.55% | 10.42% | 11.37% |
|
∆
|
Source: FactSet Research Systems Inc.
|
Visit mfs.com/perf/i for more recent performance information.
FUND STATISTICS AS OF 5/31/26
| Net Assets ($): | 331,692,741 | Total Management Fee ($)#: | 893,778 | |
| Total Number of Holdings: | 126 | Portfolio Turnover Rate (%): | 50 |
# Includes the effect of any management fee waivers, if applicable.
Where the fund holds derivatives, they are not included in the total number of portfolio holdings.
PORTFOLIO COMPOSITION (BASED ON TOTAL INVESTMENTS AS OF 5/31/26)
Portfolio structure
| Equities | 99.3% |
| Money Market Funds | 0.7% |
Equity sectors
| Financials | 19.0% |
| Information Technology | 16.3% |
| Industrials | 12.1% |
| Health Care | 11.5% |
| Consumer Discretionary | 7.9% |
| Communication Services | 7.5% |
| Consumer Staples | 6.5% |
| Energy | 6.4% |
| Utilities | 4.8% |
| Real Estate | 4.0% |
| Materials | 3.3% |
Top ten holdings
| Alphabet, Inc., "A" | 3.1% |
| Johnson & Johnson | 2.9% |
| Amazon.com, Inc. | 2.7% |
| Micron Technology, Inc. | 2.6% |
| Caterpillar, Inc. | 2.0% |
| Citigroup, Inc. | 1.9% |
| Northern Trust Corp. | 1.6% |
| Wabtec Corp. | 1.5% |
| Flex Ltd. | 1.5% |
| Aramark | 1.5% |
MFS uses the Global Industry Classification Standard (GICS®) for sector/industry reporting. MFS has applied its own internal sector/industry classification methodology for equity securities and non-equity securities that are unclassified by GICS.
Top ten holdings
| Alphabet, Inc., "A" | 3.1% |
| Johnson & Johnson | 2.9% |
| Amazon.com, Inc. | 2.7% |
| Micron Technology, Inc. | 2.6% |
| Caterpillar, Inc. | 2.0% |
| Citigroup, Inc. | 1.9% |
| Northern Trust Corp. | 1.6% |
| Wabtec Corp. | 1.5% |
| Flex Ltd. | 1.5% |
| Aramark | 1.5% |
MATERIAL FUND CHANGES
This is a summary of certain changes to the fund since June 1, 2025. For more complete information, you may review the fund's prospectus as amended, which is available at funds.mfs.com or upon request at 1‑800‑225‑2606.
Effective October 1, 2025, the management fee is computed daily and paid monthly at the following annual rates based on the fund’s average daily net assets: 0.25% up to $5 billion; and 0.225% in excess of $5 billion.
Effective October 1, 2025, for Class I shares, the investment adviser has agreed in writing to pay a portion of the fund’s total annual operating expenses, excluding interest, taxes, extraordinary expenses, brokerage and transaction costs, certain tax reclaim recovery expenses (including contingency fees and closing agreement expenses), and investment-related expenses, such that total operating expenses do not exceed 0.39% annually of the class’s average daily net assets. This written agreement will continue until modified by the fund’s Board of Trustees, but such agreement will continue at least until September 30, 2027.
Effective October 1, 2025, the management fee is computed daily and paid monthly at the following annual rates based on the fund’s average daily net assets: 0.25% up to $5 billion; and 0.225% in excess of $5 billion.
Effective October 1, 2025, for Class I shares, the investment adviser has agreed in writing to pay a portion of the fund’s total annual operating expenses, excluding interest, taxes, extraordinary expenses, brokerage and transaction costs, certain tax reclaim recovery expenses (including contingency fees and closing agreement expenses), and investment-related expenses, such that total operating expenses do not exceed 0.39% annually of the class’s average daily net assets. This written agreement will continue until modified by the fund’s Board of Trustees, but such agreement will continue at least until September 30, 2027.
This is a summary of certain changes to the fund since June 1, 2025. For more complete information, you may review the fund's prospectus as amended, which is available at funds.mfs.com or upon request at 1‑800‑225‑2606.
This report describes certain changes to the Fund that occurred during the reporting period.
FUND EXPENSES
What were the fund costs for the last year?
| (based on a hypothetical $10,000 investment) | ||
| Class Name | Costs of a $10,000 investment | Costs paid as a percentage of a $10,000 investment |
| R1 | $76 | 0.67% |
MANAGEMENT'S DISCUSSION OF FUND PERFORMANCE
-
For the twelve months ended May 31, 2026, Class R1 shares of the MFS Blended Research Value Equity Fund (fund) provided a total return of 26.72%, at net asset value. This compares with a return of 29.45% for the fund’s benchmark, the Russell 3000® Index. The fund's other benchmark, the Russell 1000® Value Index, generated a return of 28.55%.
-
Global equity markets reached record levels during the period, withstanding considerable volatility amid tariffs, geopolitical conflict and high levels of uncertainty. A new geopolitical event distressed markets at the end of the period as US and Israeli forces launched strikes against Iran, disrupting Mideast oil and natural gas exports. During the period, a pro-growth tax and spending bill was signed into law in the US, while in Europe, renewed focus on defense and infrastructure spending brightened the economic outlook. In Japan, the election of a pro-growth prime minister sent stocks to new highs prior to the conflict in Iran. Optimism over artificial intelligence remained high.
-
Considerable progress was made in trade talks between the US and many major trading partners, with a fragile truce between the US and China extended through late 2026. While the US Supreme Court struck down part of the Trump administration’s tariff strategy, the administration began deploying other authorities to largely replace the ones that were ruled unconstitutional.
-
Early in the period, moderating inflation pressures allowed many global central banks to ease monetary policy. Amid a difficult policymaking environment and slower job growth, the Federal Reserve resumed easing policy in September and delivered quarter-point rate cuts in October and December before pausing.
-
In fixed income markets, previously range-bound global bond yields spiked following the onset of the Middle East conflict, as energy-driven inflation fears appeared to have rattled bond investors. US rate volatility (as measured by the Merrill Lynch Option Volatility Estimate (MOVE) Index) similarly rose from intra-period lows, reflecting uncertainty around the scope and duration of the conflict and its implications for global growth. However, volatility later retracted as the risk of a broader regional military escalation appeared less likely. Global credit spreads widened only modestly before stabilizing near prior levels, supported by strong demand and resilient underlying fundamentals.
-
Top contributors to performance relative to the Russell 1000® Value Index:
-
Security selection within the energy, financials, and industrials sectors strengthened the fund's relative performance.
-
-
Top detractors from performance relative to the Russell 1000® Value Index:
-
Security selection within both the communication services and materials sectors held back relative performance.
-
The fund's underweight allocation to the information technology sector also detracted from relative returns.
-
FUND PERFORMANCE
The fund’s past performance is not a good predictor of the fund’s future performance. The graph and table below do not reflect the deduction of taxes that a shareholder would pay on fund distributions or the redemption of fund shares. The graph and table below assume reinvestment of dividends and capital gain distributions.
Growth of a Hypothetical $10,000 Investment
This graph shows the performance of a hypothetical $10,000 investment in Class R1 over a ten year period or since inception, if shorter, in comparison to (i) a broad measure of market performance and (ii) an additional index that MFS believes more closely reflects the market segments in which the fund invests.
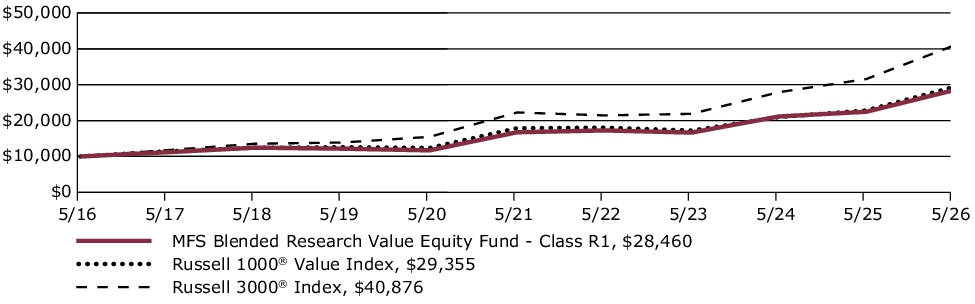
Average Annual Total Returns through 5/31/26
This table shows the average annual total returns of the class of shares noted for the periods shown, both with (if any) and without sales charges. It also shows the average annual total returns of (i) a broad measure of market performance and (ii) an additional index that MFS believes more closely reflects the market segments in which the fund invests, over the same periods.
| Share Class | 1-yr | 5-yr | 10-yr |
| R1 without sales charge | 26.72% | 11.19% | 11.03% |
| Comparative Benchmark(s) | |||
| Russell 3000® Index ∆ | 29.45% | 12.92% | 15.12% |
| Russell 1000® Value Index ∆ | 28.55% | 10.42% | 11.37% |
|
∆
|
Source: FactSet Research Systems Inc.
|
Visit mfs.com/perf/r1 for more recent performance information.
FUND STATISTICS AS OF 5/31/26
| Net Assets ($): | 331,692,741 | Total Management Fee ($)#: | 893,778 | |
| Total Number of Holdings: | 126 | Portfolio Turnover Rate (%): | 50 |
# Includes the effect of any management fee waivers, if applicable.
Where the fund holds derivatives, they are not included in the total number of portfolio holdings.
PORTFOLIO COMPOSITION (BASED ON TOTAL INVESTMENTS AS OF 5/31/26)
Portfolio structure
| Equities | 99.3% |
| Money Market Funds | 0.7% |
Equity sectors
| Financials | 19.0% |
| Information Technology | 16.3% |
| Industrials | 12.1% |
| Health Care | 11.5% |
| Consumer Discretionary | 7.9% |
| Communication Services | 7.5% |
| Consumer Staples | 6.5% |
| Energy | 6.4% |
| Utilities | 4.8% |
| Real Estate | 4.0% |
| Materials | 3.3% |
Top ten holdings
| Alphabet, Inc., "A" | 3.1% |
| Johnson & Johnson | 2.9% |
| Amazon.com, Inc. | 2.7% |
| Micron Technology, Inc. | 2.6% |
| Caterpillar, Inc. | 2.0% |
| Citigroup, Inc. | 1.9% |
| Northern Trust Corp. | 1.6% |
| Wabtec Corp. | 1.5% |
| Flex Ltd. | 1.5% |
| Aramark | 1.5% |
MFS uses the Global Industry Classification Standard (GICS®) for sector/industry reporting. MFS has applied its own internal sector/industry classification methodology for equity securities and non-equity securities that are unclassified by GICS.
Top ten holdings
| Alphabet, Inc., "A" | 3.1% |
| Johnson & Johnson | 2.9% |
| Amazon.com, Inc. | 2.7% |
| Micron Technology, Inc. | 2.6% |
| Caterpillar, Inc. | 2.0% |
| Citigroup, Inc. | 1.9% |
| Northern Trust Corp. | 1.6% |
| Wabtec Corp. | 1.5% |
| Flex Ltd. | 1.5% |
| Aramark | 1.5% |
MATERIAL FUND CHANGES
This is a summary of certain changes to the fund since June 1, 2025. For more complete information, you may review the fund's prospectus as amended, which is available at funds.mfs.com or upon request at 1‑800‑225‑2606.
Effective October 1, 2025, the management fee is computed daily and paid monthly at the following annual rates based on the fund’s average daily net assets: 0.25% up to $5 billion; and 0.225% in excess of $5 billion.
Effective October 1, 2025, for Class R1 shares, the investment adviser has agreed in writing to pay a portion of the fund’s total annual operating expenses, excluding interest, taxes, extraordinary expenses, brokerage and transaction costs, certain tax reclaim recovery expenses (including contingency fees and closing agreement expenses), and investment-related expenses, such that total operating expenses do not exceed 1.39% annually of the class’s average daily net assets. This written agreement will continue until modified by the fund’s Board of Trustees, but such agreement will continue at least until September 30, 2027.
Effective October 1, 2025, the management fee is computed daily and paid monthly at the following annual rates based on the fund’s average daily net assets: 0.25% up to $5 billion; and 0.225% in excess of $5 billion.
Effective October 1, 2025, for Class R1 shares, the investment adviser has agreed in writing to pay a portion of the fund’s total annual operating expenses, excluding interest, taxes, extraordinary expenses, brokerage and transaction costs, certain tax reclaim recovery expenses (including contingency fees and closing agreement expenses), and investment-related expenses, such that total operating expenses do not exceed 1.39% annually of the class’s average daily net assets. This written agreement will continue until modified by the fund’s Board of Trustees, but such agreement will continue at least until September 30, 2027.
This is a summary of certain changes to the fund since June 1, 2025. For more complete information, you may review the fund's prospectus as amended, which is available at funds.mfs.com or upon request at 1‑800‑225‑2606.
This report describes certain changes to the Fund that occurred during the reporting period.
FUND EXPENSES
What were the fund costs for the last year?
| (based on a hypothetical $10,000 investment) | ||
| Class Name | Costs of a $10,000 investment | Costs paid as a percentage of a $10,000 investment |
| R2 | $104 | 0.92% |
MANAGEMENT'S DISCUSSION OF FUND PERFORMANCE
-
For the twelve months ended May 31, 2026, Class R2 shares of the MFS Blended Research Value Equity Fund (fund) provided a total return of 26.36%, at net asset value. This compares with a return of 29.45% for the fund’s benchmark, the Russell 3000® Index. The fund's other benchmark, the Russell 1000® Value Index, generated a return of 28.55%.
-
Global equity markets reached record levels during the period, withstanding considerable volatility amid tariffs, geopolitical conflict and high levels of uncertainty. A new geopolitical event distressed markets at the end of the period as US and Israeli forces launched strikes against Iran, disrupting Mideast oil and natural gas exports. During the period, a pro-growth tax and spending bill was signed into law in the US, while in Europe, renewed focus on defense and infrastructure spending brightened the economic outlook. In Japan, the election of a pro-growth prime minister sent stocks to new highs prior to the conflict in Iran. Optimism over artificial intelligence remained high.
-
Considerable progress was made in trade talks between the US and many major trading partners, with a fragile truce between the US and China extended through late 2026. While the US Supreme Court struck down part of the Trump administration’s tariff strategy, the administration began deploying other authorities to largely replace the ones that were ruled unconstitutional.
-
Early in the period, moderating inflation pressures allowed many global central banks to ease monetary policy. Amid a difficult policymaking environment and slower job growth, the Federal Reserve resumed easing policy in September and delivered quarter-point rate cuts in October and December before pausing.
-
In fixed income markets, previously range-bound global bond yields spiked following the onset of the Middle East conflict, as energy-driven inflation fears appeared to have rattled bond investors. US rate volatility (as measured by the Merrill Lynch Option Volatility Estimate (MOVE) Index) similarly rose from intra-period lows, reflecting uncertainty around the scope and duration of the conflict and its implications for global growth. However, volatility later retracted as the risk of a broader regional military escalation appeared less likely. Global credit spreads widened only modestly before stabilizing near prior levels, supported by strong demand and resilient underlying fundamentals.
-
Top contributors to performance relative to the Russell 1000® Value Index:
-
Security selection within the energy, financials, and industrials sectors strengthened the fund's relative performance.
-
-
Top detractors from performance relative to the Russell 1000® Value Index:
-
Security selection within both the communication services and materials sectors held back relative performance.
-
The fund's underweight allocation to the information technology sector also detracted from relative returns.
-
FUND PERFORMANCE
The fund’s past performance is not a good predictor of the fund’s future performance. The graph and table below do not reflect the deduction of taxes that a shareholder would pay on fund distributions or the redemption of fund shares. The graph and table below assume reinvestment of dividends and capital gain distributions.
Growth of a Hypothetical $10,000 Investment
This graph shows the performance of a hypothetical $10,000 investment in Class R2 over a ten year period or since inception, if shorter, in comparison to (i) a broad measure of market performance and (ii) an additional index that MFS believes more closely reflects the market segments in which the fund invests.
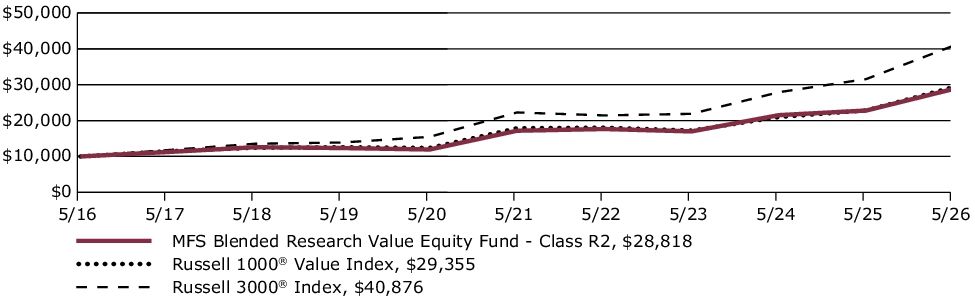
Average Annual Total Returns through 5/31/26
This table shows the average annual total returns of the class of shares noted for the periods shown, both with (if any) and without sales charges. It also shows the average annual total returns of (i) a broad measure of market performance and (ii) an additional index that MFS believes more closely reflects the market segments in which the fund invests, over the same periods.
| Share Class | 1-yr | 5-yr | 10-yr |
| R2 without sales charge | 26.36% | 10.91% | 11.16% |
| Comparative Benchmark(s) | |||
| Russell 3000® Index ∆ | 29.45% | 12.92% | 15.12% |
| Russell 1000® Value Index ∆ | 28.55% | 10.42% | 11.37% |
|
∆
|
Source: FactSet Research Systems Inc.
|
Visit mfs.com/perf/r2 for more recent performance information.
FUND STATISTICS AS OF 5/31/26
| Net Assets ($): | 331,692,741 | Total Management Fee ($)#: | 893,778 | |
| Total Number of Holdings: | 126 | Portfolio Turnover Rate (%): | 50 |
# Includes the effect of any management fee waivers, if applicable.
Where the fund holds derivatives, they are not included in the total number of portfolio holdings.
PORTFOLIO COMPOSITION (BASED ON TOTAL INVESTMENTS AS OF 5/31/26)
Portfolio structure
| Equities | 99.3% |
| Money Market Funds | 0.7% |
Equity sectors
| Financials | 19.0% |
| Information Technology | 16.3% |
| Industrials | 12.1% |
| Health Care | 11.5% |
| Consumer Discretionary | 7.9% |
| Communication Services | 7.5% |
| Consumer Staples | 6.5% |
| Energy | 6.4% |
| Utilities | 4.8% |
| Real Estate | 4.0% |
| Materials | 3.3% |
Top ten holdings
| Alphabet, Inc., "A" | 3.1% |
| Johnson & Johnson | 2.9% |
| Amazon.com, Inc. | 2.7% |
| Micron Technology, Inc. | 2.6% |
| Caterpillar, Inc. | 2.0% |
| Citigroup, Inc. | 1.9% |
| Northern Trust Corp. | 1.6% |
| Wabtec Corp. | 1.5% |
| Flex Ltd. | 1.5% |
| Aramark | 1.5% |
MFS uses the Global Industry Classification Standard (GICS®) for sector/industry reporting. MFS has applied its own internal sector/industry classification methodology for equity securities and non-equity securities that are unclassified by GICS.
Top ten holdings
| Alphabet, Inc., "A" | 3.1% |
| Johnson & Johnson | 2.9% |
| Amazon.com, Inc. | 2.7% |
| Micron Technology, Inc. | 2.6% |
| Caterpillar, Inc. | 2.0% |
| Citigroup, Inc. | 1.9% |
| Northern Trust Corp. | 1.6% |
| Wabtec Corp. | 1.5% |
| Flex Ltd. | 1.5% |
| Aramark | 1.5% |
MATERIAL FUND CHANGES
This is a summary of certain changes to the fund since June 1, 2025. For more complete information, you may review the fund's prospectus as amended, which is available at funds.mfs.com or upon request at 1‑800‑225‑2606.
Effective October 1, 2025, the management fee is computed daily and paid monthly at the following annual rates based on the fund’s average daily net assets: 0.25% up to $5 billion; and 0.225% in excess of $5 billion.
Effective October 1, 2025, for Class R2 shares, the investment adviser has agreed in writing to pay a portion of the fund’s total annual operating expenses, excluding interest, taxes, extraordinary expenses, brokerage and transaction costs, certain tax reclaim recovery expenses (including contingency fees and closing agreement expenses), and investment-related expenses, such that total operating expenses do not exceed 0.89% annually of the class’s average daily net assets. This written agreement will continue until modified by the fund’s Board of Trustees, but such agreement will continue at least until September 30, 2027.
Effective October 1, 2025, the management fee is computed daily and paid monthly at the following annual rates based on the fund’s average daily net assets: 0.25% up to $5 billion; and 0.225% in excess of $5 billion.
Effective October 1, 2025, for Class R2 shares, the investment adviser has agreed in writing to pay a portion of the fund’s total annual operating expenses, excluding interest, taxes, extraordinary expenses, brokerage and transaction costs, certain tax reclaim recovery expenses (including contingency fees and closing agreement expenses), and investment-related expenses, such that total operating expenses do not exceed 0.89% annually of the class’s average daily net assets. This written agreement will continue until modified by the fund’s Board of Trustees, but such agreement will continue at least until September 30, 2027.
This is a summary of certain changes to the fund since June 1, 2025. For more complete information, you may review the fund's prospectus as amended, which is available at funds.mfs.com or upon request at 1‑800‑225‑2606.
This report describes certain changes to the Fund that occurred during the reporting period.
FUND EXPENSES
What were the fund costs for the last year?
| (based on a hypothetical $10,000 investment) | ||
| Class Name | Costs of a $10,000 investment | Costs paid as a percentage of a $10,000 investment |
| R3 | $76 | 0.67% |
MANAGEMENT'S DISCUSSION OF FUND PERFORMANCE
-
For the twelve months ended May 31, 2026, Class R3 shares of the MFS Blended Research Value Equity Fund (fund) provided a total return of 26.67%, at net asset value. This compares with a return of 29.45% for the fund’s benchmark, the Russell 3000® Index. The fund's other benchmark, the Russell 1000® Value Index, generated a return of 28.55%.
-
Global equity markets reached record levels during the period, withstanding considerable volatility amid tariffs, geopolitical conflict and high levels of uncertainty. A new geopolitical event distressed markets at the end of the period as US and Israeli forces launched strikes against Iran, disrupting Mideast oil and natural gas exports. During the period, a pro-growth tax and spending bill was signed into law in the US, while in Europe, renewed focus on defense and infrastructure spending brightened the economic outlook. In Japan, the election of a pro-growth prime minister sent stocks to new highs prior to the conflict in Iran. Optimism over artificial intelligence remained high.
-
Considerable progress was made in trade talks between the US and many major trading partners, with a fragile truce between the US and China extended through late 2026. While the US Supreme Court struck down part of the Trump administration’s tariff strategy, the administration began deploying other authorities to largely replace the ones that were ruled unconstitutional.
-
Early in the period, moderating inflation pressures allowed many global central banks to ease monetary policy. Amid a difficult policymaking environment and slower job growth, the Federal Reserve resumed easing policy in September and delivered quarter-point rate cuts in October and December before pausing.
-
In fixed income markets, previously range-bound global bond yields spiked following the onset of the Middle East conflict, as energy-driven inflation fears appeared to have rattled bond investors. US rate volatility (as measured by the Merrill Lynch Option Volatility Estimate (MOVE) Index) similarly rose from intra-period lows, reflecting uncertainty around the scope and duration of the conflict and its implications for global growth. However, volatility later retracted as the risk of a broader regional military escalation appeared less likely. Global credit spreads widened only modestly before stabilizing near prior levels, supported by strong demand and resilient underlying fundamentals.
-
Top contributors to performance relative to the Russell 1000® Value Index:
-
Security selection within the energy, financials, and industrials sectors strengthened the fund's relative performance.
-
-
Top detractors from performance relative to the Russell 1000® Value Index:
-
Security selection within both the communication services and materials sectors held back relative performance.
-
The fund's underweight allocation to the information technology sector also detracted from relative returns.
-
FUND PERFORMANCE
The fund’s past performance is not a good predictor of the fund’s future performance. The graph and table below do not reflect the deduction of taxes that a shareholder would pay on fund distributions or the redemption of fund shares. The graph and table below assume reinvestment of dividends and capital gain distributions.
Growth of a Hypothetical $10,000 Investment
This graph shows the performance of a hypothetical $10,000 investment in Class R3 over a ten year period or since inception, if shorter, in comparison to (i) a broad measure of market performance and (ii) an additional index that MFS believes more closely reflects the market segments in which the fund invests.
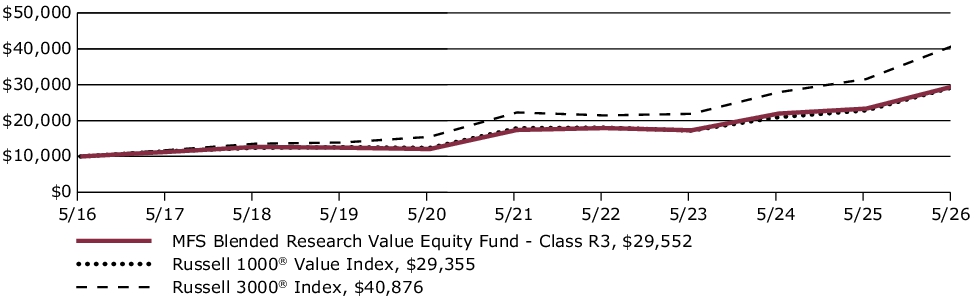
Average Annual Total Returns through 5/31/26
This table shows the average annual total returns of the class of shares noted for the periods shown, both with (if any) and without sales charges. It also shows the average annual total returns of (i) a broad measure of market performance and (ii) an additional index that MFS believes more closely reflects the market segments in which the fund invests, over the same periods.
| Share Class | 1-yr | 5-yr | 10-yr |
| R3 without sales charge | 26.67% | 11.19% | 11.44% |
| Comparative Benchmark(s) | |||
| Russell 3000® Index ∆ | 29.45% | 12.92% | 15.12% |
| Russell 1000® Value Index ∆ | 28.55% | 10.42% | 11.37% |
|
∆
|
Source: FactSet Research Systems Inc.
|
Visit mfs.com/perf/r3 for more recent performance information.
FUND STATISTICS AS OF 5/31/26
| Net Assets ($): | 331,692,741 | Total Management Fee ($)#: | 893,778 | |
| Total Number of Holdings: | 126 | Portfolio Turnover Rate (%): | 50 |
# Includes the effect of any management fee waivers, if applicable.
Where the fund holds derivatives, they are not included in the total number of portfolio holdings.
PORTFOLIO COMPOSITION (BASED ON TOTAL INVESTMENTS AS OF 5/31/26)
Portfolio structure
| Equities | 99.3% |
| Money Market Funds | 0.7% |
Equity sectors
| Financials | 19.0% |
| Information Technology | 16.3% |
| Industrials | 12.1% |
| Health Care | 11.5% |
| Consumer Discretionary | 7.9% |
| Communication Services | 7.5% |
| Consumer Staples | 6.5% |
| Energy | 6.4% |
| Utilities | 4.8% |
| Real Estate | 4.0% |
| Materials | 3.3% |
Top ten holdings
| Alphabet, Inc., "A" | 3.1% |
| Johnson & Johnson | 2.9% |
| Amazon.com, Inc. | 2.7% |
| Micron Technology, Inc. | 2.6% |
| Caterpillar, Inc. | 2.0% |
| Citigroup, Inc. | 1.9% |
| Northern Trust Corp. | 1.6% |
| Wabtec Corp. | 1.5% |
| Flex Ltd. | 1.5% |
| Aramark | 1.5% |
MFS uses the Global Industry Classification Standard (GICS®) for sector/industry reporting. MFS has applied its own internal sector/industry classification methodology for equity securities and non-equity securities that are unclassified by GICS.
Top ten holdings
| Alphabet, Inc., "A" | 3.1% |
| Johnson & Johnson | 2.9% |
| Amazon.com, Inc. | 2.7% |
| Micron Technology, Inc. | 2.6% |
| Caterpillar, Inc. | 2.0% |
| Citigroup, Inc. | 1.9% |
| Northern Trust Corp. | 1.6% |
| Wabtec Corp. | 1.5% |
| Flex Ltd. | 1.5% |
| Aramark | 1.5% |
MATERIAL FUND CHANGES
This is a summary of certain changes to the fund since June 1, 2025. For more complete information, you may review the fund's prospectus as amended, which is available at funds.mfs.com or upon request at 1‑800‑225‑2606.
Effective October 1, 2025, the management fee is computed daily and paid monthly at the following annual rates based on the fund’s average daily net assets: 0.25% up to $5 billion; and 0.225% in excess of $5 billion.
Effective October 1, 2025, for Class R3 shares, the investment adviser has agreed in writing to pay a portion of the fund’s total annual operating expenses, excluding interest, taxes, extraordinary expenses, brokerage and transaction costs, certain tax reclaim recovery expenses (including contingency fees and closing agreement expenses), and investment-related expenses, such that total operating expenses do not exceed 0.64% annually of the class’s average daily net assets. This written agreement will continue until modified by the fund’s Board of Trustees, but such agreement will continue at least until September 30, 2027.
Effective October 1, 2025, the management fee is computed daily and paid monthly at the following annual rates based on the fund’s average daily net assets: 0.25% up to $5 billion; and 0.225% in excess of $5 billion.
Effective October 1, 2025, for Class R3 shares, the investment adviser has agreed in writing to pay a portion of the fund’s total annual operating expenses, excluding interest, taxes, extraordinary expenses, brokerage and transaction costs, certain tax reclaim recovery expenses (including contingency fees and closing agreement expenses), and investment-related expenses, such that total operating expenses do not exceed 0.64% annually of the class’s average daily net assets. This written agreement will continue until modified by the fund’s Board of Trustees, but such agreement will continue at least until September 30, 2027.
This is a summary of certain changes to the fund since June 1, 2025. For more complete information, you may review the fund's prospectus as amended, which is available at funds.mfs.com or upon request at 1‑800‑225‑2606.
This report describes certain changes to the Fund that occurred during the reporting period.
FUND EXPENSES
What were the fund costs for the last year?
| (based on a hypothetical $10,000 investment) | ||
| Class Name | Costs of a $10,000 investment | Costs paid as a percentage of a $10,000 investment |
| R4 | $48 | 0.42% |
MANAGEMENT'S DISCUSSION OF FUND PERFORMANCE
-
For the twelve months ended May 31, 2026, Class R4 shares of the MFS Blended Research Value Equity Fund (fund) provided a total return of 27.00%, at net asset value. This compares with a return of 29.45% for the fund’s benchmark, the Russell 3000® Index. The fund's other benchmark, the Russell 1000® Value Index, generated a return of 28.55%.
-
Global equity markets reached record levels during the period, withstanding considerable volatility amid tariffs, geopolitical conflict and high levels of uncertainty. A new geopolitical event distressed markets at the end of the period as US and Israeli forces launched strikes against Iran, disrupting Mideast oil and natural gas exports. During the period, a pro-growth tax and spending bill was signed into law in the US, while in Europe, renewed focus on defense and infrastructure spending brightened the economic outlook. In Japan, the election of a pro-growth prime minister sent stocks to new highs prior to the conflict in Iran. Optimism over artificial intelligence remained high.
-
Considerable progress was made in trade talks between the US and many major trading partners, with a fragile truce between the US and China extended through late 2026. While the US Supreme Court struck down part of the Trump administration’s tariff strategy, the administration began deploying other authorities to largely replace the ones that were ruled unconstitutional.
-
Early in the period, moderating inflation pressures allowed many global central banks to ease monetary policy. Amid a difficult policymaking environment and slower job growth, the Federal Reserve resumed easing policy in September and delivered quarter-point rate cuts in October and December before pausing.
-
In fixed income markets, previously range-bound global bond yields spiked following the onset of the Middle East conflict, as energy-driven inflation fears appeared to have rattled bond investors. US rate volatility (as measured by the Merrill Lynch Option Volatility Estimate (MOVE) Index) similarly rose from intra-period lows, reflecting uncertainty around the scope and duration of the conflict and its implications for global growth. However, volatility later retracted as the risk of a broader regional military escalation appeared less likely. Global credit spreads widened only modestly before stabilizing near prior levels, supported by strong demand and resilient underlying fundamentals.
-
Top contributors to performance relative to the Russell 1000® Value Index:
-
Security selection within the energy, financials, and industrials sectors strengthened the fund's relative performance.
-
-
Top detractors from performance relative to the Russell 1000® Value Index:
-
Security selection within both the communication services and materials sectors held back relative performance.
-
The fund's underweight allocation to the information technology sector also detracted from relative returns.
-
FUND PERFORMANCE
The fund’s past performance is not a good predictor of the fund’s future performance. The graph and table below do not reflect the deduction of taxes that a shareholder would pay on fund distributions or the redemption of fund shares. The graph and table below assume reinvestment of dividends and capital gain distributions.
Growth of a Hypothetical $10,000 Investment
This graph shows the performance of a hypothetical $10,000 investment in Class R4 over a ten year period or since inception, if shorter, in comparison to (i) a broad measure of market performance and (ii) an additional index that MFS believes more closely reflects the market segments in which the fund invests.
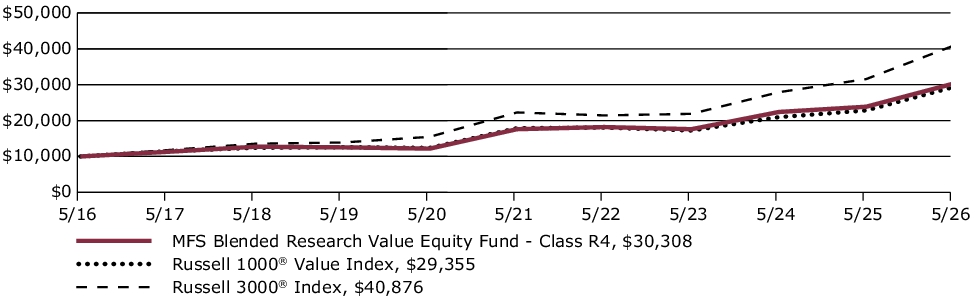
Average Annual Total Returns through 5/31/26
This table shows the average annual total returns of the class of shares noted for the periods shown, both with (if any) and without sales charges. It also shows the average annual total returns of (i) a broad measure of market performance and (ii) an additional index that MFS believes more closely reflects the market segments in which the fund invests, over the same periods.
| Share Class | 1-yr | 5-yr | 10-yr |
| R4 without sales charge | 27.00% | 11.48% | 11.73% |
| Comparative Benchmark(s) | |||
| Russell 3000® Index ∆ | 29.45% | 12.92% | 15.12% |
| Russell 1000® Value Index ∆ | 28.55% | 10.42% | 11.37% |
|
∆
|
Source: FactSet Research Systems Inc.
|
Visit mfs.com/perf/r4 for more recent performance information.
FUND STATISTICS AS OF 5/31/26
| Net Assets ($): | 331,692,741 | Total Management Fee ($)#: | 893,778 | |
| Total Number of Holdings: | 126 | Portfolio Turnover Rate (%): | 50 |
# Includes the effect of any management fee waivers, if applicable.
Where the fund holds derivatives, they are not included in the total number of portfolio holdings.
PORTFOLIO COMPOSITION (BASED ON TOTAL INVESTMENTS AS OF 5/31/26)
Portfolio structure
| Equities | 99.3% |
| Money Market Funds | 0.7% |
Equity sectors
| Financials | 19.0% |
| Information Technology | 16.3% |
| Industrials | 12.1% |
| Health Care | 11.5% |
| Consumer Discretionary | 7.9% |
| Communication Services | 7.5% |
| Consumer Staples | 6.5% |
| Energy | 6.4% |
| Utilities | 4.8% |
| Real Estate | 4.0% |
| Materials | 3.3% |
Top ten holdings
| Alphabet, Inc., "A" | 3.1% |
| Johnson & Johnson | 2.9% |
| Amazon.com, Inc. | 2.7% |
| Micron Technology, Inc. | 2.6% |
| Caterpillar, Inc. | 2.0% |
| Citigroup, Inc. | 1.9% |
| Northern Trust Corp. | 1.6% |
| Wabtec Corp. | 1.5% |
| Flex Ltd. | 1.5% |
| Aramark | 1.5% |
MFS uses the Global Industry Classification Standard (GICS®) for sector/industry reporting. MFS has applied its own internal sector/industry classification methodology for equity securities and non-equity securities that are unclassified by GICS.
Top ten holdings
| Alphabet, Inc., "A" | 3.1% |
| Johnson & Johnson | 2.9% |
| Amazon.com, Inc. | 2.7% |
| Micron Technology, Inc. | 2.6% |
| Caterpillar, Inc. | 2.0% |
| Citigroup, Inc. | 1.9% |
| Northern Trust Corp. | 1.6% |
| Wabtec Corp. | 1.5% |
| Flex Ltd. | 1.5% |
| Aramark | 1.5% |
MATERIAL FUND CHANGES
This is a summary of certain changes to the fund since June 1, 2025. For more complete information, you may review the fund's prospectus as amended, which is available at funds.mfs.com or upon request at 1‑800‑225‑2606.
Effective October 1, 2025, the management fee is computed daily and paid monthly at the following annual rates based on the fund’s average daily net assets: 0.25% up to $5 billion; and 0.225% in excess of $5 billion.
Effective October 1, 2025, for Class R4 shares, the investment adviser has agreed in writing to pay a portion of the fund’s total annual operating expenses, excluding interest, taxes, extraordinary expenses, brokerage and transaction costs, certain tax reclaim recovery expenses (including contingency fees and closing agreement expenses), and investment-related expenses, such that total operating expenses do not exceed 0.39% annually of the class’s average daily net assets. This written agreement will continue until modified by the fund’s Board of Trustees, but such agreement will continue at least until September 30, 2027.
Effective October 1, 2025, the management fee is computed daily and paid monthly at the following annual rates based on the fund’s average daily net assets: 0.25% up to $5 billion; and 0.225% in excess of $5 billion.
Effective October 1, 2025, for Class R4 shares, the investment adviser has agreed in writing to pay a portion of the fund’s total annual operating expenses, excluding interest, taxes, extraordinary expenses, brokerage and transaction costs, certain tax reclaim recovery expenses (including contingency fees and closing agreement expenses), and investment-related expenses, such that total operating expenses do not exceed 0.39% annually of the class’s average daily net assets. This written agreement will continue until modified by the fund’s Board of Trustees, but such agreement will continue at least until September 30, 2027.
This is a summary of certain changes to the fund since June 1, 2025. For more complete information, you may review the fund's prospectus as amended, which is available at funds.mfs.com or upon request at 1‑800‑225‑2606.
This report describes certain changes to the Fund that occurred during the reporting period.
FUND EXPENSES
What were the fund costs for the last year?
| (based on a hypothetical $10,000 investment) | ||
| Class Name | Costs of a $10,000 investment | Costs paid as a percentage of a $10,000 investment |
| R6 | $40 | 0.35% |
MANAGEMENT'S DISCUSSION OF FUND PERFORMANCE
-
For the twelve months ended May 31, 2026, Class R6 shares of the MFS Blended Research Value Equity Fund (fund) provided a total return of 27.12%, at net asset value. This compares with a return of 29.45% for the fund’s benchmark, the Russell 3000® Index. The fund's other benchmark, the Russell 1000® Value Index, generated a return of 28.55%.
-
Global equity markets reached record levels during the period, withstanding considerable volatility amid tariffs, geopolitical conflict and high levels of uncertainty. A new geopolitical event distressed markets at the end of the period as US and Israeli forces launched strikes against Iran, disrupting Mideast oil and natural gas exports. During the period, a pro-growth tax and spending bill was signed into law in the US, while in Europe, renewed focus on defense and infrastructure spending brightened the economic outlook. In Japan, the election of a pro-growth prime minister sent stocks to new highs prior to the conflict in Iran. Optimism over artificial intelligence remained high.
-
Considerable progress was made in trade talks between the US and many major trading partners, with a fragile truce between the US and China extended through late 2026. While the US Supreme Court struck down part of the Trump administration’s tariff strategy, the administration began deploying other authorities to largely replace the ones that were ruled unconstitutional.
-
Early in the period, moderating inflation pressures allowed many global central banks to ease monetary policy. Amid a difficult policymaking environment and slower job growth, the Federal Reserve resumed easing policy in September and delivered quarter-point rate cuts in October and December before pausing.
-
In fixed income markets, previously range-bound global bond yields spiked following the onset of the Middle East conflict, as energy-driven inflation fears appeared to have rattled bond investors. US rate volatility (as measured by the Merrill Lynch Option Volatility Estimate (MOVE) Index) similarly rose from intra-period lows, reflecting uncertainty around the scope and duration of the conflict and its implications for global growth. However, volatility later retracted as the risk of a broader regional military escalation appeared less likely. Global credit spreads widened only modestly before stabilizing near prior levels, supported by strong demand and resilient underlying fundamentals.
-
Top contributors to performance relative to the Russell 1000® Value Index:
-
Security selection within the energy, financials, and industrials sectors strengthened the fund's relative performance.
-
-
Top detractors from performance relative to the Russell 1000® Value Index:
-
Security selection within both the communication services and materials sectors held back relative performance.
-
The fund's underweight allocation to the information technology sector also detracted from relative returns.
-
FUND PERFORMANCE
The fund’s past performance is not a good predictor of the fund’s future performance. The graph and table below do not reflect the deduction of taxes that a shareholder would pay on fund distributions or the redemption of fund shares. The graph and table below assume reinvestment of dividends and capital gain distributions.
Growth of a Hypothetical $10,000 Investment
This graph shows the performance of a hypothetical $10,000 investment in Class R6 over a ten year period or since inception, if shorter, in comparison to (i) a broad measure of market performance and (ii) an additional index that MFS believes more closely reflects the market segments in which the fund invests.
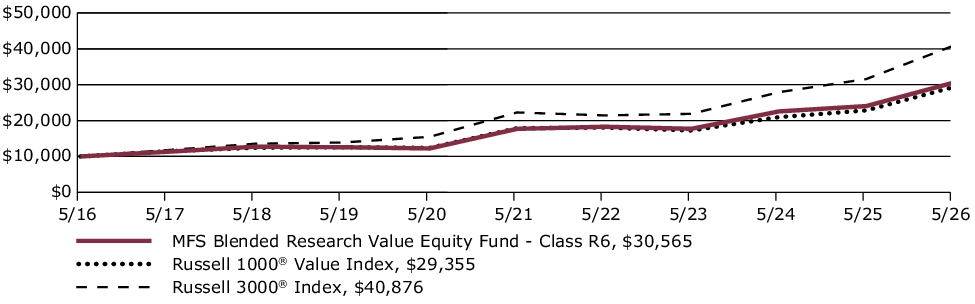
Average Annual Total Returns through 5/31/26
This table shows the average annual total returns of the class of shares noted for the periods shown, both with (if any) and without sales charges. It also shows the average annual total returns of (i) a broad measure of market performance and (ii) an additional index that MFS believes more closely reflects the market segments in which the fund invests, over the same periods.
| Share Class | 1-yr | 5-yr | 10-yr |
| R6 without sales charge | 27.12% | 11.56% | 11.82% |
| Comparative Benchmark(s) | |||
| Russell 3000® Index ∆ | 29.45% | 12.92% | 15.12% |
| Russell 1000® Value Index ∆ | 28.55% | 10.42% | 11.37% |
|
∆
|
Source: FactSet Research Systems Inc.
|
Visit mfs.com/perf/r6 for more recent performance information.
FUND STATISTICS AS OF 5/31/26
| Net Assets ($): | 331,692,741 | Total Management Fee ($)#: | 893,778 | |
| Total Number of Holdings: | 126 | Portfolio Turnover Rate (%): | 50 |
# Includes the effect of any management fee waivers, if applicable.
Where the fund holds derivatives, they are not included in the total number of portfolio holdings.
PORTFOLIO COMPOSITION (BASED ON TOTAL INVESTMENTS AS OF 5/31/26)
Portfolio structure
| Equities | 99.3% |
| Money Market Funds | 0.7% |
Equity sectors
| Financials | 19.0% |
| Information Technology | 16.3% |
| Industrials | 12.1% |
| Health Care | 11.5% |
| Consumer Discretionary | 7.9% |
| Communication Services | 7.5% |
| Consumer Staples | 6.5% |
| Energy | 6.4% |
| Utilities | 4.8% |
| Real Estate | 4.0% |
| Materials | 3.3% |
Top ten holdings
| Alphabet, Inc., "A" | 3.1% |
| Johnson & Johnson | 2.9% |
| Amazon.com, Inc. | 2.7% |
| Micron Technology, Inc. | 2.6% |
| Caterpillar, Inc. | 2.0% |
| Citigroup, Inc. | 1.9% |
| Northern Trust Corp. | 1.6% |
| Wabtec Corp. | 1.5% |
| Flex Ltd. | 1.5% |
| Aramark | 1.5% |
MFS uses the Global Industry Classification Standard (GICS®) for sector/industry reporting. MFS has applied its own internal sector/industry classification methodology for equity securities and non-equity securities that are unclassified by GICS.
Top ten holdings
| Alphabet, Inc., "A" | 3.1% |
| Johnson & Johnson | 2.9% |
| Amazon.com, Inc. | 2.7% |
| Micron Technology, Inc. | 2.6% |
| Caterpillar, Inc. | 2.0% |
| Citigroup, Inc. | 1.9% |
| Northern Trust Corp. | 1.6% |
| Wabtec Corp. | 1.5% |
| Flex Ltd. | 1.5% |
| Aramark | 1.5% |
MATERIAL FUND CHANGES
This is a summary of certain changes to the fund since June 1, 2025. For more complete information, you may review the fund's prospectus as amended, which is available at funds.mfs.com or upon request at 1‑800‑225‑2606.
Effective October 1, 2025, the management fee is computed daily and paid monthly at the following annual rates based on the fund’s average daily net assets: 0.25% up to $5 billion; and 0.225% in excess of $5 billion.
Effective October 1, 2025, for Class R6 shares, the investment adviser has agreed in writing to pay a portion of the fund’s total annual operating expenses, excluding interest, taxes, extraordinary expenses, brokerage and transaction costs, certain tax reclaim recovery expenses (including contingency fees and closing agreement expenses), and investment-related expenses, such that total operating expenses do not exceed 0.34% annually of the class’s average daily net assets. This written agreement will continue until modified by the fund’s Board of Trustees, but such agreement will continue at least until September 30, 2027.
Effective October 1, 2025, the management fee is computed daily and paid monthly at the following annual rates based on the fund’s average daily net assets: 0.25% up to $5 billion; and 0.225% in excess of $5 billion.
Effective October 1, 2025, for Class R6 shares, the investment adviser has agreed in writing to pay a portion of the fund’s total annual operating expenses, excluding interest, taxes, extraordinary expenses, brokerage and transaction costs, certain tax reclaim recovery expenses (including contingency fees and closing agreement expenses), and investment-related expenses, such that total operating expenses do not exceed 0.34% annually of the class’s average daily net assets. This written agreement will continue until modified by the fund’s Board of Trustees, but such agreement will continue at least until September 30, 2027.
This is a summary of certain changes to the fund since June 1, 2025. For more complete information, you may review the fund's prospectus as amended, which is available at funds.mfs.com or upon request at 1‑800‑225‑2606.
FUND EXPENSES
What were the fund costs for the last year?
| (based on a hypothetical $10,000 investment) | ||
| Class Name | Costs of a $10,000 investment | Costs paid as a percentage of a $10,000 investment |
| R6 | $55 | 0.50% |
MANAGEMENT'S DISCUSSION OF FUND PERFORMANCE
-
For the twelve months ended May 31, 2026, Class R6 shares of the MFS Blended Research Mid Cap Equity Fund (fund) provided a total return of 21.19%, at net asset value. This compares with a return of 29.45% for the fund’s benchmark, the Russell 3000® Index. The fund's other benchmark, the Russell Midcap® Index, generated a return of 22.37%.
-
Global equity markets reached record levels during the period, withstanding considerable volatility amid tariffs, geopolitical conflict and high levels of uncertainty. A new geopolitical event distressed markets at the end of the period as US and Israeli forces launched strikes against Iran, disrupting Mideast oil and natural gas exports. During the period, a pro-growth tax and spending bill was signed into law in the US, while in Europe, renewed focus on defense and infrastructure spending brightened the economic outlook. In Japan, the election of a pro-growth prime minister sent stocks to new highs prior to the conflict in Iran. Optimism over artificial intelligence remained high.
-
Considerable progress was made in trade talks between the US and many major trading partners, with a fragile truce between the US and China extended through late 2026. While the US Supreme Court struck down part of the Trump administration’s tariff strategy, the administration began deploying other authorities to largely replace the ones that were ruled unconstitutional.
-
Early in the period, moderating inflation pressures allowed many global central banks to ease monetary policy. Amid a difficult policymaking environment and slower job growth, the Federal Reserve resumed easing policy in September and delivered quarter-point rate cuts in October and December before pausing.
-
In fixed income markets, previously range-bound global bond yields spiked following the onset of the Middle East conflict, as energy-driven inflation fears appeared to have rattled bond investors. US rate volatility (as measured by the Merrill Lynch Option Volatility Estimate (MOVE) Index) similarly rose from intra-period lows, reflecting uncertainty around the scope and duration of the conflict and its implications for global growth. However, volatility later retracted as the risk of a broader regional military escalation appeared less likely. Global credit spreads widened only modestly before stabilizing near prior levels, supported by strong demand and resilient underlying fundamentals.
-
Top contributors to performance relative to the Russell Midcap® Index:
-
Security selection within the consumer discretionary, energy, real estate, and financials sectors strengthened the fund's relative performance.
-
-
Top detractors from performance relative to the Russell Midcap® Index:
-
Security selection within the industrials, materials, and communication services sectors held back relative performance.
-
FUND PERFORMANCE
The fund’s past performance is not a good predictor of the fund’s future performance. The graph and table below do not reflect the deduction of taxes that a shareholder would pay on fund distributions or the redemption of fund shares. The graph and table below assume reinvestment of dividends and capital gain distributions.
Growth of a Hypothetical $10,000 Investment*
This graph shows the performance of a hypothetical $10,000 investment in Class R6 over a ten year period or since inception, if shorter, in comparison to (i) a broad measure of market performance and (ii) an additional index that MFS believes more closely reflects the market segments in which the fund invests.
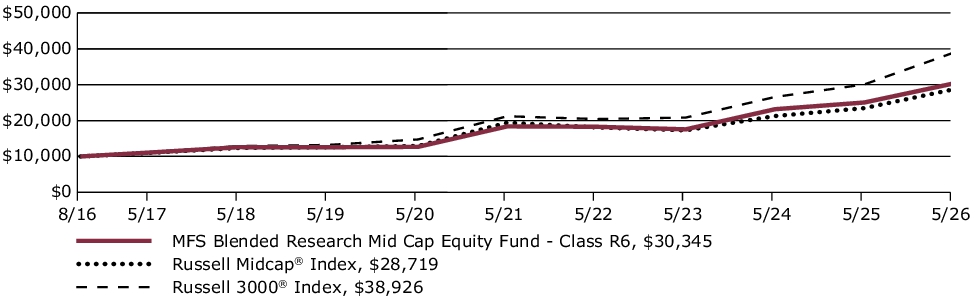
Average Annual Total Returns through 5/31/26
This table shows the average annual total returns of the class of shares noted for the periods shown, both with (if any) and without sales charges. It also shows the average annual total returns of (i) a broad measure of market performance and (ii) an additional index that MFS believes more closely reflects the market segments in which the fund invests, over the same periods.
| Share Class | 1-yr | 5-yr | Life* |
| R6 without sales charge | 21.19% | 10.54% | 12.01% |
| Comparative Benchmark(s) | |||
| Russell 3000® Index ∆ | 29.45% | 12.92% | 14.89% |
| Russell Midcap® Index ∆ | 22.37% | 8.15% | 11.38% |
|
*
|
For the period from the commencement of the class's investment operations, August 19, 2016 through May 31, 2026.
|
|
∆
|
Source: FactSet Research Systems Inc.
|
Visit mfs.com/perf/r6 for more recent performance information.
FUND STATISTICS AS OF 5/31/26
| Net Assets ($): | 2,936,785,790 | Total Management Fee ($)#: | 10,501,441 | |
| Total Number of Holdings: | 160 | Portfolio Turnover Rate (%): | 51 |
# Includes the effect of any management fee waivers, if applicable.
Where the fund holds derivatives, they are not included in the total number of portfolio holdings.
PORTFOLIO COMPOSITION (BASED ON TOTAL INVESTMENTS AS OF 5/31/26)
Portfolio structure
| Equities | 99.6% |
| Money Market Funds | 0.4% |
Equity sectors
| Information Technology | 17.7% |
| Industrials | 16.9% |
| Financials | 13.8% |
| Consumer Discretionary | 11.9% |
| Health Care | 10.2% |
| Energy | 6.4% |
| Real Estate | 6.4% |
| Utilities | 6.2% |
| Materials | 3.9% |
| Communication Services | 3.5% |
| Consumer Staples | 2.7% |
Top ten holdings
| Western Digital Corp. | 3.0% |
| Flex Ltd. | 2.7% |
| Valero Energy Corp. | 2.0% |
| Ciena Corp. | 1.9% |
| Viking Holdings Ltd. | 1.9% |
| Okta, Inc. | 1.8% |
| Northern Trust Corp. | 1.8% |
| Aramark | 1.7% |
| Wabtec Corp. | 1.6% |
| Edison International | 1.6% |
MFS uses the Global Industry Classification Standard (GICS®) for sector/industry reporting. MFS has applied its own internal sector/industry classification methodology for equity securities and non-equity securities that are unclassified by GICS.
Top ten holdings
| Western Digital Corp. | 3.0% |
| Flex Ltd. | 2.7% |
| Valero Energy Corp. | 2.0% |
| Ciena Corp. | 1.9% |
| Viking Holdings Ltd. | 1.9% |
| Okta, Inc. | 1.8% |
| Northern Trust Corp. | 1.8% |
| Aramark | 1.7% |
| Wabtec Corp. | 1.6% |
| Edison International | 1.6% |
FUND EXPENSES
What were the fund costs for the last year?
| (based on a hypothetical $10,000 investment) | ||
| Class Name | Costs of a $10,000 investment | Costs paid as a percentage of a $10,000 investment |
| R4 | $65 | 0.59% |
MANAGEMENT'S DISCUSSION OF FUND PERFORMANCE
-
For the twelve months ended May 31, 2026, Class R4 shares of the MFS Blended Research Mid Cap Equity Fund (fund) provided a total return of 21.11%, at net asset value. This compares with a return of 29.45% for the fund’s benchmark, the Russell 3000® Index. The fund's other benchmark, the Russell Midcap® Index, generated a return of 22.37%.
-
Global equity markets reached record levels during the period, withstanding considerable volatility amid tariffs, geopolitical conflict and high levels of uncertainty. A new geopolitical event distressed markets at the end of the period as US and Israeli forces launched strikes against Iran, disrupting Mideast oil and natural gas exports. During the period, a pro-growth tax and spending bill was signed into law in the US, while in Europe, renewed focus on defense and infrastructure spending brightened the economic outlook. In Japan, the election of a pro-growth prime minister sent stocks to new highs prior to the conflict in Iran. Optimism over artificial intelligence remained high.
-
Considerable progress was made in trade talks between the US and many major trading partners, with a fragile truce between the US and China extended through late 2026. While the US Supreme Court struck down part of the Trump administration’s tariff strategy, the administration began deploying other authorities to largely replace the ones that were ruled unconstitutional.
-
Early in the period, moderating inflation pressures allowed many global central banks to ease monetary policy. Amid a difficult policymaking environment and slower job growth, the Federal Reserve resumed easing policy in September and delivered quarter-point rate cuts in October and December before pausing.
-
In fixed income markets, previously range-bound global bond yields spiked following the onset of the Middle East conflict, as energy-driven inflation fears appeared to have rattled bond investors. US rate volatility (as measured by the Merrill Lynch Option Volatility Estimate (MOVE) Index) similarly rose from intra-period lows, reflecting uncertainty around the scope and duration of the conflict and its implications for global growth. However, volatility later retracted as the risk of a broader regional military escalation appeared less likely. Global credit spreads widened only modestly before stabilizing near prior levels, supported by strong demand and resilient underlying fundamentals.
-
Top contributors to performance relative to the Russell Midcap® Index:
-
Security selection within the consumer discretionary, energy, real estate, and financials sectors strengthened the fund's relative performance.
-
-
Top detractors from performance relative to the Russell Midcap® Index:
-
Security selection within the industrials, materials, and communication services sectors held back relative performance.
-
FUND PERFORMANCE
The fund’s past performance is not a good predictor of the fund’s future performance. The graph and table below do not reflect the deduction of taxes that a shareholder would pay on fund distributions or the redemption of fund shares. The graph and table below assume reinvestment of dividends and capital gain distributions.
Growth of a Hypothetical $10,000 Investment*
This graph shows the performance of a hypothetical $10,000 investment in Class R4 over a ten year period or since inception, if shorter, in comparison to (i) a broad measure of market performance and (ii) an additional index that MFS believes more closely reflects the market segments in which the fund invests.
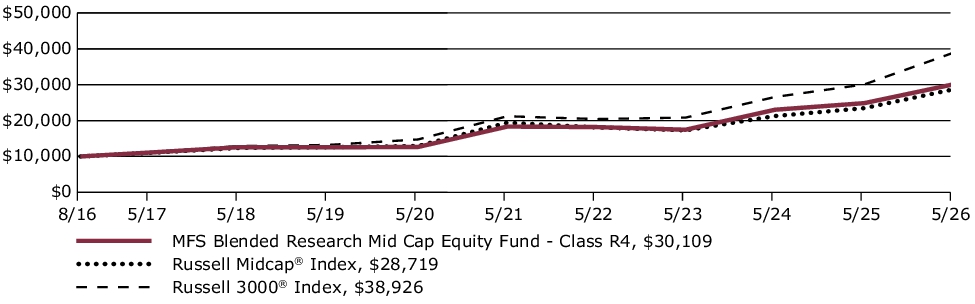
Average Annual Total Returns through 5/31/26
This table shows the average annual total returns of the class of shares noted for the periods shown, both with (if any) and without sales charges. It also shows the average annual total returns of (i) a broad measure of market performance and (ii) an additional index that MFS believes more closely reflects the market segments in which the fund invests, over the same periods.
| Share Class | 1-yr | 5-yr | Life* |
| R4 without sales charge | 21.11% | 10.44% | 11.92% |
| Comparative Benchmark(s) | |||
| Russell 3000® Index ∆ | 29.45% | 12.92% | 14.89% |
| Russell Midcap® Index ∆ | 22.37% | 8.15% | 11.38% |
|
*
|
For the period from the commencement of the class's investment operations, August 19, 2016 through May 31, 2026.
|
|
∆
|
Source: FactSet Research Systems Inc.
|
Visit mfs.com/perf/r4 for more recent performance information.
FUND STATISTICS AS OF 5/31/26
| Net Assets ($): | 2,936,785,790 | Total Management Fee ($)#: | 10,501,441 | |
| Total Number of Holdings: | 160 | Portfolio Turnover Rate (%): | 51 |
# Includes the effect of any management fee waivers, if applicable.
Where the fund holds derivatives, they are not included in the total number of portfolio holdings.
PORTFOLIO COMPOSITION (BASED ON TOTAL INVESTMENTS AS OF 5/31/26)
Portfolio structure
| Equities | 99.6% |
| Money Market Funds | 0.4% |
Equity sectors
| Information Technology | 17.7% |
| Industrials | 16.9% |
| Financials | 13.8% |
| Consumer Discretionary | 11.9% |
| Health Care | 10.2% |
| Energy | 6.4% |
| Real Estate | 6.4% |
| Utilities | 6.2% |
| Materials | 3.9% |
| Communication Services | 3.5% |
| Consumer Staples | 2.7% |
Top ten holdings
| Western Digital Corp. | 3.0% |
| Flex Ltd. | 2.7% |
| Valero Energy Corp. | 2.0% |
| Ciena Corp. | 1.9% |
| Viking Holdings Ltd. | 1.9% |
| Okta, Inc. | 1.8% |
| Northern Trust Corp. | 1.8% |
| Aramark | 1.7% |
| Wabtec Corp. | 1.6% |
| Edison International | 1.6% |
MFS uses the Global Industry Classification Standard (GICS®) for sector/industry reporting. MFS has applied its own internal sector/industry classification methodology for equity securities and non-equity securities that are unclassified by GICS.
Top ten holdings
| Western Digital Corp. | 3.0% |
| Flex Ltd. | 2.7% |
| Valero Energy Corp. | 2.0% |
| Ciena Corp. | 1.9% |
| Viking Holdings Ltd. | 1.9% |
| Okta, Inc. | 1.8% |
| Northern Trust Corp. | 1.8% |
| Aramark | 1.7% |
| Wabtec Corp. | 1.6% |
| Edison International | 1.6% |
FUND EXPENSES
What were the fund costs for the last year?
| (based on a hypothetical $10,000 investment) | ||
| Class Name | Costs of a $10,000 investment | Costs paid as a percentage of a $10,000 investment |
| R3 | $93 | 0.84% |
MANAGEMENT'S DISCUSSION OF FUND PERFORMANCE
-
For the twelve months ended May 31, 2026, Class R3 shares of the MFS Blended Research Mid Cap Equity Fund (fund) provided a total return of 20.86%, at net asset value. This compares with a return of 29.45% for the fund’s benchmark, the Russell 3000® Index. The fund's other benchmark, the Russell Midcap® Index, generated a return of 22.37%.
-
Global equity markets reached record levels during the period, withstanding considerable volatility amid tariffs, geopolitical conflict and high levels of uncertainty. A new geopolitical event distressed markets at the end of the period as US and Israeli forces launched strikes against Iran, disrupting Mideast oil and natural gas exports. During the period, a pro-growth tax and spending bill was signed into law in the US, while in Europe, renewed focus on defense and infrastructure spending brightened the economic outlook. In Japan, the election of a pro-growth prime minister sent stocks to new highs prior to the conflict in Iran. Optimism over artificial intelligence remained high.
-
Considerable progress was made in trade talks between the US and many major trading partners, with a fragile truce between the US and China extended through late 2026. While the US Supreme Court struck down part of the Trump administration’s tariff strategy, the administration began deploying other authorities to largely replace the ones that were ruled unconstitutional.
-
Early in the period, moderating inflation pressures allowed many global central banks to ease monetary policy. Amid a difficult policymaking environment and slower job growth, the Federal Reserve resumed easing policy in September and delivered quarter-point rate cuts in October and December before pausing.
-
In fixed income markets, previously range-bound global bond yields spiked following the onset of the Middle East conflict, as energy-driven inflation fears appeared to have rattled bond investors. US rate volatility (as measured by the Merrill Lynch Option Volatility Estimate (MOVE) Index) similarly rose from intra-period lows, reflecting uncertainty around the scope and duration of the conflict and its implications for global growth. However, volatility later retracted as the risk of a broader regional military escalation appeared less likely. Global credit spreads widened only modestly before stabilizing near prior levels, supported by strong demand and resilient underlying fundamentals.
-
Top contributors to performance relative to the Russell Midcap® Index:
-
Security selection within the consumer discretionary, energy, real estate, and financials sectors strengthened the fund's relative performance.
-
-
Top detractors from performance relative to the Russell Midcap® Index:
-
Security selection within the industrials, materials, and communication services sectors held back relative performance.
-
FUND PERFORMANCE
The fund’s past performance is not a good predictor of the fund’s future performance. The graph and table below do not reflect the deduction of taxes that a shareholder would pay on fund distributions or the redemption of fund shares. The graph and table below assume reinvestment of dividends and capital gain distributions.
Growth of a Hypothetical $10,000 Investment*
This graph shows the performance of a hypothetical $10,000 investment in Class R3 over a ten year period or since inception, if shorter, in comparison to (i) a broad measure of market performance and (ii) an additional index that MFS believes more closely reflects the market segments in which the fund invests.
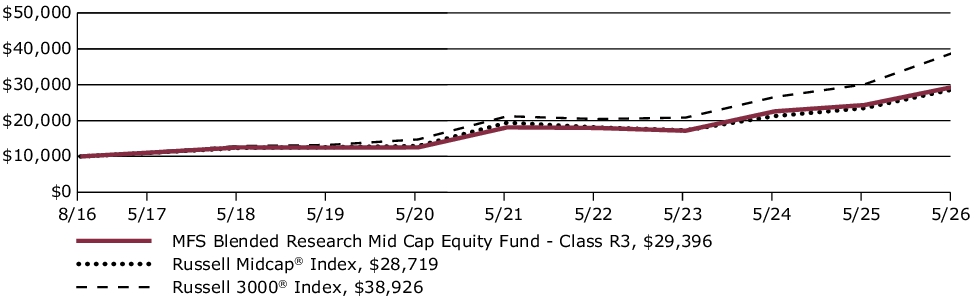
Average Annual Total Returns through 5/31/26
This table shows the average annual total returns of the class of shares noted for the periods shown, both with (if any) and without sales charges. It also shows the average annual total returns of (i) a broad measure of market performance and (ii) an additional index that MFS believes more closely reflects the market segments in which the fund invests, over the same periods.
| Share Class | 1-yr | 5-yr | Life* |
| R3 without sales charge | 20.86% | 10.17% | 11.65% |
| Comparative Benchmark(s) | |||
| Russell 3000® Index ∆ | 29.45% | 12.92% | 14.89% |
| Russell Midcap® Index ∆ | 22.37% | 8.15% | 11.38% |
|
*
|
For the period from the commencement of the class's investment operations, August 19, 2016 through May 31, 2026.
|
|
∆
|
Source: FactSet Research Systems Inc.
|
Visit mfs.com/perf/r3 for more recent performance information.
FUND STATISTICS AS OF 5/31/26
| Net Assets ($): | 2,936,785,790 | Total Management Fee ($)#: | 10,501,441 | |
| Total Number of Holdings: | 160 | Portfolio Turnover Rate (%): | 51 |
# Includes the effect of any management fee waivers, if applicable.
Where the fund holds derivatives, they are not included in the total number of portfolio holdings.
PORTFOLIO COMPOSITION (BASED ON TOTAL INVESTMENTS AS OF 5/31/26)
Portfolio structure
| Equities | 99.6% |
| Money Market Funds | 0.4% |
Equity sectors
| Information Technology | 17.7% |
| Industrials | 16.9% |
| Financials | 13.8% |
| Consumer Discretionary | 11.9% |
| Health Care | 10.2% |
| Energy | 6.4% |
| Real Estate | 6.4% |
| Utilities | 6.2% |
| Materials | 3.9% |
| Communication Services | 3.5% |
| Consumer Staples | 2.7% |
Top ten holdings
| Western Digital Corp. | 3.0% |
| Flex Ltd. | 2.7% |
| Valero Energy Corp. | 2.0% |
| Ciena Corp. | 1.9% |
| Viking Holdings Ltd. | 1.9% |
| Okta, Inc. | 1.8% |
| Northern Trust Corp. | 1.8% |
| Aramark | 1.7% |
| Wabtec Corp. | 1.6% |
| Edison International | 1.6% |
MFS uses the Global Industry Classification Standard (GICS®) for sector/industry reporting. MFS has applied its own internal sector/industry classification methodology for equity securities and non-equity securities that are unclassified by GICS.
Top ten holdings
| Western Digital Corp. | 3.0% |
| Flex Ltd. | 2.7% |
| Valero Energy Corp. | 2.0% |
| Ciena Corp. | 1.9% |
| Viking Holdings Ltd. | 1.9% |
| Okta, Inc. | 1.8% |
| Northern Trust Corp. | 1.8% |
| Aramark | 1.7% |
| Wabtec Corp. | 1.6% |
| Edison International | 1.6% |
FUND EXPENSES
What were the fund costs for the last year?
| (based on a hypothetical $10,000 investment) | ||
| Class Name | Costs of a $10,000 investment | Costs paid as a percentage of a $10,000 investment |
| R2 | $120 | 1.09% |
MANAGEMENT'S DISCUSSION OF FUND PERFORMANCE
-
For the twelve months ended May 31, 2026, Class R2 shares of the MFS Blended Research Mid Cap Equity Fund (fund) provided a total return of 20.44%, at net asset value. This compares with a return of 29.45% for the fund’s benchmark, the Russell 3000® Index. The fund's other benchmark, the Russell Midcap® Index, generated a return of 22.37%.
-
Global equity markets reached record levels during the period, withstanding considerable volatility amid tariffs, geopolitical conflict and high levels of uncertainty. A new geopolitical event distressed markets at the end of the period as US and Israeli forces launched strikes against Iran, disrupting Mideast oil and natural gas exports. During the period, a pro-growth tax and spending bill was signed into law in the US, while in Europe, renewed focus on defense and infrastructure spending brightened the economic outlook. In Japan, the election of a pro-growth prime minister sent stocks to new highs prior to the conflict in Iran. Optimism over artificial intelligence remained high.
-
Considerable progress was made in trade talks between the US and many major trading partners, with a fragile truce between the US and China extended through late 2026. While the US Supreme Court struck down part of the Trump administration’s tariff strategy, the administration began deploying other authorities to largely replace the ones that were ruled unconstitutional.
-
Early in the period, moderating inflation pressures allowed many global central banks to ease monetary policy. Amid a difficult policymaking environment and slower job growth, the Federal Reserve resumed easing policy in September and delivered quarter-point rate cuts in October and December before pausing.
-
In fixed income markets, previously range-bound global bond yields spiked following the onset of the Middle East conflict, as energy-driven inflation fears appeared to have rattled bond investors. US rate volatility (as measured by the Merrill Lynch Option Volatility Estimate (MOVE) Index) similarly rose from intra-period lows, reflecting uncertainty around the scope and duration of the conflict and its implications for global growth. However, volatility later retracted as the risk of a broader regional military escalation appeared less likely. Global credit spreads widened only modestly before stabilizing near prior levels, supported by strong demand and resilient underlying fundamentals.
-
Top contributors to performance relative to the Russell Midcap® Index:
-
Security selection within the consumer discretionary, energy, real estate, and financials sectors strengthened the fund's relative performance.
-
-
Top detractors from performance relative to the Russell Midcap® Index:
-
Security selection within the industrials, materials, and communication services sectors held back relative performance.
-
FUND PERFORMANCE
The fund’s past performance is not a good predictor of the fund’s future performance. The graph and table below do not reflect the deduction of taxes that a shareholder would pay on fund distributions or the redemption of fund shares. The graph and table below assume reinvestment of dividends and capital gain distributions.
Growth of a Hypothetical $10,000 Investment*
This graph shows the performance of a hypothetical $10,000 investment in Class R2 over a ten year period or since inception, if shorter, in comparison to (i) a broad measure of market performance and (ii) an additional index that MFS believes more closely reflects the market segments in which the fund invests.
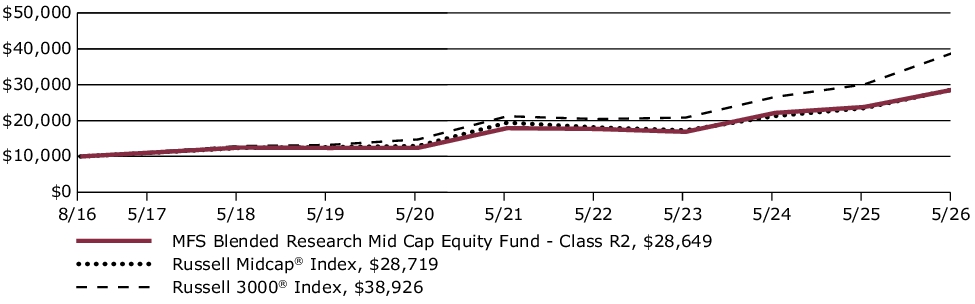
Average Annual Total Returns through 5/31/26
This table shows the average annual total returns of the class of shares noted for the periods shown, both with (if any) and without sales charges. It also shows the average annual total returns of (i) a broad measure of market performance and (ii) an additional index that MFS believes more closely reflects the market segments in which the fund invests, over the same periods.
| Share Class | 1-yr | 5-yr | Life* |
| R2 without sales charge | 20.44% | 9.87% | 11.36% |
| Comparative Benchmark(s) | |||
| Russell 3000® Index ∆ | 29.45% | 12.92% | 14.89% |
| Russell Midcap® Index ∆ | 22.37% | 8.15% | 11.38% |
|
*
|
For the period from the commencement of the class's investment operations, August 19, 2016 through May 31, 2026.
|
|
∆
|
Source: FactSet Research Systems Inc.
|
Visit mfs.com/perf/r2 for more recent performance information.
FUND STATISTICS AS OF 5/31/26
| Net Assets ($): | 2,936,785,790 | Total Management Fee ($)#: | 10,501,441 | |
| Total Number of Holdings: | 160 | Portfolio Turnover Rate (%): | 51 |
# Includes the effect of any management fee waivers, if applicable.
Where the fund holds derivatives, they are not included in the total number of portfolio holdings.
PORTFOLIO COMPOSITION (BASED ON TOTAL INVESTMENTS AS OF 5/31/26)
Portfolio structure
| Equities | 99.6% |
| Money Market Funds | 0.4% |
Equity sectors
| Information Technology | 17.7% |
| Industrials | 16.9% |
| Financials | 13.8% |
| Consumer Discretionary | 11.9% |
| Health Care | 10.2% |
| Energy | 6.4% |
| Real Estate | 6.4% |
| Utilities | 6.2% |
| Materials | 3.9% |
| Communication Services | 3.5% |
| Consumer Staples | 2.7% |
Top ten holdings
| Western Digital Corp. | 3.0% |
| Flex Ltd. | 2.7% |
| Valero Energy Corp. | 2.0% |
| Ciena Corp. | 1.9% |
| Viking Holdings Ltd. | 1.9% |
| Okta, Inc. | 1.8% |
| Northern Trust Corp. | 1.8% |
| Aramark | 1.7% |
| Wabtec Corp. | 1.6% |
| Edison International | 1.6% |
MFS uses the Global Industry Classification Standard (GICS®) for sector/industry reporting. MFS has applied its own internal sector/industry classification methodology for equity securities and non-equity securities that are unclassified by GICS.
Top ten holdings
| Western Digital Corp. | 3.0% |
| Flex Ltd. | 2.7% |
| Valero Energy Corp. | 2.0% |
| Ciena Corp. | 1.9% |
| Viking Holdings Ltd. | 1.9% |
| Okta, Inc. | 1.8% |
| Northern Trust Corp. | 1.8% |
| Aramark | 1.7% |
| Wabtec Corp. | 1.6% |
| Edison International | 1.6% |
FUND EXPENSES
What were the fund costs for the last year?
| (based on a hypothetical $10,000 investment) | ||
| Class Name | Costs of a $10,000 investment | Costs paid as a percentage of a $10,000 investment |
| R1 | $93 | 0.84% |
MANAGEMENT'S DISCUSSION OF FUND PERFORMANCE
-
For the twelve months ended May 31, 2026, Class R1 shares of the MFS Blended Research Mid Cap Equity Fund (fund) provided a total return of 20.81%, at net asset value. This compares with a return of 29.45% for the fund’s benchmark, the Russell 3000® Index. The fund's other benchmark, the Russell Midcap® Index, generated a return of 22.37%.
-
Global equity markets reached record levels during the period, withstanding considerable volatility amid tariffs, geopolitical conflict and high levels of uncertainty. A new geopolitical event distressed markets at the end of the period as US and Israeli forces launched strikes against Iran, disrupting Mideast oil and natural gas exports. During the period, a pro-growth tax and spending bill was signed into law in the US, while in Europe, renewed focus on defense and infrastructure spending brightened the economic outlook. In Japan, the election of a pro-growth prime minister sent stocks to new highs prior to the conflict in Iran. Optimism over artificial intelligence remained high.
-
Considerable progress was made in trade talks between the US and many major trading partners, with a fragile truce between the US and China extended through late 2026. While the US Supreme Court struck down part of the Trump administration’s tariff strategy, the administration began deploying other authorities to largely replace the ones that were ruled unconstitutional.
-
Early in the period, moderating inflation pressures allowed many global central banks to ease monetary policy. Amid a difficult policymaking environment and slower job growth, the Federal Reserve resumed easing policy in September and delivered quarter-point rate cuts in October and December before pausing.
-
In fixed income markets, previously range-bound global bond yields spiked following the onset of the Middle East conflict, as energy-driven inflation fears appeared to have rattled bond investors. US rate volatility (as measured by the Merrill Lynch Option Volatility Estimate (MOVE) Index) similarly rose from intra-period lows, reflecting uncertainty around the scope and duration of the conflict and its implications for global growth. However, volatility later retracted as the risk of a broader regional military escalation appeared less likely. Global credit spreads widened only modestly before stabilizing near prior levels, supported by strong demand and resilient underlying fundamentals.
-
Top contributors to performance relative to the Russell Midcap® Index:
-
Security selection within the consumer discretionary, energy, real estate, and financials sectors strengthened the fund's relative performance.
-
-
Top detractors from performance relative to the Russell Midcap® Index:
-
Security selection within the industrials, materials, and communication services sectors held back relative performance.
-
FUND PERFORMANCE
The fund’s past performance is not a good predictor of the fund’s future performance. The graph and table below do not reflect the deduction of taxes that a shareholder would pay on fund distributions or the redemption of fund shares. The graph and table below assume reinvestment of dividends and capital gain distributions.
Growth of a Hypothetical $10,000 Investment*
This graph shows the performance of a hypothetical $10,000 investment in Class R1 over a ten year period or since inception, if shorter, in comparison to (i) a broad measure of market performance and (ii) an additional index that MFS believes more closely reflects the market segments in which the fund invests.
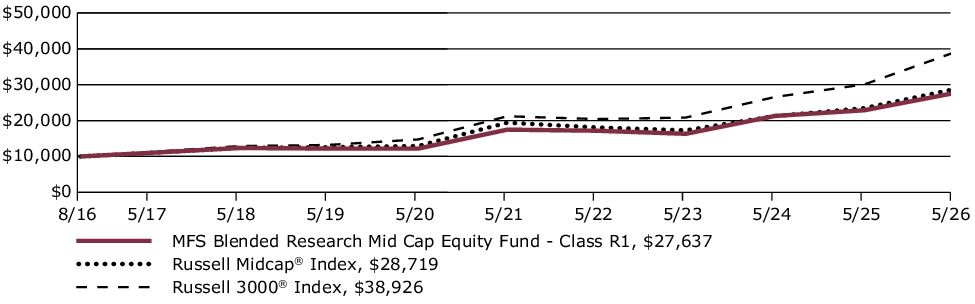
Average Annual Total Returns through 5/31/26
This table shows the average annual total returns of the class of shares noted for the periods shown, both with (if any) and without sales charges. It also shows the average annual total returns of (i) a broad measure of market performance and (ii) an additional index that MFS believes more closely reflects the market segments in which the fund invests, over the same periods.
| Share Class | 1-yr | 5-yr | Life* |
| R1 without sales charge | 20.81% | 9.60% | 10.95% |
| Comparative Benchmark(s) | |||
| Russell 3000® Index ∆ | 29.45% | 12.92% | 14.89% |
| Russell Midcap® Index ∆ | 22.37% | 8.15% | 11.38% |
|
*
|
For the period from the commencement of the class's investment operations, August 19, 2016 through May 31, 2026.
|
|
∆
|
Source: FactSet Research Systems Inc.
|
Visit mfs.com/perf/r1 for more recent performance information.
FUND STATISTICS AS OF 5/31/26
| Net Assets ($): | 2,936,785,790 | Total Management Fee ($)#: | 10,501,441 | |
| Total Number of Holdings: | 160 | Portfolio Turnover Rate (%): | 51 |
# Includes the effect of any management fee waivers, if applicable.
Where the fund holds derivatives, they are not included in the total number of portfolio holdings.
PORTFOLIO COMPOSITION (BASED ON TOTAL INVESTMENTS AS OF 5/31/26)
Portfolio structure
| Equities | 99.6% |
| Money Market Funds | 0.4% |
Equity sectors
| Information Technology | 17.7% |
| Industrials | 16.9% |
| Financials | 13.8% |
| Consumer Discretionary | 11.9% |
| Health Care | 10.2% |
| Energy | 6.4% |
| Real Estate | 6.4% |
| Utilities | 6.2% |
| Materials | 3.9% |
| Communication Services | 3.5% |
| Consumer Staples | 2.7% |
Top ten holdings
| Western Digital Corp. | 3.0% |
| Flex Ltd. | 2.7% |
| Valero Energy Corp. | 2.0% |
| Ciena Corp. | 1.9% |
| Viking Holdings Ltd. | 1.9% |
| Okta, Inc. | 1.8% |
| Northern Trust Corp. | 1.8% |
| Aramark | 1.7% |
| Wabtec Corp. | 1.6% |
| Edison International | 1.6% |
MFS uses the Global Industry Classification Standard (GICS®) for sector/industry reporting. MFS has applied its own internal sector/industry classification methodology for equity securities and non-equity securities that are unclassified by GICS.
Top ten holdings
| Western Digital Corp. | 3.0% |
| Flex Ltd. | 2.7% |
| Valero Energy Corp. | 2.0% |
| Ciena Corp. | 1.9% |
| Viking Holdings Ltd. | 1.9% |
| Okta, Inc. | 1.8% |
| Northern Trust Corp. | 1.8% |
| Aramark | 1.7% |
| Wabtec Corp. | 1.6% |
| Edison International | 1.6% |
FUND EXPENSES
What were the fund costs for the last year?
| (based on a hypothetical $10,000 investment) | ||
| Class Name | Costs of a $10,000 investment | Costs paid as a percentage of a $10,000 investment |
| I | $65 | 0.59% |
MANAGEMENT'S DISCUSSION OF FUND PERFORMANCE
-
For the twelve months ended May 31, 2026, Class I shares of the MFS Blended Research Mid Cap Equity Fund (fund) provided a total return of 21.12%, at net asset value. This compares with a return of 29.45% for the fund’s benchmark, the Russell 3000® Index. The fund's other benchmark, the Russell Midcap® Index, generated a return of 22.37%.
-
Global equity markets reached record levels during the period, withstanding considerable volatility amid tariffs, geopolitical conflict and high levels of uncertainty. A new geopolitical event distressed markets at the end of the period as US and Israeli forces launched strikes against Iran, disrupting Mideast oil and natural gas exports. During the period, a pro-growth tax and spending bill was signed into law in the US, while in Europe, renewed focus on defense and infrastructure spending brightened the economic outlook. In Japan, the election of a pro-growth prime minister sent stocks to new highs prior to the conflict in Iran. Optimism over artificial intelligence remained high.
-
Considerable progress was made in trade talks between the US and many major trading partners, with a fragile truce between the US and China extended through late 2026. While the US Supreme Court struck down part of the Trump administration’s tariff strategy, the administration began deploying other authorities to largely replace the ones that were ruled unconstitutional.
-
Early in the period, moderating inflation pressures allowed many global central banks to ease monetary policy. Amid a difficult policymaking environment and slower job growth, the Federal Reserve resumed easing policy in September and delivered quarter-point rate cuts in October and December before pausing.
-
In fixed income markets, previously range-bound global bond yields spiked following the onset of the Middle East conflict, as energy-driven inflation fears appeared to have rattled bond investors. US rate volatility (as measured by the Merrill Lynch Option Volatility Estimate (MOVE) Index) similarly rose from intra-period lows, reflecting uncertainty around the scope and duration of the conflict and its implications for global growth. However, volatility later retracted as the risk of a broader regional military escalation appeared less likely. Global credit spreads widened only modestly before stabilizing near prior levels, supported by strong demand and resilient underlying fundamentals.
-
Top contributors to performance relative to the Russell Midcap® Index:
-
Security selection within the consumer discretionary, energy, real estate, and financials sectors strengthened the fund's relative performance.
-
-
Top detractors from performance relative to the Russell Midcap® Index:
-
Security selection within the industrials, materials, and communication services sectors held back relative performance.
-
FUND PERFORMANCE
The fund’s past performance is not a good predictor of the fund’s future performance. The graph and table below do not reflect the deduction of taxes that a shareholder would pay on fund distributions or the redemption of fund shares. The graph and table below assume reinvestment of dividends and capital gain distributions.
Growth of a Hypothetical $10,000 Investment*
This graph shows the performance of a hypothetical $10,000 investment in Class I over a ten year period or since inception, if shorter, in comparison to (i) a broad measure of market performance and (ii) an additional index that MFS believes more closely reflects the market segments in which the fund invests.
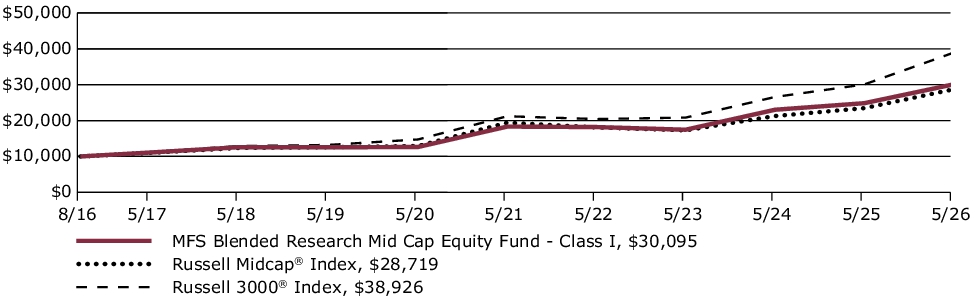
Average Annual Total Returns through 5/31/26
This table shows the average annual total returns of the class of shares noted for the periods shown, both with (if any) and without sales charges. It also shows the average annual total returns of (i) a broad measure of market performance and (ii) an additional index that MFS believes more closely reflects the market segments in which the fund invests, over the same periods.
| Share Class | 1-yr | 5-yr | Life* |
| I without sales charge | 21.12% | 10.43% | 11.92% |
| Comparative Benchmark(s) | |||
| Russell 3000® Index ∆ | 29.45% | 12.92% | 14.89% |
| Russell Midcap® Index ∆ | 22.37% | 8.15% | 11.38% |
|
*
|
For the period from the commencement of the class's investment operations, August 19, 2016 through May 31, 2026.
|
|
∆
|
Source: FactSet Research Systems Inc.
|
Visit mfs.com/perf/i for more recent performance information.
FUND STATISTICS AS OF 5/31/26
| Net Assets ($): | 2,936,785,790 | Total Management Fee ($)#: | 10,501,441 | |
| Total Number of Holdings: | 160 | Portfolio Turnover Rate (%): | 51 |
# Includes the effect of any management fee waivers, if applicable.
Where the fund holds derivatives, they are not included in the total number of portfolio holdings.
PORTFOLIO COMPOSITION (BASED ON TOTAL INVESTMENTS AS OF 5/31/26)
Portfolio structure
| Equities | 99.6% |
| Money Market Funds | 0.4% |
Equity sectors
| Information Technology | 17.7% |
| Industrials | 16.9% |
| Financials | 13.8% |
| Consumer Discretionary | 11.9% |
| Health Care | 10.2% |
| Energy | 6.4% |
| Real Estate | 6.4% |
| Utilities | 6.2% |
| Materials | 3.9% |
| Communication Services | 3.5% |
| Consumer Staples | 2.7% |
Top ten holdings
| Western Digital Corp. | 3.0% |
| Flex Ltd. | 2.7% |
| Valero Energy Corp. | 2.0% |
| Ciena Corp. | 1.9% |
| Viking Holdings Ltd. | 1.9% |
| Okta, Inc. | 1.8% |
| Northern Trust Corp. | 1.8% |
| Aramark | 1.7% |
| Wabtec Corp. | 1.6% |
| Edison International | 1.6% |
MFS uses the Global Industry Classification Standard (GICS®) for sector/industry reporting. MFS has applied its own internal sector/industry classification methodology for equity securities and non-equity securities that are unclassified by GICS.
Top ten holdings
| Western Digital Corp. | 3.0% |
| Flex Ltd. | 2.7% |
| Valero Energy Corp. | 2.0% |
| Ciena Corp. | 1.9% |
| Viking Holdings Ltd. | 1.9% |
| Okta, Inc. | 1.8% |
| Northern Trust Corp. | 1.8% |
| Aramark | 1.7% |
| Wabtec Corp. | 1.6% |
| Edison International | 1.6% |
FUND EXPENSES
What were the fund costs for the last year?
| (based on a hypothetical $10,000 investment) | ||
| Class Name | Costs of a $10,000 investment | Costs paid as a percentage of a $10,000 investment |
| C | $175 | 1.59% |
MANAGEMENT'S DISCUSSION OF FUND PERFORMANCE
-
For the twelve months ended May 31, 2026, Class C shares of the MFS Blended Research Mid Cap Equity Fund (fund) provided a total return of 19.92%, at net asset value. This compares with a return of 29.45% for the fund’s benchmark, the Russell 3000® Index. The fund's other benchmark, the Russell Midcap® Index, generated a return of 22.37%.
-
Global equity markets reached record levels during the period, withstanding considerable volatility amid tariffs, geopolitical conflict and high levels of uncertainty. A new geopolitical event distressed markets at the end of the period as US and Israeli forces launched strikes against Iran, disrupting Mideast oil and natural gas exports. During the period, a pro-growth tax and spending bill was signed into law in the US, while in Europe, renewed focus on defense and infrastructure spending brightened the economic outlook. In Japan, the election of a pro-growth prime minister sent stocks to new highs prior to the conflict in Iran. Optimism over artificial intelligence remained high.
-
Considerable progress was made in trade talks between the US and many major trading partners, with a fragile truce between the US and China extended through late 2026. While the US Supreme Court struck down part of the Trump administration’s tariff strategy, the administration began deploying other authorities to largely replace the ones that were ruled unconstitutional.
-
Early in the period, moderating inflation pressures allowed many global central banks to ease monetary policy. Amid a difficult policymaking environment and slower job growth, the Federal Reserve resumed easing policy in September and delivered quarter-point rate cuts in October and December before pausing.
-
In fixed income markets, previously range-bound global bond yields spiked following the onset of the Middle East conflict, as energy-driven inflation fears appeared to have rattled bond investors. US rate volatility (as measured by the Merrill Lynch Option Volatility Estimate (MOVE) Index) similarly rose from intra-period lows, reflecting uncertainty around the scope and duration of the conflict and its implications for global growth. However, volatility later retracted as the risk of a broader regional military escalation appeared less likely. Global credit spreads widened only modestly before stabilizing near prior levels, supported by strong demand and resilient underlying fundamentals.
-
Top contributors to performance relative to the Russell Midcap® Index:
-
Security selection within the consumer discretionary, energy, real estate, and financials sectors strengthened the fund's relative performance.
-
-
Top detractors from performance relative to the Russell Midcap® Index:
-
Security selection within the industrials, materials, and communication services sectors held back relative performance.
-
FUND PERFORMANCE
The fund’s past performance is not a good predictor of the fund’s future performance. The graph and table below do not reflect the deduction of taxes that a shareholder would pay on fund distributions or the redemption of fund shares. The graph and table below assume reinvestment of dividends and capital gain distributions.
Growth of a Hypothetical $10,000 Investment*
This graph shows the performance of a hypothetical $10,000 investment in Class C over a ten year period or since inception, if shorter, in comparison to (i) a broad measure of market performance and (ii) an additional index that MFS believes more closely reflects the market segments in which the fund invests.
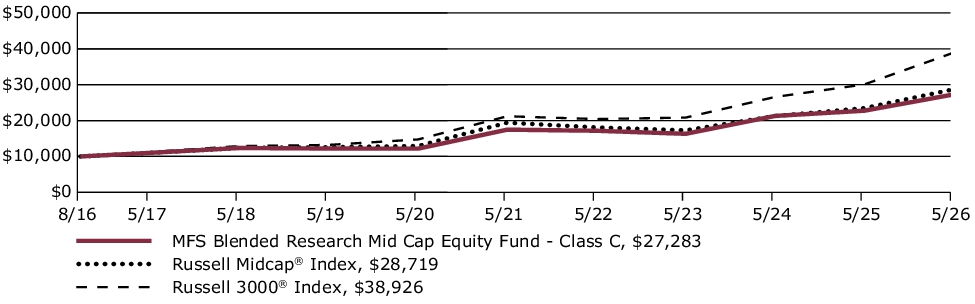
Average Annual Total Returns through 5/31/26
This table shows the average annual total returns of the class of shares noted for the periods shown, both with (if any) and without sales charges. It also shows the average annual total returns of (i) a broad measure of market performance and (ii) an additional index that MFS believes more closely reflects the market segments in which the fund invests, over the same periods.
| Share Class | 1-yr | 5-yr | Life* |
| C without sales charge | 19.92% | 9.33% | 10.80% |
| C with CDSC (1% for 12 months)× | 18.92% | 9.33% | 10.80% |
| Comparative Benchmark(s) | |||
| Russell 3000® Index ∆ | 29.45% | 12.92% | 14.89% |
| Russell Midcap® Index ∆ | 22.37% | 8.15% | 11.38% |
|
*
|
For the period from the commencement of the class's investment operations, August 19, 2016 through May 31, 2026.
|
|
∆
|
Source: FactSet Research Systems Inc.
|
|
×
|
Assuming redemption at the end of the applicable period.
|
Visit mfs.com/perf/c for more recent performance information.
FUND STATISTICS AS OF 5/31/26
| Net Assets ($): | 2,936,785,790 | Total Management Fee ($)#: | 10,501,441 | |
| Total Number of Holdings: | 160 | Portfolio Turnover Rate (%): | 51 |
# Includes the effect of any management fee waivers, if applicable.
Where the fund holds derivatives, they are not included in the total number of portfolio holdings.
PORTFOLIO COMPOSITION (BASED ON TOTAL INVESTMENTS AS OF 5/31/26)
Portfolio structure
| Equities | 99.6% |
| Money Market Funds | 0.4% |
Equity sectors
| Information Technology | 17.7% |
| Industrials | 16.9% |
| Financials | 13.8% |
| Consumer Discretionary | 11.9% |
| Health Care | 10.2% |
| Energy | 6.4% |
| Real Estate | 6.4% |
| Utilities | 6.2% |
| Materials | 3.9% |
| Communication Services | 3.5% |
| Consumer Staples | 2.7% |
Top ten holdings
| Western Digital Corp. | 3.0% |
| Flex Ltd. | 2.7% |
| Valero Energy Corp. | 2.0% |
| Ciena Corp. | 1.9% |
| Viking Holdings Ltd. | 1.9% |
| Okta, Inc. | 1.8% |
| Northern Trust Corp. | 1.8% |
| Aramark | 1.7% |
| Wabtec Corp. | 1.6% |
| Edison International | 1.6% |
MFS uses the Global Industry Classification Standard (GICS®) for sector/industry reporting. MFS has applied its own internal sector/industry classification methodology for equity securities and non-equity securities that are unclassified by GICS.
Top ten holdings
| Western Digital Corp. | 3.0% |
| Flex Ltd. | 2.7% |
| Valero Energy Corp. | 2.0% |
| Ciena Corp. | 1.9% |
| Viking Holdings Ltd. | 1.9% |
| Okta, Inc. | 1.8% |
| Northern Trust Corp. | 1.8% |
| Aramark | 1.7% |
| Wabtec Corp. | 1.6% |
| Edison International | 1.6% |
FUND EXPENSES
What were the fund costs for the last year?
| (based on a hypothetical $10,000 investment) | ||
| Class Name | Costs of a $10,000 investment | Costs paid as a percentage of a $10,000 investment |
| B | $175 | 1.59% |
MANAGEMENT'S DISCUSSION OF FUND PERFORMANCE
-
For the twelve months ended May 31, 2026, Class B shares of the MFS Blended Research Mid Cap Equity Fund (fund) provided a total return of 19.92%, at net asset value. This compares with a return of 29.45% for the fund’s benchmark, the Russell 3000® Index. The fund's other benchmark, the Russell Midcap® Index, generated a return of 22.37%.
-
Global equity markets reached record levels during the period, withstanding considerable volatility amid tariffs, geopolitical conflict and high levels of uncertainty. A new geopolitical event distressed markets at the end of the period as US and Israeli forces launched strikes against Iran, disrupting Mideast oil and natural gas exports. During the period, a pro-growth tax and spending bill was signed into law in the US, while in Europe, renewed focus on defense and infrastructure spending brightened the economic outlook. In Japan, the election of a pro-growth prime minister sent stocks to new highs prior to the conflict in Iran. Optimism over artificial intelligence remained high.
-
Considerable progress was made in trade talks between the US and many major trading partners, with a fragile truce between the US and China extended through late 2026. While the US Supreme Court struck down part of the Trump administration’s tariff strategy, the administration began deploying other authorities to largely replace the ones that were ruled unconstitutional.
-
Early in the period, moderating inflation pressures allowed many global central banks to ease monetary policy. Amid a difficult policymaking environment and slower job growth, the Federal Reserve resumed easing policy in September and delivered quarter-point rate cuts in October and December before pausing.
-
In fixed income markets, previously range-bound global bond yields spiked following the onset of the Middle East conflict, as energy-driven inflation fears appeared to have rattled bond investors. US rate volatility (as measured by the Merrill Lynch Option Volatility Estimate (MOVE) Index) similarly rose from intra-period lows, reflecting uncertainty around the scope and duration of the conflict and its implications for global growth. However, volatility later retracted as the risk of a broader regional military escalation appeared less likely. Global credit spreads widened only modestly before stabilizing near prior levels, supported by strong demand and resilient underlying fundamentals.
-
Top contributors to performance relative to the Russell Midcap® Index:
-
Security selection within the consumer discretionary, energy, real estate, and financials sectors strengthened the fund's relative performance.
-
-
Top detractors from performance relative to the Russell Midcap® Index:
-
Security selection within the industrials, materials, and communication services sectors held back relative performance.
-
FUND PERFORMANCE
The fund’s past performance is not a good predictor of the fund’s future performance. The graph and table below do not reflect the deduction of taxes that a shareholder would pay on fund distributions or the redemption of fund shares. The graph and table below assume reinvestment of dividends and capital gain distributions.
Growth of a Hypothetical $10,000 Investment*
This graph shows the performance of a hypothetical $10,000 investment in Class B over a ten year period or since inception, if shorter, in comparison to (i) a broad measure of market performance and (ii) an additional index that MFS believes more closely reflects the market segments in which the fund invests.
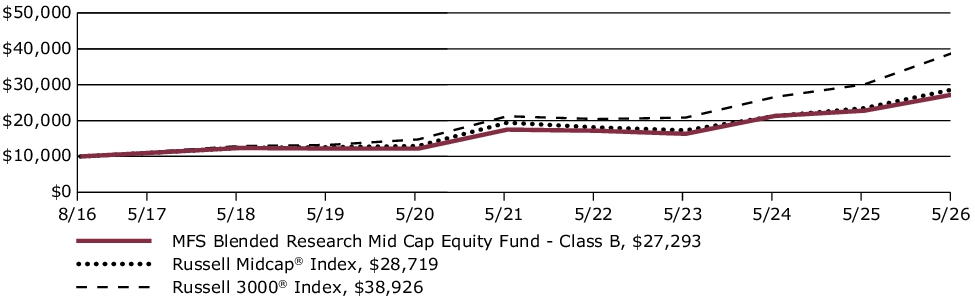
Average Annual Total Returns through 5/31/26
This table shows the average annual total returns of the class of shares noted for the periods shown, both with (if any) and without sales charges. It also shows the average annual total returns of (i) a broad measure of market performance and (ii) an additional index that MFS believes more closely reflects the market segments in which the fund invests, over the same periods.
| Share Class | 1-yr | 5-yr | Life* |
| B without sales charge | 19.92% | 9.32% | 10.81% |
| B with CDSC (declining over six years from 4% to 0%)× | 15.92% | 9.04% | 10.81% |
| Comparative Benchmark(s) | |||
| Russell 3000® Index ∆ | 29.45% | 12.92% | 14.89% |
| Russell Midcap® Index ∆ | 22.37% | 8.15% | 11.38% |
|
*
|
For the period from the commencement of the class's investment operations, August 19, 2016 through May 31, 2026.
|
|
∆
|
Source: FactSet Research Systems Inc.
|
|
×
|
Assuming redemption at the end of the applicable period.
|
Visit mfs.com/perf/b for more recent performance information.
FUND STATISTICS AS OF 5/31/26
| Net Assets ($): | 2,936,785,790 | Total Management Fee ($)#: | 10,501,441 | |
| Total Number of Holdings: | 160 | Portfolio Turnover Rate (%): | 51 |
# Includes the effect of any management fee waivers, if applicable.
Where the fund holds derivatives, they are not included in the total number of portfolio holdings.
PORTFOLIO COMPOSITION (BASED ON TOTAL INVESTMENTS AS OF 5/31/26)
Portfolio structure
| Equities | 99.6% |
| Money Market Funds | 0.4% |
Equity sectors
| Information Technology | 17.7% |
| Industrials | 16.9% |
| Financials | 13.8% |
| Consumer Discretionary | 11.9% |
| Health Care | 10.2% |
| Energy | 6.4% |
| Real Estate | 6.4% |
| Utilities | 6.2% |
| Materials | 3.9% |
| Communication Services | 3.5% |
| Consumer Staples | 2.7% |
Top ten holdings
| Western Digital Corp. | 3.0% |
| Flex Ltd. | 2.7% |
| Valero Energy Corp. | 2.0% |
| Ciena Corp. | 1.9% |
| Viking Holdings Ltd. | 1.9% |
| Okta, Inc. | 1.8% |
| Northern Trust Corp. | 1.8% |
| Aramark | 1.7% |
| Wabtec Corp. | 1.6% |
| Edison International | 1.6% |
MFS uses the Global Industry Classification Standard (GICS®) for sector/industry reporting. MFS has applied its own internal sector/industry classification methodology for equity securities and non-equity securities that are unclassified by GICS.
Top ten holdings
| Western Digital Corp. | 3.0% |
| Flex Ltd. | 2.7% |
| Valero Energy Corp. | 2.0% |
| Ciena Corp. | 1.9% |
| Viking Holdings Ltd. | 1.9% |
| Okta, Inc. | 1.8% |
| Northern Trust Corp. | 1.8% |
| Aramark | 1.7% |
| Wabtec Corp. | 1.6% |
| Edison International | 1.6% |
FUND EXPENSES
What were the fund costs for the last year?
| (based on a hypothetical $10,000 investment) | ||
| Class Name | Costs of a $10,000 investment | Costs paid as a percentage of a $10,000 investment |
| A | $93 | 0.84% |
MANAGEMENT'S DISCUSSION OF FUND PERFORMANCE
-
For the twelve months ended May 31, 2026, Class A shares of the MFS Blended Research Mid Cap Equity Fund (fund) provided a total return of 20.79%, at net asset value. This compares with a return of 29.45% for the fund’s benchmark, the Russell 3000® Index. The fund's other benchmark, the Russell Midcap® Index, generated a return of 22.37%.
-
Global equity markets reached record levels during the period, withstanding considerable volatility amid tariffs, geopolitical conflict and high levels of uncertainty. A new geopolitical event distressed markets at the end of the period as US and Israeli forces launched strikes against Iran, disrupting Mideast oil and natural gas exports. During the period, a pro-growth tax and spending bill was signed into law in the US, while in Europe, renewed focus on defense and infrastructure spending brightened the economic outlook. In Japan, the election of a pro-growth prime minister sent stocks to new highs prior to the conflict in Iran. Optimism over artificial intelligence remained high.
-
Considerable progress was made in trade talks between the US and many major trading partners, with a fragile truce between the US and China extended through late 2026. While the US Supreme Court struck down part of the Trump administration’s tariff strategy, the administration began deploying other authorities to largely replace the ones that were ruled unconstitutional.
-
Early in the period, moderating inflation pressures allowed many global central banks to ease monetary policy. Amid a difficult policymaking environment and slower job growth, the Federal Reserve resumed easing policy in September and delivered quarter-point rate cuts in October and December before pausing.
-
In fixed income markets, previously range-bound global bond yields spiked following the onset of the Middle East conflict, as energy-driven inflation fears appeared to have rattled bond investors. US rate volatility (as measured by the Merrill Lynch Option Volatility Estimate (MOVE) Index) similarly rose from intra-period lows, reflecting uncertainty around the scope and duration of the conflict and its implications for global growth. However, volatility later retracted as the risk of a broader regional military escalation appeared less likely. Global credit spreads widened only modestly before stabilizing near prior levels, supported by strong demand and resilient underlying fundamentals.
-
Top contributors to performance relative to the Russell Midcap® Index:
-
Security selection within the consumer discretionary, energy, real estate, and financials sectors strengthened the fund's relative performance.
-
-
Top detractors from performance relative to the Russell Midcap® Index:
-
Security selection within the industrials, materials, and communication services sectors held back relative performance.
-
FUND PERFORMANCE
The fund’s past performance is not a good predictor of the fund’s future performance. The graph and table below do not reflect the deduction of taxes that a shareholder would pay on fund distributions or the redemption of fund shares. The graph and table below assume reinvestment of dividends and capital gain distributions.
Growth of a Hypothetical $10,000 Investment*
This graph shows the performance of a hypothetical $10,000 investment in Class A over a ten year period or since inception, if shorter, in comparison to (i) a broad measure of market performance and (ii) an additional index that MFS believes more closely reflects the market segments in which the fund invests. This graph includes the deduction of the maximum applicable sales charge.
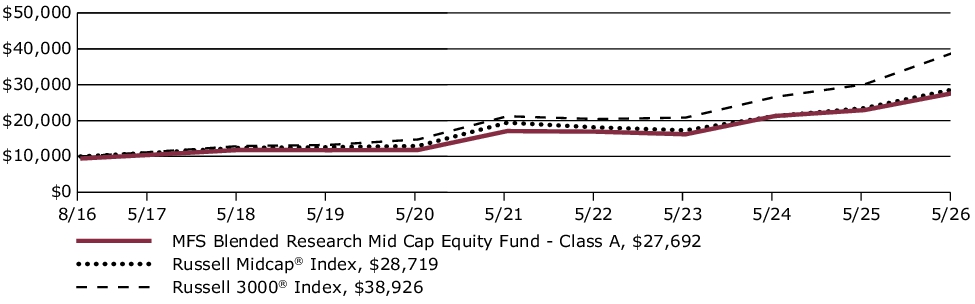
Average Annual Total Returns through 5/31/26
This table shows the average annual total returns of the class of shares noted for the periods shown, both with (if any) and without sales charges. It also shows the average annual total returns of (i) a broad measure of market performance and (ii) an additional index that MFS believes more closely reflects the market segments in which the fund invests, over the same periods.
| Share Class | 1-yr | 5-yr | Life* |
| A without sales charge | 20.79% | 10.15% | 11.64% |
| A with initial sales charge (5.75%) | 13.85% | 8.85% | 10.97% |
| Comparative Benchmark(s) | |||
| Russell 3000® Index ∆ | 29.45% | 12.92% | 14.89% |
| Russell Midcap® Index ∆ | 22.37% | 8.15% | 11.38% |
|
*
|
For the period from the commencement of the class's investment operations, August 19, 2016 through May 31, 2026.
|
|
∆
|
Source: FactSet Research Systems Inc.
|
Visit mfs.com/perf/a for more recent performance information.
FUND STATISTICS AS OF 5/31/26
| Net Assets ($): | 2,936,785,790 | Total Management Fee ($)#: | 10,501,441 | |
| Total Number of Holdings: | 160 | Portfolio Turnover Rate (%): | 51 |
# Includes the effect of any management fee waivers, if applicable.
Where the fund holds derivatives, they are not included in the total number of portfolio holdings.
PORTFOLIO COMPOSITION (BASED ON TOTAL INVESTMENTS AS OF 5/31/26)
Portfolio structure
| Equities | 99.6% |
| Money Market Funds | 0.4% |
Equity sectors
| Information Technology | 17.7% |
| Industrials | 16.9% |
| Financials | 13.8% |
| Consumer Discretionary | 11.9% |
| Health Care | 10.2% |
| Energy | 6.4% |
| Real Estate | 6.4% |
| Utilities | 6.2% |
| Materials | 3.9% |
| Communication Services | 3.5% |
| Consumer Staples | 2.7% |
Top ten holdings
| Western Digital Corp. | 3.0% |
| Flex Ltd. | 2.7% |
| Valero Energy Corp. | 2.0% |
| Ciena Corp. | 1.9% |
| Viking Holdings Ltd. | 1.9% |
| Okta, Inc. | 1.8% |
| Northern Trust Corp. | 1.8% |
| Aramark | 1.7% |
| Wabtec Corp. | 1.6% |
| Edison International | 1.6% |
MFS uses the Global Industry Classification Standard (GICS®) for sector/industry reporting. MFS has applied its own internal sector/industry classification methodology for equity securities and non-equity securities that are unclassified by GICS.
Top ten holdings
| Western Digital Corp. | 3.0% |
| Flex Ltd. | 2.7% |
| Valero Energy Corp. | 2.0% |
| Ciena Corp. | 1.9% |
| Viking Holdings Ltd. | 1.9% |
| Okta, Inc. | 1.8% |
| Northern Trust Corp. | 1.8% |
| Aramark | 1.7% |
| Wabtec Corp. | 1.6% |
| Edison International | 1.6% |
This report describes certain changes to the Fund that occurred during the reporting period.
FUND EXPENSES
What were the fund costs for the last year?
| (based on a hypothetical $10,000 investment) | ||
| Class Name | Costs of a $10,000 investment | Costs paid as a percentage of a $10,000 investment |
| A | $110 | 0.96% |
MANAGEMENT'S DISCUSSION OF FUND PERFORMANCE
-
For the twelve months ended May 31, 2026, Class A shares of the MFS International Large Cap Value Fund (fund) provided a total return of 28.26%, at net asset value. This compares with a return of 22.80% for the fund’s benchmark, the MSCI EAFE (Europe, Australasia, Far East) Index (net div). The fund's other benchmark, the MSCI EAFE (Europe, Australasia, Far East) Value Index (net div), generated a return of 30.07%.
-
Global equity markets reached record levels during the period, withstanding considerable volatility amid tariffs, geopolitical conflict and high levels of uncertainty. A new geopolitical event distressed markets at the end of the period as US and Israeli forces launched strikes against Iran, disrupting Mideast oil and natural gas exports. During the period, a pro-growth tax and spending bill was signed into law in the US, while in Europe, renewed focus on defense and infrastructure spending brightened the economic outlook. In Japan, the election of a pro-growth prime minister sent stocks to new highs prior to the conflict in Iran. Optimism over artificial intelligence remained high.
-
Considerable progress was made in trade talks between the US and many major trading partners, with a fragile truce between the US and China extended through late 2026. While the US Supreme Court struck down part of the Trump administration’s tariff strategy, the administration began deploying other authorities to largely replace the ones that were ruled unconstitutional.
-
Early in the period, moderating inflation pressures allowed many global central banks to ease monetary policy. Amid a difficult policymaking environment and slower job growth, the Federal Reserve resumed easing policy in September and delivered quarter-point rate cuts in October and December before pausing.
-
In fixed income markets, previously range-bound global bond yields spiked following the onset of the Middle East conflict, as energy-driven inflation fears appeared to have rattled bond investors. US rate volatility (as measured by the Merrill Lynch Option Volatility Estimate (MOVE) Index) similarly rose from intra-period lows, reflecting uncertainty around the scope and duration of the conflict and its implications for global growth. However, volatility later retracted as the risk of a broader regional military escalation appeared less likely. Global credit spreads widened only modestly before stabilizing near prior levels, supported by strong demand and resilient underlying fundamentals.
-
Top contributors to performance relative to the MSCI EAFE Value Index:
-
Security selection within the energy, materials, and financials sectors strengthened relative performance.
-
The fund's avoidance of the real estate sector and its overweight position in the information technology sector also benefited relative returns.
-
-
Top detractors from performance relative to the MSCI EAFE Value Index:
-
Security selection within the health care, consumer discretionary, and industrials sectors detracted from relative performance.
-
FUND PERFORMANCE
The fund’s past performance is not a good predictor of the fund’s future performance. The graph and table below do not reflect the deduction of taxes that a shareholder would pay on fund distributions or the redemption of fund shares. The graph and table below assume reinvestment of dividends and capital gain distributions.
Growth of a Hypothetical $10,000 Investment*
This graph shows the performance of a hypothetical $10,000 investment in Class A over a ten year period or since inception, if shorter, in comparison to (i) a broad measure of market performance and (ii) an additional index that MFS believes more closely reflects the market segments in which the fund invests. This graph includes the deduction of the maximum applicable sales charge.
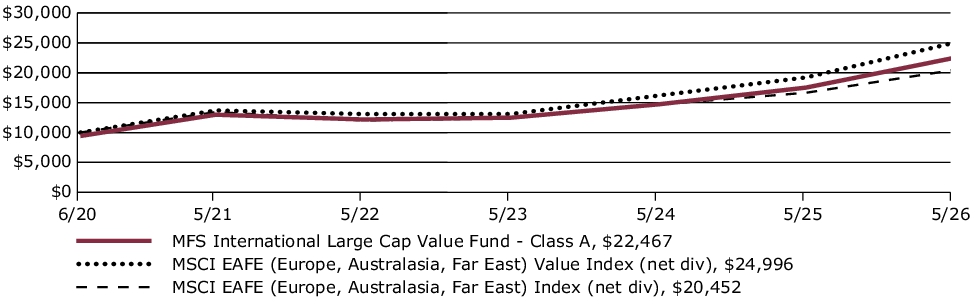
Average Annual Total Returns through 5/31/26
This table shows the average annual total returns of the class of shares noted for the periods shown, both with (if any) and without sales charges. It also shows the average annual total returns of (i) a broad measure of market performance and (ii) an additional index that MFS believes more closely reflects the market segments in which the fund invests, over the same periods.
| Share Class | 1-yr | 5-yr | Life* |
| A without sales charge | 28.26% | 11.59% | 15.81% |
| A with initial sales charge (5.75%) | 20.89% | 10.28% | 14.65% |
| Comparative Benchmark(s) | |||
| MSCI EAFE (Europe, Australasia, Far East) Index (net div) ∆ | 22.80% | 8.79% | 12.84% |
| MSCI EAFE (Europe, Australasia, Far East) Value Index (net div) ∆ | 30.07% | 12.78% | 16.73% |
|
*
|
For the period from the commencement of the class's investment operations, June 30, 2020 through May 31, 2026.
|
|
∆
|
Source: FactSet Research Systems Inc.
|
Visit mfs.com/perf/a for more recent performance information.
FUND STATISTICS AS OF 5/31/26
| Net Assets ($): | 7,408,332,995 | Total Management Fee ($)#: | 49,906,328 | |
| Total Number of Holdings: | 95 | Portfolio Turnover Rate (%): | 23 |
# Includes the effect of any management fee waivers, if applicable.
Where the fund holds derivatives, they are not included in the total number of portfolio holdings.
PORTFOLIO COMPOSITION (BASED ON TOTAL INVESTMENTS AS OF 5/31/26)
Portfolio structure
| Equities | 97.7% |
| Money Market Funds | 2.3% |
Top ten holdings
| NatWest Group PLC | 3.3% |
| BNP Paribas S.A. | 2.8% |
| Roche Holding AG | 2.7% |
| TotalEnergies SE | 2.7% |
| Mitsubishi UFJ Financial Group, Inc. | 2.6% |
| UBS Group AG | 2.5% |
| British American Tobacco PLC | 2.3% |
| Eni S.p.A. | 2.2% |
| Glencore PLC | 2.1% |
| National Grid PLC | 2.0% |
Issuer country weightings
| United Kingdom | 26.5% |
| France | 15.9% |
| Japan | 15.3% |
| Switzerland | 7.5% |
| United States | 5.3% |
| Netherlands | 5.2% |
| Ireland | 4.5% |
| Germany | 4.4% |
| Italy | 4.3% |
| Other Countries | 11.1% |
Top ten holdings
| NatWest Group PLC | 3.3% |
| BNP Paribas S.A. | 2.8% |
| Roche Holding AG | 2.7% |
| TotalEnergies SE | 2.7% |
| Mitsubishi UFJ Financial Group, Inc. | 2.6% |
| UBS Group AG | 2.5% |
| British American Tobacco PLC | 2.3% |
| Eni S.p.A. | 2.2% |
| Glencore PLC | 2.1% |
| National Grid PLC | 2.0% |
MATERIAL FUND CHANGES
This is a summary of certain changes to the fund since June 1, 2025. For more complete information, you may review the fund's prospectus as amended, which is available at funds.mfs.com or upon request at 1‑800‑225‑2606.
Effective April 1, 2026, the management fee is computed daily and paid monthly at the following annual rates based on the fund’s average daily net assets: 0.75% up to $1 billion; 0.70% in excess of $1 billion and up to $2.5 billion; 0.65% in excess of $2.5 billion and up to $10 billion; 0.62% in excess of $10 billion and up to $20 billion; and 0.60% in excess of $20 billion.
Effective April 1, 2026, the management fee is computed daily and paid monthly at the following annual rates based on the fund’s average daily net assets: 0.75% up to $1 billion; 0.70% in excess of $1 billion and up to $2.5 billion; 0.65% in excess of $2.5 billion and up to $10 billion; 0.62% in excess of $10 billion and up to $20 billion; and 0.60% in excess of $20 billion.
This is a summary of certain changes to the fund since June 1, 2025. For more complete information, you may review the fund's prospectus as amended, which is available at funds.mfs.com or upon request at 1‑800‑225‑2606.
This report describes certain changes to the Fund that occurred during the reporting period.
FUND EXPENSES
What were the fund costs for the last year?
| (based on a hypothetical $10,000 investment) | ||
| Class Name | Costs of a $10,000 investment | Costs paid as a percentage of a $10,000 investment |
| C | $194 | 1.71% |
MANAGEMENT'S DISCUSSION OF FUND PERFORMANCE
-
For the twelve months ended May 31, 2026, Class C shares of the MFS International Large Cap Value Fund (fund) provided a total return of 27.22%, at net asset value. This compares with a return of 22.80% for the fund’s benchmark, the MSCI EAFE (Europe, Australasia, Far East) Index (net div). The fund's other benchmark, the MSCI EAFE (Europe, Australasia, Far East) Value Index (net div), generated a return of 30.07%.
-
Global equity markets reached record levels during the period, withstanding considerable volatility amid tariffs, geopolitical conflict and high levels of uncertainty. A new geopolitical event distressed markets at the end of the period as US and Israeli forces launched strikes against Iran, disrupting Mideast oil and natural gas exports. During the period, a pro-growth tax and spending bill was signed into law in the US, while in Europe, renewed focus on defense and infrastructure spending brightened the economic outlook. In Japan, the election of a pro-growth prime minister sent stocks to new highs prior to the conflict in Iran. Optimism over artificial intelligence remained high.
-
Considerable progress was made in trade talks between the US and many major trading partners, with a fragile truce between the US and China extended through late 2026. While the US Supreme Court struck down part of the Trump administration’s tariff strategy, the administration began deploying other authorities to largely replace the ones that were ruled unconstitutional.
-
Early in the period, moderating inflation pressures allowed many global central banks to ease monetary policy. Amid a difficult policymaking environment and slower job growth, the Federal Reserve resumed easing policy in September and delivered quarter-point rate cuts in October and December before pausing.
-
In fixed income markets, previously range-bound global bond yields spiked following the onset of the Middle East conflict, as energy-driven inflation fears appeared to have rattled bond investors. US rate volatility (as measured by the Merrill Lynch Option Volatility Estimate (MOVE) Index) similarly rose from intra-period lows, reflecting uncertainty around the scope and duration of the conflict and its implications for global growth. However, volatility later retracted as the risk of a broader regional military escalation appeared less likely. Global credit spreads widened only modestly before stabilizing near prior levels, supported by strong demand and resilient underlying fundamentals.
-
Top contributors to performance relative to the MSCI EAFE Value Index:
-
Security selection within the energy, materials, and financials sectors strengthened relative performance.
-
The fund's avoidance of the real estate sector and its overweight position in the information technology sector also benefited relative returns.
-
-
Top detractors from performance relative to the MSCI EAFE Value Index:
-
Security selection within the health care, consumer discretionary, and industrials sectors detracted from relative performance.
-
FUND PERFORMANCE
The fund’s past performance is not a good predictor of the fund’s future performance. The graph and table below do not reflect the deduction of taxes that a shareholder would pay on fund distributions or the redemption of fund shares. The graph and table below assume reinvestment of dividends and capital gain distributions.
Growth of a Hypothetical $10,000 Investment*
This graph shows the performance of a hypothetical $10,000 investment in Class C over a ten year period or since inception, if shorter, in comparison to (i) a broad measure of market performance and (ii) an additional index that MFS believes more closely reflects the market segments in which the fund invests.
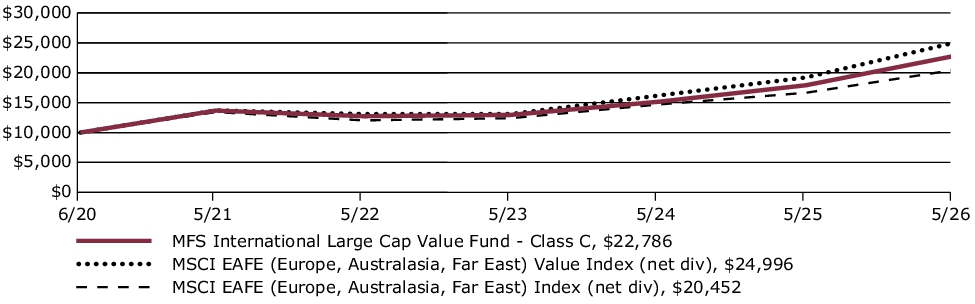
Average Annual Total Returns through 5/31/26
This table shows the average annual total returns of the class of shares noted for the periods shown, both with (if any) and without sales charges. It also shows the average annual total returns of (i) a broad measure of market performance and (ii) an additional index that MFS believes more closely reflects the market segments in which the fund invests, over the same periods.
| Share Class | 1-yr | 5-yr | Life* |
| C without sales charge | 27.22% | 10.76% | 14.93% |
| C with CDSC (1% for 12 months)× | 26.22% | 10.76% | 14.93% |
| Comparative Benchmark(s) | |||
| MSCI EAFE (Europe, Australasia, Far East) Index (net div) ∆ | 22.80% | 8.79% | 12.84% |
| MSCI EAFE (Europe, Australasia, Far East) Value Index (net div) ∆ | 30.07% | 12.78% | 16.73% |
|
*
|
For the period from the commencement of the class's investment operations, June 30, 2020 through May 31, 2026.
|
|
∆
|
Source: FactSet Research Systems Inc.
|
|
×
|
Assuming redemption at the end of the applicable period.
|
Visit mfs.com/perf/c for more recent performance information.
FUND STATISTICS AS OF 5/31/26
| Net Assets ($): | 7,408,332,995 | Total Management Fee ($)#: | 49,906,328 | |
| Total Number of Holdings: | 95 | Portfolio Turnover Rate (%): | 23 |
# Includes the effect of any management fee waivers, if applicable.
Where the fund holds derivatives, they are not included in the total number of portfolio holdings.
PORTFOLIO COMPOSITION (BASED ON TOTAL INVESTMENTS AS OF 5/31/26)
Portfolio structure
| Equities | 97.7% |
| Money Market Funds | 2.3% |
Top ten holdings
| NatWest Group PLC | 3.3% |
| BNP Paribas S.A. | 2.8% |
| Roche Holding AG | 2.7% |
| TotalEnergies SE | 2.7% |
| Mitsubishi UFJ Financial Group, Inc. | 2.6% |
| UBS Group AG | 2.5% |
| British American Tobacco PLC | 2.3% |
| Eni S.p.A. | 2.2% |
| Glencore PLC | 2.1% |
| National Grid PLC | 2.0% |
Issuer country weightings
| United Kingdom | 26.5% |
| France | 15.9% |
| Japan | 15.3% |
| Switzerland | 7.5% |
| United States | 5.3% |
| Netherlands | 5.2% |
| Ireland | 4.5% |
| Germany | 4.4% |
| Italy | 4.3% |
| Other Countries | 11.1% |
Top ten holdings
| NatWest Group PLC | 3.3% |
| BNP Paribas S.A. | 2.8% |
| Roche Holding AG | 2.7% |
| TotalEnergies SE | 2.7% |
| Mitsubishi UFJ Financial Group, Inc. | 2.6% |
| UBS Group AG | 2.5% |
| British American Tobacco PLC | 2.3% |
| Eni S.p.A. | 2.2% |
| Glencore PLC | 2.1% |
| National Grid PLC | 2.0% |
MATERIAL FUND CHANGES
This is a summary of certain changes to the fund since June 1, 2025. For more complete information, you may review the fund's prospectus as amended, which is available at funds.mfs.com or upon request at 1‑800‑225‑2606.
Effective April 1, 2026, the management fee is computed daily and paid monthly at the following annual rates based on the fund’s average daily net assets: 0.75% up to $1 billion; 0.70% in excess of $1 billion and up to $2.5 billion; 0.65% in excess of $2.5 billion and up to $10 billion; 0.62% in excess of $10 billion and up to $20 billion; and 0.60% in excess of $20 billion.
Effective April 1, 2026, the management fee is computed daily and paid monthly at the following annual rates based on the fund’s average daily net assets: 0.75% up to $1 billion; 0.70% in excess of $1 billion and up to $2.5 billion; 0.65% in excess of $2.5 billion and up to $10 billion; 0.62% in excess of $10 billion and up to $20 billion; and 0.60% in excess of $20 billion.
This is a summary of certain changes to the fund since June 1, 2025. For more complete information, you may review the fund's prospectus as amended, which is available at funds.mfs.com or upon request at 1‑800‑225‑2606.
This report describes certain changes to the Fund that occurred during the reporting period.
FUND EXPENSES
What were the fund costs for the last year?
| (based on a hypothetical $10,000 investment) | ||
| Class Name | Costs of a $10,000 investment | Costs paid as a percentage of a $10,000 investment |
| I | $81 | 0.71% |
MANAGEMENT'S DISCUSSION OF FUND PERFORMANCE
-
For the twelve months ended May 31, 2026, Class I shares of the MFS International Large Cap Value Fund (fund) provided a total return of 28.57%, at net asset value. This compares with a return of 22.80% for the fund’s benchmark, the MSCI EAFE (Europe, Australasia, Far East) Index (net div). The fund's other benchmark, the MSCI EAFE (Europe, Australasia, Far East) Value Index (net div), generated a return of 30.07%.
-
Global equity markets reached record levels during the period, withstanding considerable volatility amid tariffs, geopolitical conflict and high levels of uncertainty. A new geopolitical event distressed markets at the end of the period as US and Israeli forces launched strikes against Iran, disrupting Mideast oil and natural gas exports. During the period, a pro-growth tax and spending bill was signed into law in the US, while in Europe, renewed focus on defense and infrastructure spending brightened the economic outlook. In Japan, the election of a pro-growth prime minister sent stocks to new highs prior to the conflict in Iran. Optimism over artificial intelligence remained high.
-
Considerable progress was made in trade talks between the US and many major trading partners, with a fragile truce between the US and China extended through late 2026. While the US Supreme Court struck down part of the Trump administration’s tariff strategy, the administration began deploying other authorities to largely replace the ones that were ruled unconstitutional.
-
Early in the period, moderating inflation pressures allowed many global central banks to ease monetary policy. Amid a difficult policymaking environment and slower job growth, the Federal Reserve resumed easing policy in September and delivered quarter-point rate cuts in October and December before pausing.
-
In fixed income markets, previously range-bound global bond yields spiked following the onset of the Middle East conflict, as energy-driven inflation fears appeared to have rattled bond investors. US rate volatility (as measured by the Merrill Lynch Option Volatility Estimate (MOVE) Index) similarly rose from intra-period lows, reflecting uncertainty around the scope and duration of the conflict and its implications for global growth. However, volatility later retracted as the risk of a broader regional military escalation appeared less likely. Global credit spreads widened only modestly before stabilizing near prior levels, supported by strong demand and resilient underlying fundamentals.
-
Top contributors to performance relative to the MSCI EAFE Value Index:
-
Security selection within the energy, materials, and financials sectors strengthened relative performance.
-
The fund's avoidance of the real estate sector and its overweight position in the information technology sector also benefited relative returns.
-
-
Top detractors from performance relative to the MSCI EAFE Value Index:
-
Security selection within the health care, consumer discretionary, and industrials sectors detracted from relative performance.
-
FUND PERFORMANCE
The fund’s past performance is not a good predictor of the fund’s future performance. The graph and table below do not reflect the deduction of taxes that a shareholder would pay on fund distributions or the redemption of fund shares. The graph and table below assume reinvestment of dividends and capital gain distributions.
Growth of a Hypothetical $10,000 Investment*
This graph shows the performance of a hypothetical $10,000 investment in Class I over a ten year period or since inception, if shorter, in comparison to (i) a broad measure of market performance and (ii) an additional index that MFS believes more closely reflects the market segments in which the fund invests.
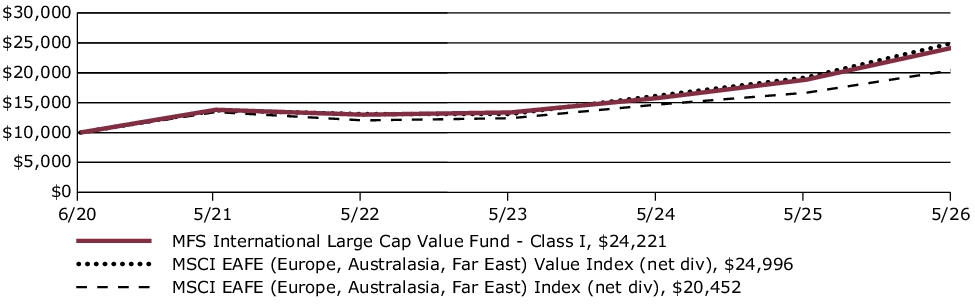
Average Annual Total Returns through 5/31/26
This table shows the average annual total returns of the class of shares noted for the periods shown, both with (if any) and without sales charges. It also shows the average annual total returns of (i) a broad measure of market performance and (ii) an additional index that MFS believes more closely reflects the market segments in which the fund invests, over the same periods.
| Share Class | 1-yr | 5-yr | Life* |
| I without sales charge | 28.57% | 11.89% | 16.12% |
| Comparative Benchmark(s) | |||
| MSCI EAFE (Europe, Australasia, Far East) Index (net div) ∆ | 22.80% | 8.79% | 12.84% |
| MSCI EAFE (Europe, Australasia, Far East) Value Index (net div) ∆ | 30.07% | 12.78% | 16.73% |
|
*
|
For the period from the commencement of the class's investment operations, June 30, 2020 through May 31, 2026.
|
|
∆
|
Source: FactSet Research Systems Inc.
|
Visit mfs.com/perf/i for more recent performance information.
FUND STATISTICS AS OF 5/31/26
| Net Assets ($): | 7,408,332,995 | Total Management Fee ($)#: | 49,906,328 | |
| Total Number of Holdings: | 95 | Portfolio Turnover Rate (%): | 23 |
# Includes the effect of any management fee waivers, if applicable.
Where the fund holds derivatives, they are not included in the total number of portfolio holdings.
PORTFOLIO COMPOSITION (BASED ON TOTAL INVESTMENTS AS OF 5/31/26)
Portfolio structure
| Equities | 97.7% |
| Money Market Funds | 2.3% |
Top ten holdings
| NatWest Group PLC | 3.3% |
| BNP Paribas S.A. | 2.8% |
| Roche Holding AG | 2.7% |
| TotalEnergies SE | 2.7% |
| Mitsubishi UFJ Financial Group, Inc. | 2.6% |
| UBS Group AG | 2.5% |
| British American Tobacco PLC | 2.3% |
| Eni S.p.A. | 2.2% |
| Glencore PLC | 2.1% |
| National Grid PLC | 2.0% |
Issuer country weightings
| United Kingdom | 26.5% |
| France | 15.9% |
| Japan | 15.3% |
| Switzerland | 7.5% |
| United States | 5.3% |
| Netherlands | 5.2% |
| Ireland | 4.5% |
| Germany | 4.4% |
| Italy | 4.3% |
| Other Countries | 11.1% |
Top ten holdings
| NatWest Group PLC | 3.3% |
| BNP Paribas S.A. | 2.8% |
| Roche Holding AG | 2.7% |
| TotalEnergies SE | 2.7% |
| Mitsubishi UFJ Financial Group, Inc. | 2.6% |
| UBS Group AG | 2.5% |
| British American Tobacco PLC | 2.3% |
| Eni S.p.A. | 2.2% |
| Glencore PLC | 2.1% |
| National Grid PLC | 2.0% |
MATERIAL FUND CHANGES
This is a summary of certain changes to the fund since June 1, 2025. For more complete information, you may review the fund's prospectus as amended, which is available at funds.mfs.com or upon request at 1‑800‑225‑2606.
Effective April 1, 2026, the management fee is computed daily and paid monthly at the following annual rates based on the fund’s average daily net assets: 0.75% up to $1 billion; 0.70% in excess of $1 billion and up to $2.5 billion; 0.65% in excess of $2.5 billion and up to $10 billion; 0.62% in excess of $10 billion and up to $20 billion; and 0.60% in excess of $20 billion.
Effective April 1, 2026, the management fee is computed daily and paid monthly at the following annual rates based on the fund’s average daily net assets: 0.75% up to $1 billion; 0.70% in excess of $1 billion and up to $2.5 billion; 0.65% in excess of $2.5 billion and up to $10 billion; 0.62% in excess of $10 billion and up to $20 billion; and 0.60% in excess of $20 billion.
This is a summary of certain changes to the fund since June 1, 2025. For more complete information, you may review the fund's prospectus as amended, which is available at funds.mfs.com or upon request at 1‑800‑225‑2606.
This report describes certain changes to the Fund that occurred during the reporting period.
FUND EXPENSES
What were the fund costs for the last year?
| (based on a hypothetical $10,000 investment) | ||
| Class Name | Costs of a $10,000 investment | Costs paid as a percentage of a $10,000 investment |
| R1 | $194 | 1.71% |
MANAGEMENT'S DISCUSSION OF FUND PERFORMANCE
-
For the twelve months ended May 31, 2026, Class R1 shares of the MFS International Large Cap Value Fund (fund) provided a total return of 27.27%, at net asset value. This compares with a return of 22.80% for the fund’s benchmark, the MSCI EAFE (Europe, Australasia, Far East) Index (net div). The fund's other benchmark, the MSCI EAFE (Europe, Australasia, Far East) Value Index (net div), generated a return of 30.07%.
-
Global equity markets reached record levels during the period, withstanding considerable volatility amid tariffs, geopolitical conflict and high levels of uncertainty. A new geopolitical event distressed markets at the end of the period as US and Israeli forces launched strikes against Iran, disrupting Mideast oil and natural gas exports. During the period, a pro-growth tax and spending bill was signed into law in the US, while in Europe, renewed focus on defense and infrastructure spending brightened the economic outlook. In Japan, the election of a pro-growth prime minister sent stocks to new highs prior to the conflict in Iran. Optimism over artificial intelligence remained high.
-
Considerable progress was made in trade talks between the US and many major trading partners, with a fragile truce between the US and China extended through late 2026. While the US Supreme Court struck down part of the Trump administration’s tariff strategy, the administration began deploying other authorities to largely replace the ones that were ruled unconstitutional.
-
Early in the period, moderating inflation pressures allowed many global central banks to ease monetary policy. Amid a difficult policymaking environment and slower job growth, the Federal Reserve resumed easing policy in September and delivered quarter-point rate cuts in October and December before pausing.
-
In fixed income markets, previously range-bound global bond yields spiked following the onset of the Middle East conflict, as energy-driven inflation fears appeared to have rattled bond investors. US rate volatility (as measured by the Merrill Lynch Option Volatility Estimate (MOVE) Index) similarly rose from intra-period lows, reflecting uncertainty around the scope and duration of the conflict and its implications for global growth. However, volatility later retracted as the risk of a broader regional military escalation appeared less likely. Global credit spreads widened only modestly before stabilizing near prior levels, supported by strong demand and resilient underlying fundamentals.
-
Top contributors to performance relative to the MSCI EAFE Value Index:
-
Security selection within the energy, materials, and financials sectors strengthened relative performance.
-
The fund's avoidance of the real estate sector and its overweight position in the information technology sector also benefited relative returns.
-
-
Top detractors from performance relative to the MSCI EAFE Value Index:
-
Security selection within the health care, consumer discretionary, and industrials sectors detracted from relative performance.
-
FUND PERFORMANCE
The fund’s past performance is not a good predictor of the fund’s future performance. The graph and table below do not reflect the deduction of taxes that a shareholder would pay on fund distributions or the redemption of fund shares. The graph and table below assume reinvestment of dividends and capital gain distributions.
Growth of a Hypothetical $10,000 Investment*
This graph shows the performance of a hypothetical $10,000 investment in Class R1 over a ten year period or since inception, if shorter, in comparison to (i) a broad measure of market performance and (ii) an additional index that MFS believes more closely reflects the market segments in which the fund invests.
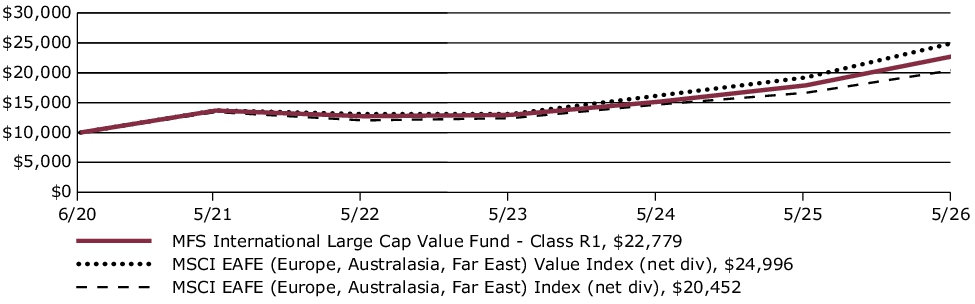
Average Annual Total Returns through 5/31/26
This table shows the average annual total returns of the class of shares noted for the periods shown, both with (if any) and without sales charges. It also shows the average annual total returns of (i) a broad measure of market performance and (ii) an additional index that MFS believes more closely reflects the market segments in which the fund invests, over the same periods.
| Share Class | 1-yr | 5-yr | Life* |
| R1 without sales charge | 27.27% | 10.75% | 14.92% |
| Comparative Benchmark(s) | |||
| MSCI EAFE (Europe, Australasia, Far East) Index (net div) ∆ | 22.80% | 8.79% | 12.84% |
| MSCI EAFE (Europe, Australasia, Far East) Value Index (net div) ∆ | 30.07% | 12.78% | 16.73% |
|
*
|
For the period from the commencement of the class's investment operations, June 30, 2020 through May 31, 2026.
|
|
∆
|
Source: FactSet Research Systems Inc.
|
Visit mfs.com/perf/r1 for more recent performance information.
FUND STATISTICS AS OF 5/31/26
| Net Assets ($): | 7,408,332,995 | Total Management Fee ($)#: | 49,906,328 | |
| Total Number of Holdings: | 95 | Portfolio Turnover Rate (%): | 23 |
# Includes the effect of any management fee waivers, if applicable.
Where the fund holds derivatives, they are not included in the total number of portfolio holdings.
PORTFOLIO COMPOSITION (BASED ON TOTAL INVESTMENTS AS OF 5/31/26)
Portfolio structure
| Equities | 97.7% |
| Money Market Funds | 2.3% |
Top ten holdings
| NatWest Group PLC | 3.3% |
| BNP Paribas S.A. | 2.8% |
| Roche Holding AG | 2.7% |
| TotalEnergies SE | 2.7% |
| Mitsubishi UFJ Financial Group, Inc. | 2.6% |
| UBS Group AG | 2.5% |
| British American Tobacco PLC | 2.3% |
| Eni S.p.A. | 2.2% |
| Glencore PLC | 2.1% |
| National Grid PLC | 2.0% |
Issuer country weightings
| United Kingdom | 26.5% |
| France | 15.9% |
| Japan | 15.3% |
| Switzerland | 7.5% |
| United States | 5.3% |
| Netherlands | 5.2% |
| Ireland | 4.5% |
| Germany | 4.4% |
| Italy | 4.3% |
| Other Countries | 11.1% |
Top ten holdings
| NatWest Group PLC | 3.3% |
| BNP Paribas S.A. | 2.8% |
| Roche Holding AG | 2.7% |
| TotalEnergies SE | 2.7% |
| Mitsubishi UFJ Financial Group, Inc. | 2.6% |
| UBS Group AG | 2.5% |
| British American Tobacco PLC | 2.3% |
| Eni S.p.A. | 2.2% |
| Glencore PLC | 2.1% |
| National Grid PLC | 2.0% |
MATERIAL FUND CHANGES
This is a summary of certain changes to the fund since June 1, 2025. For more complete information, you may review the fund's prospectus as amended, which is available at funds.mfs.com or upon request at 1‑800‑225‑2606.
Effective April 1, 2026, the management fee is computed daily and paid monthly at the following annual rates based on the fund’s average daily net assets: 0.75% up to $1 billion; 0.70% in excess of $1 billion and up to $2.5 billion; 0.65% in excess of $2.5 billion and up to $10 billion; 0.62% in excess of $10 billion and up to $20 billion; and 0.60% in excess of $20 billion.
Effective April 1, 2026, the management fee is computed daily and paid monthly at the following annual rates based on the fund’s average daily net assets: 0.75% up to $1 billion; 0.70% in excess of $1 billion and up to $2.5 billion; 0.65% in excess of $2.5 billion and up to $10 billion; 0.62% in excess of $10 billion and up to $20 billion; and 0.60% in excess of $20 billion.
This is a summary of certain changes to the fund since June 1, 2025. For more complete information, you may review the fund's prospectus as amended, which is available at funds.mfs.com or upon request at 1‑800‑225‑2606.
This report describes certain changes to the Fund that occurred during the reporting period.
FUND EXPENSES
What were the fund costs for the last year?
| (based on a hypothetical $10,000 investment) | ||
| Class Name | Costs of a $10,000 investment | Costs paid as a percentage of a $10,000 investment |
| R2 | $138 | 1.21% |
MANAGEMENT'S DISCUSSION OF FUND PERFORMANCE
-
For the twelve months ended May 31, 2026, Class R2 shares of the MFS International Large Cap Value Fund (fund) provided a total return of 27.90%, at net asset value. This compares with a return of 22.80% for the fund’s benchmark, the MSCI EAFE (Europe, Australasia, Far East) Index (net div). The fund's other benchmark, the MSCI EAFE (Europe, Australasia, Far East) Value Index (net div), generated a return of 30.07%.
-
Global equity markets reached record levels during the period, withstanding considerable volatility amid tariffs, geopolitical conflict and high levels of uncertainty. A new geopolitical event distressed markets at the end of the period as US and Israeli forces launched strikes against Iran, disrupting Mideast oil and natural gas exports. During the period, a pro-growth tax and spending bill was signed into law in the US, while in Europe, renewed focus on defense and infrastructure spending brightened the economic outlook. In Japan, the election of a pro-growth prime minister sent stocks to new highs prior to the conflict in Iran. Optimism over artificial intelligence remained high.
-
Considerable progress was made in trade talks between the US and many major trading partners, with a fragile truce between the US and China extended through late 2026. While the US Supreme Court struck down part of the Trump administration’s tariff strategy, the administration began deploying other authorities to largely replace the ones that were ruled unconstitutional.
-
Early in the period, moderating inflation pressures allowed many global central banks to ease monetary policy. Amid a difficult policymaking environment and slower job growth, the Federal Reserve resumed easing policy in September and delivered quarter-point rate cuts in October and December before pausing.
-
In fixed income markets, previously range-bound global bond yields spiked following the onset of the Middle East conflict, as energy-driven inflation fears appeared to have rattled bond investors. US rate volatility (as measured by the Merrill Lynch Option Volatility Estimate (MOVE) Index) similarly rose from intra-period lows, reflecting uncertainty around the scope and duration of the conflict and its implications for global growth. However, volatility later retracted as the risk of a broader regional military escalation appeared less likely. Global credit spreads widened only modestly before stabilizing near prior levels, supported by strong demand and resilient underlying fundamentals.
-
Top contributors to performance relative to the MSCI EAFE Value Index:
-
Security selection within the energy, materials, and financials sectors strengthened relative performance.
-
The fund's avoidance of the real estate sector and its overweight position in the information technology sector also benefited relative returns.
-
-
Top detractors from performance relative to the MSCI EAFE Value Index:
-
Security selection within the health care, consumer discretionary, and industrials sectors detracted from relative performance.
-
FUND PERFORMANCE
The fund’s past performance is not a good predictor of the fund’s future performance. The graph and table below do not reflect the deduction of taxes that a shareholder would pay on fund distributions or the redemption of fund shares. The graph and table below assume reinvestment of dividends and capital gain distributions.
Growth of a Hypothetical $10,000 Investment*
This graph shows the performance of a hypothetical $10,000 investment in Class R2 over a ten year period or since inception, if shorter, in comparison to (i) a broad measure of market performance and (ii) an additional index that MFS believes more closely reflects the market segments in which the fund invests.
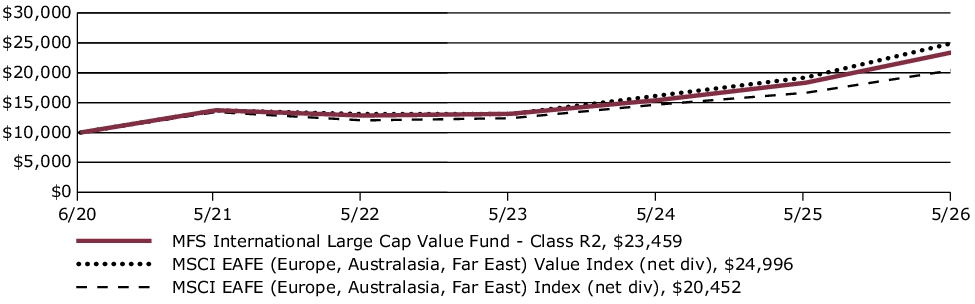
Average Annual Total Returns through 5/31/26
This table shows the average annual total returns of the class of shares noted for the periods shown, both with (if any) and without sales charges. It also shows the average annual total returns of (i) a broad measure of market performance and (ii) an additional index that MFS believes more closely reflects the market segments in which the fund invests, over the same periods.
| Share Class | 1-yr | 5-yr | Life* |
| R2 without sales charge | 27.90% | 11.32% | 15.49% |
| Comparative Benchmark(s) | |||
| MSCI EAFE (Europe, Australasia, Far East) Index (net div) ∆ | 22.80% | 8.79% | 12.84% |
| MSCI EAFE (Europe, Australasia, Far East) Value Index (net div) ∆ | 30.07% | 12.78% | 16.73% |
|
*
|
For the period from the commencement of the class's investment operations, June 30, 2020 through May 31, 2026.
|
|
∆
|
Source: FactSet Research Systems Inc.
|
Visit mfs.com/perf/r2 for more recent performance information.
FUND STATISTICS AS OF 5/31/26
| Net Assets ($): | 7,408,332,995 | Total Management Fee ($)#: | 49,906,328 | |
| Total Number of Holdings: | 95 | Portfolio Turnover Rate (%): | 23 |
# Includes the effect of any management fee waivers, if applicable.
Where the fund holds derivatives, they are not included in the total number of portfolio holdings.
PORTFOLIO COMPOSITION (BASED ON TOTAL INVESTMENTS AS OF 5/31/26)
Portfolio structure
| Equities | 97.7% |
| Money Market Funds | 2.3% |
Top ten holdings
| NatWest Group PLC | 3.3% |
| BNP Paribas S.A. | 2.8% |
| Roche Holding AG | 2.7% |
| TotalEnergies SE | 2.7% |
| Mitsubishi UFJ Financial Group, Inc. | 2.6% |
| UBS Group AG | 2.5% |
| British American Tobacco PLC | 2.3% |
| Eni S.p.A. | 2.2% |
| Glencore PLC | 2.1% |
| National Grid PLC | 2.0% |
Issuer country weightings
| United Kingdom | 26.5% |
| France | 15.9% |
| Japan | 15.3% |
| Switzerland | 7.5% |
| United States | 5.3% |
| Netherlands | 5.2% |
| Ireland | 4.5% |
| Germany | 4.4% |
| Italy | 4.3% |
| Other Countries | 11.1% |
Top ten holdings
| NatWest Group PLC | 3.3% |
| BNP Paribas S.A. | 2.8% |
| Roche Holding AG | 2.7% |
| TotalEnergies SE | 2.7% |
| Mitsubishi UFJ Financial Group, Inc. | 2.6% |
| UBS Group AG | 2.5% |
| British American Tobacco PLC | 2.3% |
| Eni S.p.A. | 2.2% |
| Glencore PLC | 2.1% |
| National Grid PLC | 2.0% |
MATERIAL FUND CHANGES
This is a summary of certain changes to the fund since June 1, 2025. For more complete information, you may review the fund's prospectus as amended, which is available at funds.mfs.com or upon request at 1‑800‑225‑2606.
Effective April 1, 2026, the management fee is computed daily and paid monthly at the following annual rates based on the fund’s average daily net assets: 0.75% up to $1 billion; 0.70% in excess of $1 billion and up to $2.5 billion; 0.65% in excess of $2.5 billion and up to $10 billion; 0.62% in excess of $10 billion and up to $20 billion; and 0.60% in excess of $20 billion.
Effective April 1, 2026, the management fee is computed daily and paid monthly at the following annual rates based on the fund’s average daily net assets: 0.75% up to $1 billion; 0.70% in excess of $1 billion and up to $2.5 billion; 0.65% in excess of $2.5 billion and up to $10 billion; 0.62% in excess of $10 billion and up to $20 billion; and 0.60% in excess of $20 billion.
This is a summary of certain changes to the fund since June 1, 2025. For more complete information, you may review the fund's prospectus as amended, which is available at funds.mfs.com or upon request at 1‑800‑225‑2606.
This report describes certain changes to the Fund that occurred during the reporting period.
FUND EXPENSES
What were the fund costs for the last year?
| (based on a hypothetical $10,000 investment) | ||
| Class Name | Costs of a $10,000 investment | Costs paid as a percentage of a $10,000 investment |
| R3 | $110 | 0.96% |
MANAGEMENT'S DISCUSSION OF FUND PERFORMANCE
-
For the twelve months ended May 31, 2026, Class R3 shares of the MFS International Large Cap Value Fund (fund) provided a total return of 28.22%, at net asset value. This compares with a return of 22.80% for the fund’s benchmark, the MSCI EAFE (Europe, Australasia, Far East) Index (net div). The fund's other benchmark, the MSCI EAFE (Europe, Australasia, Far East) Value Index (net div), generated a return of 30.07%.
-
Global equity markets reached record levels during the period, withstanding considerable volatility amid tariffs, geopolitical conflict and high levels of uncertainty. A new geopolitical event distressed markets at the end of the period as US and Israeli forces launched strikes against Iran, disrupting Mideast oil and natural gas exports. During the period, a pro-growth tax and spending bill was signed into law in the US, while in Europe, renewed focus on defense and infrastructure spending brightened the economic outlook. In Japan, the election of a pro-growth prime minister sent stocks to new highs prior to the conflict in Iran. Optimism over artificial intelligence remained high.
-
Considerable progress was made in trade talks between the US and many major trading partners, with a fragile truce between the US and China extended through late 2026. While the US Supreme Court struck down part of the Trump administration’s tariff strategy, the administration began deploying other authorities to largely replace the ones that were ruled unconstitutional.
-
Early in the period, moderating inflation pressures allowed many global central banks to ease monetary policy. Amid a difficult policymaking environment and slower job growth, the Federal Reserve resumed easing policy in September and delivered quarter-point rate cuts in October and December before pausing.
-
In fixed income markets, previously range-bound global bond yields spiked following the onset of the Middle East conflict, as energy-driven inflation fears appeared to have rattled bond investors. US rate volatility (as measured by the Merrill Lynch Option Volatility Estimate (MOVE) Index) similarly rose from intra-period lows, reflecting uncertainty around the scope and duration of the conflict and its implications for global growth. However, volatility later retracted as the risk of a broader regional military escalation appeared less likely. Global credit spreads widened only modestly before stabilizing near prior levels, supported by strong demand and resilient underlying fundamentals.
-
Top contributors to performance relative to the MSCI EAFE Value Index:
-
Security selection within the energy, materials, and financials sectors strengthened relative performance.
-
The fund's avoidance of the real estate sector and its overweight position in the information technology sector also benefited relative returns.
-
-
Top detractors from performance relative to the MSCI EAFE Value Index:
-
Security selection within the health care, consumer discretionary, and industrials sectors detracted from relative performance.
-
FUND PERFORMANCE
The fund’s past performance is not a good predictor of the fund’s future performance. The graph and table below do not reflect the deduction of taxes that a shareholder would pay on fund distributions or the redemption of fund shares. The graph and table below assume reinvestment of dividends and capital gain distributions.
Growth of a Hypothetical $10,000 Investment*
This graph shows the performance of a hypothetical $10,000 investment in Class R3 over a ten year period or since inception, if shorter, in comparison to (i) a broad measure of market performance and (ii) an additional index that MFS believes more closely reflects the market segments in which the fund invests.
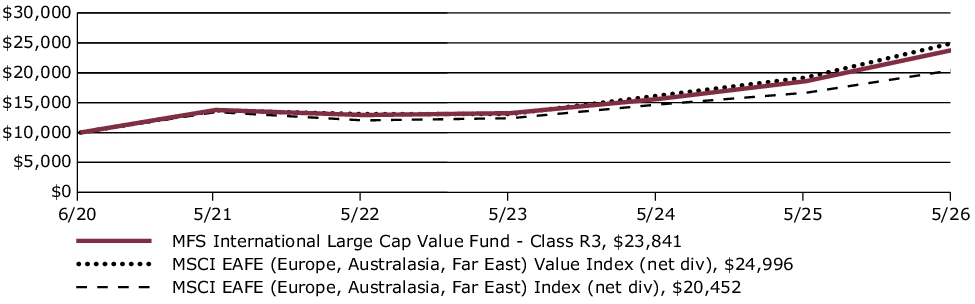
Average Annual Total Returns through 5/31/26
This table shows the average annual total returns of the class of shares noted for the periods shown, both with (if any) and without sales charges. It also shows the average annual total returns of (i) a broad measure of market performance and (ii) an additional index that MFS believes more closely reflects the market segments in which the fund invests, over the same periods.
| Share Class | 1-yr | 5-yr | Life* |
| R3 without sales charge | 28.22% | 11.60% | 15.81% |
| Comparative Benchmark(s) | |||
| MSCI EAFE (Europe, Australasia, Far East) Index (net div) ∆ | 22.80% | 8.79% | 12.84% |
| MSCI EAFE (Europe, Australasia, Far East) Value Index (net div) ∆ | 30.07% | 12.78% | 16.73% |
|
*
|
For the period from the commencement of the class's investment operations, June 30, 2020 through May 31, 2026.
|
|
∆
|
Source: FactSet Research Systems Inc.
|
Visit mfs.com/perf/r3 for more recent performance information.
FUND STATISTICS AS OF 5/31/26
| Net Assets ($): | 7,408,332,995 | Total Management Fee ($)#: | 49,906,328 | |
| Total Number of Holdings: | 95 | Portfolio Turnover Rate (%): | 23 |
# Includes the effect of any management fee waivers, if applicable.
Where the fund holds derivatives, they are not included in the total number of portfolio holdings.
PORTFOLIO COMPOSITION (BASED ON TOTAL INVESTMENTS AS OF 5/31/26)
Portfolio structure
| Equities | 97.7% |
| Money Market Funds | 2.3% |
Top ten holdings
| NatWest Group PLC | 3.3% |
| BNP Paribas S.A. | 2.8% |
| Roche Holding AG | 2.7% |
| TotalEnergies SE | 2.7% |
| Mitsubishi UFJ Financial Group, Inc. | 2.6% |
| UBS Group AG | 2.5% |
| British American Tobacco PLC | 2.3% |
| Eni S.p.A. | 2.2% |
| Glencore PLC | 2.1% |
| National Grid PLC | 2.0% |
Issuer country weightings
| United Kingdom | 26.5% |
| France | 15.9% |
| Japan | 15.3% |
| Switzerland | 7.5% |
| United States | 5.3% |
| Netherlands | 5.2% |
| Ireland | 4.5% |
| Germany | 4.4% |
| Italy | 4.3% |
| Other Countries | 11.1% |
Top ten holdings
| NatWest Group PLC | 3.3% |
| BNP Paribas S.A. | 2.8% |
| Roche Holding AG | 2.7% |
| TotalEnergies SE | 2.7% |
| Mitsubishi UFJ Financial Group, Inc. | 2.6% |
| UBS Group AG | 2.5% |
| British American Tobacco PLC | 2.3% |
| Eni S.p.A. | 2.2% |
| Glencore PLC | 2.1% |
| National Grid PLC | 2.0% |
MATERIAL FUND CHANGES
This is a summary of certain changes to the fund since June 1, 2025. For more complete information, you may review the fund's prospectus as amended, which is available at funds.mfs.com or upon request at 1‑800‑225‑2606.
Effective April 1, 2026, the management fee is computed daily and paid monthly at the following annual rates based on the fund’s average daily net assets: 0.75% up to $1 billion; 0.70% in excess of $1 billion and up to $2.5 billion; 0.65% in excess of $2.5 billion and up to $10 billion; 0.62% in excess of $10 billion and up to $20 billion; and 0.60% in excess of $20 billion.
Effective April 1, 2026, the management fee is computed daily and paid monthly at the following annual rates based on the fund’s average daily net assets: 0.75% up to $1 billion; 0.70% in excess of $1 billion and up to $2.5 billion; 0.65% in excess of $2.5 billion and up to $10 billion; 0.62% in excess of $10 billion and up to $20 billion; and 0.60% in excess of $20 billion.
This is a summary of certain changes to the fund since June 1, 2025. For more complete information, you may review the fund's prospectus as amended, which is available at funds.mfs.com or upon request at 1‑800‑225‑2606.
This report describes certain changes to the Fund that occurred during the reporting period.
FUND EXPENSES
What were the fund costs for the last year?
| (based on a hypothetical $10,000 investment) | ||
| Class Name | Costs of a $10,000 investment | Costs paid as a percentage of a $10,000 investment |
| R4 | $81 | 0.71% |
MANAGEMENT'S DISCUSSION OF FUND PERFORMANCE
-
For the twelve months ended May 31, 2026, Class R4 shares of the MFS International Large Cap Value Fund (fund) provided a total return of 28.58%, at net asset value. This compares with a return of 22.80% for the fund’s benchmark, the MSCI EAFE (Europe, Australasia, Far East) Index (net div). The fund's other benchmark, the MSCI EAFE (Europe, Australasia, Far East) Value Index (net div), generated a return of 30.07%.
-
Global equity markets reached record levels during the period, withstanding considerable volatility amid tariffs, geopolitical conflict and high levels of uncertainty. A new geopolitical event distressed markets at the end of the period as US and Israeli forces launched strikes against Iran, disrupting Mideast oil and natural gas exports. During the period, a pro-growth tax and spending bill was signed into law in the US, while in Europe, renewed focus on defense and infrastructure spending brightened the economic outlook. In Japan, the election of a pro-growth prime minister sent stocks to new highs prior to the conflict in Iran. Optimism over artificial intelligence remained high.
-
Considerable progress was made in trade talks between the US and many major trading partners, with a fragile truce between the US and China extended through late 2026. While the US Supreme Court struck down part of the Trump administration’s tariff strategy, the administration began deploying other authorities to largely replace the ones that were ruled unconstitutional.
-
Early in the period, moderating inflation pressures allowed many global central banks to ease monetary policy. Amid a difficult policymaking environment and slower job growth, the Federal Reserve resumed easing policy in September and delivered quarter-point rate cuts in October and December before pausing.
-
In fixed income markets, previously range-bound global bond yields spiked following the onset of the Middle East conflict, as energy-driven inflation fears appeared to have rattled bond investors. US rate volatility (as measured by the Merrill Lynch Option Volatility Estimate (MOVE) Index) similarly rose from intra-period lows, reflecting uncertainty around the scope and duration of the conflict and its implications for global growth. However, volatility later retracted as the risk of a broader regional military escalation appeared less likely. Global credit spreads widened only modestly before stabilizing near prior levels, supported by strong demand and resilient underlying fundamentals.
-
Top contributors to performance relative to the MSCI EAFE Value Index:
-
Security selection within the energy, materials, and financials sectors strengthened relative performance.
-
The fund's avoidance of the real estate sector and its overweight position in the information technology sector also benefited relative returns.
-
-
Top detractors from performance relative to the MSCI EAFE Value Index:
-
Security selection within the health care, consumer discretionary, and industrials sectors detracted from relative performance.
-
FUND PERFORMANCE
The fund’s past performance is not a good predictor of the fund’s future performance. The graph and table below do not reflect the deduction of taxes that a shareholder would pay on fund distributions or the redemption of fund shares. The graph and table below assume reinvestment of dividends and capital gain distributions.
Growth of a Hypothetical $10,000 Investment*
This graph shows the performance of a hypothetical $10,000 investment in Class R4 over a ten year period or since inception, if shorter, in comparison to (i) a broad measure of market performance and (ii) an additional index that MFS believes more closely reflects the market segments in which the fund invests.
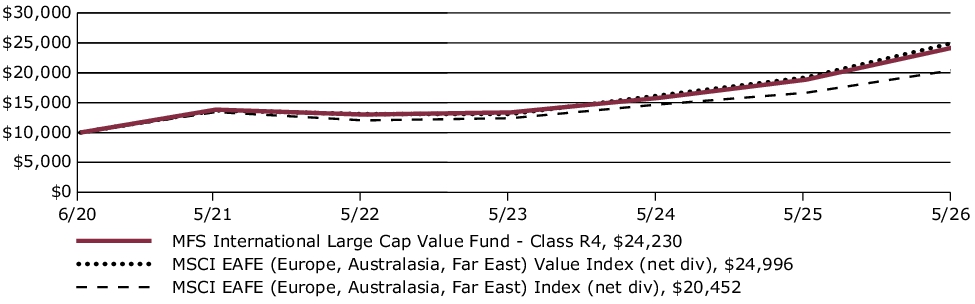
Average Annual Total Returns through 5/31/26
This table shows the average annual total returns of the class of shares noted for the periods shown, both with (if any) and without sales charges. It also shows the average annual total returns of (i) a broad measure of market performance and (ii) an additional index that MFS believes more closely reflects the market segments in which the fund invests, over the same periods.
| Share Class | 1-yr | 5-yr | Life* |
| R4 without sales charge | 28.58% | 11.87% | 16.13% |
| Comparative Benchmark(s) | |||
| MSCI EAFE (Europe, Australasia, Far East) Index (net div) ∆ | 22.80% | 8.79% | 12.84% |
| MSCI EAFE (Europe, Australasia, Far East) Value Index (net div) ∆ | 30.07% | 12.78% | 16.73% |
|
*
|
For the period from the commencement of the class's investment operations, June 30, 2020 through May 31, 2026.
|
|
∆
|
Source: FactSet Research Systems Inc.
|
Visit mfs.com/perf/r4 for more recent performance information.
FUND STATISTICS AS OF 5/31/26
| Net Assets ($): | 7,408,332,995 | Total Management Fee ($)#: | 49,906,328 | |
| Total Number of Holdings: | 95 | Portfolio Turnover Rate (%): | 23 |
# Includes the effect of any management fee waivers, if applicable.
Where the fund holds derivatives, they are not included in the total number of portfolio holdings.
PORTFOLIO COMPOSITION (BASED ON TOTAL INVESTMENTS AS OF 5/31/26)
Portfolio structure
| Equities | 97.7% |
| Money Market Funds | 2.3% |
Top ten holdings
| NatWest Group PLC | 3.3% |
| BNP Paribas S.A. | 2.8% |
| Roche Holding AG | 2.7% |
| TotalEnergies SE | 2.7% |
| Mitsubishi UFJ Financial Group, Inc. | 2.6% |
| UBS Group AG | 2.5% |
| British American Tobacco PLC | 2.3% |
| Eni S.p.A. | 2.2% |
| Glencore PLC | 2.1% |
| National Grid PLC | 2.0% |
Issuer country weightings
| United Kingdom | 26.5% |
| France | 15.9% |
| Japan | 15.3% |
| Switzerland | 7.5% |
| United States | 5.3% |
| Netherlands | 5.2% |
| Ireland | 4.5% |
| Germany | 4.4% |
| Italy | 4.3% |
| Other Countries | 11.1% |
Top ten holdings
| NatWest Group PLC | 3.3% |
| BNP Paribas S.A. | 2.8% |
| Roche Holding AG | 2.7% |
| TotalEnergies SE | 2.7% |
| Mitsubishi UFJ Financial Group, Inc. | 2.6% |
| UBS Group AG | 2.5% |
| British American Tobacco PLC | 2.3% |
| Eni S.p.A. | 2.2% |
| Glencore PLC | 2.1% |
| National Grid PLC | 2.0% |
MATERIAL FUND CHANGES
This is a summary of certain changes to the fund since June 1, 2025. For more complete information, you may review the fund's prospectus as amended, which is available at funds.mfs.com or upon request at 1‑800‑225‑2606.
Effective April 1, 2026, the management fee is computed daily and paid monthly at the following annual rates based on the fund’s average daily net assets: 0.75% up to $1 billion; 0.70% in excess of $1 billion and up to $2.5 billion; 0.65% in excess of $2.5 billion and up to $10 billion; 0.62% in excess of $10 billion and up to $20 billion; and 0.60% in excess of $20 billion.
Effective April 1, 2026, the management fee is computed daily and paid monthly at the following annual rates based on the fund’s average daily net assets: 0.75% up to $1 billion; 0.70% in excess of $1 billion and up to $2.5 billion; 0.65% in excess of $2.5 billion and up to $10 billion; 0.62% in excess of $10 billion and up to $20 billion; and 0.60% in excess of $20 billion.
This is a summary of certain changes to the fund since June 1, 2025. For more complete information, you may review the fund's prospectus as amended, which is available at funds.mfs.com or upon request at 1‑800‑225‑2606.
This report describes certain changes to the Fund that occurred during the reporting period.
FUND EXPENSES
What were the fund costs for the last year?
| (based on a hypothetical $10,000 investment) | ||
| Class Name | Costs of a $10,000 investment | Costs paid as a percentage of a $10,000 investment |
| R6 | $74 | 0.65% |
MANAGEMENT'S DISCUSSION OF FUND PERFORMANCE
-
For the twelve months ended May 31, 2026, Class R6 shares of the MFS International Large Cap Value Fund (fund) provided a total return of 28.60%, at net asset value. This compares with a return of 22.80% for the fund’s benchmark, the MSCI EAFE (Europe, Australasia, Far East) Index (net div). The fund's other benchmark, the MSCI EAFE (Europe, Australasia, Far East) Value Index (net div), generated a return of 30.07%.
-
Global equity markets reached record levels during the period, withstanding considerable volatility amid tariffs, geopolitical conflict and high levels of uncertainty. A new geopolitical event distressed markets at the end of the period as US and Israeli forces launched strikes against Iran, disrupting Mideast oil and natural gas exports. During the period, a pro-growth tax and spending bill was signed into law in the US, while in Europe, renewed focus on defense and infrastructure spending brightened the economic outlook. In Japan, the election of a pro-growth prime minister sent stocks to new highs prior to the conflict in Iran. Optimism over artificial intelligence remained high.
-
Considerable progress was made in trade talks between the US and many major trading partners, with a fragile truce between the US and China extended through late 2026. While the US Supreme Court struck down part of the Trump administration’s tariff strategy, the administration began deploying other authorities to largely replace the ones that were ruled unconstitutional.
-
Early in the period, moderating inflation pressures allowed many global central banks to ease monetary policy. Amid a difficult policymaking environment and slower job growth, the Federal Reserve resumed easing policy in September and delivered quarter-point rate cuts in October and December before pausing.
-
In fixed income markets, previously range-bound global bond yields spiked following the onset of the Middle East conflict, as energy-driven inflation fears appeared to have rattled bond investors. US rate volatility (as measured by the Merrill Lynch Option Volatility Estimate (MOVE) Index) similarly rose from intra-period lows, reflecting uncertainty around the scope and duration of the conflict and its implications for global growth. However, volatility later retracted as the risk of a broader regional military escalation appeared less likely. Global credit spreads widened only modestly before stabilizing near prior levels, supported by strong demand and resilient underlying fundamentals.
-
Top contributors to performance relative to the MSCI EAFE Value Index:
-
Security selection within the energy, materials, and financials sectors strengthened relative performance.
-
The fund's avoidance of the real estate sector and its overweight position in the information technology sector also benefited relative returns.
-
-
Top detractors from performance relative to the MSCI EAFE Value Index:
-
Security selection within the health care, consumer discretionary, and industrials sectors detracted from relative performance.
-
FUND PERFORMANCE
The fund’s past performance is not a good predictor of the fund’s future performance. The graph and table below do not reflect the deduction of taxes that a shareholder would pay on fund distributions or the redemption of fund shares. The graph and table below assume reinvestment of dividends and capital gain distributions.
Growth of a Hypothetical $10,000 Investment*
This graph shows the performance of a hypothetical $10,000 investment in Class R6 over a ten year period or since inception, if shorter, in comparison to (i) a broad measure of market performance and (ii) an additional index that MFS believes more closely reflects the market segments in which the fund invests.
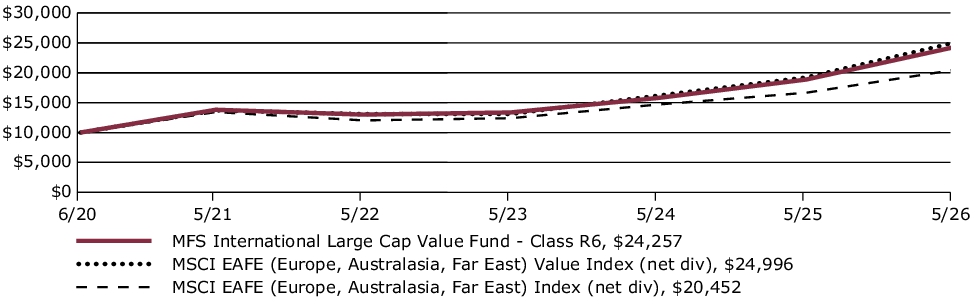
Average Annual Total Returns through 5/31/26
This table shows the average annual total returns of the class of shares noted for the periods shown, both with (if any) and without sales charges. It also shows the average annual total returns of (i) a broad measure of market performance and (ii) an additional index that MFS believes more closely reflects the market segments in which the fund invests, over the same periods.
| Share Class | 1-yr | 5-yr | Life* |
| R6 without sales charge | 28.60% | 11.93% | 16.15% |
| Comparative Benchmark(s) | |||
| MSCI EAFE (Europe, Australasia, Far East) Index (net div) ∆ | 22.80% | 8.79% | 12.84% |
| MSCI EAFE (Europe, Australasia, Far East) Value Index (net div) ∆ | 30.07% | 12.78% | 16.73% |
|
*
|
For the period from the commencement of the class's investment operations, June 30, 2020 through May 31, 2026.
|
|
∆
|
Source: FactSet Research Systems Inc.
|
Visit mfs.com/perf/r6 for more recent performance information.
FUND STATISTICS AS OF 5/31/26
| Net Assets ($): | 7,408,332,995 | Total Management Fee ($)#: | 49,906,328 | |
| Total Number of Holdings: | 95 | Portfolio Turnover Rate (%): | 23 |
# Includes the effect of any management fee waivers, if applicable.
Where the fund holds derivatives, they are not included in the total number of portfolio holdings.
PORTFOLIO COMPOSITION (BASED ON TOTAL INVESTMENTS AS OF 5/31/26)
Portfolio structure
| Equities | 97.7% |
| Money Market Funds | 2.3% |
Top ten holdings
| NatWest Group PLC | 3.3% |
| BNP Paribas S.A. | 2.8% |
| Roche Holding AG | 2.7% |
| TotalEnergies SE | 2.7% |
| Mitsubishi UFJ Financial Group, Inc. | 2.6% |
| UBS Group AG | 2.5% |
| British American Tobacco PLC | 2.3% |
| Eni S.p.A. | 2.2% |
| Glencore PLC | 2.1% |
| National Grid PLC | 2.0% |
Issuer country weightings
| United Kingdom | 26.5% |
| France | 15.9% |
| Japan | 15.3% |
| Switzerland | 7.5% |
| United States | 5.3% |
| Netherlands | 5.2% |
| Ireland | 4.5% |
| Germany | 4.4% |
| Italy | 4.3% |
| Other Countries | 11.1% |
Top ten holdings
| NatWest Group PLC | 3.3% |
| BNP Paribas S.A. | 2.8% |
| Roche Holding AG | 2.7% |
| TotalEnergies SE | 2.7% |
| Mitsubishi UFJ Financial Group, Inc. | 2.6% |
| UBS Group AG | 2.5% |
| British American Tobacco PLC | 2.3% |
| Eni S.p.A. | 2.2% |
| Glencore PLC | 2.1% |
| National Grid PLC | 2.0% |
MATERIAL FUND CHANGES
This is a summary of certain changes to the fund since June 1, 2025. For more complete information, you may review the fund's prospectus as amended, which is available at funds.mfs.com or upon request at 1‑800‑225‑2606.
Effective April 1, 2026, the management fee is computed daily and paid monthly at the following annual rates based on the fund’s average daily net assets: 0.75% up to $1 billion; 0.70% in excess of $1 billion and up to $2.5 billion; 0.65% in excess of $2.5 billion and up to $10 billion; 0.62% in excess of $10 billion and up to $20 billion; and 0.60% in excess of $20 billion.
Effective April 1, 2026, the management fee is computed daily and paid monthly at the following annual rates based on the fund’s average daily net assets: 0.75% up to $1 billion; 0.70% in excess of $1 billion and up to $2.5 billion; 0.65% in excess of $2.5 billion and up to $10 billion; 0.62% in excess of $10 billion and up to $20 billion; and 0.60% in excess of $20 billion.
This is a summary of certain changes to the fund since June 1, 2025. For more complete information, you may review the fund's prospectus as amended, which is available at funds.mfs.com or upon request at 1‑800‑225‑2606.
| [1] | Expenses are direct expenses and do not include underlying fund fees and expenses. |
| [2] | The fund itself does not pay a management fee but the underlying funds in which the fund invests do pay management fees to MFS. |
| [3] | Expenses are direct expenses and do not include underlying fund fees and expenses. |
| [4] | The fund itself does not pay a management fee but the underlying funds in which the fund invests do pay management fees to MFS. |
| [5] | Expenses are direct expenses and do not include underlying fund fees and expenses. |
| [6] | The fund itself does not pay a management fee but the underlying funds in which the fund invests do pay management fees to MFS. |
| [7] | Expenses are direct expenses and do not include underlying fund fees and expenses. |
| [8] | The fund itself does not pay a management fee but the underlying funds in which the fund invests do pay management fees to MFS. |
| [9] | Expenses are direct expenses and do not include underlying fund fees and expenses. |
| [10] | The fund itself does not pay a management fee but the underlying funds in which the fund invests do pay management fees to MFS. |
| [11] | Expenses are direct expenses and do not include underlying fund fees and expenses. |
| [12] | The fund itself does not pay a management fee but the underlying funds in which the fund invests do pay management fees to MFS. |
| [13] | Expenses are direct expenses and do not include underlying fund fees and expenses. |
| [14] | The fund itself does not pay a management fee but the underlying funds in which the fund invests do pay management fees to MFS. |
| [15] | Expenses are direct expenses and do not include underlying fund fees and expenses. |
| [16] | The fund itself does not pay a management fee but the underlying funds in which the fund invests do pay management fees to MFS. |
| [17] | Expenses are direct expenses and do not include underlying fund fees and expenses. |
| [18] | The fund itself does not pay a management fee but the underlying funds in which the fund invests do pay management fees to MFS. |
| [19] | Expenses are direct expenses and do not include underlying fund fees and expenses. |
| [20] | The fund itself does not pay a management fee but the underlying funds in which the fund invests do pay management fees to MFS. |
| [21] | Expenses are direct expenses and do not include underlying fund fees and expenses. |
| [22] | The fund itself does not pay a management fee but the underlying funds in which the fund invests do pay management fees to MFS. |
| [23] | Expenses are direct expenses and do not include underlying fund fees and expenses. |
| [24] | The fund itself does not pay a management fee but the underlying funds in which the fund invests do pay management fees to MFS. |
| [25] | Expenses are direct expenses and do not include underlying fund fees and expenses. |
| [26] | The fund itself does not pay a management fee but the underlying funds in which the fund invests do pay management fees to MFS. |
| [27] | Expenses are direct expenses and do not include underlying fund fees and expenses. |
| [28] | The fund itself does not pay a management fee but the underlying funds in which the fund invests do pay management fees to MFS. |
| [29] | Expenses are direct expenses and do not include underlying fund fees and expenses. |
| [30] | The fund itself does not pay a management fee but the underlying funds in which the fund invests do pay management fees to MFS. |
| [31] | Expenses are direct expenses and do not include underlying fund fees and expenses. |
| [32] | The fund itself does not pay a management fee but the underlying funds in which the fund invests do pay management fees to MFS. |
| [33] | Expenses are direct expenses and do not include underlying fund fees and expenses. |
| [34] | The fund itself does not pay a management fee but the underlying funds in which the fund invests do pay management fees to MFS. |
| [35] | Expenses are direct expenses and do not include underlying fund fees and expenses. |
| [36] | The fund itself does not pay a management fee but the underlying funds in which the fund invests do pay management fees to MFS. |
| [37] | Expenses are direct expenses and do not include underlying fund fees and expenses. |
| [38] | The fund itself does not pay a management fee but the underlying funds in which the fund invests do pay management fees to MFS. |
| [39] | Expenses are direct expenses and do not include underlying fund fees and expenses. |
| [40] | The fund itself does not pay a management fee but the underlying funds in which the fund invests do pay management fees to MFS. |
| [41] | Expenses are direct expenses and do not include underlying fund fees and expenses. |
| [42] | The fund itself does not pay a management fee but the underlying funds in which the fund invests do pay management fees to MFS. |
| [43] | Expenses are direct expenses and do not include underlying fund fees and expenses. |
| [44] | The fund itself does not pay a management fee but the underlying funds in which the fund invests do pay management fees to MFS. |
| [45] | Expenses are direct expenses and do not include underlying fund fees and expenses. |
| [46] | The fund itself does not pay a management fee but the underlying funds in which the fund invests do pay management fees to MFS. |
| [47] | Expenses are direct expenses and do not include underlying fund fees and expenses. |
| [48] | The fund itself does not pay a management fee but the underlying funds in which the fund invests do pay management fees to MFS. |
| [49] | Expenses are direct expenses and do not include underlying fund fees and expenses. |
| [50] | The fund itself does not pay a management fee but the underlying funds in which the fund invests do pay management fees to MFS. |
| [51] | Expenses are direct expenses and do not include underlying fund fees and expenses. |
| [52] | The fund itself does not pay a management fee but the underlying funds in which the fund invests do pay management fees to MFS. |
| [53] | Expenses are direct expenses and do not include underlying fund fees and expenses. |
| [54] | The fund itself does not pay a management fee but the underlying funds in which the fund invests do pay management fees to MFS. |
| [55] | Includes the effect of any management fee waivers, if applicable. |
| [56] | Includes the effect of any management fee waivers, if applicable. |
| [57] | Includes the effect of any management fee waivers, if applicable. |
| [58] | Includes the effect of any management fee waivers, if applicable. |
| [59] | Includes the effect of any management fee waivers, if applicable. |
| [60] | Includes the effect of any management fee waivers, if applicable. |
| [61] | Includes the effect of any management fee waivers, if applicable. |
| [62] | Includes the effect of any management fee waivers, if applicable. |
| [63] | Includes the effect of any management fee waivers, if applicable. |
| [64] | Expenses are direct expenses and do not include underlying fund fees and expenses. |
| [65] | The fund itself does not pay a management fee but the underlying funds in which the fund invests do pay management fees to MFS. |
| [66] | Expenses are direct expenses and do not include underlying fund fees and expenses. |
| [67] | The fund itself does not pay a management fee but the underlying funds in which the fund invests do pay management fees to MFS. |
| [68] | Expenses are direct expenses and do not include underlying fund fees and expenses. |
| [69] | The fund itself does not pay a management fee but the underlying funds in which the fund invests do pay management fees to MFS. |
| [70] | Expenses are direct expenses and do not include underlying fund fees and expenses. |
| [71] | The fund itself does not pay a management fee but the underlying funds in which the fund invests do pay management fees to MFS. |
| [72] | Expenses are direct expenses and do not include underlying fund fees and expenses. |
| [73] | The fund itself does not pay a management fee but the underlying funds in which the fund invests do pay management fees to MFS. |
| [74] | Expenses are direct expenses and do not include underlying fund fees and expenses. |
| [75] | The fund itself does not pay a management fee but the underlying funds in which the fund invests do pay management fees to MFS. |
| [76] | Expenses are direct expenses and do not include underlying fund fees and expenses. |
| [77] | The fund itself does not pay a management fee but the underlying funds in which the fund invests do pay management fees to MFS. |
| [78] | Expenses are direct expenses and do not include underlying fund fees and expenses. |
| [79] | The fund itself does not pay a management fee but the underlying funds in which the fund invests do pay management fees to MFS. |
| [80] | Expenses are direct expenses and do not include underlying fund fees and expenses. |
| [81] | The fund itself does not pay a management fee but the underlying funds in which the fund invests do pay management fees to MFS. |
| [82] | Expenses are direct expenses and do not include underlying fund fees and expenses. |
| [83] | The fund itself does not pay a management fee but the underlying funds in which the fund invests do pay management fees to MFS. |
| [84] | Expenses are direct expenses and do not include underlying fund fees and expenses. |
| [85] | The fund itself does not pay a management fee but the underlying funds in which the fund invests do pay management fees to MFS. |
| [86] | Expenses are direct expenses and do not include underlying fund fees and expenses. |
| [87] | The fund itself does not pay a management fee but the underlying funds in which the fund invests do pay management fees to MFS. |
| [88] | Expenses are direct expenses and do not include underlying fund fees and expenses. |
| [89] | The fund itself does not pay a management fee but the underlying funds in which the fund invests do pay management fees to MFS. |
| [90] | Expenses are direct expenses and do not include underlying fund fees and expenses. |
| [91] | The fund itself does not pay a management fee but the underlying funds in which the fund invests do pay management fees to MFS. |
| [92] | Expenses are direct expenses and do not include underlying fund fees and expenses. |
| [93] | The fund itself does not pay a management fee but the underlying funds in which the fund invests do pay management fees to MFS. |
| [94] | Expenses are direct expenses and do not include underlying fund fees and expenses. |
| [95] | The fund itself does not pay a management fee but the underlying funds in which the fund invests do pay management fees to MFS. |
| [96] | Expenses are direct expenses and do not include underlying fund fees and expenses. |
| [97] | The fund itself does not pay a management fee but the underlying funds in which the fund invests do pay management fees to MFS. |
| [98] | Expenses are direct expenses and do not include underlying fund fees and expenses. |
| [99] | The fund itself does not pay a management fee but the underlying funds in which the fund invests do pay management fees to MFS. |
| [100] | Includes the effect of any management fee waivers, if applicable. |
| [101] | Includes the effect of any management fee waivers, if applicable. |
| [102] | Includes the effect of any management fee waivers, if applicable. |
| [103] | Includes the effect of any management fee waivers, if applicable. |
| [104] | Includes the effect of any management fee waivers, if applicable. |
| [105] | Includes the effect of any management fee waivers, if applicable. |
| [106] | Includes the effect of any management fee waivers, if applicable. |
| [107] | Includes the effect of any management fee waivers, if applicable. |
| [108] | Includes the effect of any management fee waivers, if applicable. |
| [109] | Includes the effect of any management fee waivers, if applicable. |
| [110] | Includes the effect of any management fee waivers, if applicable. |
| [111] | Includes the effect of any management fee waivers, if applicable. |
| [112] | Includes the effect of any management fee waivers, if applicable. |
| [113] | Includes the effect of any management fee waivers, if applicable. |
| [114] | Includes the effect of any management fee waivers, if applicable. |
| [115] | Includes the effect of any management fee waivers, if applicable. |
| [116] | Includes the effect of any management fee waivers, if applicable. |
| [117] | Includes the effect of any management fee waivers, if applicable. |
| [118] | Expenses are direct expenses and do not include underlying fund fees and expenses. |
| [119] | Includes the effect of any management fee waivers, if applicable. |
| [120] | Expenses are direct expenses and do not include underlying fund fees and expenses. |
| [121] | Includes the effect of any management fee waivers, if applicable. |
| [122] | Expenses are direct expenses and do not include underlying fund fees and expenses. |
| [123] | Includes the effect of any management fee waivers, if applicable. |
| [124] | Expenses are direct expenses and do not include underlying fund fees and expenses. |
| [125] | Includes the effect of any management fee waivers, if applicable. |
| [126] | Expenses are direct expenses and do not include underlying fund fees and expenses. |
| [127] | Includes the effect of any management fee waivers, if applicable. |
| [128] | Expenses are direct expenses and do not include underlying fund fees and expenses. |
| [129] | Includes the effect of any management fee waivers, if applicable. |
| [130] | Expenses are direct expenses and do not include underlying fund fees and expenses. |
| [131] | Includes the effect of any management fee waivers, if applicable. |
| [132] | Expenses are direct expenses and do not include underlying fund fees and expenses. |
| [133] | Includes the effect of any management fee waivers, if applicable. |
| [134] | Expenses are direct expenses and do not include underlying fund fees and expenses. |
| [135] | Includes the effect of any management fee waivers, if applicable. |
| [136] | Includes the effect of any management fee waivers, if applicable. |
| [137] | Includes the effect of any management fee waivers, if applicable. |
| [138] | Includes the effect of any management fee waivers, if applicable. |
| [139] | Includes the effect of any management fee waivers, if applicable. |
| [140] | Includes the effect of any management fee waivers, if applicable. |
| [141] | Includes the effect of any management fee waivers, if applicable. |
| [142] | Includes the effect of any management fee waivers, if applicable. |
| [143] | Includes the effect of any management fee waivers, if applicable. |
| [144] | Includes the effect of any management fee waivers, if applicable. |
| [145] | Includes the effect of any management fee waivers, if applicable. |
| [146] | Includes the effect of any management fee waivers, if applicable. |
| [147] | Includes the effect of any management fee waivers, if applicable. |
| [148] | Includes the effect of any management fee waivers, if applicable. |
| [149] | Includes the effect of any management fee waivers, if applicable. |
| [150] | Includes the effect of any management fee waivers, if applicable. |
| [151] | Includes the effect of any management fee waivers, if applicable. |
| [152] | Includes the effect of any management fee waivers, if applicable. |
| [153] | Includes the effect of any management fee waivers, if applicable. |
| [154] | Includes the effect of any management fee waivers, if applicable. |
| [155] | Includes the effect of any management fee waivers, if applicable. |
| [156] | Includes the effect of any management fee waivers, if applicable. |
| [157] | Includes the effect of any management fee waivers, if applicable. |
| [158] | Includes the effect of any management fee waivers, if applicable. |
| [159] | Includes the effect of any management fee waivers, if applicable. |
| [160] | Includes the effect of any management fee waivers, if applicable. |
| [161] | Includes the effect of any management fee waivers, if applicable. |
| [162] | Includes the effect of any management fee waivers, if applicable. |
| [163] | Includes the effect of any management fee waivers, if applicable. |
| [164] | Includes the effect of any management fee waivers, if applicable. |
| [165] | Includes the effect of any management fee waivers, if applicable. |
| [166] | Includes the effect of any management fee waivers, if applicable. |
| [167] | Includes the effect of any management fee waivers, if applicable. |
| [168] | Includes the effect of any management fee waivers, if applicable. |
| [169] | Includes the effect of any management fee waivers, if applicable. |
| [170] | Includes the effect of any management fee waivers, if applicable. |
| [171] | Includes the effect of any management fee waivers, if applicable. |
| [172] | Includes the effect of any management fee waivers, if applicable. |
| [173] | Includes the effect of any management fee waivers, if applicable. |
| [174] | Includes the effect of any management fee waivers, if applicable. |
| [175] | Includes the effect of any management fee waivers, if applicable. |
| [176] | Includes the effect of any management fee waivers, if applicable. |
| [177] | Includes the effect of any management fee waivers, if applicable. |
| [178] | Includes the effect of any management fee waivers, if applicable. |
| [179] | Includes the effect of any management fee waivers, if applicable. |