
R E D W O O D T R U S T . C O M Q2 2026 Redwood Review July 28, 2026 Exhibit 99.3
2 Cautionary Statement/ Forward-Looking Statements This presentation contains forward-looking statements, including statements regarding our 2026 forward outlook and strategic priorities, key drivers to increase earnings, book value, mortgage banking volumes and market share and statements regarding potential acquisition volumes and estimated returns for our joint ventures, estimated returns on capital redeployed from legacy investments to core segments, and potential unrealized gains on an investment at an RWT Horizons portfolio company. Forward-looking statements involve numerous risks and uncertainties. Our actual results may differ from our beliefs, expectations, estimates, and projections and, consequently, you should not rely on these forward-looking statements as predictions of future events. Forward-looking statements are not historical in nature and can be identified by words such as “anticipate,” “estimate,” “will,” “should,” “expect,” “believe,” “intend,” “seek,” “plan” and similar expressions or their negative forms, or by references to strategy, plans, opportunities, or intentions. These forward-looking statements are subject to risks and uncertainties, including, among other things, those described in the Company’s Annual Report on Form 10-K for the year ended December 31, 2025 and any subsequent Quarterly Reports on Form 10-K, Form 10-Q and Form 8-K under the caption “Risk Factors.” Other risks, uncertainties, and factors that could cause actual results to differ materially from those projected may be described from time to time in reports the Company files with the Securities and Exchange Commission, including Current Reports on Form 8-K. Additionally, this presentation contains estimates and information concerning our industry, including market size and growth rates of the markets in which we participate, that are based on industry publications and reports. This information involves many assumptions and limitations, and you are cautioned not to give undue weight to these estimates. We have not independently verified the accuracy or completeness of the data contained in these industry publications and reports. The industry in which we operate is subject to a high degree of uncertainty and risk due to a variety of factors, including those referred to above, that could cause results to differ materially from those expressed in these publications and reports.
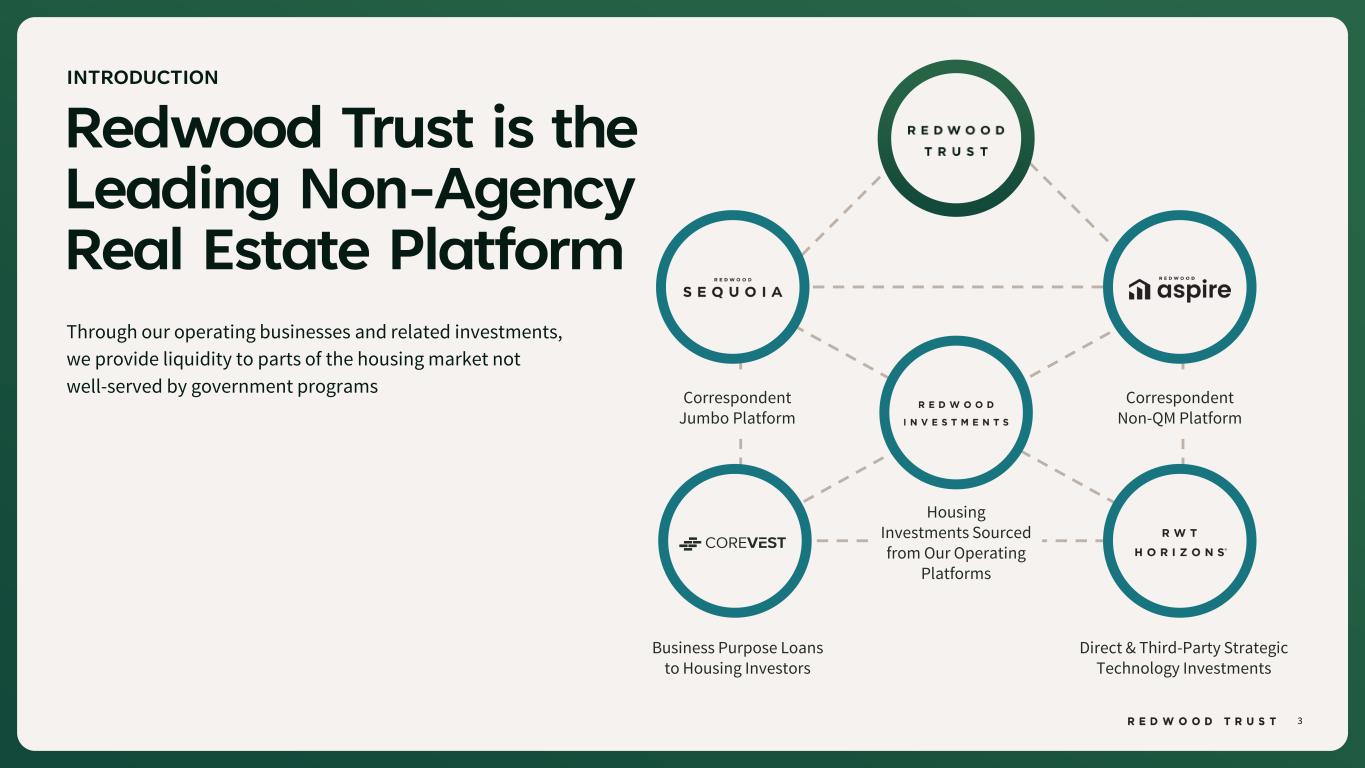
3 Redwood Trust is the Leading Non-Agency Real Estate Platform Through our operating businesses and related investments, we provide liquidity to parts of the housing market not well-served by government programs INTRODUCTION Correspondent Non-QM Platform Correspondent Jumbo Platform Direct & Third-Party Strategic Technology Investments Business Purpose Loans to Housing Investors Housing Investments Sourced from Our Operating Platforms

4 Standard-bearer for private market liquidity Not an active GSE originator/ servicer Not a bank Redwood MBS sets mortgage rates for most non-Agency originators 32 Year Track Record (NYSE: RWT) Mission Focused FANNIE / FREDDIE Standard-bearer for mortgage market liquidity Governance framework focused on prudent profitability Widely-adopted loan size, credit & underwriting standards 140+ Year Combined Track Record Mission Focused REDWOOD TRUST Redwood’s Mission is to make quality housing – whether rented or owned – accessible to all American households ARTNERSHIP We are the Leading Alternative to the GSEs in the Private Sector WHY REDWOOD?
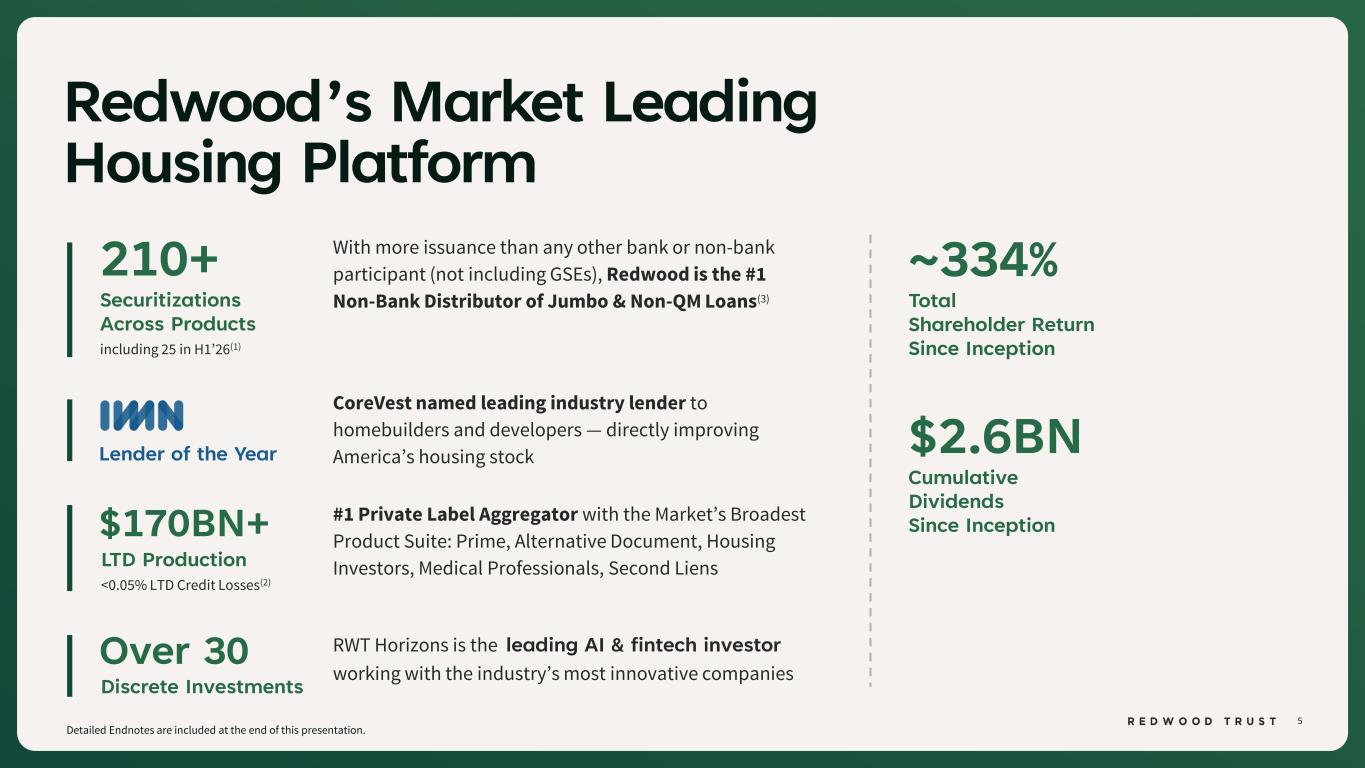
5 Redwood’s Market Leading Housing Platform With more issuance than any other bank or non-bank participant (not including GSEs), Redwood is the #1 Non-Bank Distributor of Jumbo & Non-QM Loans(3) CoreVest named leading industry lender to homebuilders and developers — directly improving America’s housing stock RWT Horizons is the leading AI & fintech investor working with the industry’s most innovative companies #1 Private Label Aggregator with the Market’s Broadest Product Suite: Prime, Alternative Document, Housing Investors, Medical Professionals, Second Liens 210+ Securitizations Across Products including 25 in H1’26(1) Lender of the Year Discrete Investments Over 30 $170BN+ LTD Production <0.05% LTD Credit Losses(2) ~334% Total Shareholder Return Since Inception $2.6BN Cumulative Dividends Since Inception Detailed Endnotes are included at the end of this presentation.
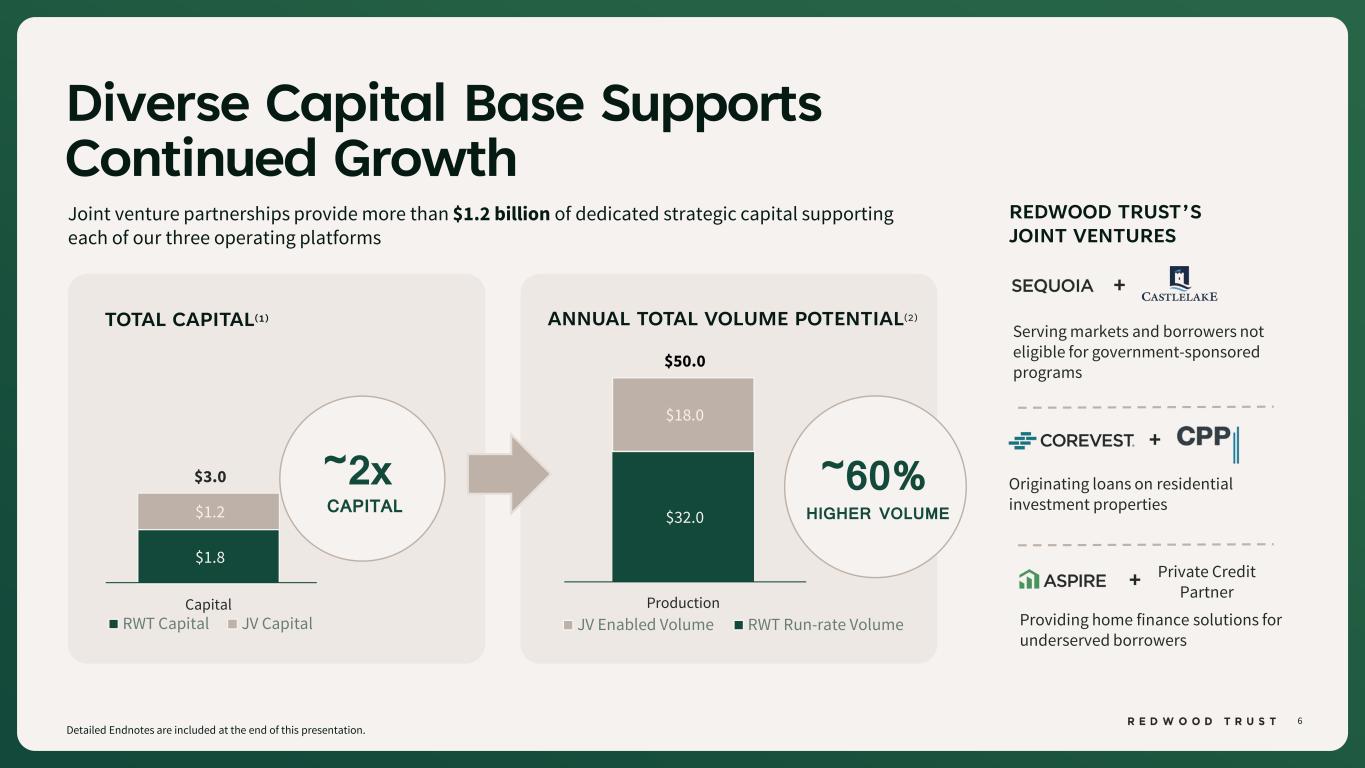
6 Providing home finance solutions for underserved borrowers Originating loans on residential investment properties + Diverse Capital Base Supports Continued Growth $1.8 $1.2 $3.0 Capital RWT Capital JV Capital Serving markets and borrowers not eligible for government-sponsored programs + Joint venture partnerships provide more than $1.2 billion of dedicated strategic capital supporting each of our three operating platforms $32.0 $18.0 $50.0 Production JV Enabled Volume RWT Run-rate Volume TOTAL CAPITAL(1) ANNUAL TOTAL VOLUME POTENTIAL(2) ~2x CAPITAL ~60% HIGHER VOLUME REDWOOD TRUST’S JOINT VENTURES Detailed Endnotes are included at the end of this presentation. + Private Credit Partner
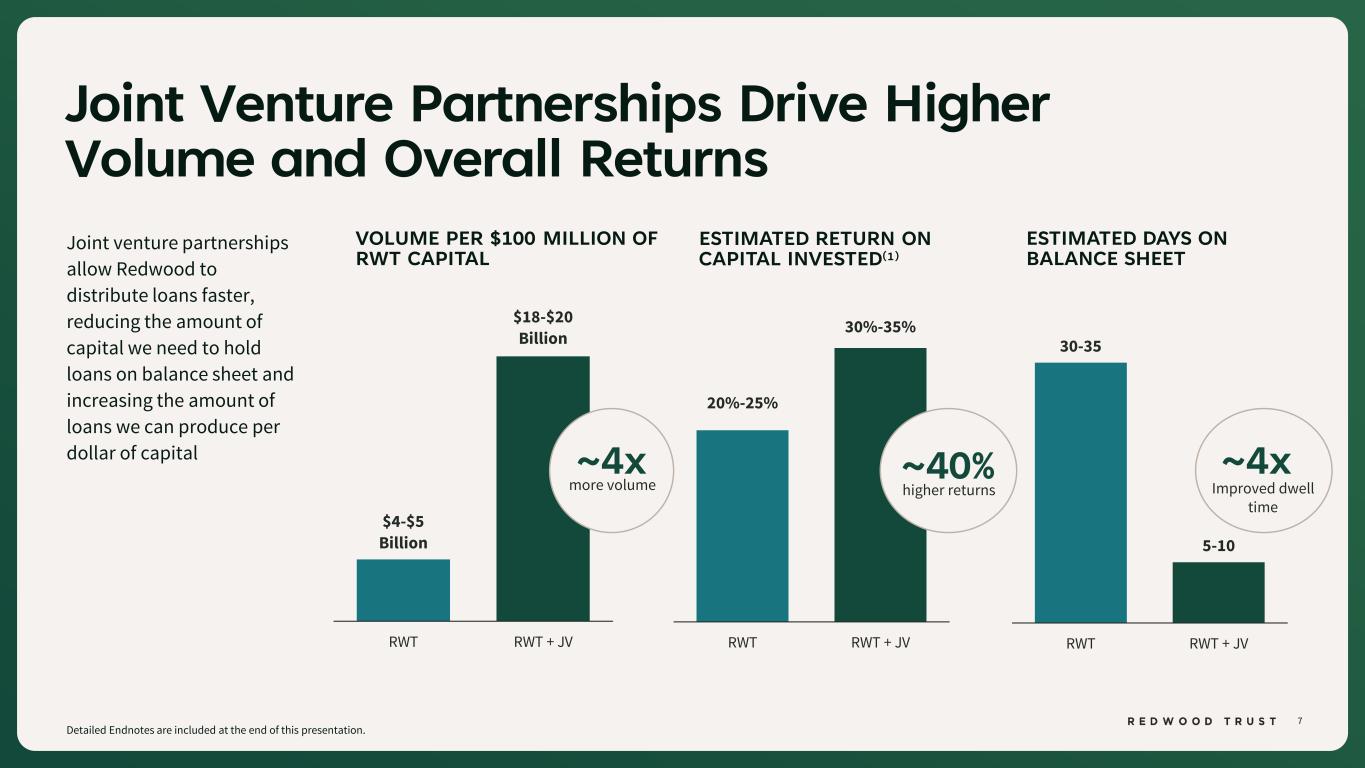
7 Joint Venture Partnerships Drive Higher Volume and Overall Returns $4-$5 Billion $18-$20 Billion RWT RWT + JV 20%-25% 30%-35% RWT RWT + JV VOLUME PER $100 MILLION OF RWT CAPITAL ~4x more volume ESTIMATED RETURN ON CAPITAL INVESTED(1) Joint venture partnerships allow Redwood to distribute loans faster, reducing the amount of capital we need to hold loans on balance sheet and increasing the amount of loans we can produce per dollar of capital Detailed Endnotes are included at the end of this presentation. 30-35 5-10 RWT RWT + JV ESTIMATED DAYS ON BALANCE SHEET ~40% higher returns ~4x Improved dwell time
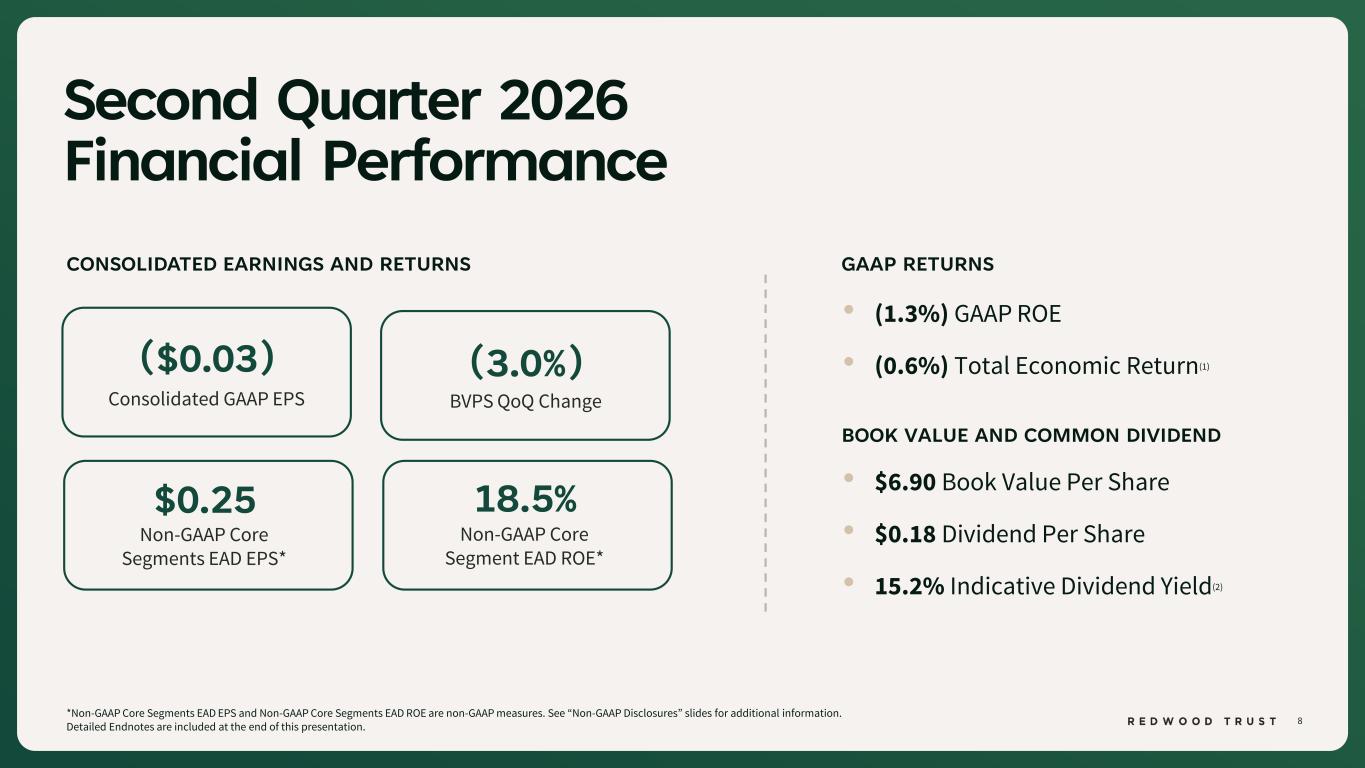
8 Second Quarter 2026 Financial Performance *Non-GAAP Core Segments EAD EPS and Non-GAAP Core Segments EAD ROE are non-GAAP measures. See “Non-GAAP Disclosures” slides for additional information. Detailed Endnotes are included at the end of this presentation. CONSOLIDATED EARNINGS AND RETURNS GAAP RETURNS • $6.90 Book Value Per Share • $0.18 Dividend Per Share • 15.2% Indicative Dividend Yield(2) ($0.03) Consolidated GAAP EPS (3.0%) BVPS QoQ Change $0.25 Non-GAAP Core Segments EAD EPS* 18.5% Non-GAAP Core Segment EAD ROE* BOOK VALUE AND COMMON DIVIDEND • (1.3%) GAAP ROE • (0.6%) Total Economic Return(1)
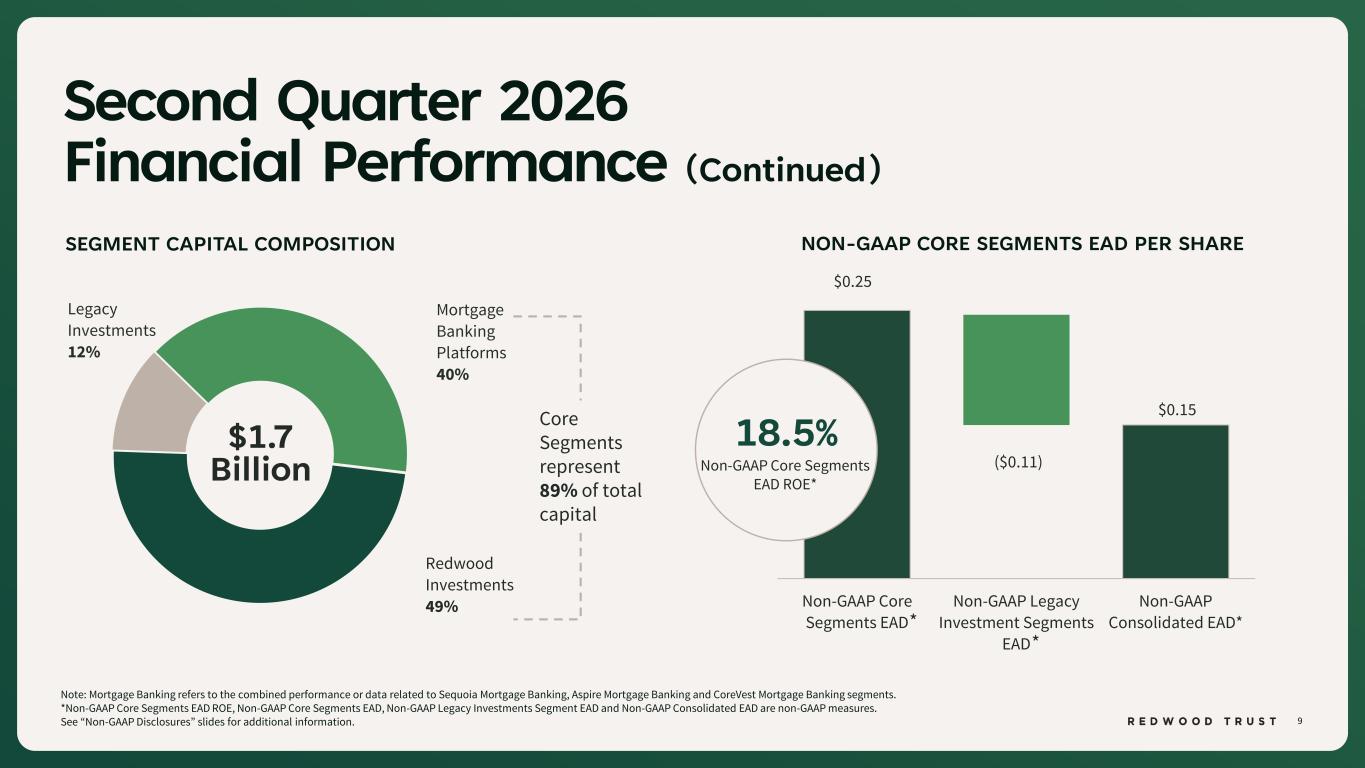
9 $0.25 ($0.11) $0.15 Non-GAAP Core Segments EAD Non-GAAP Legacy Investment Segments EAD Non-GAAP Consolidated EAD* Legacy Investments 12% Mortgage Banking Platforms 40% Redwood Investments 49% Second Quarter 2026 Financial Performance (Continued) Note: Mortgage Banking refers to the combined performance or data related to Sequoia Mortgage Banking, Aspire Mortgage Banking and CoreVest Mortgage Banking segments. *Non-GAAP Core Segments EAD ROE, Non-GAAP Core Segments EAD, Non-GAAP Legacy Investments Segment EAD and Non-GAAP Consolidated EAD are non-GAAP measures. See “Non-GAAP Disclosures” slides for additional information. SEGMENT CAPITAL COMPOSITION $1.7 Billion NON-GAAP CORE SEGMENTS EAD PER SHARE * * Core Segments represent 89% of total capital 18.5% Non-GAAP Core Segments EAD ROE*
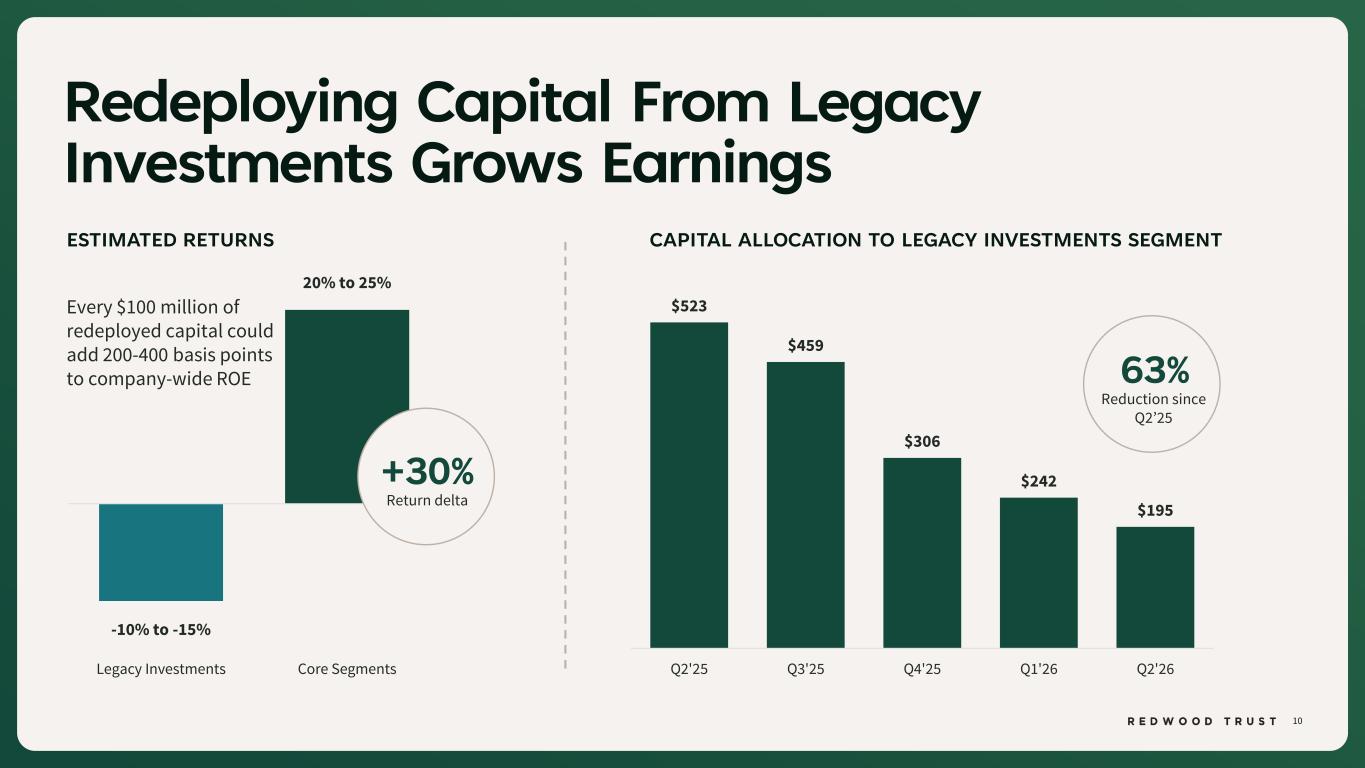
10 Redeploying Capital From Legacy Investments Grows Earnings ESTIMATED RETURNS $523 $459 $306 $242 $195 Q2'25 Q3'25 Q4'25 Q1'26 Q2'26 CAPITAL ALLOCATION TO LEGACY INVESTMENTS SEGMENT 63% Reduction since Q2’25 -10% to -15% 20% to 25% Legacy Investments Core Segments Every $100 million of redeployed capital could add 200-400 basis points to company-wide ROE +30% Return delta
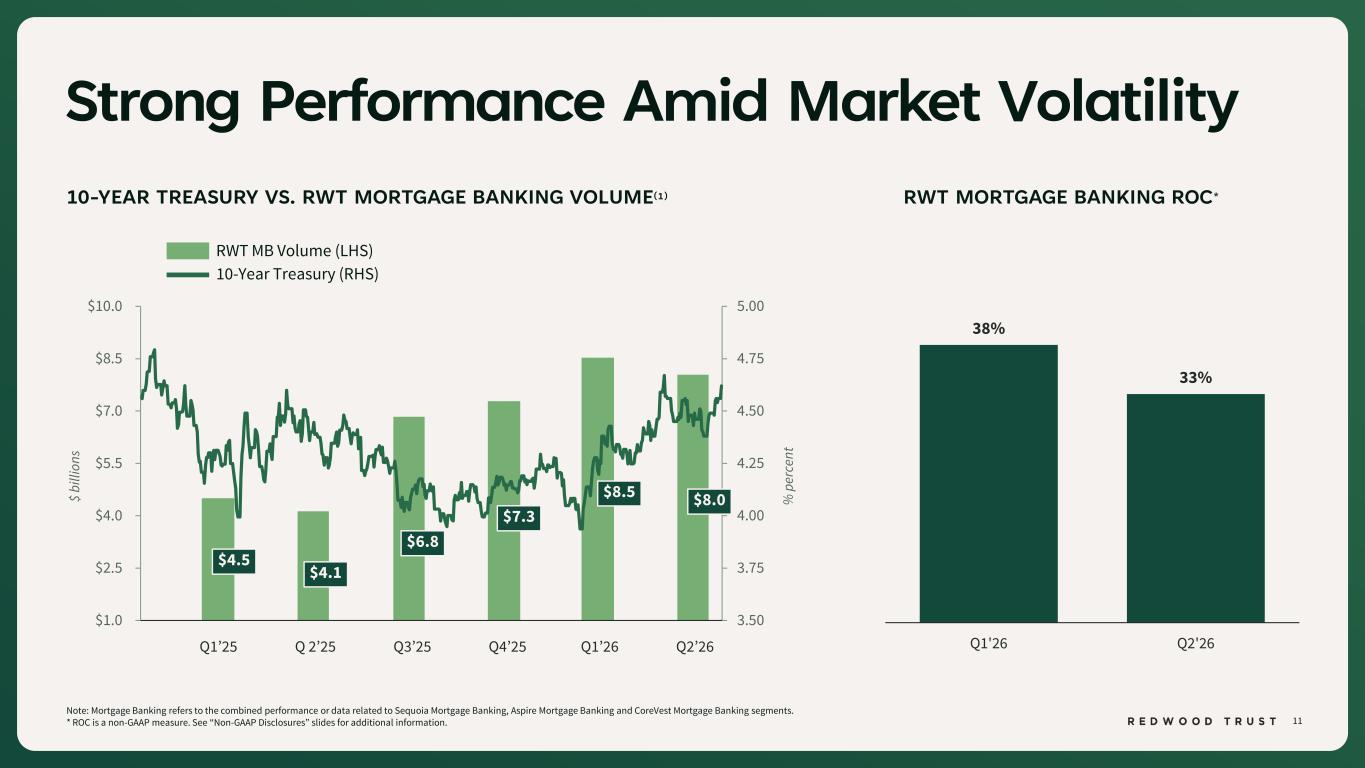
11 38% 33% Q1'26 Q2'26 3.50 3.75 4.00 4.25 4.50 4.75 5.00 $1.0 $2.5 $4.0 $5.5 $7.0 $8.5 $10.0 Jan-25 Mar-25 May-25 Jul-25 Sep-25 Nov-25 Jan-26 Mar-26 May-26 Jul-26 Strong Performance Amid Market Volatility Note: Mortgage Banking refers to the combined performance or data related to Sequoia Mortgage Banking, Aspire Mortgage Banking and CoreVest Mortgage Banking segments. * ROC is a non-GAAP measure. See “Non-GAAP Disclosures” slides for additional information. 10-YEAR TREASURY VS. RWT MORTGAGE BANKING VOLUME(1) $ bi lli on s RWT MORTGAGE BANKING ROC* Q1’25 Q 2’25 Q3’25 Q4’25 Q1’26 Q2’26 RWT MB Volume (LHS) 10-Year Treasury (RHS) % p er ce nt $8.5 $7.3 $6.8 $4.1 $4.5 $8.0
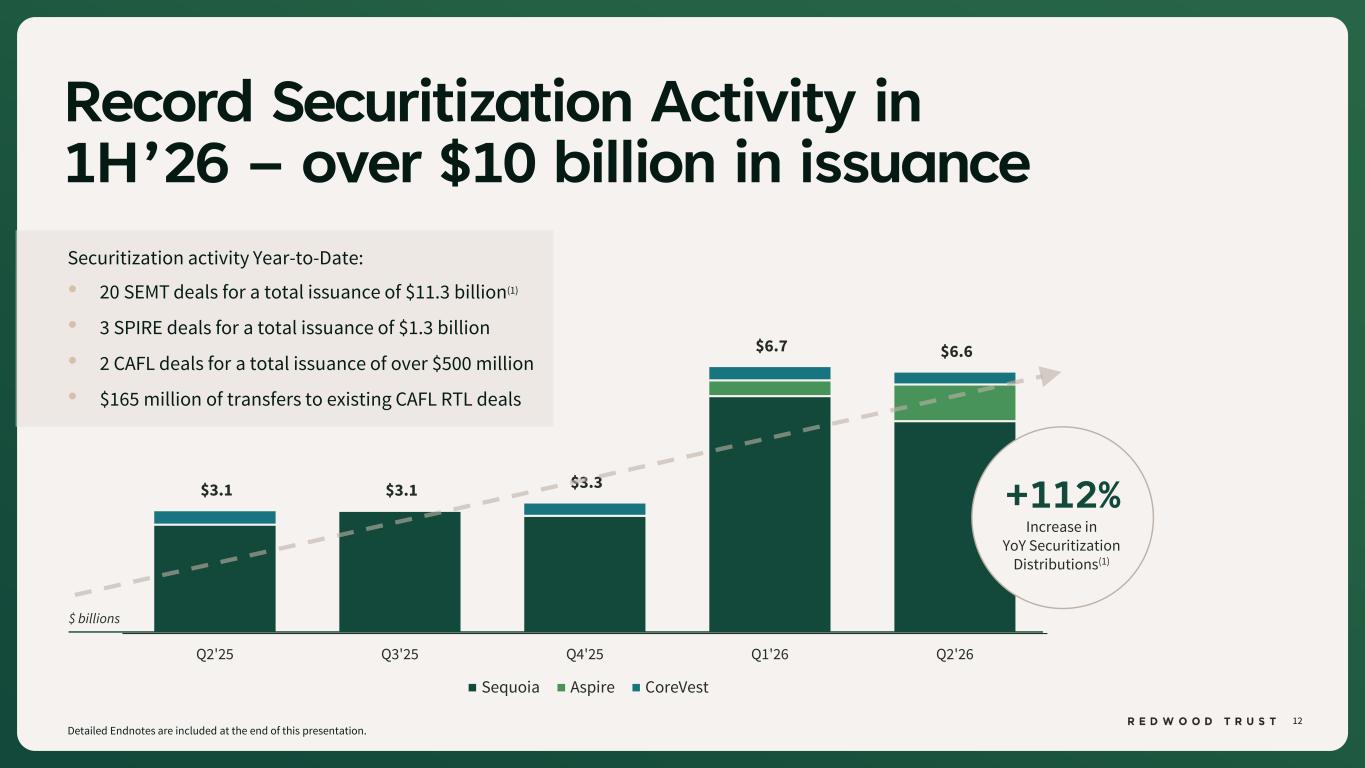
12 $3.1 $3.1 $3.3 $6.7 $6.6 Q2'25 Q3'25 Q4'25 Q1'26 Q2'26 Sequoia Aspire CoreVest Record Securitization Activity in 1H’26 – over $10 billion in issuance Securitization activity Year-to-Date: • 20 SEMT deals for a total issuance of $11.3 billion(1) • 3 SPIRE deals for a total issuance of $1.3 billion • 2 CAFL deals for a total issuance of over $500 million • $165 million of transfers to existing CAFL RTL deals $ billions +112% Increase in YoY Securitization Distributions(1) Detailed Endnotes are included at the end of this presentation.
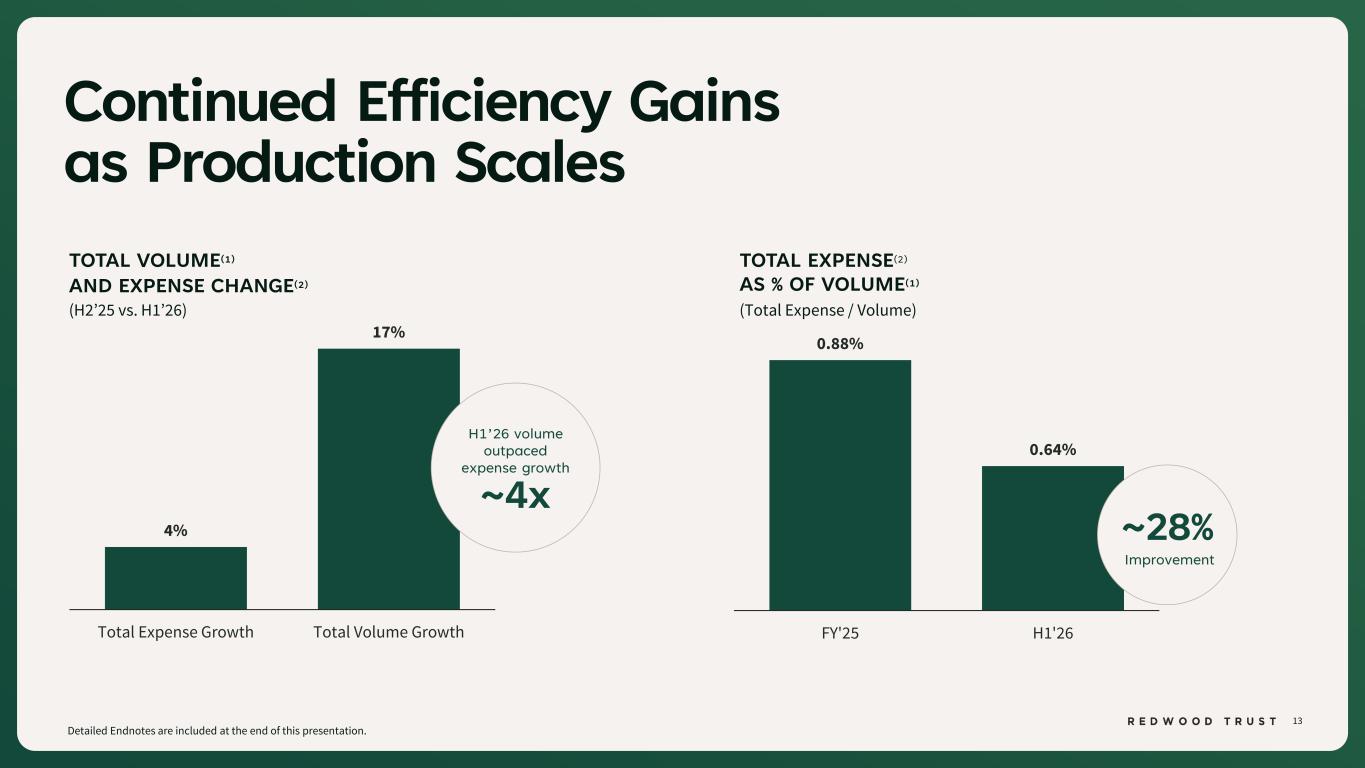
13 Detailed Endnotes are included at the end of this presentation. TOTAL VOLUME(1) AND EXPENSE CHANGE(2) (H2’25 vs. H1’26) Continued Efficiency Gains as Production Scales 4% 17% Total Expense Growth Total Volume Growth H1’26 volume outpaced expense growth ~4x 0.88% 0.64% FY'25 H1'26 ~28% Improvement TOTAL EXPENSE(2) AS % OF VOLUME(1) (Total Expense / Volume)
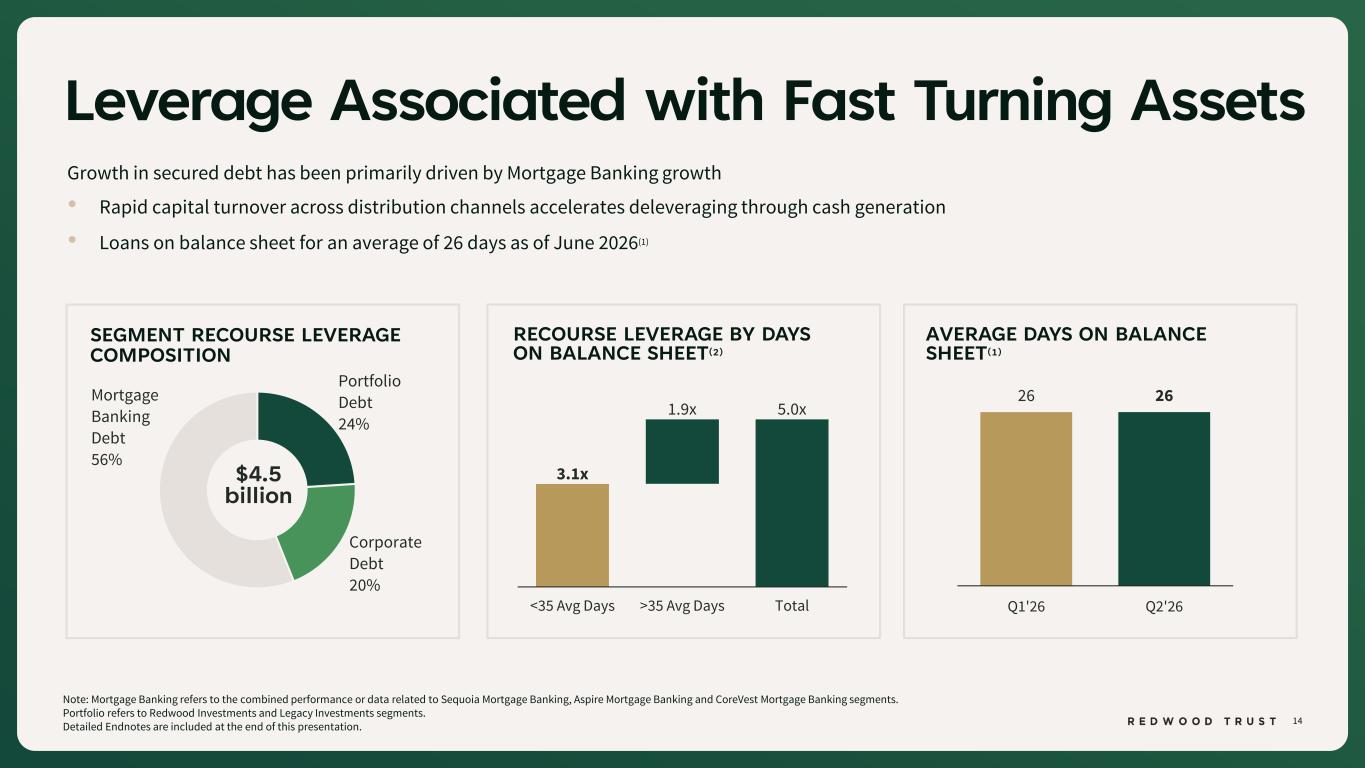
14 26 26 Q1'26 Q2'26 Portfolio Debt 24% Corporate Debt 20% Mortgage Banking Debt 56% Leverage Associated with Fast Turning Assets Growth in secured debt has been primarily driven by Mortgage Banking growth • Rapid capital turnover across distribution channels accelerates deleveraging through cash generation • Loans on balance sheet for an average of 26 days as of June 2026(1) Note: Mortgage Banking refers to the combined performance or data related to Sequoia Mortgage Banking, Aspire Mortgage Banking and CoreVest Mortgage Banking segments. Portfolio refers to Redwood Investments and Legacy Investments segments. Detailed Endnotes are included at the end of this presentation. SEGMENT RECOURSE LEVERAGE COMPOSITION RECOURSE LEVERAGE BY DAYS ON BALANCE SHEET(2) $4.5 billion AVERAGE DAYS ON BALANCE SHEET(1) 1.9x 5.0x 3.1x <35 Avg Days >35 Avg Days Total
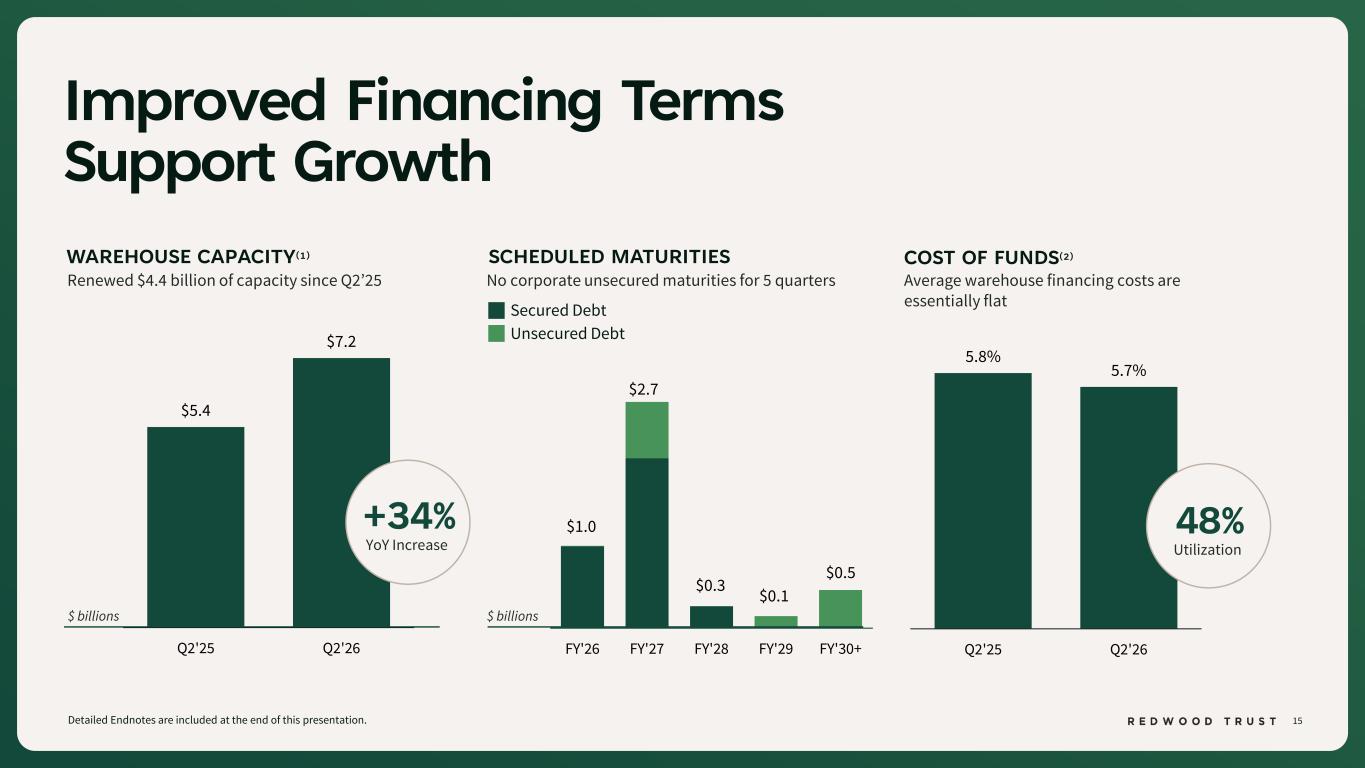
15 5.8% 5.7% Q2'25 Q2'26 $5.4 $7.2 Q2'25 Q2'26 $1.0 $2.7 $0.3 $0.1 $0.5 FY'26 FY'27 FY'28 FY'29 FY'30+ Improved Financing Terms Support Growth Detailed Endnotes are included at the end of this presentation. SCHEDULED MATURITIESWAREHOUSE CAPACITY(1) COST OF FUNDS(2) $ billions Average warehouse financing costs are essentially flat No corporate unsecured maturities for 5 quartersRenewed $4.4 billion of capacity since Q2’25 $ billions Secured Debt Unsecured Debt 48% Utilization +34% YoY Increase
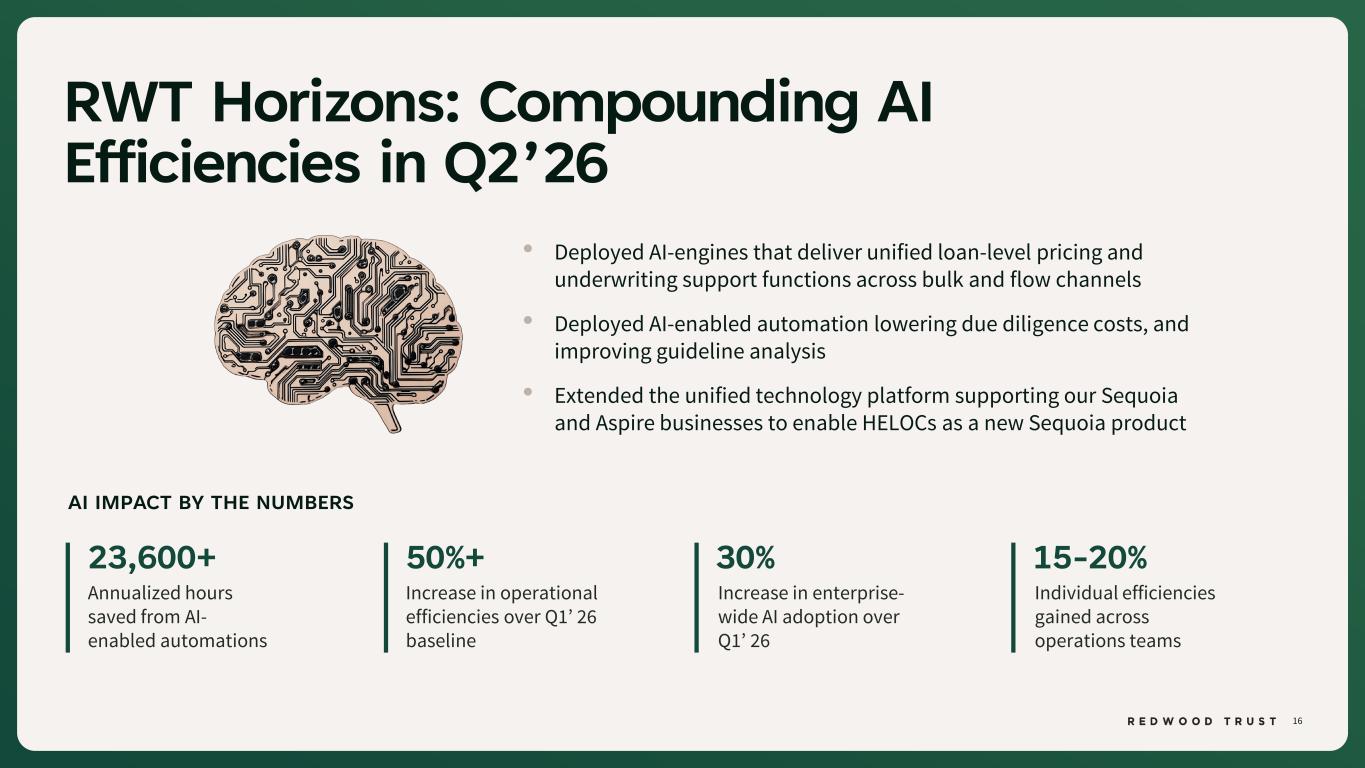
16 RWT Horizons: Compounding AI Efficiencies in Q2’26 • Deployed AI-engines that deliver unified loan-level pricing and underwriting support functions across bulk and flow channels • Deployed AI-enabled automation lowering due diligence costs, and improving guideline analysis • Extended the unified technology platform supporting our Sequoia and Aspire businesses to enable HELOCs as a new Sequoia product AI IMPACT BY THE NUMBERS Increase in operational efficiencies over Q1’ 26 baseline 50%+ Annualized hours saved from AI- enabled automations 23,600+ Increase in enterprise- wide AI adoption over Q1’ 26 30% Individual efficiencies gained across operations teams 15-20%
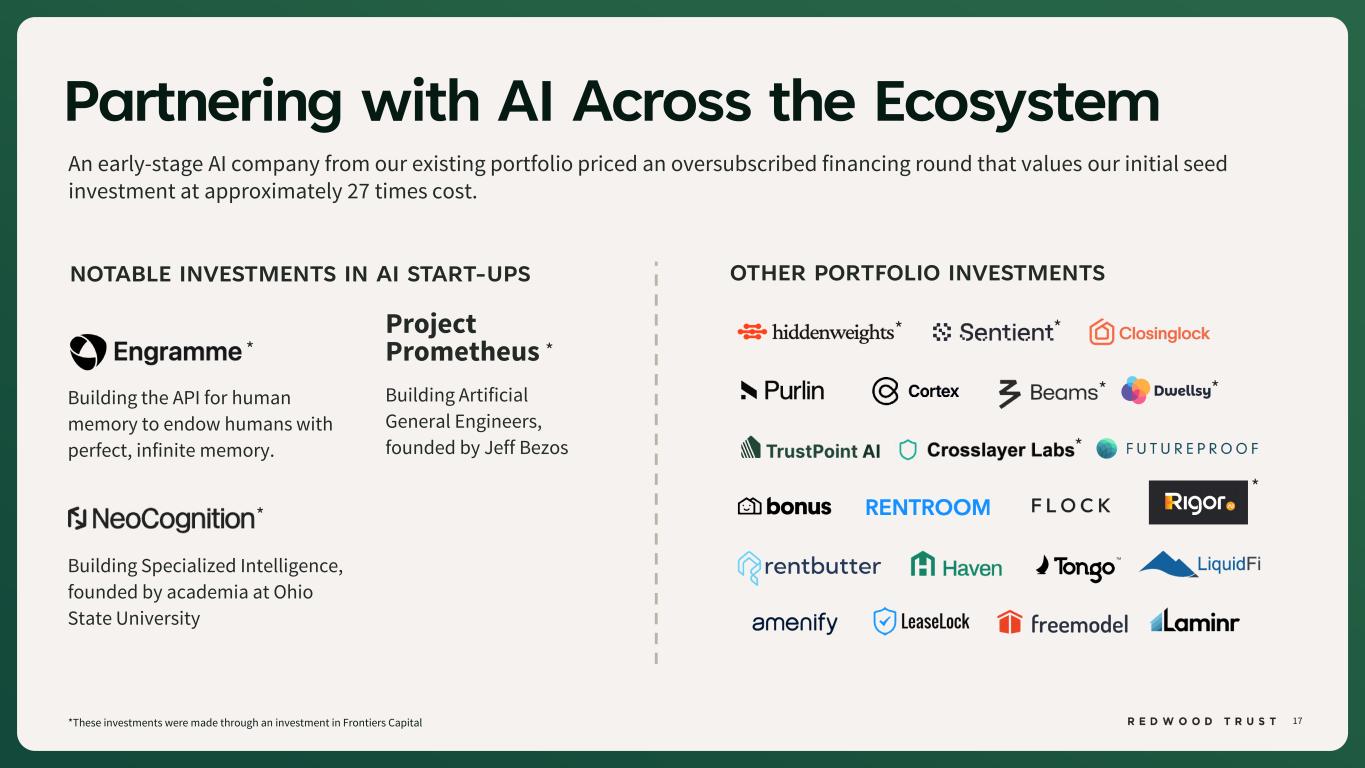
17 Partnering with AI Across the Ecosystem *These investments were made through an investment in Frontiers Capital NOTABLE INVESTMENTS IN AI START-UPS Project Prometheus Building Artificial General Engineers, founded by Jeff Bezos Building Specialized Intelligence, founded by academia at Ohio State University OTHER PORTFOLIO INVESTMENTS Building the API for human memory to endow humans with perfect, infinite memory. An early-stage AI company from our existing portfolio priced an oversubscribed financing round that values our initial seed investment at approximately 27 times cost. * * * * * * * * *

Second Quarter 2026 Earnings & Segment Results
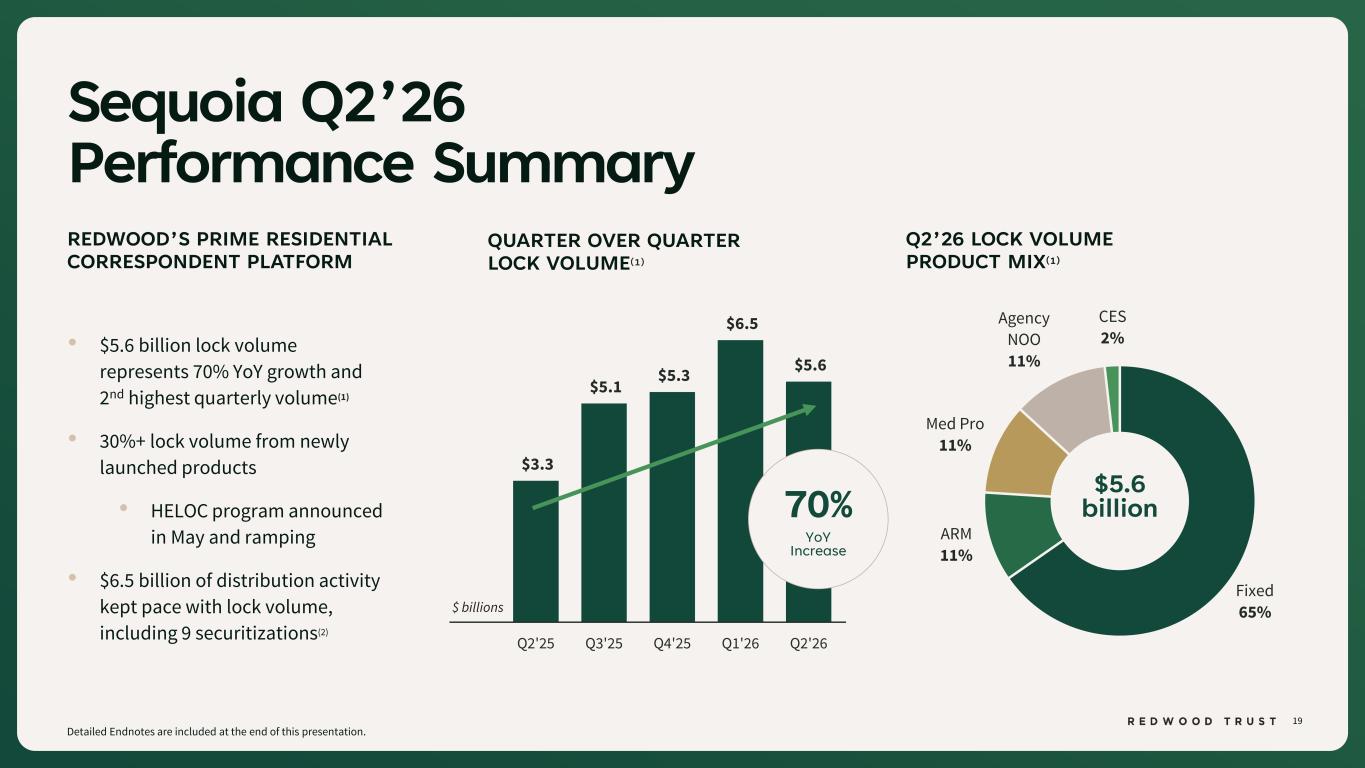
19 Fixed 65% ARM 11% Med Pro 11% Agency NOO 11% CES 2% $3.3 $5.1 $5.3 $6.5 $5.6 Q2'25 Q3'25 Q4'25 Q1'26 Q2'26 Sequoia Q2’26 Performance Summary Detailed Endnotes are included at the end of this presentation. • $5.6 billion lock volume represents 70% YoY growth and 2nd highest quarterly volume(1) • 30%+ lock volume from newly launched products • HELOC program announced in May and ramping • $6.5 billion of distribution activity kept pace with lock volume, including 9 securitizations(2) QUARTER OVER QUARTER LOCK VOLUME(1) REDWOOD’S PRIME RESIDENTIAL CORRESPONDENT PLATFORM Q2’26 LOCK VOLUME PRODUCT MIX(1) $ billions 70% YoY Increase $5.6 billion
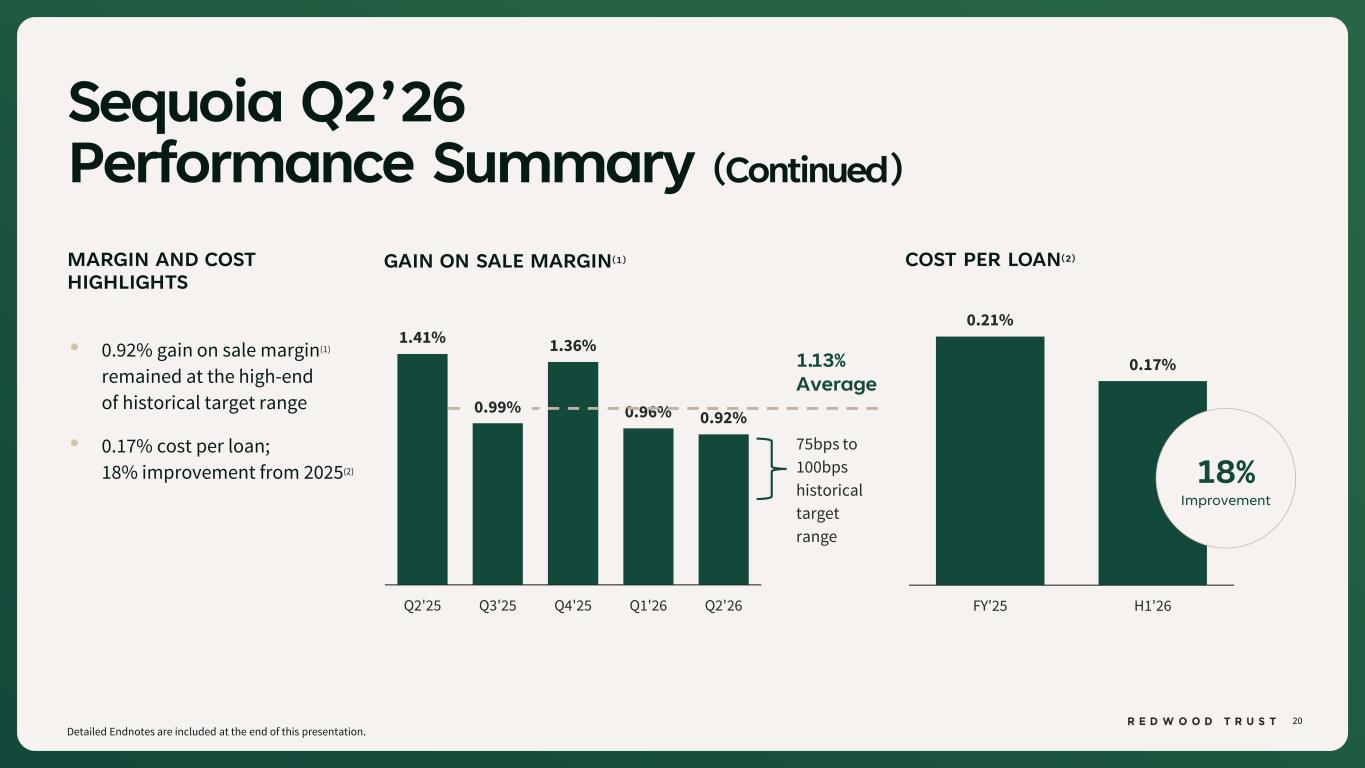
20 0.21% 0.17% FY'25 H1'26 1.41% 0.99% 1.36% 0.96% 0.92% Q2'25 Q3'25 Q4'25 Q1'26 Q2'26 Sequoia Q2’26 Performance Summary (Continued) Detailed Endnotes are included at the end of this presentation. • 0.92% gain on sale margin(1) remained at the high-end of historical target range • 0.17% cost per loan; 18% improvement from 2025(2) MARGIN AND COST HIGHLIGHTS 18% Improvement GAIN ON SALE MARGIN(1) COST PER LOAN(2) 1.13% Average 75bps to 100bps historical target range
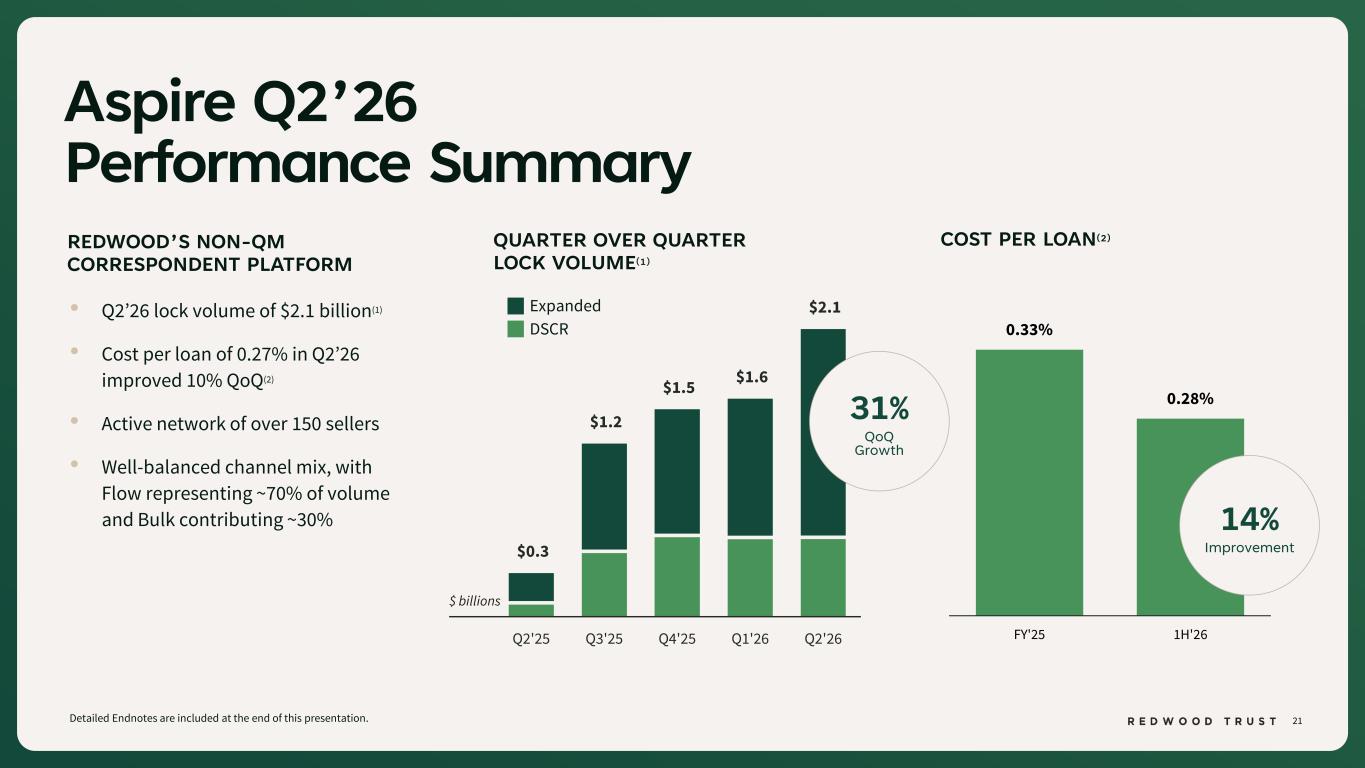
21 0.33% 0.28% FY'25 1H'26 $0.3 $1.2 $1.5 $1.6 $2.1 Q2'25 Q3'25 Q4'25 Q1'26 Q2'26 Aspire Q2’26 Performance Summary Detailed Endnotes are included at the end of this presentation. • Q2’26 lock volume of $2.1 billion(1) • Cost per loan of 0.27% in Q2’26 improved 10% QoQ(2) • Active network of over 150 sellers • Well-balanced channel mix, with Flow representing ~70% of volume and Bulk contributing ~30% REDWOOD’S NON-QM CORRESPONDENT PLATFORM Expanded DSCR 31% QoQ Growth QUARTER OVER QUARTER LOCK VOLUME(1) COST PER LOAN(2) 14% Improvement $ billions
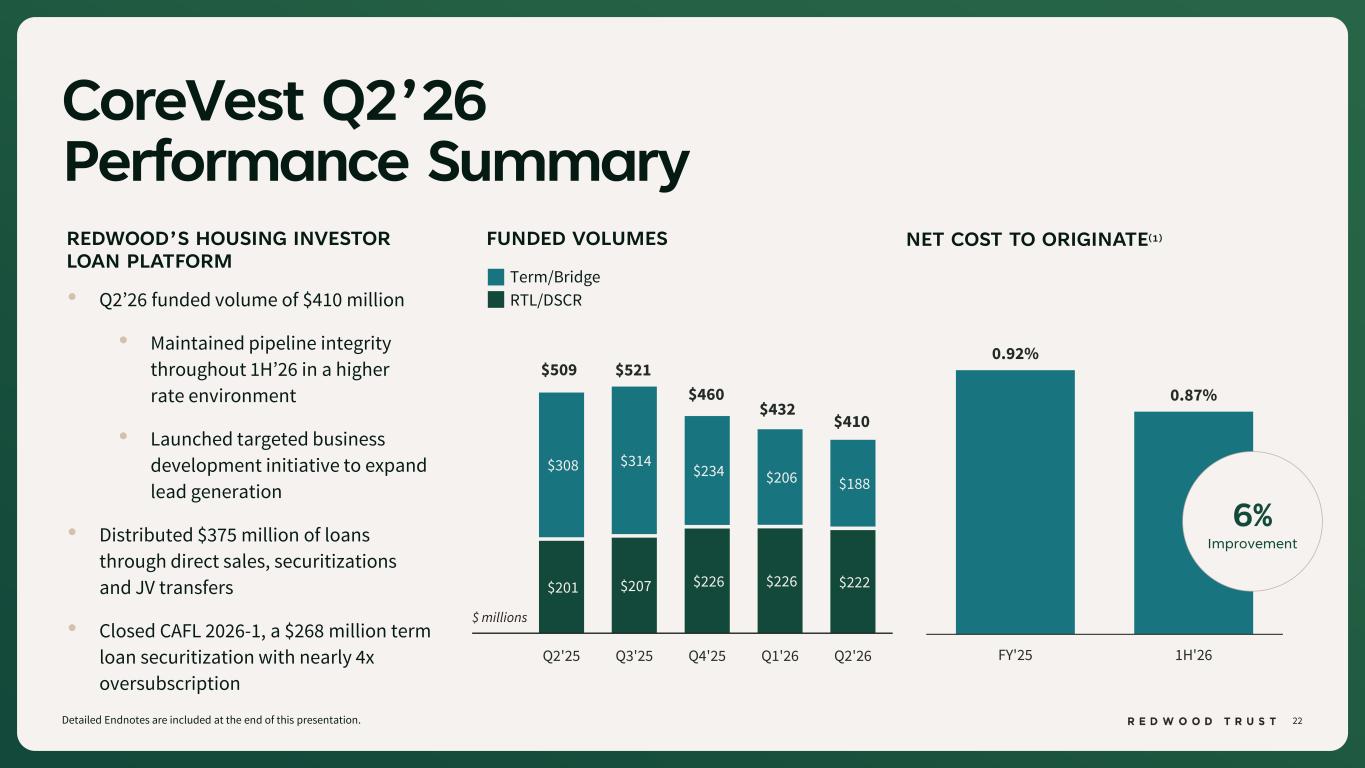
22 0.92% 0.87% FY'25 1H'26 $201 $207 $226 $226 $222 $308 $314 $234 $206 $188 Q2'25 Q3'25 Q4'25 Q1'26 Q2'26 CoreVest Q2’26 Performance Summary Detailed Endnotes are included at the end of this presentation. • Q2’26 funded volume of $410 million • Maintained pipeline integrity throughout 1H’26 in a higher rate environment • Launched targeted business development initiative to expand lead generation • Distributed $375 million of loans through direct sales, securitizations and JV transfers • Closed CAFL 2026-1, a $268 million term loan securitization with nearly 4x oversubscription REDWOOD’S HOUSING INVESTOR LOAN PLATFORM FUNDED VOLUMES NET COST TO ORIGINATE(1) $509 Term/Bridge RTL/DSCR $432 $410 $460 $521 6% Improvement $ millions
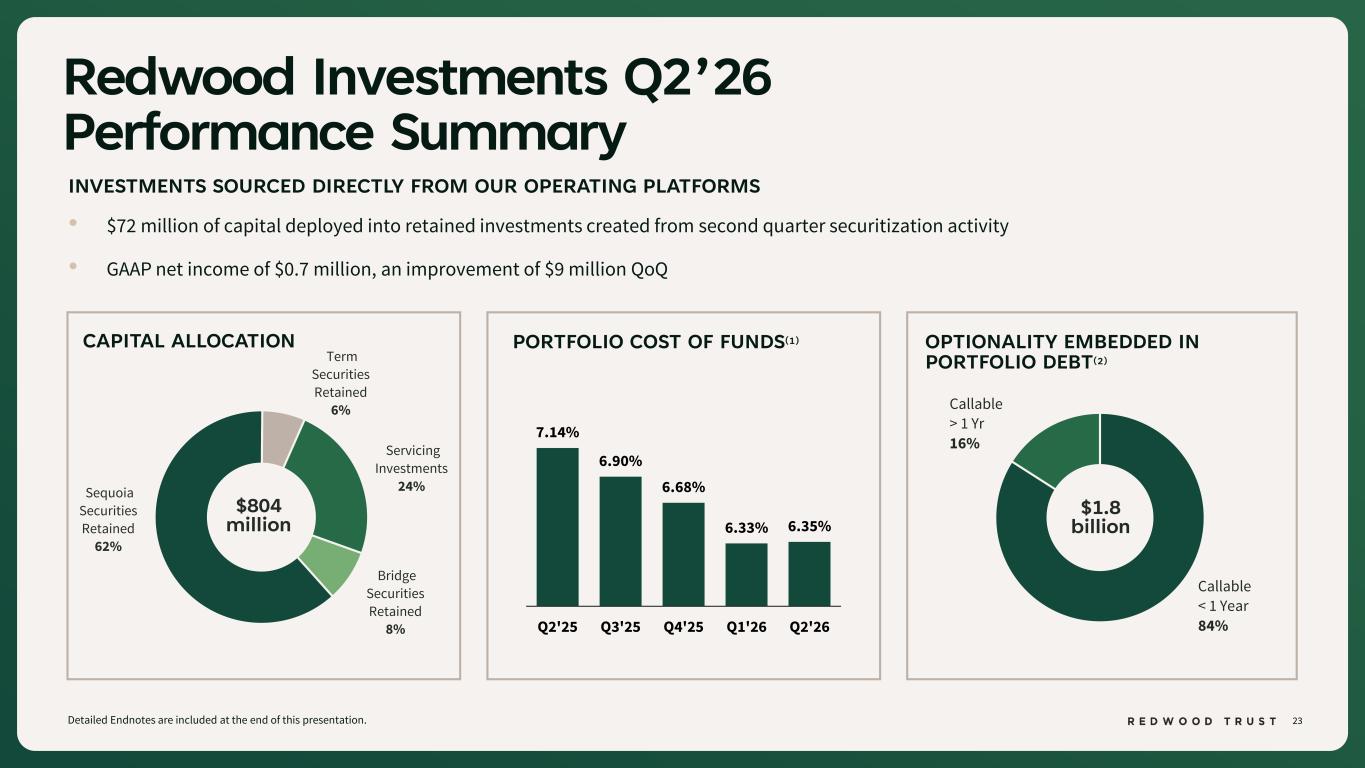
23 Servicing Investments 24% Bridge Securities Retained 8% Sequoia Securities Retained 62% Term Securities Retained 6% Callable < 1 Year 84% Callable > 1 Yr 16% 7.14% 6.90% 6.68% 6.33% 6.35% Q2'25 Q3'25 Q4'25 Q1'26 Q2'26 Redwood Investments Q2’26 Performance Summary INVESTMENTS SOURCED DIRECTLY FROM OUR OPERATING PLATFORMS • $72 million of capital deployed into retained investments created from second quarter securitization activity • GAAP net income of $0.7 million, an improvement of $9 million QoQ CAPITAL ALLOCATION Detailed Endnotes are included at the end of this presentation. $804 million OPTIONALITY EMBEDDED IN PORTFOLIO DEBT(2) PORTFOLIO COST OF FUNDS(1) $1.8 billion
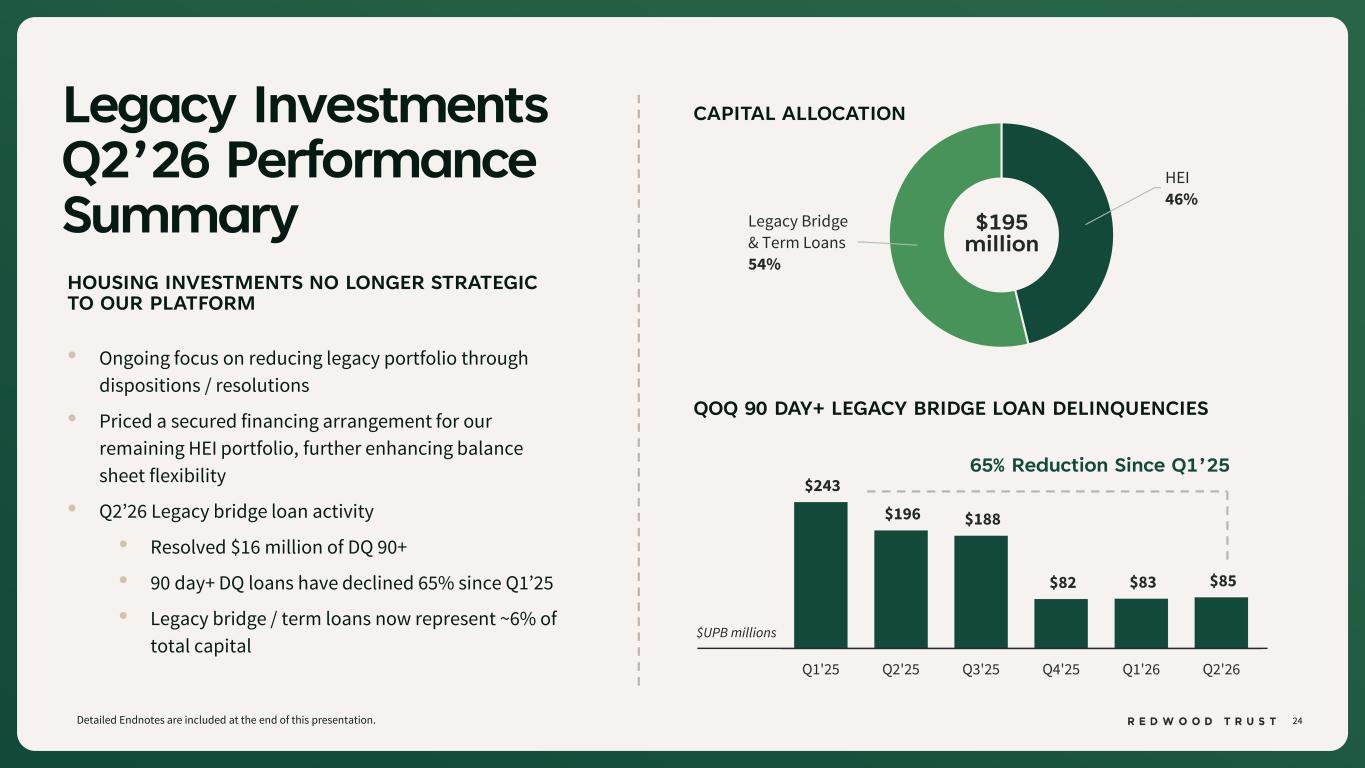
24 HEI 46% Legacy Bridge & Term Loans 54% $243 $196 $188 $82 $83 $85 Q1'25 Q2'25 Q3'25 Q4'25 Q1'26 Q2'26 Legacy Investments Q2’26 Performance Summary QOQ 90 DAY+ LEGACY BRIDGE LOAN DELINQUENCIES 65% Reduction Since Q1’25 CAPITAL ALLOCATION Detailed Endnotes are included at the end of this presentation. $195 million HOUSING INVESTMENTS NO LONGER STRATEGIC TO OUR PLATFORM • Ongoing focus on reducing legacy portfolio through dispositions / resolutions • Priced a secured financing arrangement for our remaining HEI portfolio, further enhancing balance sheet flexibility • Q2’26 Legacy bridge loan activity • Resolved $16 million of DQ 90+ • 90 day+ DQ loans have declined 65% since Q1’25 • Legacy bridge / term loans now represent ~6% of total capital $UPB millions

Financial Results
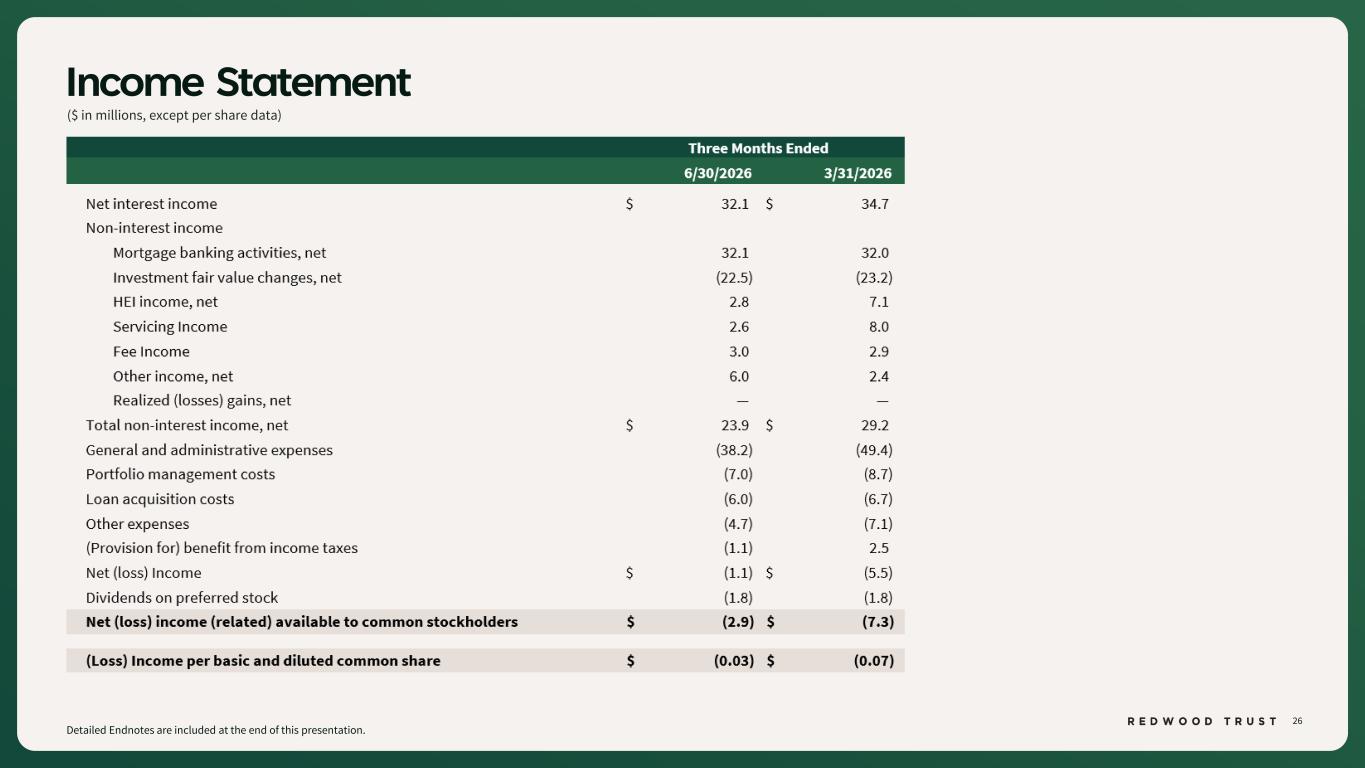
26 Income Statement ($ in millions, except per share data) Detailed Endnotes are included at the end of this presentation.
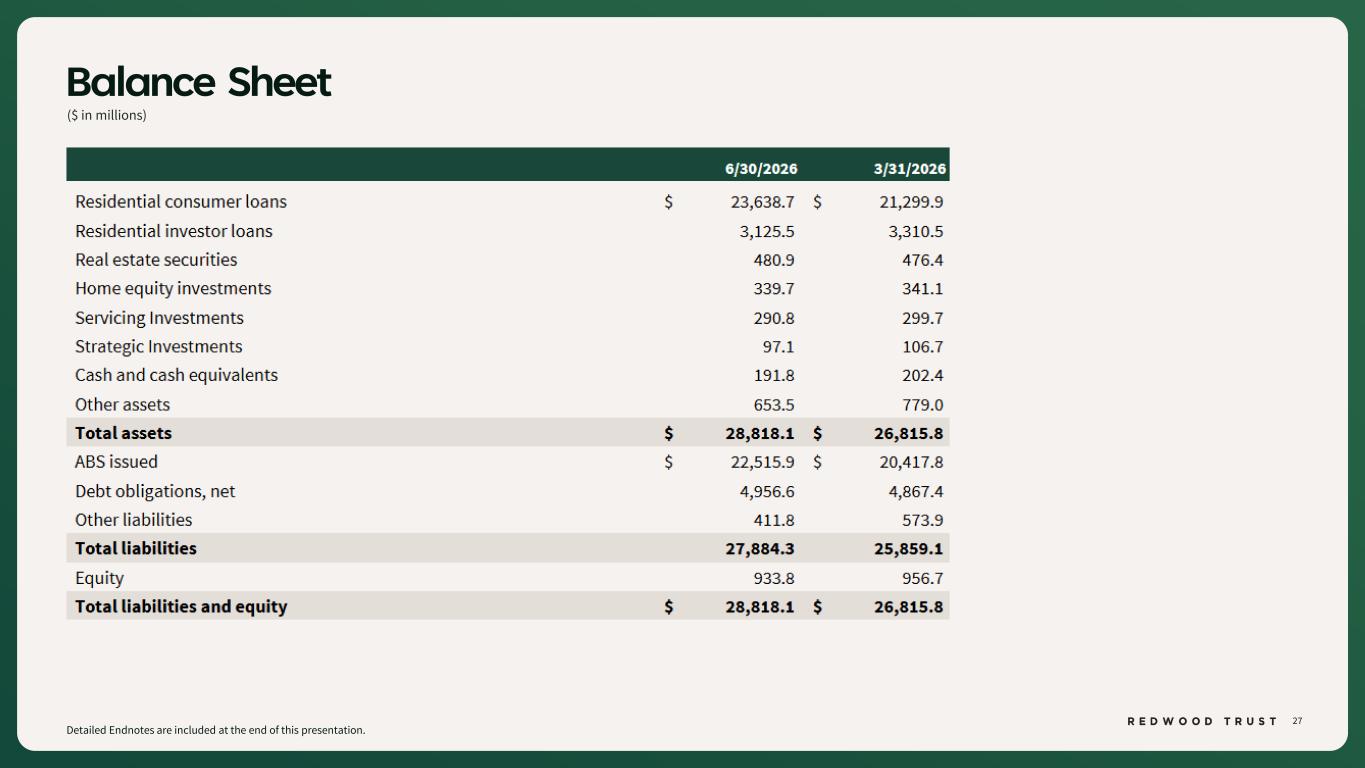
27 Balance Sheet ($ in millions) Detailed Endnotes are included at the end of this presentation.
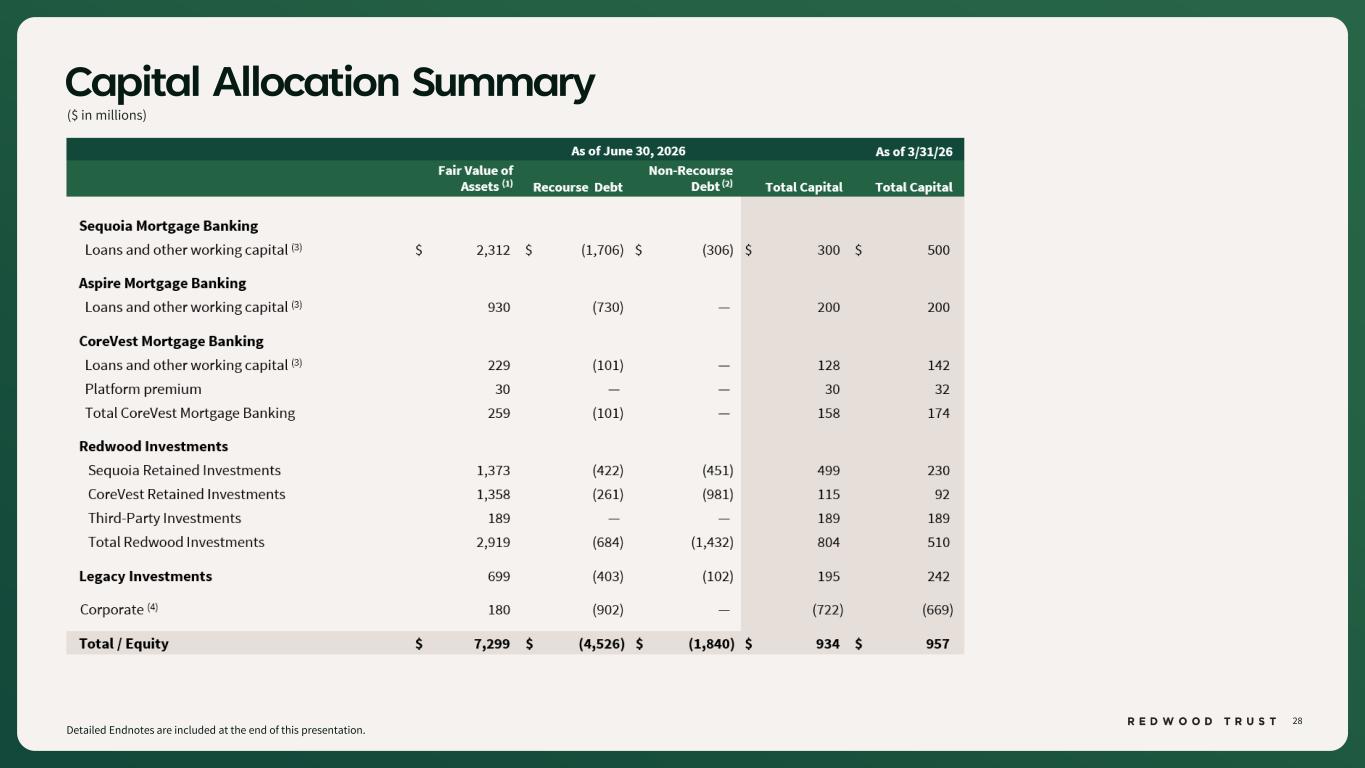
28 Capital Allocation Summary ($ in millions) Detailed Endnotes are included at the end of this presentation.
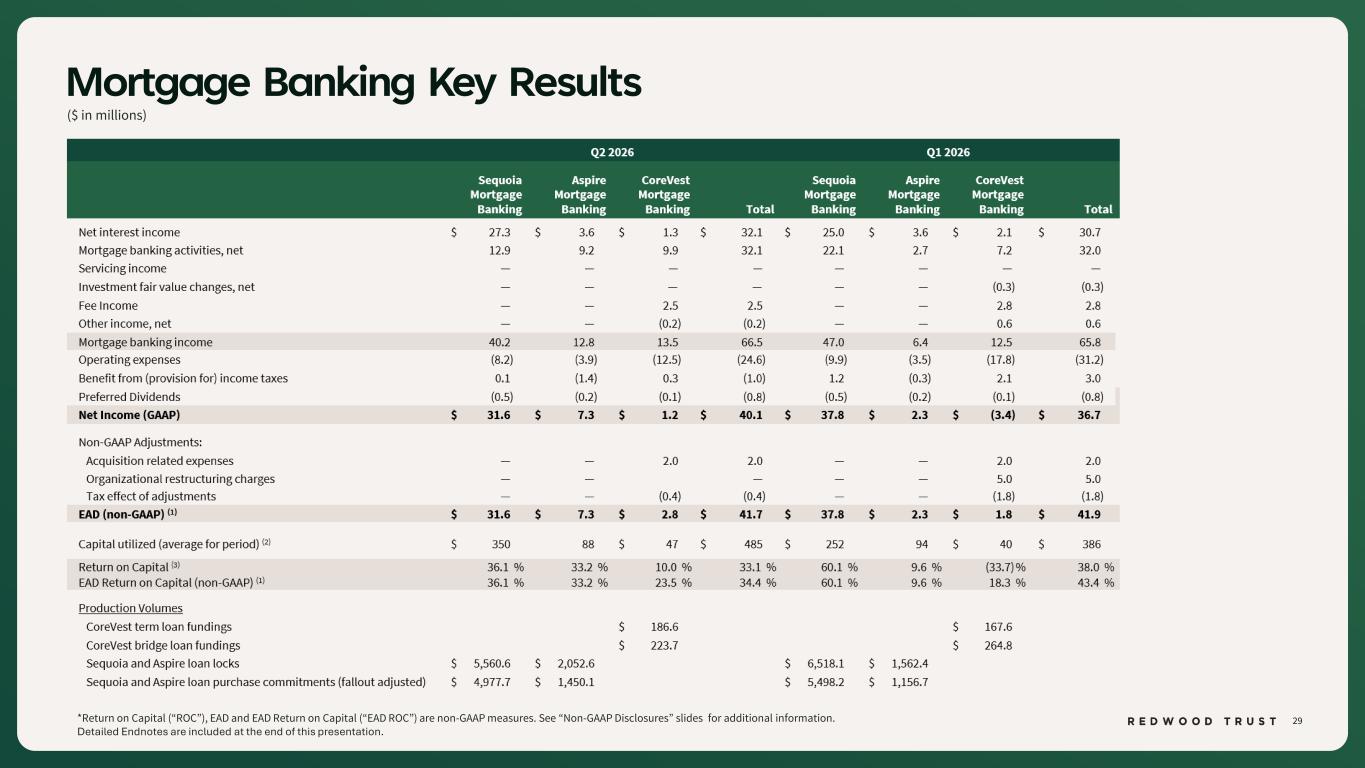
29 Mortgage Banking Key Results ($ in millions) *Return on Capital (“ROC”), EAD and EAD Return on Capital (“EAD ROC”) are non-GAAP measures. See “Non-GAAP Disclosures” slides for additional information. Detailed Endnotes are included at the end of this presentation.
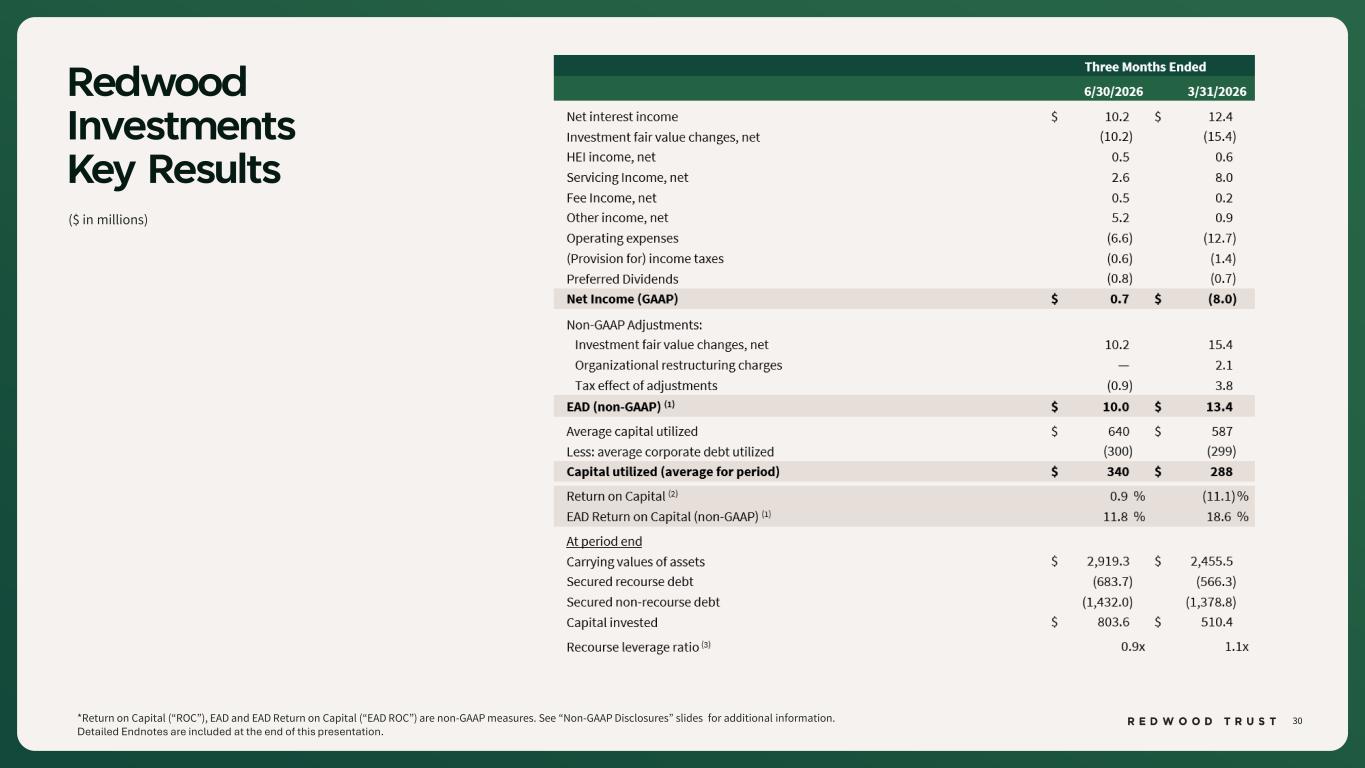
30 Redwood Investments Key Results ($ in millions) *Return on Capital (“ROC”), EAD and EAD Return on Capital (“EAD ROC”) are non-GAAP measures. See “Non-GAAP Disclosures” slides for additional information. Detailed Endnotes are included at the end of this presentation.
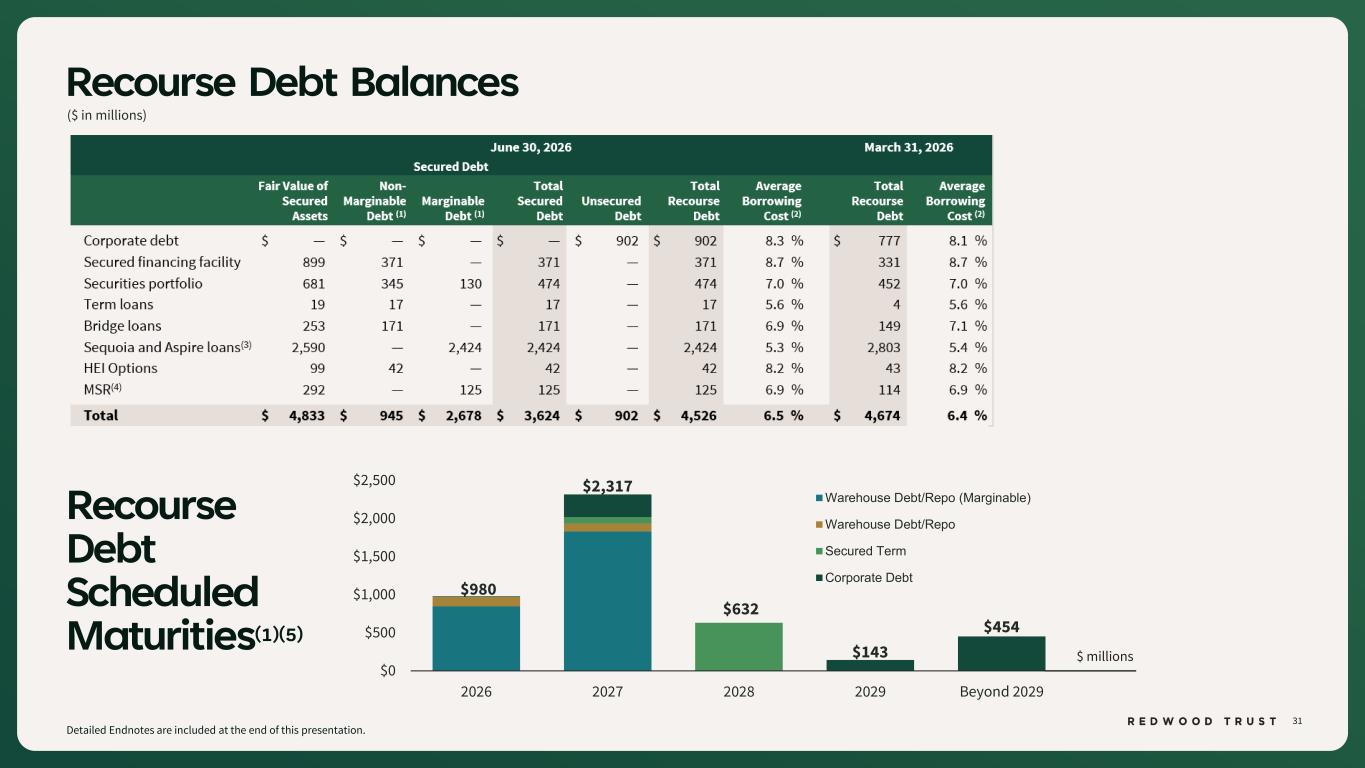
31 $980 $2,317 $632 $143 $454 $0 $500 $1,000 $1,500 $2,000 $2,500 2026 2027 2028 2029 Beyond 2029 Warehouse Debt/Repo (Marginable) Warehouse Debt/Repo Secured Term Corporate Debt Recourse Debt Scheduled Maturities(1)(5) Recourse Debt Balances ($ in millions) $ millions Detailed Endnotes are included at the end of this presentation.

Non-GAAP Disclosures
33 Non-GAAP Disclosures To supplement consolidated and segment financial information prepared and presented in accordance with U.S. generally accepted accounting principles ("GAAP"), the Company also provides Earnings Available for Distribution (“EAD”), EAD Return on Equity ("EAD ROE"), Core Segments Earnings Available for Distribution (“Core Segments EAD”) and Core Segments EAD Return on Equity ("Core Segments EAD ROE") as non-GAAP measures. Management believes these non-GAAP measures provide useful supplemental information to investors and management in evaluating the Company’s operating performance, facilitating comparisons to industry peers, and assessing the current income-generating capacity of the Company’s operating platforms as of the period presented, including the Company’s ability to pay dividends. These measures also assist in evaluating the Company’s ongoing transition to a more scalable and simplified business model, including the wind-down of legacy portfolio holdings within the Legacy Investments segment. These non-GAAP measures should not be utilized in isolation, nor should they be considered as an alternative to GAAP net income (loss) available (related) to common stockholders, or other measurements of results of operations computed in accordance with GAAP or for federal income tax purposes. Earnings Available for Distribution (“EAD”) and EAD ROE are non-GAAP financial measures that the Company has historically reported and continues to use to present management’s non-GAAP analysis of the operating performance of the Company’s different business segments. EAD is defined, as GAAP net income (loss) available (related) to common stockholders, adjusted to (i) exclude investment fair value changes, net; (ii) exclude realized gains and losses; (iii) exclude acquisition-related expenses; (iv) exclude certain organizational restructuring charges, as applicable; and (v) reflect a hypothetical income tax adjustment associated with these items. EAD ROE is defined as EAD divided by average common equity. ROC is a non-GAAP measure for a segment that is calculated as GAAP segment net income (loss) annualized divided by average capital utilized for the segment during the period. Average capital utilized represents management's internal estimate of the average economic capital allocated to support the activities of each segment. Beginning in the first quarter of 2026, we revised our segment reporting to (i) present Aspire Mortgage Banking as a new reportable segment separate from our Sequoia Mortgage Banking segment and (ii) allocate corporate financing costs and debt to our Mortgage Banking platforms (consisting of Sequoia, Aspire and CoreVest Mortgage Banking) and our Redwood Investments and Legacy Investments segments. This change had no impact on the consolidated financial statements and all prior period amounts were conformed to the current presentation. ROC for the combined Mortgage Banking platforms is a non-GAAP measure calculated as annualized net income for the Company’s combined Mortgage Banking platforms, divided by the average capital utilized by the combined Mortgage Banking platforms for the period. Average capital utilized represents management’s internal estimate of the average capital deployed to support the activities of these platforms and was $485 million for Q2 2026 and $386 million for Q1 2026. EAD ROC for a segment is calculated as non-GAAP segment EAD annualized divided by average capital utilized for the segment during the period. Average capital utilized represents management's internal estimate of the average economic capital allocated to support the activities of each segment, and for Q2’26 and Q1’26 were the following, respectively – Sequoia Mortgage Banking: $350 million and $252 million; Aspire Mortgage Banking: $88 million and $94 million; CoreVest Mortgage Banking: $47 million and $40 million; and Redwood Investments: $340 million and $288 million. Core Segments EAD and Core Segments EAD ROE represent management’s non-GAAP assessment of the combined performance of the Company’s mortgage banking platforms and related investments, which include the Sequoia Mortgage Banking, Aspire Mortgage Banking, CoreVest Mortgage Banking, and Redwood Investments segments (collectively, the “Core Segments”), together with an allocated portion of the Corporate segment attributable to those operations. Core Segments EAD excludes the Legacy Investments segment and the portion of the Corporate segment attributable to Legacy Investments. Core Segments EAD ROE is calculated as Core Segments EAD divided by the average capital utilized by the Core Segments during the period, which represents management’s internal estimate of the average economic capital allocated to support the Core Segments’ activities.
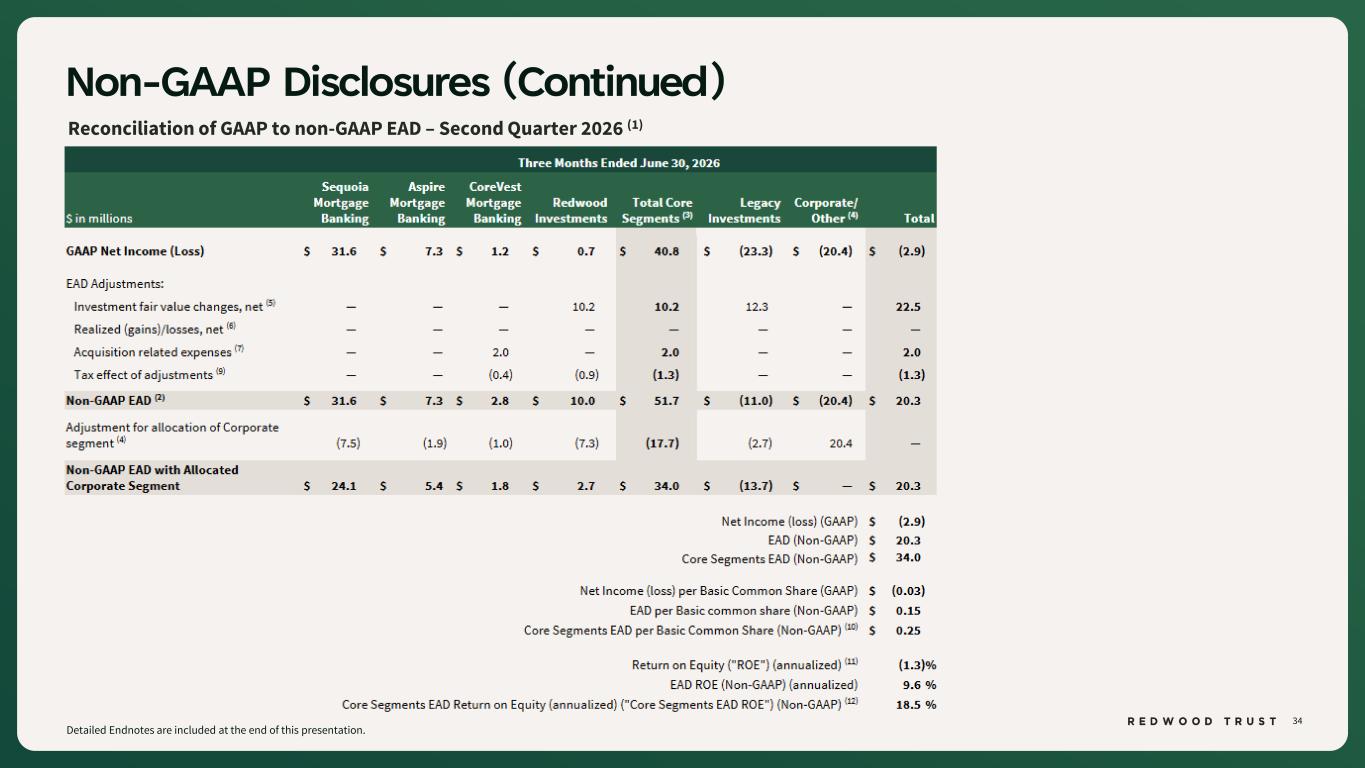
34 Non-GAAP Disclosures (Continued) Reconciliation of GAAP to non-GAAP EAD – Second Quarter 2026 (1) Detailed Endnotes are included at the end of this presentation.
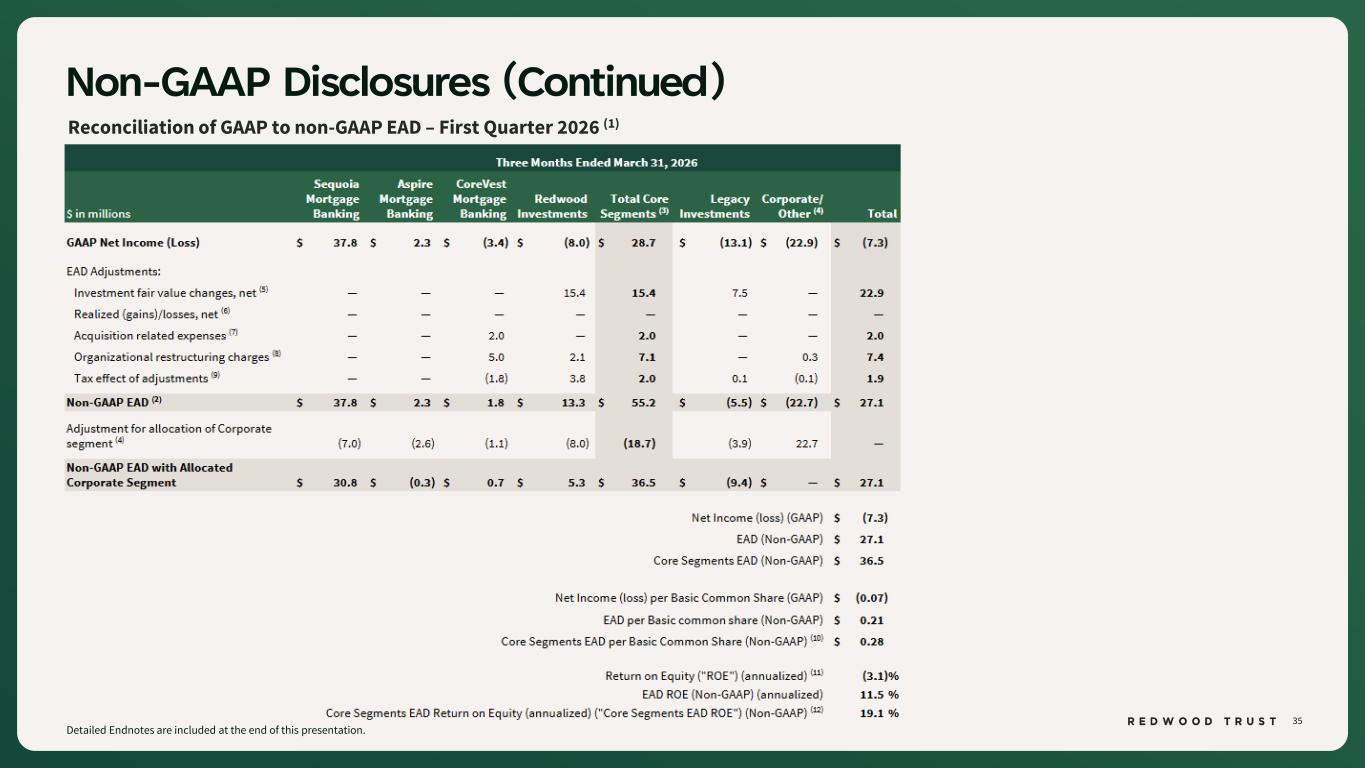
35 Non-GAAP Disclosures (Continued) Reconciliation of GAAP to non-GAAP EAD – First Quarter 2026 (1) Detailed Endnotes are included at the end of this presentation.
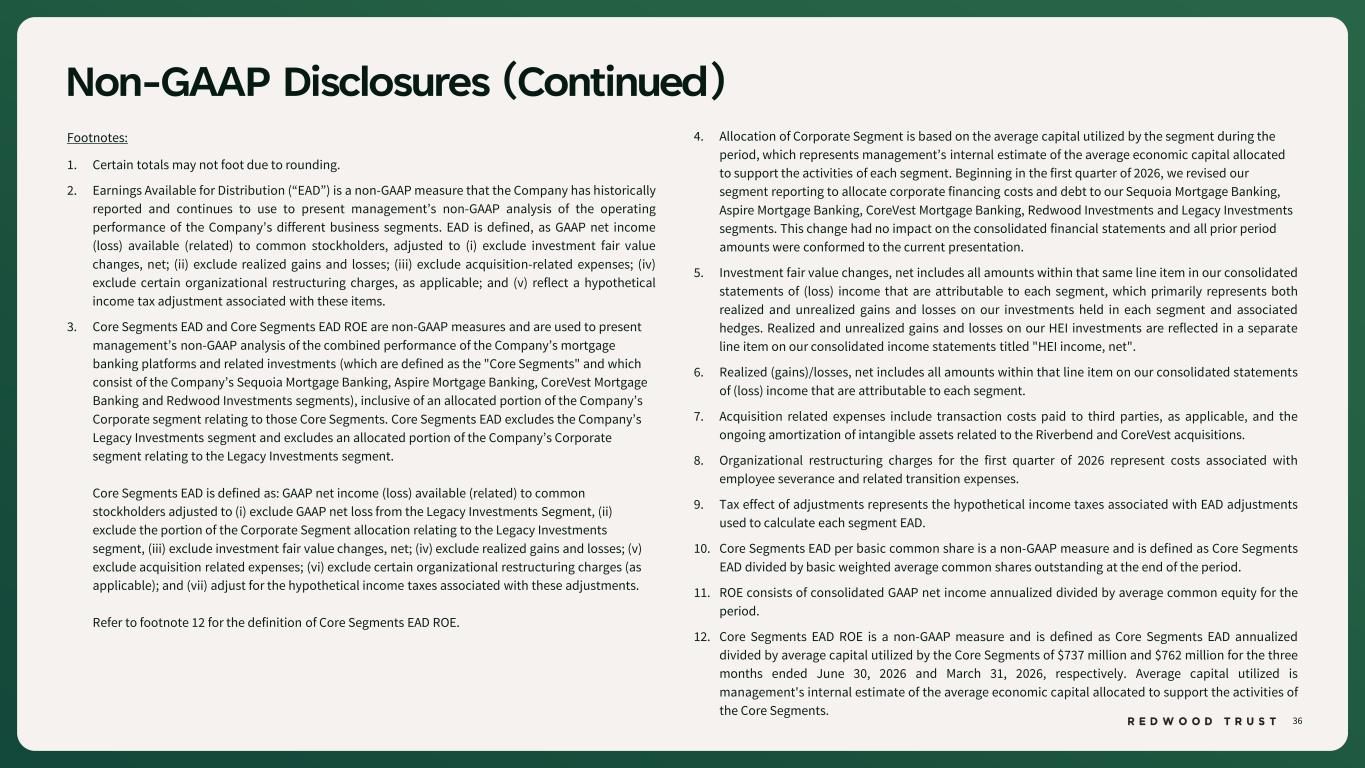
36 $ in millions Non-GAAP Disclosures (Continued) Footnotes: 1. Certain totals may not foot due to rounding. 2. Earnings Available for Distribution (“EAD”) is a non-GAAP measure that the Company has historically reported and continues to use to present management’s non-GAAP analysis of the operating performance of the Company’s different business segments. EAD is defined, as GAAP net income (loss) available (related) to common stockholders, adjusted to (i) exclude investment fair value changes, net; (ii) exclude realized gains and losses; (iii) exclude acquisition-related expenses; (iv) exclude certain organizational restructuring charges, as applicable; and (v) reflect a hypothetical income tax adjustment associated with these items. 3. Core Segments EAD and Core Segments EAD ROE are non-GAAP measures and are used to present management’s non-GAAP analysis of the combined performance of the Company’s mortgage banking platforms and related investments (which are defined as the "Core Segments" and which consist of the Company’s Sequoia Mortgage Banking, Aspire Mortgage Banking, CoreVest Mortgage Banking and Redwood Investments segments), inclusive of an allocated portion of the Company’s Corporate segment relating to those Core Segments. Core Segments EAD excludes the Company’s Legacy Investments segment and excludes an allocated portion of the Company’s Corporate segment relating to the Legacy Investments segment. Core Segments EAD is defined as: GAAP net income (loss) available (related) to common stockholders adjusted to (i) exclude GAAP net loss from the Legacy Investments Segment, (ii) exclude the portion of the Corporate Segment allocation relating to the Legacy Investments segment, (iii) exclude investment fair value changes, net; (iv) exclude realized gains and losses; (v) exclude acquisition related expenses; (vi) exclude certain organizational restructuring charges (as applicable); and (vii) adjust for the hypothetical income taxes associated with these adjustments. Refer to footnote 12 for the definition of Core Segments EAD ROE. 4. Allocation of Corporate Segment is based on the average capital utilized by the segment during the period, which represents management’s internal estimate of the average economic capital allocated to support the activities of each segment. Beginning in the first quarter of 2026, we revised our segment reporting to allocate corporate financing costs and debt to our Sequoia Mortgage Banking, Aspire Mortgage Banking, CoreVest Mortgage Banking, Redwood Investments and Legacy Investments segments. This change had no impact on the consolidated financial statements and all prior period amounts were conformed to the current presentation. 5. Investment fair value changes, net includes all amounts within that same line item in our consolidated statements of (loss) income that are attributable to each segment, which primarily represents both realized and unrealized gains and losses on our investments held in each segment and associated hedges. Realized and unrealized gains and losses on our HEI investments are reflected in a separate line item on our consolidated income statements titled "HEI income, net". 6. Realized (gains)/losses, net includes all amounts within that line item on our consolidated statements of (loss) income that are attributable to each segment. 7. Acquisition related expenses include transaction costs paid to third parties, as applicable, and the ongoing amortization of intangible assets related to the Riverbend and CoreVest acquisitions. 8. Organizational restructuring charges for the first quarter of 2026 represent costs associated with employee severance and related transition expenses. 9. Tax effect of adjustments represents the hypothetical income taxes associated with EAD adjustments used to calculate each segment EAD. 10. Core Segments EAD per basic common share is a non-GAAP measure and is defined as Core Segments EAD divided by basic weighted average common shares outstanding at the end of the period. 11. ROE consists of consolidated GAAP net income annualized divided by average common equity for the period. 12. Core Segments EAD ROE is a non-GAAP measure and is defined as Core Segments EAD annualized divided by average capital utilized by the Core Segments of $737 million and $762 million for the three months ended June 30, 2026 and March 31, 2026, respectively. Average capital utilized is management's internal estimate of the average economic capital allocated to support the activities of the Core Segments.

Endnotes
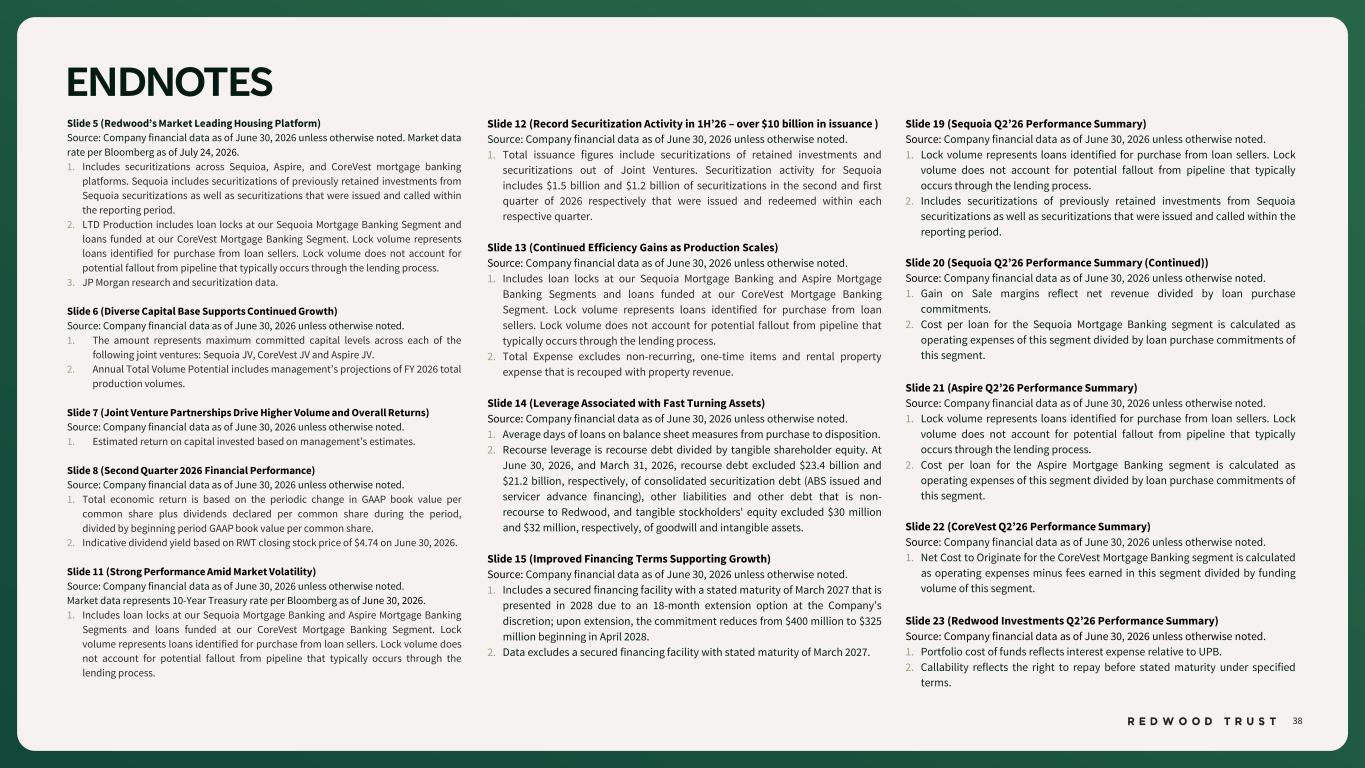
38 ENDNOTES Slide 5 (Redwood’s Market Leading Housing Platform) Source: Company financial data as of June 30, 2026 unless otherwise noted. Market data rate per Bloomberg as of July 24, 2026. 1. Includes securitizations across Sequioa, Aspire, and CoreVest mortgage banking platforms. Sequoia includes securitizations of previously retained investments from Sequoia securitizations as well as securitizations that were issued and called within the reporting period. 2. LTD Production includes loan locks at our Sequoia Mortgage Banking Segment and loans funded at our CoreVest Mortgage Banking Segment. Lock volume represents loans identified for purchase from loan sellers. Lock volume does not account for potential fallout from pipeline that typically occurs through the lending process. 3. JP Morgan research and securitization data. Slide 6 (Diverse Capital Base Supports Continued Growth) Source: Company financial data as of June 30, 2026 unless otherwise noted. 1. The amount represents maximum committed capital levels across each of the following joint ventures: Sequoia JV, CoreVest JV and Aspire JV. 2. Annual Total Volume Potential includes management’s projections of FY 2026 total production volumes. Slide 7 (Joint Venture Partnerships Drive Higher Volume and Overall Returns) Source: Company financial data as of June 30, 2026 unless otherwise noted. 1. Estimated return on capital invested based on management’s estimates. Slide 8 (Second Quarter 2026 Financial Performance) Source: Company financial data as of June 30, 2026 unless otherwise noted. 1. Total economic return is based on the periodic change in GAAP book value per common share plus dividends declared per common share during the period, divided by beginning period GAAP book value per common share. 2. Indicative dividend yield based on RWT closing stock price of $4.74 on June 30, 2026. Slide 11 (Strong Performance Amid Market Volatility) Source: Company financial data as of June 30, 2026 unless otherwise noted. Market data represents 10-Year Treasury rate per Bloomberg as of June 30, 2026. 1. Includes loan locks at our Sequoia Mortgage Banking and Aspire Mortgage Banking Segments and loans funded at our CoreVest Mortgage Banking Segment. Lock volume represents loans identified for purchase from loan sellers. Lock volume does not account for potential fallout from pipeline that typically occurs through the lending process. Slide 12 (Record Securitization Activity in 1H’26 – over $10 billion in issuance ) Source: Company financial data as of June 30, 2026 unless otherwise noted. 1. Total issuance figures include securitizations of retained investments and securitizations out of Joint Ventures. Securitization activity for Sequoia includes $1.5 billion and $1.2 billion of securitizations in the second and first quarter of 2026 respectively that were issued and redeemed within each respective quarter. Slide 13 (Continued Efficiency Gains as Production Scales) Source: Company financial data as of June 30, 2026 unless otherwise noted. 1. Includes loan locks at our Sequoia Mortgage Banking and Aspire Mortgage Banking Segments and loans funded at our CoreVest Mortgage Banking Segment. Lock volume represents loans identified for purchase from loan sellers. Lock volume does not account for potential fallout from pipeline that typically occurs through the lending process. 2. Total Expense excludes non-recurring, one-time items and rental property expense that is recouped with property revenue. Slide 14 (Leverage Associated with Fast Turning Assets) Source: Company financial data as of June 30, 2026 unless otherwise noted. 1. Average days of loans on balance sheet measures from purchase to disposition. 2. Recourse leverage is recourse debt divided by tangible shareholder equity. At June 30, 2026, and March 31, 2026, recourse debt excluded $23.4 billion and $21.2 billion, respectively, of consolidated securitization debt (ABS issued and servicer advance financing), other liabilities and other debt that is non- recourse to Redwood, and tangible stockholders' equity excluded $30 million and $32 million, respectively, of goodwill and intangible assets. Slide 15 (Improved Financing Terms Supporting Growth) Source: Company financial data as of June 30, 2026 unless otherwise noted. 1. Includes a secured financing facility with a stated maturity of March 2027 that is presented in 2028 due to an 18-month extension option at the Company’s discretion; upon extension, the commitment reduces from $400 million to $325 million beginning in April 2028. 2. Data excludes a secured financing facility with stated maturity of March 2027. Slide 19 (Sequoia Q2’26 Performance Summary) Source: Company financial data as of June 30, 2026 unless otherwise noted. 1. Lock volume represents loans identified for purchase from loan sellers. Lock volume does not account for potential fallout from pipeline that typically occurs through the lending process. 2. Includes securitizations of previously retained investments from Sequoia securitizations as well as securitizations that were issued and called within the reporting period. Slide 20 (Sequoia Q2’26 Performance Summary (Continued)) Source: Company financial data as of June 30, 2026 unless otherwise noted. 1. Gain on Sale margins reflect net revenue divided by loan purchase commitments. 2. Cost per loan for the Sequoia Mortgage Banking segment is calculated as operating expenses of this segment divided by loan purchase commitments of this segment. Slide 21 (Aspire Q2’26 Performance Summary) Source: Company financial data as of June 30, 2026 unless otherwise noted. 1. Lock volume represents loans identified for purchase from loan sellers. Lock volume does not account for potential fallout from pipeline that typically occurs through the lending process. 2. Cost per loan for the Aspire Mortgage Banking segment is calculated as operating expenses of this segment divided by loan purchase commitments of this segment. Slide 22 (CoreVest Q2’26 Performance Summary) Source: Company financial data as of June 30, 2026 unless otherwise noted. 1. Net Cost to Originate for the CoreVest Mortgage Banking segment is calculated as operating expenses minus fees earned in this segment divided by funding volume of this segment. Slide 23 (Redwood Investments Q2’26 Performance Summary) Source: Company financial data as of June 30, 2026 unless otherwise noted. 1. Portfolio cost of funds reflects interest expense relative to UPB. 2. Callability reflects the right to repay before stated maturity under specified terms.
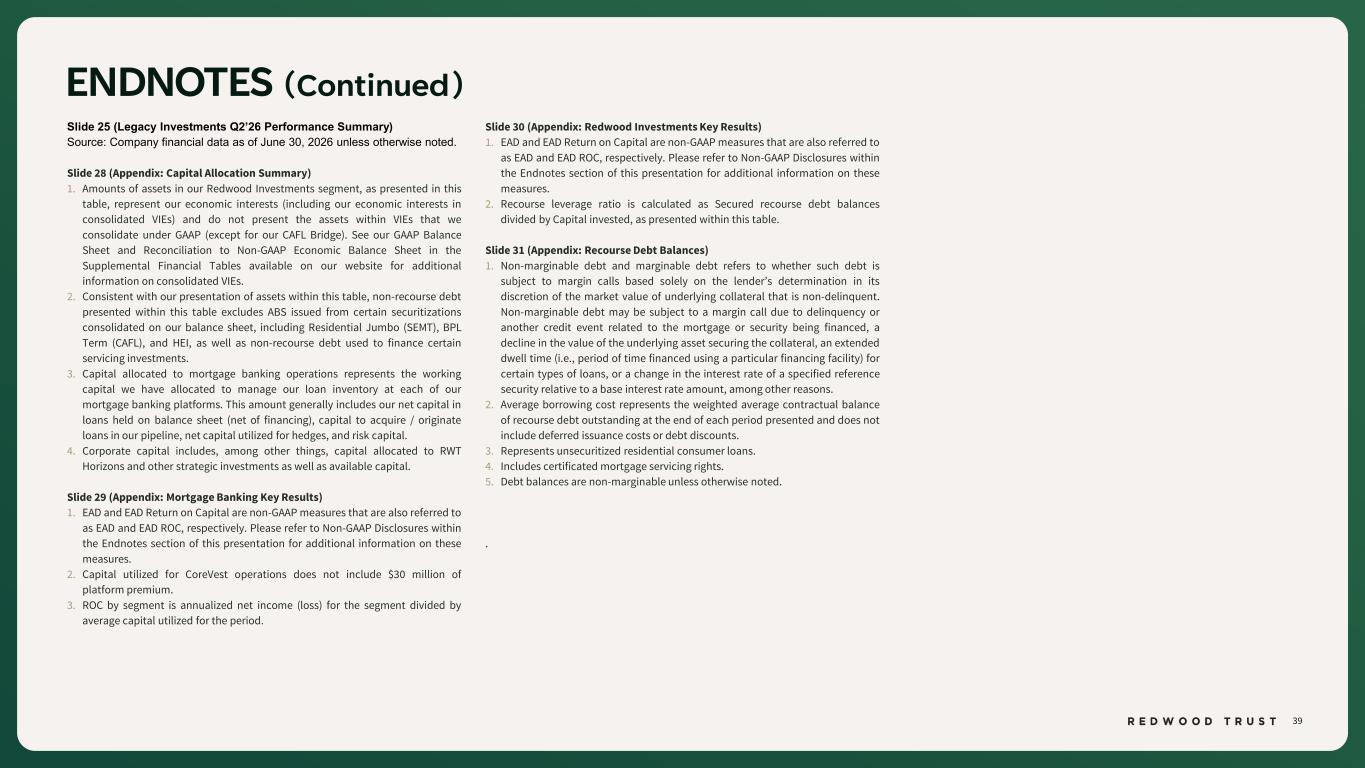
39 ENDNOTES (Continued) Slide 25 (Legacy Investments Q2’26 Performance Summary) Source: Company financial data as of June 30, 2026 unless otherwise noted. Slide 28 (Appendix: Capital Allocation Summary) 1. Amounts of assets in our Redwood Investments segment, as presented in this table, represent our economic interests (including our economic interests in consolidated VIEs) and do not present the assets within VIEs that we consolidate under GAAP (except for our CAFL Bridge). See our GAAP Balance Sheet and Reconciliation to Non-GAAP Economic Balance Sheet in the Supplemental Financial Tables available on our website for additional information on consolidated VIEs. 2. Consistent with our presentation of assets within this table, non-recourse debt presented within this table excludes ABS issued from certain securitizations consolidated on our balance sheet, including Residential Jumbo (SEMT), BPL Term (CAFL), and HEI, as well as non-recourse debt used to finance certain servicing investments. 3. Capital allocated to mortgage banking operations represents the working capital we have allocated to manage our loan inventory at each of our mortgage banking platforms. This amount generally includes our net capital in loans held on balance sheet (net of financing), capital to acquire / originate loans in our pipeline, net capital utilized for hedges, and risk capital. 4. Corporate capital includes, among other things, capital allocated to RWT Horizons and other strategic investments as well as available capital. Slide 29 (Appendix: Mortgage Banking Key Results) 1. EAD and EAD Return on Capital are non-GAAP measures that are also referred to as EAD and EAD ROC, respectively. Please refer to Non-GAAP Disclosures within the Endnotes section of this presentation for additional information on these measures. 2. Capital utilized for CoreVest operations does not include $30 million of platform premium. 3. ROC by segment is annualized net income (loss) for the segment divided by average capital utilized for the period. Slide 30 (Appendix: Redwood Investments Key Results) 1. EAD and EAD Return on Capital are non-GAAP measures that are also referred to as EAD and EAD ROC, respectively. Please refer to Non-GAAP Disclosures within the Endnotes section of this presentation for additional information on these measures. 2. Recourse leverage ratio is calculated as Secured recourse debt balances divided by Capital invested, as presented within this table. Slide 31 (Appendix: Recourse Debt Balances) 1. Non-marginable debt and marginable debt refers to whether such debt is subject to margin calls based solely on the lender’s determination in its discretion of the market value of underlying collateral that is non-delinquent. Non-marginable debt may be subject to a margin call due to delinquency or another credit event related to the mortgage or security being financed, a decline in the value of the underlying asset securing the collateral, an extended dwell time (i.e., period of time financed using a particular financing facility) for certain types of loans, or a change in the interest rate of a specified reference security relative to a base interest rate amount, among other reasons. 2. Average borrowing cost represents the weighted average contractual balance of recourse debt outstanding at the end of each period presented and does not include deferred issuance costs or debt discounts. 3. Represents unsecuritized residential consumer loans. 4. Includes certificated mortgage servicing rights. 5. Debt balances are non-marginable unless otherwise noted. .
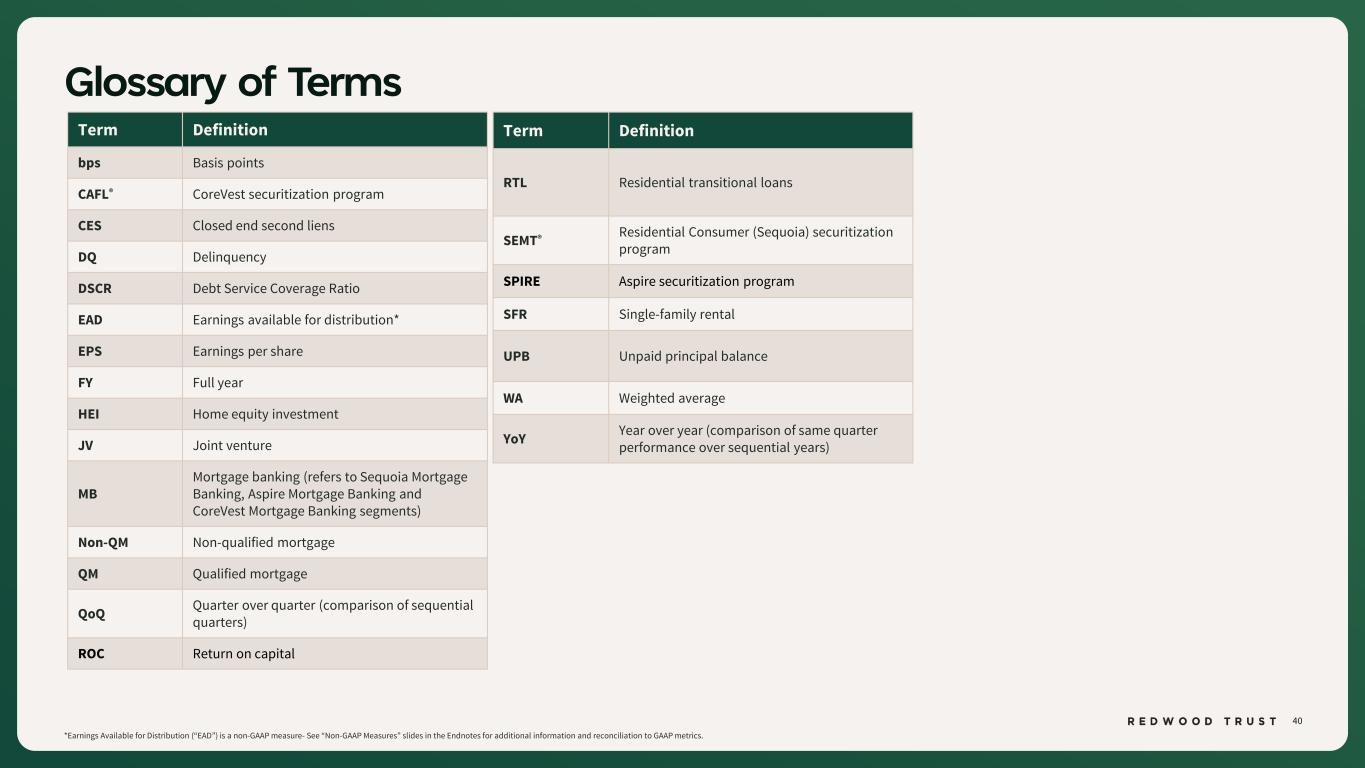
40 Glossary of Terms Term Definition bps Basis points CAFL® CoreVest securitization program CES Closed end second liens DQ Delinquency DSCR Debt Service Coverage Ratio EAD Earnings available for distribution* EPS Earnings per share FY Full year HEI Home equity investment JV Joint venture MB Mortgage banking (refers to Sequoia Mortgage Banking, Aspire Mortgage Banking and CoreVest Mortgage Banking segments) Non-QM Non-qualified mortgage QM Qualified mortgage QoQ Quarter over quarter (comparison of sequential quarters) ROC Return on capital Term Definition RTL Residential transitional loans SEMT® Residential Consumer (Sequoia) securitization program SPIRE Aspire securitization program SFR Single-family rental UPB Unpaid principal balance WA Weighted average YoY Year over year (comparison of same quarter performance over sequential years) *Earnings Available for Distribution (“EAD”) is a non-GAAP measure- See “Non-GAAP Measures” slides in the Endnotes for additional information and reconciliation to GAAP metrics.